1. Introduction
In the past decades, some research on plasma wake field acceleration driven by a laser pulse (LWFA) (Tajima & Dawson Reference Tajima and Dawson1979) or a relativistic particle beam (PWFA) (Chen et al. Reference Chen, Dawson, Huff and Katsouleas1985) is very active and has achieved much remarkable progress (Leemans et al. Reference Leemans, Nagler, Gonsalves, Tóth, Nakamura, Geddes, Esarey, Schroeder and Hooker2006; Blumenfeld et al. Reference Blumenfeld, Clayton, Decker, Hogan, Huang, Ischebeck, Iverson, Joshi, Katsouleas and Kirby2007; Wang et al. Reference Wang, Zgadzaj, Fazel, Li, Yi, Zhang, Henderson, Chang, Korzekwa and Tsai2013; Gonsalves et al. Reference Gonsalves, Nakamura, Daniels, Benedetti, Pieronek, de Raadt, Steinke, Bin, Bulanov and van Tilborg2019). Based on the large accelerating gradients ( ${\sim }100\ \textrm {GV}\ \textrm {m}^{-1}$) which are several orders of magnitude larger than the traditional radio-frequency accelerator can achieve (
 ${<}100\ \textrm {MV}\ \textrm {m}^{-1}$), the plasma wake field acceleration shows considerable promise for tabletop electron and ion accelerators. To realize continuous acceleration, electrons should be trapped by the accelerating field firstly and then move within the wake field accelerating phase. Comparing these two common schemes, LWFA and PWFA, the best advantage of PWFA is that the electrons can be accelerated continuously without obvious phase shifting once trapped. Usually, the trapped electrons can be accelerated to ultrahigh energy in PWFA (Blumenfeld et al. Reference Blumenfeld, Clayton, Decker, Hogan, Huang, Ischebeck, Iverson, Joshi, Katsouleas and Kirby2007) until the collapse of the bubble. However, one difficult thing in PWFA is to load the electrons on the plasma wake field due to the high wake field phase velocity. According to the wake potential theory (Mora Reference Mora and Antonsen1997; Lu et al. Reference Lu, Huang, Zhou, Tzoufras, Tsung, Mori and Katsouleas2006; Xu et al. Reference Xu, Li, An, Dalichaouch, Yu, Lu, Joshi and Mori2017), the longitudinal velocity of the trapped electrons can be approximately described as
 $\beta _{z}=1-(({2(1+\varPsi )^{2}})/({1+(p_{\perp })^{2}+(1+\varPsi )^{2}}))$, where
 $\varPsi \equiv {e}/{mc^{2}}(\varPhi -A_{z})$ is the wake potential,
 $\varPhi$ and
 $A_{z}$ are the scalar potential and the axial component of the vector potential, respectively. For
 $p_{\perp }$ finite,
 $\varPsi$ must approach
 $-1$ in order for
 $\beta _{z}$ to approach unity. If
 $\varPhi$ is close to
 $-1$ at the rear of the wake, the background plasma electrons can be trapped by the wake field. Up to now, some novel injection methods in PWFA have been proposed such as wake field induced ionization injection (Oz et al. Reference Oz, Deng, Katsouleas, Muggli, Barnes, Blumenfeld, Decker, Emma, Hogan and Ischebeck2007; Martinez de la Ossa et al. Reference Martinez de la Ossa, Grebenyuk, Mehrling, Schaper and Osterhoff2013, Reference Martinez de la Ossa, Mehrling, Schaper, Streeter and Osterhoff2015), plasma density transition injection (Suk et al. Reference Suk, Barov, Rosenzweig and Esarey2001; Geddes et al. Reference Geddes, Nakamura, Plateau, Toth, Cormier-Michel, Esarey, Schroeder, Cary and Leemans2008; Grebenyuk et al. Reference Grebenyuk, de la Ossa, Mehrling and Osterhoff2014; Martinez de la Ossa et al. Reference Martinez de la Ossa, Hu, Streeter, Mehrling, Kononenko, Sheeran and Osterhoff2017; Xu et al. Reference Xu, Li, An, Dalichaouch, Yu, Lu, Joshi and Mori2017) and by using artificial double-bunch (Kallos et al. Reference Kallos, Katsouleas, Kimura, Kusche, Muggli, Pavlishin, Pogorelsky, Stolyarov and Yakimenko2008; Rosenzweig et al. Reference Rosenzweig, Cline, Cole, Figueroa, Gai, Konecny, Norem, Schoessow and Simpson1988).
In this work, we propose a new scheme for the electron trapping and acceleration, using an ultrarelativistic ring-like hollow shaped electron beam to excite the wake field in the blowout regime. It is now well understood that when a relativistic electron beam injects into plasma, the background electrons are expelled out radially forming a narrow sheath and then pulled back by the quasi-static plasma ion column. This sphere-like structure is also called a ‘bubble’ (Kostyukov, Pukhov & Kiselev Reference Kostyukov, Pukhov and Kiselev2004). However, when the driving beam is a hollow electron beam, a special doughnut-like bubble appears because there is an electron beam streaming through the hollow beam and bubble centre (Jain, Antonsen & Palastro Reference Jain, Antonsen and Palastro2015). Here that the electron beam is called a ‘backflow’ beam since it has a negative velocity compared with the hollow driver. When the radius of the hollow beam is not too large (Jain Reference Jain2019) (such as  $k_{p}r<0.8$), a transverse convergence of the hollow driver beam happens after a short distance propagation in plasma. At the same time, there is an electron density transition in the rear of the bubble with the backflow beam reducing gradually, and one can control the evolution of the driver beam and backflow beam density by adjusting the radius of the hollow driver. Our studies show that such a hollow electron beam can easily excite a process of electron trapping. The per particle energy of the trapped beam can reach approximately 1.4 times that of the driving beam. The detailed study on the mechanism shows that the central backflow electron beam plays an important role in this electron-trapping scheme. Nowadays, these doughnut-shaped plasma wake fields have also been observed in LWFA excited by a Laguerre–Gaussian laser pulse and have attracted great research interest (Che et al. Reference Che, Kong, Mao, Wang, Ho and Kawata2009; Mendonça & Vieira Reference Mendonça and Vieira2014; Vieira & Mendonça Reference Vieira and Mendonça2014; Zhang et al. Reference Zhang, Chen, Luo, Zeng, Yuan, Yu, Ma, Yu, Yu, Weng and Sheng2016a,Reference Zhang, Chen, Schroeder, Luo, Zeng, Li, Yu, Weng, Ma and Yub).
2. The mechanism of electron injection in an evolving doughnut-shaped bubble
The density profile of the hollow beam used in this work can be described as
 \begin{equation} n_{d}=n_{b0}\exp\left[-\frac{(r-r_{d0})^{2}}{2\sigma^{2}_{r}}-\frac{(\xi-\xi_{0})^{2}}{2\sigma^{2}_{x}}\right], \end{equation}
where  $r_{d0}$ is the initial value of the hollow beam radius
 $r_{d}$,
 $\xi =ct-x$, and the hollow beam density
 $n_{d}$ reaches its peak value at
 $(r_{d0},\xi _{0})$. The total charge of this electron beam is calculated by
 $Q_{b}=-\textrm {e}\int n_{d}(r,\xi )r\,\textrm {d}r\,\textrm {d}\theta \,\textrm {d}\xi$.
Our cylindrically symmetric two-dimensional (2-D) simulations were performed through the particle-in-cell (known as PIC) code EPOCH (Arber et al. Reference Arber, Bennett, Brady, Lawrence-Douglas, Ramsay, Sircombe, Gillies, Evans, Schmitz and Bell2015). The simulation domain size is  $1350\ \mathrm {\mu }\textrm {m}\times 1000\ \mathrm {\mu }\textrm {m}$ (
 $\delta x=\delta y=0.4\ \mathrm {\mu }\textrm {m}$), and eight super particles per cell. The hollow beam moves along the
 $x$-axis positive direction and a moving window with a speed of
 $c$ paralleling to the
 $x$-axis is used. The boundary condition along the
 $x$-axis is simple outflow and the boundary condition along the
 $y$-axis is open. There is a
 $60\ \mathrm {\mu }\textrm {m}$ up-ramp density transition region
 $(440\ \mathrm {\mu }\textrm {m}\leqslant x\leqslant 500\ \mathrm {\mu }\textrm {m})$ with the plasma density increasing from
 $0.37n_{p0}$ to
 $n_{p0}$, and followed by a uniform region
 $(x>500\ \mathrm {\mu }\textrm {m})$ with the plasma density of
 $n_{p0}=5.0\times 10^{16}\ \textrm {cm}^{-3}$. The parameters of the hollow driver are
 $\xi _{0}=420.0\ \mathrm {\mu }\textrm {m}$,
 $k_{p}\sigma _{r}=0.2$,
 $k_{p}\sigma _{x}=1.0$, where
 $k_{p}$ is the plasma wavenumber and
 $k^{-1}_{p}=c/\omega _{p}\approx 23.75\ \mathrm {\mu }\textrm {m}$,
 $\omega _{p}=\sqrt {n_{p0}e^{2}/m_{e}\varepsilon _{0}}$, and where
 $\varepsilon _{0}$,
 $m_{e}$ and
 $e$ are the vacuum permittivity, the electron mass and electron charge, respectively. The simulation time step is
 $0.896$ fs. The initial energy of the hollow beam is
 $1.0$ GeV per particle (where the Lorentz factor of the electron is
 $\gamma =(1-\beta ^{2})^{-1/2}\approx 1958, \beta =v/c$). Nowadays, hollow electron beams with energy in the range from tens to hundreds of MeV have been observed in experiments and simulations of laser wake field acceleration (Pollock et al. Reference Pollock, Tsung, Albert, Shaw, Clayton, Davidson, Lemos, Marsh, Pak and Ralph2015; Zhao et al. Reference Zhao, Behm, Dong, Davoine, Kalmykov, Petrov, Chvykov, Cummings, Hou and Maksimchuk2016; Zhang et al. Reference Zhang, Chen, Luo, Zeng, Yuan, Yu, Ma, Yu, Yu, Weng and Sheng2016a,Reference Zhang, Chen, Schroeder, Luo, Zeng, Li, Yu, Weng, Ma and Yub; Shen et al. Reference Shen, Chen, Zhang, Luo, Weng, Yuan, Liu and Sheng2017).
In the following discussions, we have simulated a typical case with the parameters of  $k_{p}r_{d0} = 0.6$,
 $n_{b0} = 5.5n_{p0}$ to explore the physics of the bubble evolution and electron trapping. The normalized charge per unit length for this driving beam is
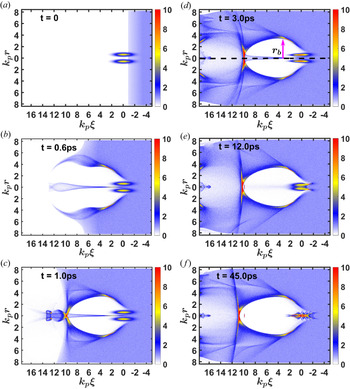
 $\varLambda \equiv \int _{0}^{\infty }rn_{b}\,\textrm {d}r=1.65$. The snapshots of electron density at specific moments are presented in figure 1. When the hollow beam travels through the plasma region, the background electrons at the outside of the hollow driver are pushed outward firstly by the driver Coulomb force and then pulled back by the quasi-static plasma ions, as shown in figure 1(a–c); as a result an electron bubble sheath forms at the outside. At the same time, the near-axis electrons are squeezed to the centre and streaming through the bubble. Finally, a special doughnut-like electron bubble is excited. In the blowout regime, the edge of the ion column is called the bubble radius (Xu et al. Reference Xu, Li, An, Dalichaouch, Yu, Lu, Joshi and Mori2017) and defined as
 $r_{b}(\xi )$ (the radius is in cylindrical coordinates for each value of
 $\xi$) as shown in figure 1(d). With the travelling of the hollow beam in plasma, the bulk of the driver beam shifts towards the centre. From figure 1(e), one can see that the tail of the hollow driver shifts faster than the head. Even if the head of the hollow beam still keeps a ring-like distribution, its tail has already converged together and closed like a solid beam. During the convergence, the backflow beam becomes weaker and weaker and is then finally cut off. With further convergence, the hollow beam completely turns to a solid beam and finally forms a ‘fish-bone’-like structure (Jain et al. Reference Jain, Antonsen and Palastro2015) as shown in figure 1(f).
The plasma electron number density together with the hollow beam at (a)  $t=0$ ps, (b)
 $t=0.6$ ps, (c)
 $t=1$ ps, (d)
 $t=3$ ps, (e)
 $t=12$ ps and (f)
 $t=45$ ps. The unit of the colour bar is
 $n_{b}/n_{p0}$.

From figure 1(e,f), there is a short high-density electron beam captured by the bubble in the rear of the first bubble. The trapped electron beam reaches a relativistic velocity quickly and is accelerated continuously until the collapse of the bubble. Further analyses show that after the electron trapping process, the trapped beam still gradually moves forward relative to the rear of the bubble due to the further expansion of the bubble caused by the further convergence of the hollow beam. Besides, one can also find a bunch of electron beams in the second bubble in figure 1(e,f). It should be noted that this electron trapping is caused by a vacuum plasma density jump on the left-hand edge, and the plasma density up-ramp region on the left-hand side can reduce this effect and help achieve a clean first bubble.
For an electron beam with an energy of  $1.0$ GeV per particle, the velocity of this beam is very close to the speed of light and the plasma wake field excited by this beam travels at the same velocity in uniform plasma. Most of the sheath electrons at the rear of the bubble have longitudinal energy less than 15.0 MeV
 $(\gamma = 29.3)$. After analyses of the bubble evolution, this electron trapping can be explained by the local plasma density transition in the rear of the bubble. Katsouleas (Reference Katsouleas1986) has pointed out that the phase velocity of a wake driven by a particle beam moving with a constant velocity
 $v_{d}$ changes in a density gradient due to the density dependence of the oscillation frequency. The phase velocity of the wake (Xu et al. Reference Xu, Li, An, Dalichaouch, Yu, Lu, Joshi and Mori2017) can be written as
 \begin{equation} v_{\phi}(\xi,t)=\frac{v_{d}}{1-(\textrm{d}\omega_{p}/\textrm{d}\xi)\omega_{p}^{-1}(v_{d}t-x)} , \end{equation}
where  $\omega _{p}(\xi )$ is the local plasma frequency. In the uniform plasma density region,
 $\textrm {d}\omega _{p}/\textrm {d}\xi =0$,
 $v_{\phi }(\xi ,t)=v_{d}$, and the longitudinal bubble size does not change; in the down-ramp plasma density region,
 $\textrm {d}\omega _{p}/\textrm {d}\xi <0$,
 $v_{\phi }(\xi ,t) < v_{d}$, and the longitudinal bubble size increases. In our cases, the density of the backflow beam reduces gradually, in another words, there is a local down-ramp electron density transition in the rear of the bubble. This structure performs a similar effect as in a down-ramp density plasma. The density transition slows down the local wake phase velocity and expands the longitudinal size of the bubble. With the backflow beam becoming weaker and weaker,
 $\textrm {d}\omega _{p}/\textrm {d}\xi \rightarrow 0$ and
 $v_{\phi }(\xi ,t)\rightarrow v_{d}$. At the same time, the driver evolution is another reason for the bubble longitudinal expansion, just like the similar process in a laser-driven wake field. This local electron density transition, along with the bubble expansion, is the main physics that leads to the electron trapping.
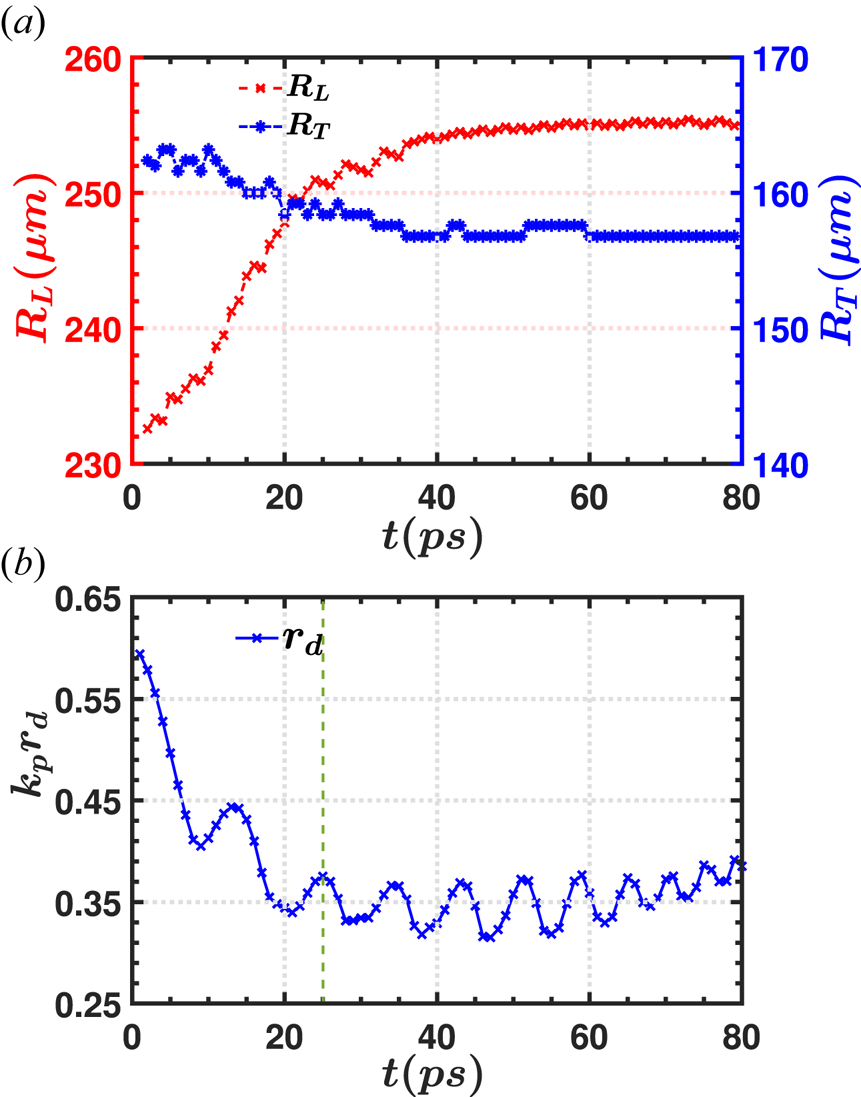
To confirm the above explanation, the evolution of the bubble size and the hollow beam radius are shown in figure 2. Here, the bubble longitudinal size  $R_{L}$ is defined as the length from the centre of the hollow beam to the rear of the bubble, and the bubble transverse width is defined as
 $R_{T}=2r_{m}$, where
 $r_{m}$ is the maximum value of
 $r_{b}$. Figure 2(a) shows the evolution of
 $R_{L}$ and
 $R_{T}$ along with time in the main case. It is easy to find that
 $R_{T}$ tends to decrease but changes very slowly. On the contrary, the value of
 $R_{L}$ increases quickly before
 $t=24$ ps and then becomes smooth. The
 $R_{L}$ increases by
 $22.6\ \mathrm {\mu }\textrm {m}$, and the
 $R_{T}$ decreases by
 $5.7\ \mathrm {\mu }\textrm {m}$ during the whole evolution process. As is well known, the increase of
 $R_{L}$ means a decrease of wake field local phase velocity. Before
 $t=24$ ps, the wake field phase velocity at the rear of the bubble is significantly smaller than
 $v_{d}$. After it, the increase of
 $R_{L}$ is slowing down, and all the wake field phase velocity becomes close to
 $v_{d}$. In this work, the hollow beam radius is defined as
 $r_{d} = \sum ^{N}_{1}r_{i}/N$, where
 $r_{i}$ is the radial position of every hollow beam electron, and
 $N$ is the total number of superparticles in the driver beam. Figure 2(b) shows the evolution of the hollow beam radius, which decreases quickly combined with an oscillation before
 $t=24.0$ ps. Then the decreasing trend disappears slowly and the radius oscillates around its average value until its breakdown. Combined with figure 1(e), one can see that the backflow beam is cutoff in the first oscillation of
 $r_{d}$. During this process, the electron density of the backflow beam decreases gradually from approximately
 $0.5n_{p0}$ to zero and a bunch of electrons is captured at the rear of the bubble. The above concludes that the density transition together with the convergence of the hollow beam leads to an elongation of the bubble longitudinal size and electron trapping. The density transition process finishes quickly before approximately
 $t=12.0$ ps, and the trapped beam separates from the rear bubble sheath at this time too. The beam loading induces the termination of the injection. After
 $12.0$ ps, the backflow beam disappears and only a few electrons still stream through the bubble, but the convergence of the hollow beam lasts a longer time. The convergence phenomenon causes the on-axis driver electron density to rise rapidly and further the elongation of the electron bubble. From figures 2(a) and 2(b), one can see that the radius of the driver beam reaches its smallest value for the first time at around
 $t=38.0$ ps while the bubble size
 $R_{L}$ and
 $R_{T}$ become steady too. Based on the above reason, the trapped electrons still move forward relative to the rear of the bubble until
 $t\sim 38.0$ ps. When the hollow beam converges like a regular bi-Gaussian beam, the longitudinal size of the electron bubble does not change even with the beam betatron oscillation.
(a) The evolution of the bubble longitudinal size  $R_{L}$ and transverse size
 $R_{T}$. (b) The evolution of the hollow beam radius
 $k_{p}r_{d}$.

3. Analyses of the trapped electron beam
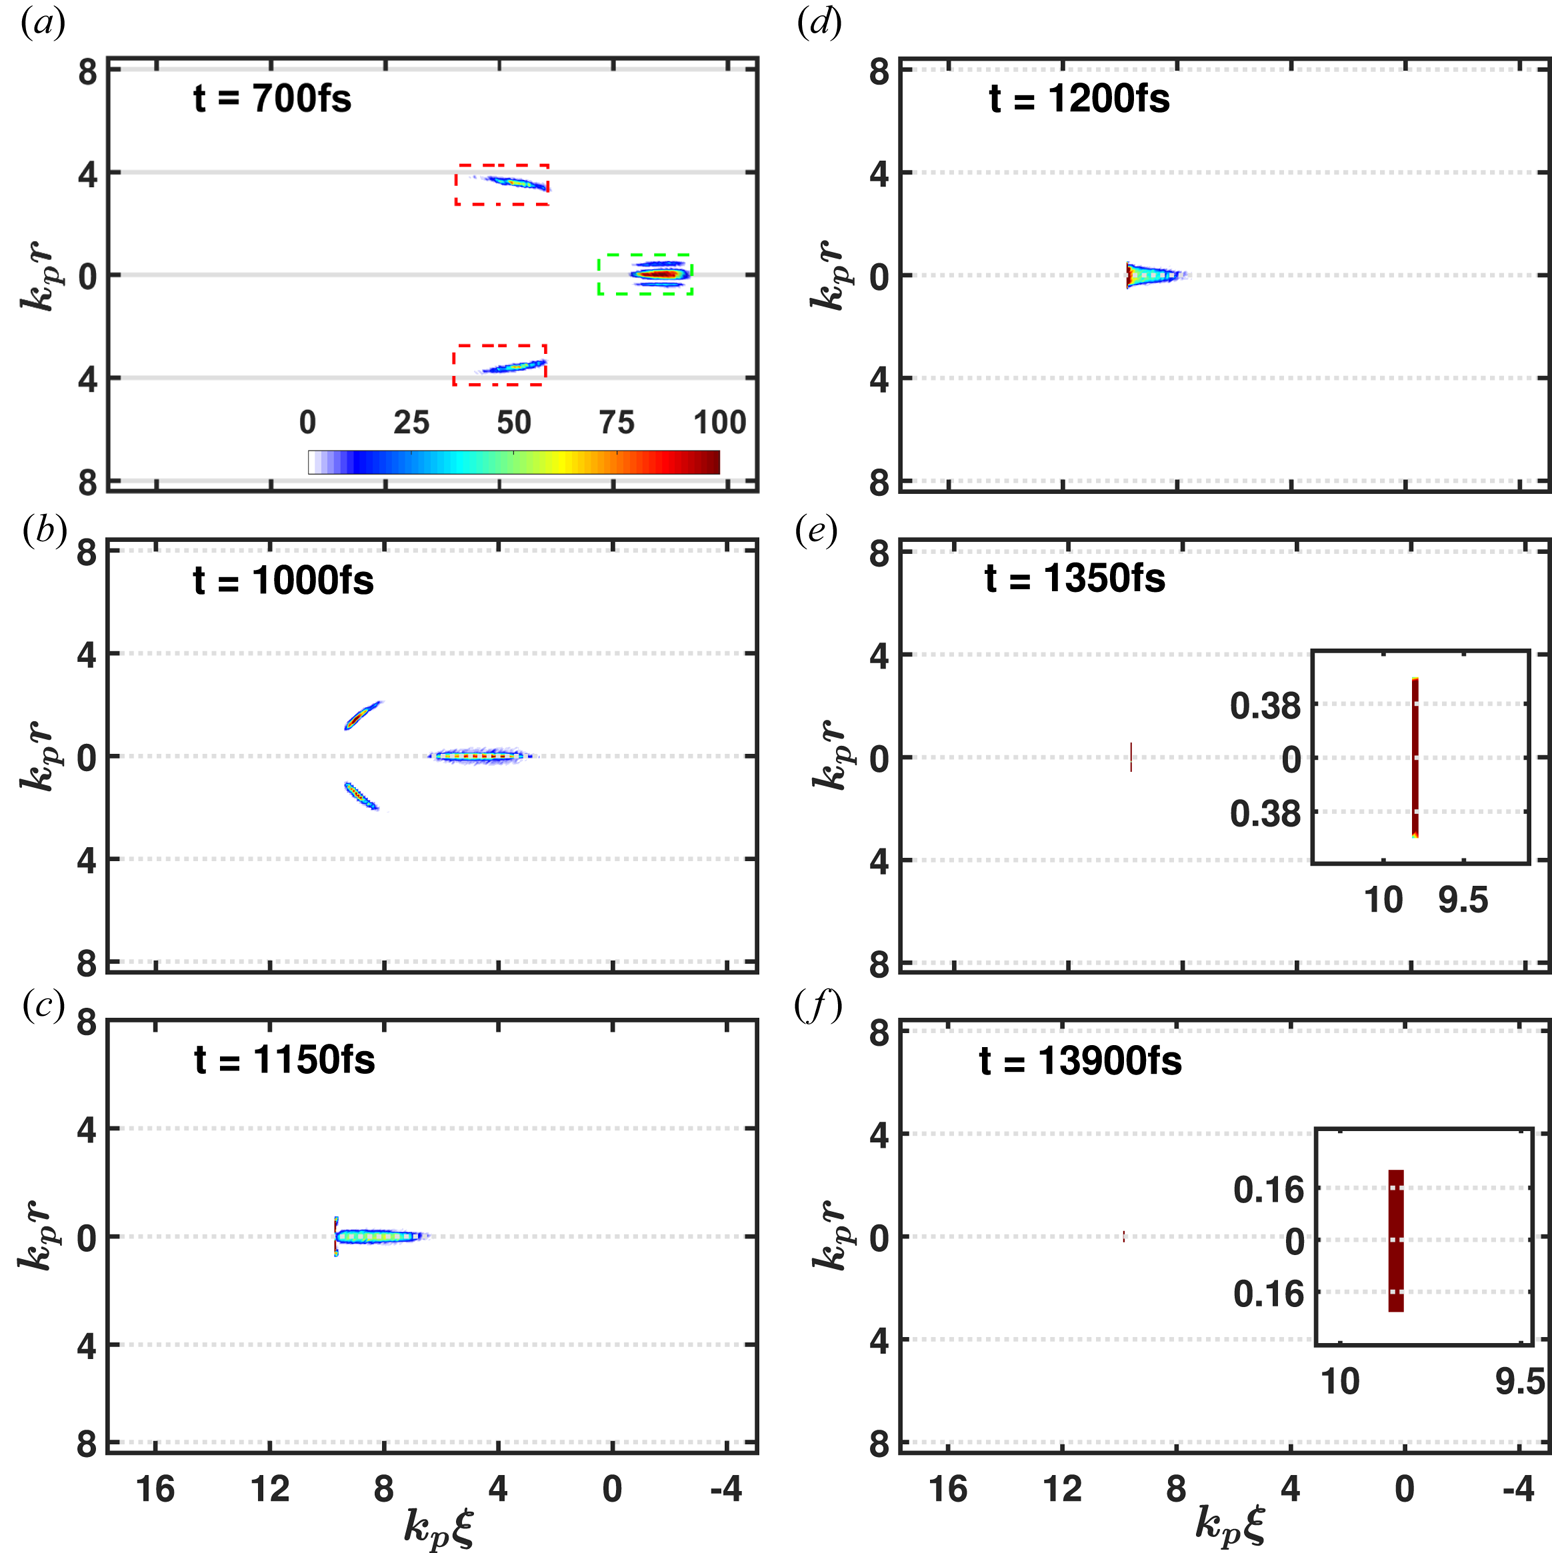
In the above hollow beam case, the backflow beam is trapped by the wake field streaming through the bubble. To analyse the source of the trapped beam, all the trapped electrons are traced back. Figure 3 shows their spatial distribution at different times, and the trapped electron number density is represented by colours, and all the figures share the same colour bar. Figure 3(a–e) shows some key snapshots at different times, which are helpful in understanding the electron trapping process. From figure 3(a,b), it is clear that the injected electrons have two components. One is from the bubble sheath as highlighted by red dotted boxes and the other is from the central backflow beam as highlighted by a green dotted box in figure 3(a). From figure 3(b–d), one can see that the sheath electrons move to the central axis to form a very thin electron bunch at the rear of the bubble. The backflow beam moves to the rear of the bubble and converges with the trapped sheath electrons. In figure 3(c–e), the backflow electrons move to the rear of the bubble and are compressed longitudinally. Then, the backflow beam and sheath electrons move forward together with the bubble sheath along with the expansion of bubble longitudinal size. From figure 3(e,f), the transverse size of the trapped beam is further compressed from  $28.94\ \mathrm {\mu }\textrm {m}$ to
 $12.21\ \mathrm {\mu }\textrm {m}$, at last it becomes an ultrashort high-density beam. In the above case,
 $65\,\%$ of the trapped electrons come from the backflow beam.
The distribution of the trapped electron at (a)  $t=700$ fs, (b)
 $t=1000$ fs, (c)
 $t=1150$ fs, (d),
 $t=1200$ fs, (e)
 $t=1350$ fs and (f)
 $t=13\,900$ fs. The trapped electron number density is represented by colours and the six panel share the same colour bar. The insets in panels (e,f) show the magnification of the trapped beam.

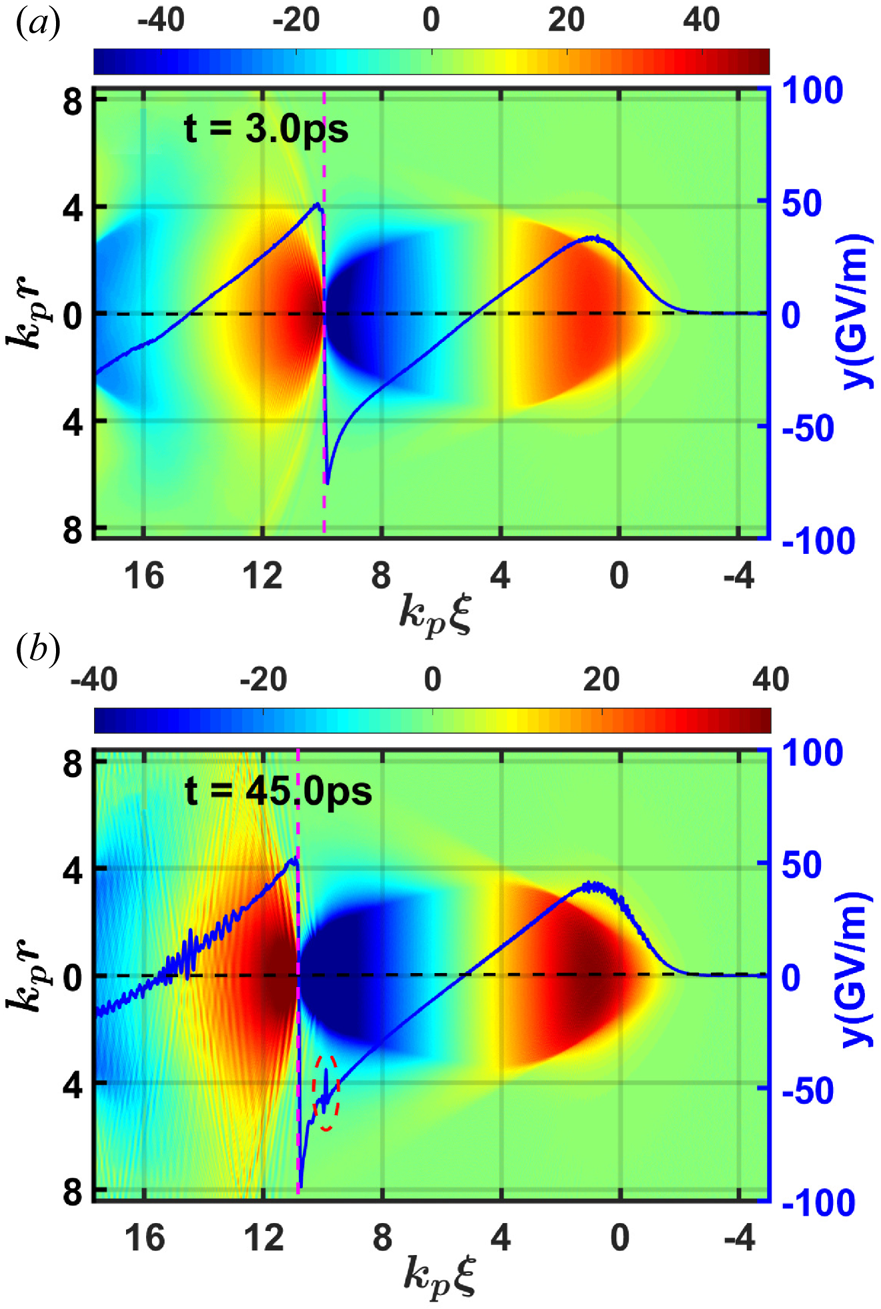
To further understand the behaviour of the trapped beam and the characteristic of the wake field, figure 4 presents the electric field in the bubble driven by the hollow driver. Figure 4(a,b) are the longitudinal electric field at  $3.0$ ps and
 $45.0$ ps, respectively. The solid blue lines represent the electric field on the central axis as shown by the black dashed lines. One can see that the backflow beam firstly accelerates backward in the front half of the bubble and then decelerates in the back half. The difference between these two process is the reason that some backflow electrons are captured by the wake field and compressed to a small longitudinal size. What is more, figure 4(a), shows that the electric field in the rear of the bubble changes from the maximum deceleration field to the maximum acceleration field in only
 $4\ \mathrm {\mu }\textrm {m}$, which is quite different from the wake field driven by an intense pulsed laser. This ultrahigh slope is not favourable to continuous electron trapping but is suitable for achieving ultrashort trapped beams. In figure 4(b) at
 $45.0$ ps, the backflow beam has cut off, and the injection beam is captured by the wake field and accelerated at a stable phase. Compared with figure 4(a), the longitudinal field gets a distortion at the place where the injection beam is located, as shown in figure 4(b) marked by a red dash ellipse. This spike caused by numerical problems (sampling or code-specific) for the beam loading in this case is not strong enough to excite such a big impact on the accelerating field (Manahan et al. Reference Manahan, Habib, Scherkl, Delinikolas, Beaton, Knetsch, Karger, Wittig, Heinemann and Sheng2017). More realistic cases can be found in the references (Tzoufras et al. Reference Tzoufras, Lu, Tsung, Huang, Mori, Katsouleas, Vieira, Fonseca and Silva2008, Reference Tzoufras, Lu, Tsung, Huang, Mori, Katsouleas, Vieira, Fonseca and Silva2009). When the load beam is well designed or a Gaussian beam, the local field on the loading beam is theoretically flatter. Considering this effect, the energy spread in experiments may be better than the simulation results. What is more, the trapped beam is accelerated in a deeper phase relative to the rear of the bubble due to the further expansion of the bubble. This means that the slope of the local accelerating field is smaller compared with the rear of the bubble and the energy spread creasing caused by the gradient of the accelerating field is reduced.
The electric field of the plasma bubble and the longitudinal electric field at (a)  $t = 3$ ps and (b)
 $t = 45$ ps, respectively. The solid blue lines are the central longitudinal field taken from the black-dashed lines. The unit of the colour bar is GeV.

As is well known that the wake field in the bubble has the ability to focus electrons natively. However, when this trapped beam loads the wake, the beam loading can influence both the sheath electrons and the trapped beam itself (Tzoufras et al. Reference Tzoufras, Lu, Tsung, Huang, Mori, Katsouleas, Vieira, Fonseca and Silva2008, Reference Tzoufras, Lu, Tsung, Huang, Mori, Katsouleas, Vieira, Fonseca and Silva2009). The trapped beam with a large number of negative charges repels the sheath electrons by delaying them from returning to the axis. On the other hand, the trapped beam allows the sheath electrons to reach the axis while slowly decreasing their transverse momentum. Ideally, the sheath electrons should arrive on the axis with no transverse momentum. Besides, the variations in the local accelerating field induce significant energy spread for a bunch without a properly tailored profile, unless the bunch is extremely short and contains very low charge.
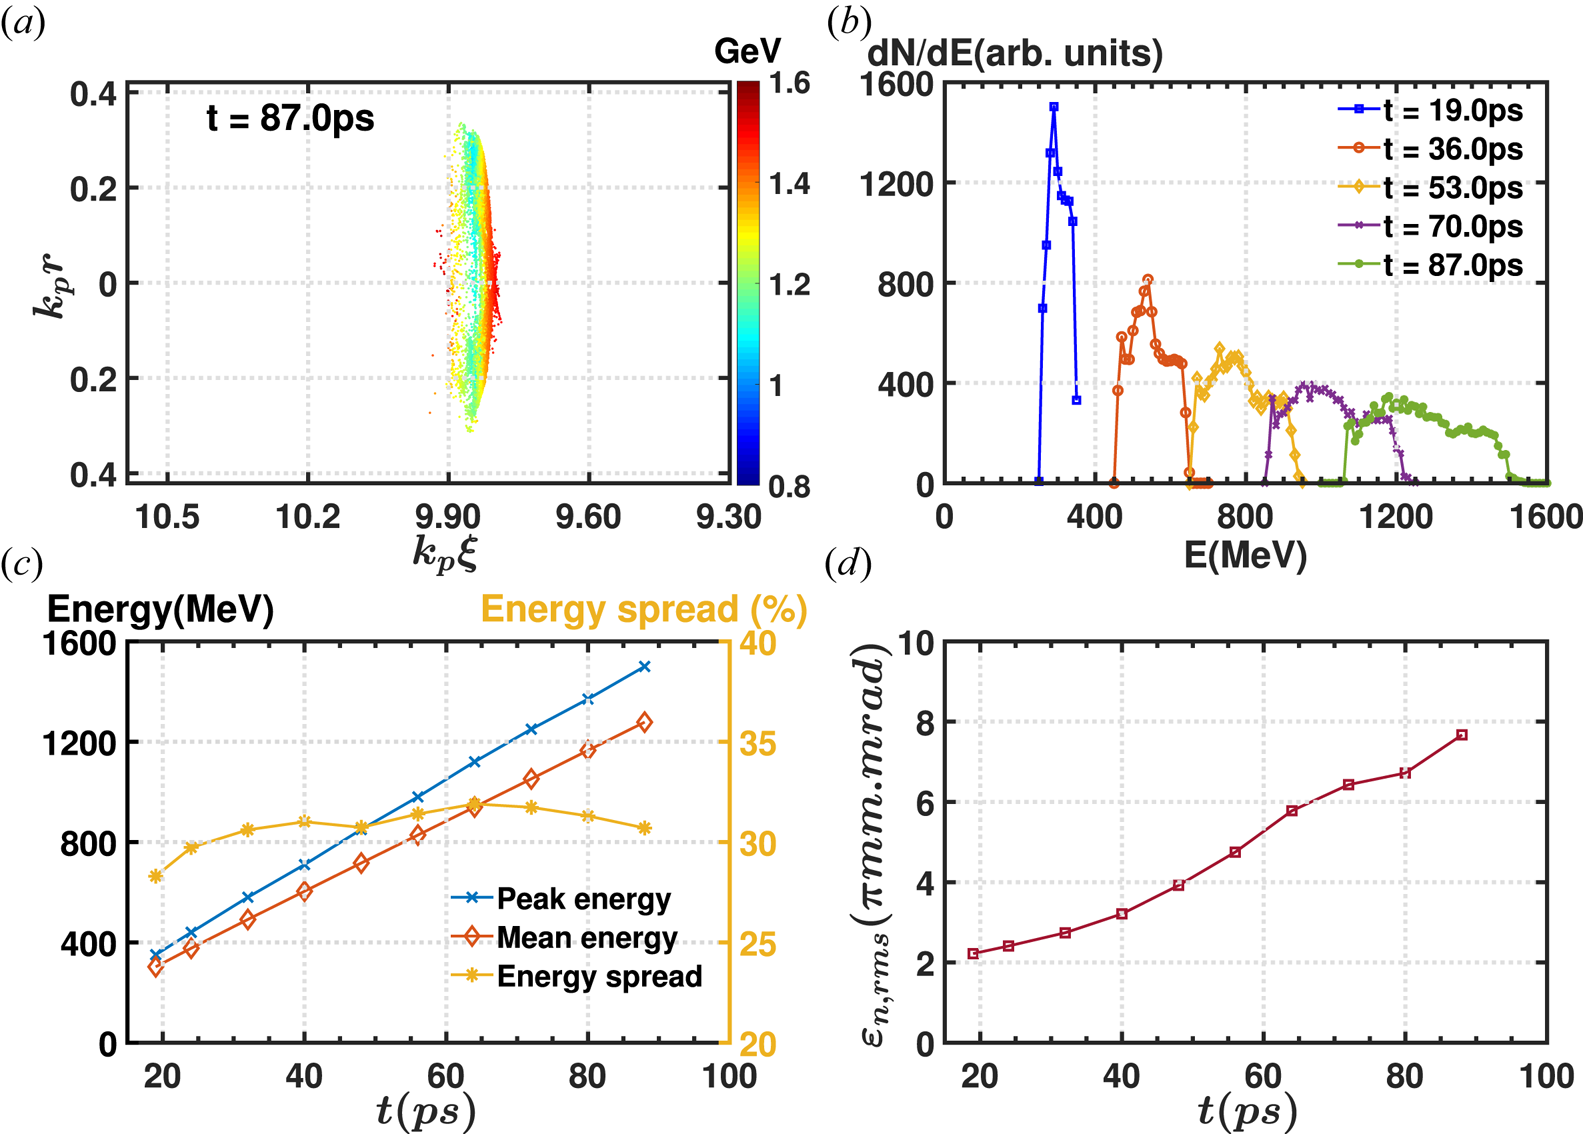
In the above case, a  $6.67$ fs ultrashort electron beam is achieved and some analyses have been made as shown in figure 5. Firstly, figure 5(a) shows the energy of the electrons at the trapped beam middle part is smaller than the head and tail parts at
 $87.0$ ps. The colour map reflects the amount of beam energy. This is caused by the local longitudinal wake field distortion. From figure 5(b,c), it can be seen the full width at half maximum (known as FWHM) of the energy spectrum becomes wider and the mean energy and maximum energy increasing linearly during the acceleration process. Finally, the trapped beam is accelerated to a peak energy of
 $1.50$ GeV per particle. The energy spread is approximately
 $30.0\,\%$ and stays nearly unchanged with the acceleration of the trapped beam. By analysing the energy spectrum of the trapped sheath and backflow electrons, respectively, we find that the central energy of the trapped sheath beam is larger than the central energy of the trapped backflow beam. The related energy spreads are
 $22.2\,\%$ and
 $19.2\,\%$, respectively. The energy difference is
 $\Delta E\approx 200$ MeV and this is one important reason for the
 $30.0\,\%$ energy spread. Compared with the work by Martinez de la Ossa et al. (Reference Martinez de la Ossa, Hu, Streeter, Mehrling, Kononenko, Sheeran and Osterhoff2017) and Manahan et al. (Reference Manahan, Habib, Scherkl, Delinikolas, Beaton, Knetsch, Karger, Wittig, Heinemann and Sheng2017), the energy spread in our scheme still has potential for improvement.
The analyses of the trapped beam where  $k_{p}r_{d0}=0.6$ and
 $n_{b0}/n_{p0}=5.5$. (a) The space–energy distribution of the trapped beam at
 $87$ ps. (b) The energy spectrum of the trapped beam at different times. (c) The evolution of the peak energy, mean energy and energy spread of the trapped beam. (d) The evolution of the normalized emittance.

The normalized emittance of the trapped beam is calculated by (Floettmann Reference Floettmann2003)
 \begin{equation} \varepsilon_{n,rms} = \frac{1}{m_{0}c}\sqrt{\langle y^{2}\rangle\langle p^{2}_{y}\rangle - \langle yp_{y} \rangle^{2}} . \end{equation}
The evolution of the normalized emittance is shown in figure 5(d). At the end of the acceleration process, the total emittance of the trapped beam is  $\varepsilon _{n,rms}\approx 7.67({\rm \pi} \textrm {mm}\ \textrm {mrad})$. This result shows that the trapped beam obtains the additional energy of 0.5 GeV per particle with a normalized emittance
 ${<}8({\rm \pi} \textrm {mm}\ \textrm {mrad})$ which is comparable to the tightly focused laser pulse case (Kalmykov et al. Reference Kalmykov, Yi, Beck, Lifschitz, Davoine, Lefebvre, Khudik, Shvets and Downer2010). The emittance of the trapped sheath beam and backflow beam are
 $9.61({\rm \pi} \textrm {mm}\ \textrm {mrad})$ and
 $5.25({\rm \pi} \textrm {mm}\ \textrm {mrad})$, respectively. The trapped beam from the backflow beam has a lower emittance than the trapped beam from the sheath. The key point is the trapped beam from the bubble sheath has transversal momentum initially, while the backflow beam almost has no transversal momentum.
For the case discussed above, the maximum energy of the trapped beam is approximately  $1.5$ GeV per particle which means the transformer ratio (Katsouleas Reference Katsouleas1986) (defined as the ratio of the maximum energy gain (
 $\Delta \gamma$) of accelerated particles to the initial energy (
 $\gamma _{b}$) of driving particles) is
 $R\equiv \Delta \gamma /\gamma _{b}=1.5$. Since the varied drive beam energy changes its focus behaviour or betatron period, which may affect the cutoff and final quality of the trapped beam directly, we make some more simulations with different hollow beam energies. In these cases, the energies of the hollow beams are 10 GeV, 20 GeV and 40 GeV, respectively, and
 $k_{p}r_{d0} = 0.6$ and
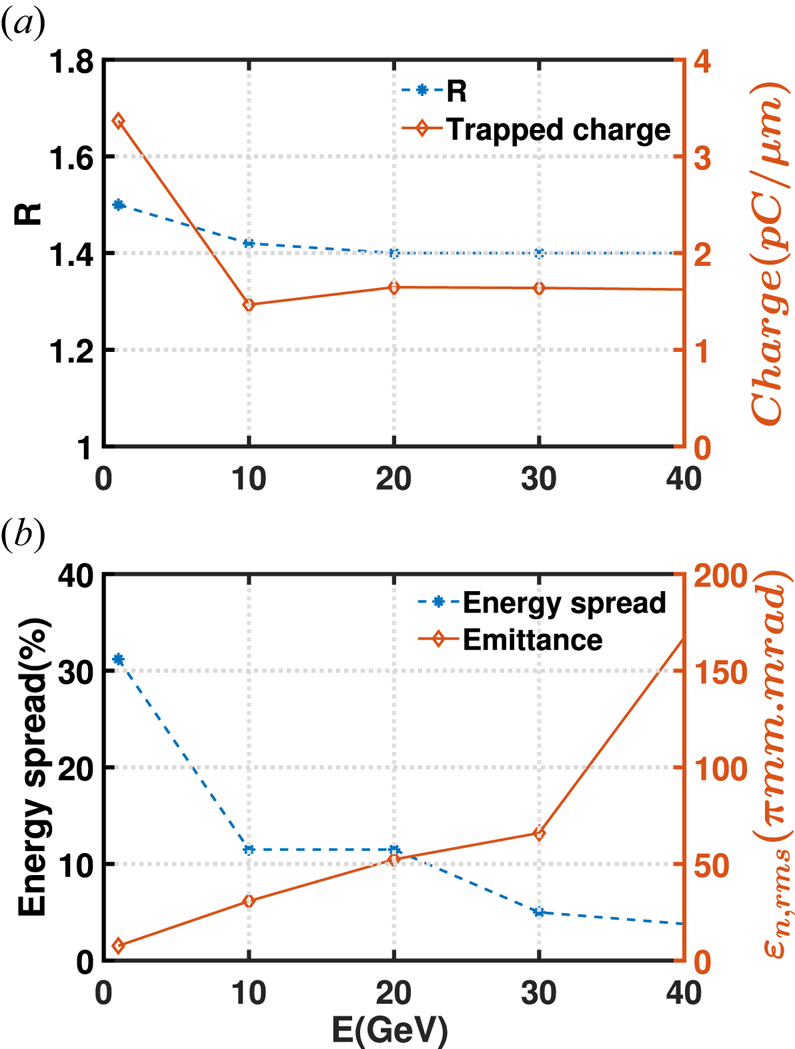
 $n_{b0}/n_{p0} = 5.5$ remain unchanged. The transformer ratio and the charge of the trapped beam at different cases are plotted in figure 6(a). The charge value is derived directly from the 2-D simulations and its unit is
 $\textrm {pC}/\mathrm {\mu }\textrm {m}$. Figure 6(a) shows that the transformer ratio remains approximately
 $1.4$ and the charge of the trapped beam also remains around
 $1.6\ \textrm {pC}/\mathrm {\mu }\textrm {m}$ in higher energy cases. Therefore, we conclude that the increase of the hollow beam energy has little influence on the transformer ratio and trapped beam charge. Figure 6(b) shows the trapped beam energy spread and emittance. With the increase of the hollow beam energy, the trapped beam energy spread becomes smaller, which is consistent with the analysis in the above main case. Meanwhile, the beam emittance becomes worse in energetic cases. The ultrashort and high energy electron beam may be useful in ultrafast physics research.
The transformer ratio and the charge of the trapped beam (a), and the energy spread and the normalized emittance (b) when varying the hollow beam energies from 1 GeV to 40 GeV.

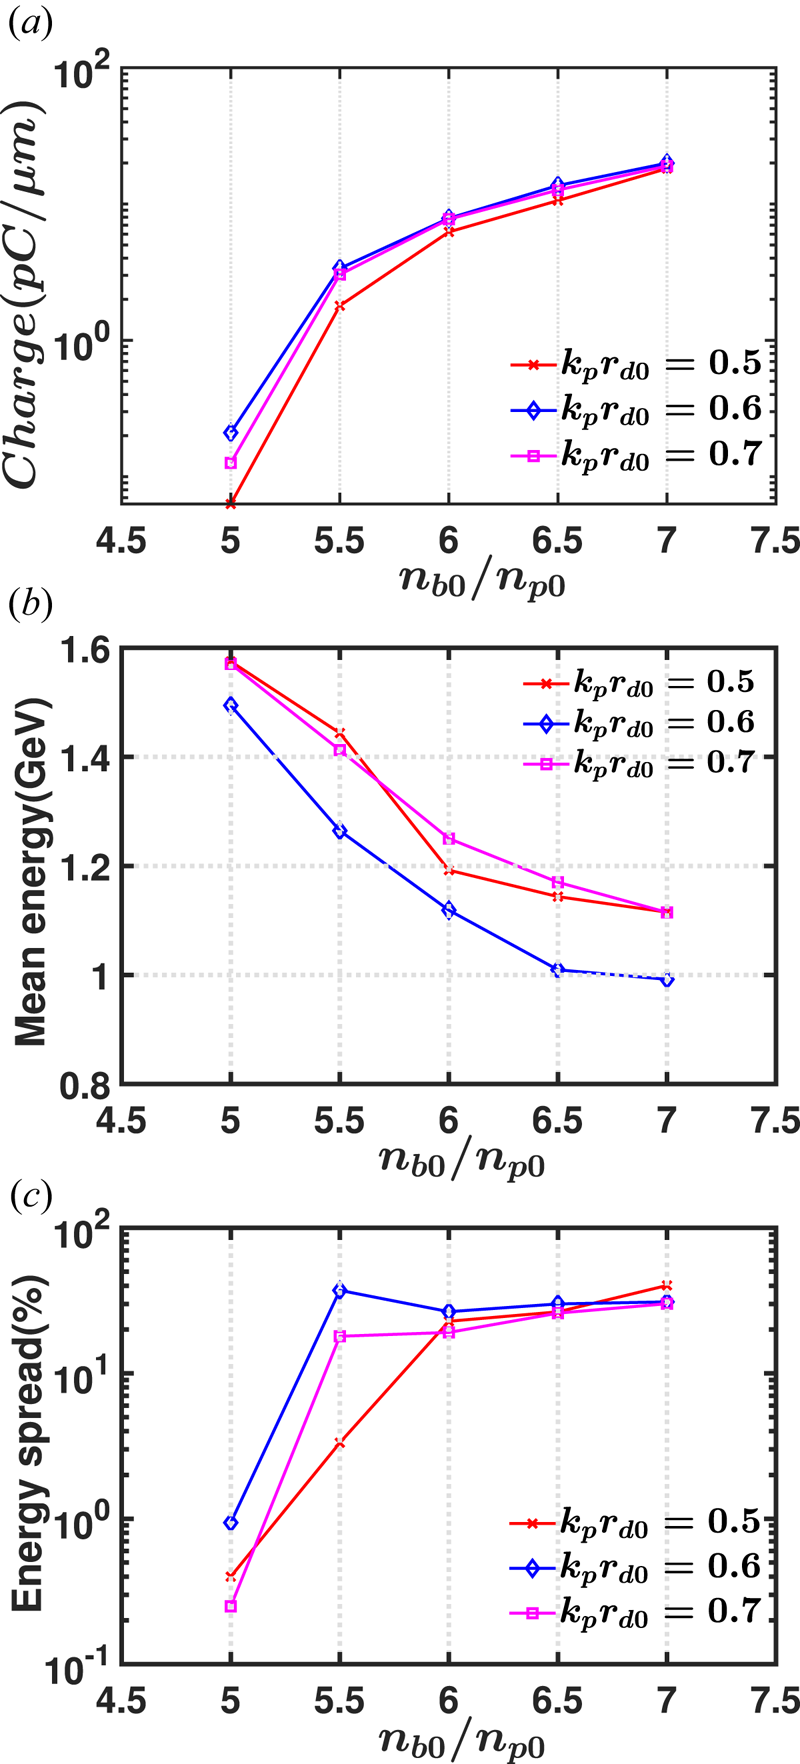
Besides the hollow beam energy, the hollow beam density and hollow beam radius also have an influence on the trapped beam quality. Simulations with different beam densities ( $n_{b0}/n_{p0}=5.0\sim 7.0$) and different radii (
 $k_{p}r_{d0} = 0.5\sim 0.7$) have been operated and the related results are shown in figure 7. Here, figure 7(a–c) are the charge, mean energy and energy spread of the trapped beam at the end of accelerations, respectively. Figure 7(a) shows that the charge of the trapped beam increases with the hollow beam density and the radius of the hollow driver has little effect on the charge value of the trapped beam. Actually, when the hollow beam density is close to
 $n_{b0}/n_{p0}=7.0$ nearly the same charge values are obtained for different hollow beam radius
 $r_{d0}$. Figure 7(b) shows that the mean energy of the trapped beam decreases with the increase of
 $n_{b0}/n_{p0}$. At last, the energy spread of the trapped beam, as shown in figure 7(c), increases quickly at the beginning and then turns gently after
 $n_{b0}/n_{p0}>5.5$. On the other hand, the radius of the hollow beam has little effect on the energy spread. From figure 7(a–c), it can be observed that the trapped beam quality is more sensitive to the change of the hollow beam density. When the hollow beam density is not very large, the trapped beam can achieve a better beam quality, such as larger energy gain and proper energy spread. In the case of
 $n_{b0}/n_{p0}=5.0$, the trapped beam is free of beam loading and experiences only weak space charge force for its charge is low, and this beam has a small energy spread and emittance which may be useful in free-electron laser research. For achieving a larger trapped beam charge, one can increase the hollow beam density
 $n_{b0}/n_{p0}$, such as to turn to
 $5.5$ in this work. The discussions above show that the electron trapping in this scheme is easy to generate and control.
The final charge value (a), mean energy (b) and energy spread of the trapped beam (c) for the different hollow beam density ( $n_{b0}/n_{p0}=5.0\sim 7.0$) and radius (
 $k_{p}r_{d0}=0.5\sim 0.7$).

4. Conclusion
In conclusion, we have observed the trapped electrons in a plasma wake field excited by a relativistic hollow electron beam. Whilst travelling in plasma, there is a special doughnut-like bubble formed. With the convergence of the hollow beam and the local density transition in the rear of the bubble, there is a bunch of background electrons trapped and accelerated by the wake field. The trapped electrons have two origins, one is from the bubble sheath, and the other is from the unique backflow beam which has good performance in emittance. In the typical case, the trapped beam is accelerated to  $1.50$ GeV per particle which is
 $1.5$ times the hollow driver beam's initial energy. However, the final energy of the trapped sheath beam is approximately
 $200$ MeV larger than the trapped backflow beam, and that is why the energy spread is
 $30\,\%$ in this case. Besides, when the energy of the driving beam increases to
 $40.0$ GeV, a transformer ratio of
 $1.4$ still can be achieved. In the energetic cases, the charge of the trapped beam remains around
 $1.6\ \textrm {pC}/\mathrm {\mu }\textrm {m}$ and the energy spread is improved because the ultrashort trapped beam experiences a relatively uniform acceleration field. The above results show that this scheme has potential for applications in the higher energy region. In addition, the trapped beam quality is more sensitive to the change of the hollow beam density, and lowering the density of the hollow beam can increase the beam energy and improve energy spread. This new scheme has proved effective in electron trapping in PWFA and the high quality ultrashort trapped beam may be applied to produce ultrashort pulses of x-rays or free-electron laser beams in the future.
Acknowledgements
This work is supported by NSFC (no. 11775056).
Editor Victor Malka thanks the referees for their advice in evaluating this article.
Declaration of interests
The authors report no conflict of interest.