Introduction
Antipsychotics play a major role in the treatment of schizophrenia. During pharmacotherapy for patients with schizophrenia, it is recommended that antipsychotics should be increased to an adequate dose within the tolerable range when the observed treatment response is insufficient. 1-4 However, randomized controlled trials (RCTs) and systematic reviewsReference Samara, Klupp and Helfer 5 , Reference Sakurai, Suzuki and Bies 6 have revealed conflicting reports, with little known about the optimal antipsychotic dose during the acute phase of schizophrenia.Reference Buchanan and Carpenter 7 , Reference Hui, Lam and Lee 8 Based on a systemic review of clinical guidelines, dosage recommendations reportedly varied based on 15 guidelines that suggest an optimal daily dose range for patients after the first psychotic episode in their acute phaseReference Hui, Lam and Lee 8 . Recently, the minimum effective dose has been used to evaluate the optimal dose in terms of efficacy, as well as safetyReference Takeuchi, MacKenzie and Samaroo 9 ; therefore, further research is warranted to address these issues.
It has also been reported that the therapeutic effect of increased doses of antipsychotics reaches a plateau at a certain level.Reference Someya, Muratake and Hirokane 10 These effects are supported by the relationship between the dopamine D2 receptor occupancy and antipsychotic blood concentrations examined using positron emission tomography, particularly for those agents presenting full dopamine D2 receptor antagonistic action.Reference Kapur, Zipursky and Roy 11 Additionally, this is sometimes referred to as the “therapeutic window” for the antipsychotic dose range in which efficacy is observed and tolerability is maintained. In a previous reportReference Kinon, Volavka and Stauffer 12 supporting this concept, no dose–response relationship was observed in three groups following olanzapine 10, 20, and 40 mg/day in an 8-week, fixed-dose RCT. Additionally, in a few clinical studies investigating various antipsychotics in patients with schizophrenia, each PANSS subscale score and dose–response at the time of efficacy onset could be observed, with no correlation between the efficacy endpoint and antipsychotics dose. 13-15
According to the results of a recently reported meta-analysis on the dose–response of antipsychotics, the relationship between dose and therapeutic response was reported to be different for each drug.Reference Leucht, Crippa and Siafis 16 It is indicated that the minimum clinically effective dose of asenapine for schizophrenia, one of the second-generation antipsychotics, is 10 mg/day, and the 95% effective dose is 14.97 mg/day.Reference Leucht, Crippa and Siafis 16 Although the target/maximum dose has been reported to be 10/20 mg/day, which is equal to the approved dose for schizophrenia in each country, the patients for whom 20 mg/day is effective is unknown.
It has been suggested that the presence of biological subtypes with different drug responsiveness in schizophrenia is one of the reasons for the variability in treatment response.Reference Howes and Kapur 17 , Reference Crow 18 However, this has not been clearly demonstrated. On the other hand, the treatment response to antipsychotics has been reported to be affected by the stage of schizophrenia, symptoms, sex, and age.Reference Carbon and Correll 19 Since the patient background was averaged among the treatment groups due to randomized allocation in the RCTs, the dose required for each patient’s clinical condition and background might not have been evaluated.
In this study, we classified patients into three clusters according to the characteristics of five PANSS-derived Marder factors for a 6-week randomized, double-blind, placebo-controlled trial of asenapine,Reference Kinoshita, Bai and Kim 14 and investigated the dose–response of asenapine in each cluster from the perspective of efficacy and tolerability.
Materials and Methods
Study design and patients
The institutional review boards of all participating sites approved this study protocol. Potential study participants received a detailed explanation of the study and provided written informed consent prior to engaging in any study-related procedures. Because the post-hoc analysis was anonymous, ethical approval was not deemed necessary by the institutional review boards. The study data were sourced from a 6-week multicenter, randomized, double-blind, placebo-controlled phase III trial of asenapine, carried out from May 2010 to April 2014 in Japan, Republic of Korea, and Taiwan.Reference Kinoshita, Bai and Kim 14 Study participants were males and females, ranging in age from 20 to 65 years and diagnosed with schizophrenia and acute exacerbation according to Diagnostic and Statistical Manual of Mental Disorders-IV-Text Revision (DSM-IV-TR) criteria. Patients were selected based on the following inclusion criteria: (a) assessment during the screening phase, (b) a total score of ≥60 on the PANSS at baseline, (c) scores of ≥4 on two or more PANSS positive symptom subscale items (delusion, conceptual disorganization, hallucinatory behavior, excitement, grandiosity, suspiciousness, and hostility), and (d) a score of ≥4 on the Clinical Global Impressions-Severity of Illness scale at baseline. The study consisted of three phases: a 3 to 7-day screening period which encompassed screening to baseline, a 6-week treatment period, and a follow-up period. During the screening phase, placebo tablets were administered twice daily in a single-blind manner. We excluded patients with a high placebo response—defined as a total score reduction of ≥20% on the PANSS during the screening phase. The 2-month episode period in this study was based on results obtained from short-term administration of study phases II and III.
Based on the results of the baseline assessment, the investigator selected eligible patients who were then randomly assigned (1:1:1) to receive sublingual asenapine 10 and 20 mg/day, or placebo. During the 6-week treatment period, asenapine or placebo tablets were administered sublingually, without water, twice daily. We administered the PANSS assessment at baseline and weekly thereafter over the entire 6-week treatment period. Physicians, patients, and raters in the study were all blinded to the treatment assignments of patients during the study. Inclusion criteria and other details of patients participating in this study were described by Kinoshita et al. Prior to study initiation, patients were tapered off any antipsychotic medication, including long-acting injections, antidepressant medications, and any antiparkinsonian drugs to treat extrapyramidal symptoms (EPS). Concomitant lorazepam and short-acting benzodiazepines were permitted for treating agitation and anxiety, and concomitant EPS medication was permitted if EPS worsened or appeared.
Statistical analysis
We defined a group of subjects who received at least one dose of the study drug as the All Subject Treatment (AST) group. Among the AST group, a group of subjects whose PANSS was measured at baseline and at least one time point after baseline was defined as the Full Analysis Set (FAS) group. The AST group was used for safety analysis, and the FAS group was used for efficacy analysis.
The scores of 30 items in PANSS at baseline were used for cluster analysis and the safety analysis group was classified into 3 clusters. PANSS Marder factor scores were calculated for each cluster.
The primary objective was to compare placebo and each dose of asenapine by cluster for the change in PANSS total scores at the final evaluation. The secondary objective was to compare placebo and each dose of asenapine by cluster for the incidence of adverse events and the drug induced extra-pyramidal symptoms scale (DIEPSS).Reference Inada 20
The change in PANSS total scores at the final evaluation was analyzed for the FAS group using analysis of covariance for each cluster. When a PANSS total score was missing, the last observation carried forward was used. In the model, the change in PANSS total scores was an objective variable, baseline scores were covariates, and treatment groups and region were factors.
Adverse events and DIEPPS were summarized for each cluster for the AST group. Adverse events were compared between each dose and placebo using a Fisher’s exact test. For background factors, the groups were compared using an ANOVA for continuous variables and a Chi-square test for category items.
Two-sided P-value of ≤.05 was considered to be significantly different. SAS 9.4 (SAS, version 9.4; SAS Institute, Inc., Cary, NC) was used for the analysis.
Results
In the present study, the AST population included 529 participants (Cluster-P: n = 75; Cluster-N: n = 151; Cluster-N: n = 303) and the FAS included 525 participants (Cluster-P: n = 75; Cluster-N: n = 151; Cluster-N: n = 299). Additional information is presented in the legend of Figures 1 and 2, and further details are provided in the Supplementary Material.
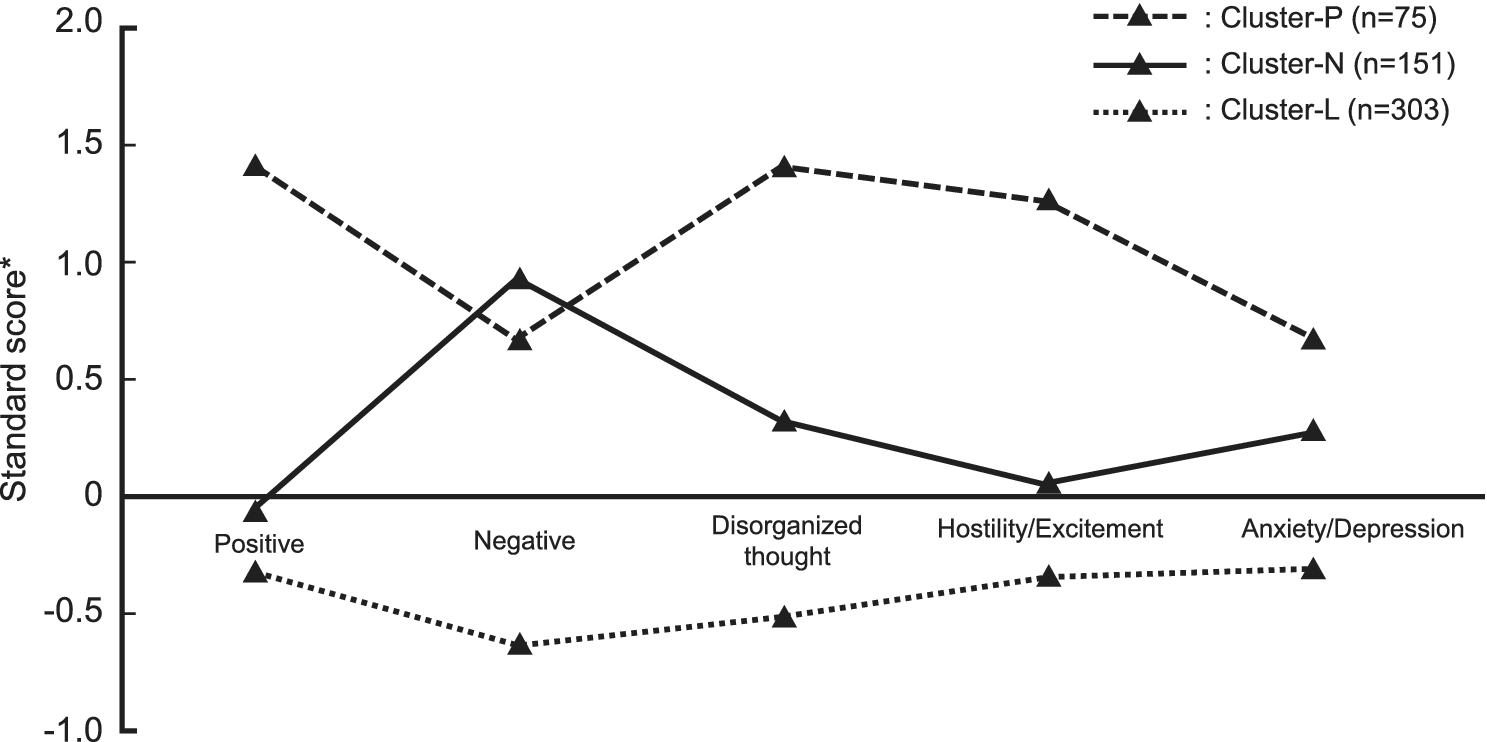
Patient classification by cluster analysis. Cluster analysis was carried out based on the scores of 30 items in the positive and negative syndrome scale (PANSS) at baseline. The characteristic of each cluster was represented by the PANSS Marder factor score at baseline as a standard score. Cluster-P included 75 participants (10 mg/d, n = 32; 20 mg/d, n = 22; placebo, n = 21), Cluster-N included 151 participants (10 mg/d, n = 41; 20 mg/d, n = 53; placebo, n = 57), and Cluster-L included 303 participants (10 mg/d, n = 102; 20 mg/d, n = 105; placebo, n = 96) as the AST population. Cluster-P, -N, and -L were explained in the results section. *Standard score: ([Mean value in each cluster] − [Mean value in full analysis set])/[Standard deviation in full analysis set].

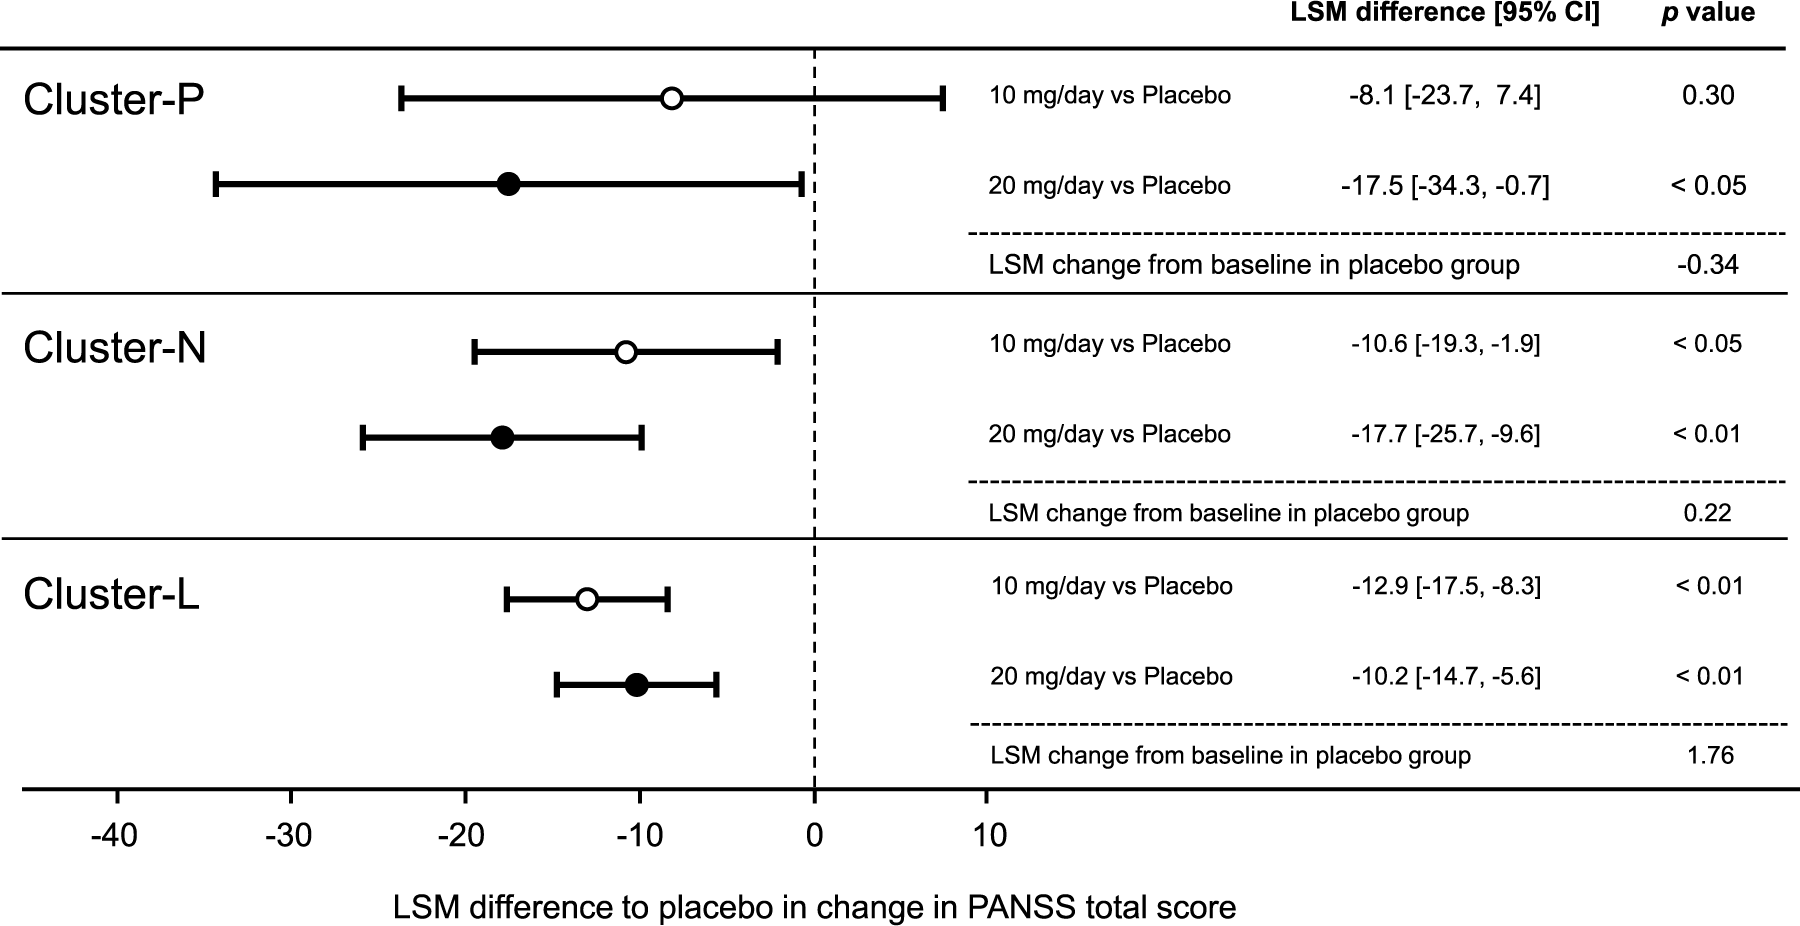
Change from baseline to end of treatment in positive and negative syndrome scale (PANSS) total score compared to placebo.
A total of 10 mg/d (○) and 20 mg/d (●) doses of asenapine were compared to placebo in PANSS total scores at the final evaluation in each cluster. Cluster-P included 75 participants (10 mg/d, n = 32; 20 mg/d, n = 22; placebo, n = 21), Cluster-N included 151 participants (10 mg/d, n = 41; 20 mg/d, n = 53; placebo, n = 57), and Cluster-L included 299 participants (10 mg/d, n = 100; 20 mg/d, n = 103; placebo, n = 96) as the full analysis set population. Cluster-P, -N, and -L were explained in the results section. LSM, least square mean.

Cluster analysis
A cluster analysis was performed excluding 1 subject with missing PANSS at baseline from the analysis of the AST group, and the rest of the subjects were classified into three clusters. They were comprised of a cluster with relatively high positive symptoms, disorganized thought, and excitement symptoms (Cluster-P), a cluster with relatively high negative symptoms (Cluster-N), and a cluster with overall lower scores (Cluster-L) (Figure 1).
Baseline characteristics and demographics
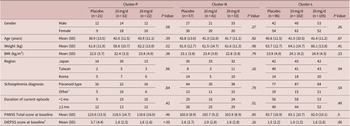
Table 1 shows a summary of background factors in each cluster. The mean PANSS total score [SD] at baseline in Cluster-P was 123.6 [13.5] in the placebo group, 118.5 [14.7] in the 10 mg/day group, and 119.6 [16.0] in the 20 mg/day group. In Cluster-N, the mean PANSS total score [SD] was 102.0 [8.9] in the placebo group, 102.7 [9.2] in the 10 mg/day group, and 102.9 [8.9] in the 20 mg/day group; while in Cluster-L, 83.7 [10.9] in the placebo group, 83.1 [10.7] in the 10 mg/day group, and 82.0 [10.1] in the 20 mg/day group. No significant bias was detected between the treatment groups in any cluster. Also, no significant bias was detected between the treatment groups in any cluster for other background factor items.
Baseline Characteristics and Demographics

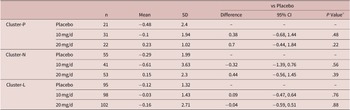
Abbreviations: BMI, body mass index; DIEPSS, drug induced extra-pyramidal symptoms scale; PANSS, positive and negative syndrome scale; SD, standard deviation.
a Included in disorganized type, catatonic type, and undifferentiated type.
b n = 21 (Placebo), n = 32 (10 mg/d) and n = 22 (20 mg/d) in Cluster-P; n = 56 (Placebo), n = 41 (10 mg/d) and n = 53 (20 mg/d) in Cluster-N; n = 96 (Placebo), n = 100 (10 mg/d) and n = 104 (20 mg/d) in Cluster-L.
Efficacy
The 10 mg/day group in Cluster-P showed no significant difference in the change in PANSS total scores at the final evaluation compared to the placebo group (difference: −8.14, P = .30), while the 20 mg/day group showed a significant improvement compared to the placebo group (difference: −17.46, P < .05). Both 10 mg/day and 20 mg/day groups showed significant improvement compared to placebo in Cluster-N and Cluster-L (Figure 2).
Safety
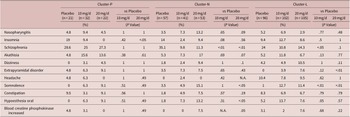
Table 2 shows the incidence of adverse events in each treatment group of the clusters. Events with a significantly higher incidence than the placebo were somnolence (20 mg/day) and hypoesthesia oral (20 mg/day) in Cluster-N, and somnolence (10 and 20 mg/day) and extrapyramidal symptoms (20 mg/day) in Cluster-L. There were no events with significantly a higher incidence than the placebo group in Cluster-P. On the other hand, the events with a significantly lower incidence than the placebo group were insomnia (20 mg/day) in Cluster-P, schizophrenia (10 and 20 mg/day) in Cluster-N, and schizophrenia (10 mg/day) in Cluster-L. No significant difference from the placebo group was observed in the change in DIEPSS at the final evaluation in any cluster (Table 3).
Incidence of Treatment Emergent Adverse Events (Occurring in ≥5% of Patients in At Least One Treatment Group)

Abbreviation: N.A., not available.
Change from Baseline to End of Treatment in DIEPSS Score

Abbreviations: CI, confidence interval; DIEPSS, drug induced extra-pyramidal symptoms scale; SD, standard deviation.
a Student’s t-test.
Discussion
This is the first report showing differences in efficacy and tolerability of asenapine according to doses when psychiatric symptoms of patients with acute schizophrenia are classified into certain clusters. In this study, we used data from 529 patients in the randomized, double-blind, placebo-controlled study of asenapine reported by Kinoshita et al.Reference Kinoshita, Bai and Kim 14
The results of the double-blind, placebo-controlled study used for the analysis in this study showed that PANSS total scores were significantly improved in the 10 and 20 mg/day groups compared to the placebo group, but there was no significant difference between the 10 mg/day and 20 mg/day groups at the final evaluation.Reference Kinoshita, Bai and Kim 14 However, this study yielded different results for Cluster-P. Cluster-P showed high scores not only for positive symptoms in which dopamine D2 receptors are mainly involved, but also for disorganized thoughts and hostility/excitement. Since dopamine D2 receptor occupancy in the brain following administration of asenapine of 4.8 to 9.6 mg/day is 68% to 93%,Reference de Greef, Maloney and Olsson-Gisleskog 21 it is considered that the improvement in PANSS scores obtained by administration of 20 mg/day is attributed to enhancement of clinical effects mediated by other receptors rather than an enhancement of dopamine D2 receptor blockade. Considering the high hostility/excitement score in Cluster-P, enhancing the sedative effects mediated by histamine H1 and adrenaline α1 receptor blockade following the administration of 20 mg/day might have been beneficial. The ratio of the affinities of asenapine for both histamine H1 and adrenaline α1 receptors has shown to be almost comparable unlike that of olanzapine, clozapine, and quetiapine when the affinity of asenapine for dopamine D2 receptors is used as a reference.Reference Shahid, Walker and Zorn 22 Therefore, it is hypothesized that a sedative effect necessary for the improvement of strong hostility/excitement was obtained by the use of 20 mg/day of asenapine in Cluster-P.
On the other hand, the reason why the significant difference was observed in Cluster-N with relatively high negative symptom factors at 10 mg/day compared to the placebo group may be explained by pharmacological characteristics. Asenapine has a slightly different receptor binding profile from other antipsychotics and has a higher affinity for the serotonin receptors (5-HT7 and 5-HT6) and dopamine D3 receptors, which have been suggested to be involved in cognitive function, than that for dopamine D2 receptors.Reference Shahid, Walker and Zorn 22 Similar reactivity has been reported for olanzapine.Reference Leucht, Crippa and Siafis 16 A meta-analysis showed that the clinical effects of olanzapine were enhanced by an increase in dose. However, a meta-analysis on the results of clinical studies of olanzapine in patients with predominantly negative symptoms showed that the clinical effect was improved from a low dose and did not enhance by an increase in dose; these results are similar to this study.Reference Leucht, Crippa and Siafis 16 Therefore, the effect of higher doses of olanzapine is slightly different from that of asenapine, as the clinical effect tends to decrease at higher doses. This difference may be due to the different affinities of olanzapine and asenapine for muscarinic M1 receptors.Reference Shahid, Walker and Zorn 22 Muscarinic M1 receptor blockade is known to reduce cognitive function.Reference Abrams, Andersson and Buccafusco 23 As compared to the affinity ratio for dopamine D2, the affinity ratio for muscarinic M1 receptors is almost similar for olanzapine, while it is very low for asenapine at approximately 1/1000.Reference Shahid, Walker and Zorn 22 Therefore, the difference between the two drugs at a high dose might reflect the difference in the affinity ratio for dopamine D2 and muscarinic M1 receptors.
The effect at 10 mg/day was observed in Cluster-L that is generally less severe; this may reflect the results of a meta-analysis of antipsychotics in relapse prevention studies.Reference Uchida, Suzuki and Takeuchi 24
When the rate of dropouts was compared using daily defined dose (DDD) between the standard dose group (1 DDD) and the low dose group (0.5 ≤ to < 1 DDD) 25 as an index, there was no significant difference in relapse prevention between the two groups, showing equivalent effects.Reference Uchida, Suzuki and Takeuchi 24 The DDD of asenapine is reported as 20 25 and according to the definition of this meta-analysis, asenapine 20 mg/day is equivalent to the standard dose group and 10 mg/day is equivalent to the low dose group. Therefore, it is hypothesized that 10 mg/day, which is equivalent to 0.5 ≤ to < 1 DDD, may also be a therapeutic dose for Cluster-L. This study was designed to evaluate acute phase schizophrenia and could not be directly compared with the results of the relapse prevention study. However, as the overall severity of psychiatric symptoms in Cluster-L was mild, they may have some pathological similarity with those in the relapse prevention study.
Although the predictors of schizophrenia prognosis have been reported, such as sex, symptoms, premorbid indication, family history, educational history, onset status, and duration of untreated psychosis, 26-29 none of these have been clearly implicated as a factor for determining the dose in clinical settings. The results of this study suggest that psychiatric symptoms based on PANSS Marder factors at baseline define the dose–response of antipsychotics despite the same patient background across different clusters (Table 1), which may be clinically useful.
From the perspective of safety, the types and occurrence of adverse events were different among clusters. In Cluster-P, there were no adverse events whose incidence in the 10 and 20 mg/day groups was significantly higher than in the placebo group. The incidence of insomnia was significantly lower in the 20 mg/day group compared to the placebo group. Since the levels of hostility/excitement were high in Cluster-P, a necessary sedative effect was obtained by using 20 mg/day, suggesting that Cluster-P requires an appropriate sedative effect. Since insomnia has been reported to be a factor that causes exacerbation of psychiatric symptoms,Reference Soehner, Kaplan and Harvey 30 improvement of insomnia may have contributed to improvement in overall psychiatric symptoms.
In Cluster-N, there were no adverse events with a higher incidence in the 10 mg/day group than in the placebo group. In contrast, the incidence of somnolence and hypoesthesia oral was significantly higher in the 20 mg/day group. Hypoesthesia oral is a transient local anesthetic effect of asenapine,Reference Stepanova, Grant and Findling 31 and no dose–response effect was observed with its incidence in the RCT.Reference Kinoshita, Bai and Kim 14 Although details remain unknown, it is interesting that the physical symptoms of hypoesthesia oral were only observed in the 20 mg/day of Cluster-N characterized strong negative symptoms Since somnolence was reported only in the 20 mg/day group, it may be important to select the dose for the patients in Cluster-N based on the occurrence of adverse events during their treatment history.
In Cluster-L, somnolence was observed at a significantly higher incidence in the 10 and 20 mg/day groups than in the placebo group. Furthermore, the incidence of extrapyramidal symptoms was significantly higher in the 20 mg/day group. Since neuropsychiatric disorders are considered to be secondary monoamine neurotransmitter disorders,Reference Ng, Papandreou and Heales 32 it is suggested that the change in the monoamine neurotransmitters may be small in Cluster-L with the mildest psychiatric symptoms. Therefore, the efficacy of asenapine is more obvious in Cluster-L particularly with the characteristics of low hostility/excitement, and thus, sedative effects seem to be observed from 10 mg/day. Also, regarding the significantly higher incidence of extrapyramidal disorder in the 20 mg/day group, it is suggested that the incidence was significantly higher in the 20 mg/day group than in the placebo group because the degree of change in dopamine neurotransmission was lower than in the other clusters. On the other hand, there was no significant difference between all clusters and the placebo group in the evaluation of drug-induced extrapyramidal symptoms severity using DIEPSS.Reference Inada 20
Differences were also seen in each cluster from the perspective of safety. We suggest that the sedative profile of asenapine worked more effectively in Cluster-P with high factors of positive symptoms, disorganized thoughts, and hostility/excitement, and the dose selection based on treatment history was more suited in Cluster-N and Cluster-L.
It is widely recognized that pharmacotherapy for schizophrenia requires high doses when the patient does not respond to or is resistant to treatment. 33-35 There was no index based on baseline psychiatric symptoms at the start of treatment. The results of this study have suggested the novel involvement of psychiatric symptoms based on PANSS Marder factors at baseline in the dose–response of asenapine, and a treatment strategy to be considered for Cluster-P, which has patients with relatively high positive symptoms, disorganized thoughts, and hostility/excitement, assuming that 20 mg/day is used at an early stage. Considering dose incrementation during the early stages of treatment with asenapine, it may be helpful as a predictor of asenapine response after 6 weeks of treatment. Early improvement in negative symptoms, poor attention and impulse control, and lack of insight predicted the 6-week treatment response with asenapine using the same dataset.Reference Ogyu, Noda and Yoshida 36 Prediction of both therapeutic response and dose–response is crucial during pharmaceutical treatment, and it may be necessary to evaluate asenapine treatment based on both aspects. In addition, from the perspective of continuous drug treatment, it is necessary to examine the dose of asenapine based on the difference in the profile of occurrence of adverse events in each cluster.
A possible factor influencing the treatment response to antipsychotics is polymorphism in the dopamine D2 receptorReference Rampino, Marakhovskaia and Soares-Silva 37 and individual differences in drug metabolizing enzyme activity due to cytochrome P450 polymorphism.Reference Scordo and Spina 38 Therefore, it should be noted that there may be individual differences in appropriate antipsychotics from the perspective of efficacy and safety even for a patient matching the cluster shown in the results of this study.
The heterogeneity of antipsychotic treatment response has led to the hypothesis that there are two biological subtypes of schizophrenia: a subtype with striatal dopamine neurotransmission overactivity and a subtype less responsive to antipsychotics with a different neurobiological basis.Reference Howes and Kapur 17 , Reference Crow 18 However, the results of a recently reported meta-analysis did not provide evidence for the hypothesis that the response to antipsychotics was uniform and the variability in clinical efficacy of antipsychotics may be caused by the presence of subtypes with different responses.Reference McCutcheon, Pillinger and Mizuno 39 One of the reasons was that the meta-analysis was performed for RCTs and the characteristics of psychiatric symptoms in each patient might have been averaged within the treatment groups following randomization. In contrast, a recent study has reported a biological classification on the basis of symptoms of schizophrenia. Chen et al. have shown that two distinct schizophrenia subtypes featuring predominant positive and negative symptoms could be predicted based on functional brain imaging data, with good accuracy from functional connectivity profiles of the ventromedial frontal cortex, temporoparietal junction, and precuneus used by international samples.Reference Chen, Patil and Weis 40 Moreover, classification using neurophysiological data has been reported.Reference Keil, Roa Romero and Balz 41 Keil et al. revealed three clusters that defined oscillatory power and linked temporal synchronization of time–frequency resolved Electroencephalogram (EEG) data to positive and negative symptoms in schizophrenia.Reference Keil, Roa Romero and Balz 41 Interestingly, these three clusters are highly similar to those reported in this study; the first was a cluster with relatively high positive symptoms, the second was a cluster with relatively high negative symptoms, and the third was a cluster with relatively low positive and negative symptoms. Therefore, it was strongly suggested that the clusters in this study also indicate different biological schizophrenia subtypes.
In this study, the optimal dose of asenapine for acute schizophrenia differed among clusters according to the characteristics of the PANSS Marder factors; our findings suggest that the optimal dose of antipsychotics was distinct among these clusters. The results of this study imply that different variants of optimal antipsychotic doses may exist and may prove to have important implications for treatment with antipsychotics thus contributing important suggestions for designing antipsychotic treatment strategies.
There are some limitations of this study. First, the study to be analyzed was conducted under the sponsorship of a pharmaceutical company. Second, only one RCT was included in the analysis, and the number of analyzed patients was limited. Owing to this limitation, the number of patients for each cluster differed greatly. Third, the study period was only 6 weeks, and the outcome was evaluated for a limited period. Finally, the efficacy evaluation of Cluster-P was likely to show differences due to high baseline values.
In the future, this method of evaluation should be performed using RCT results from long-term studies that include a larger number of patients, including those treated with other antipsychotics.
Conclusion
The dose–response of asenapine in the treatment of schizophrenia was evaluated by classifying patients into three clusters according to clinical conditions based on PANSS Marder factors. The results suggested that each cluster was qualitatively different from the perspective of efficacy and safety. The results of this study suggest the presence of biological subtypes of schizophrenia that seem to be clinically important.
Acknowledgments
Under the direction of Dr. Takekita, Dr. Kato, and Dr. Kinoshita, medical writing assistance and editorial support was provided by Honyaku Center Inc. All authors were involved at all stages of manuscript development, approved the final version of the manuscript to be published, and agreed to act as guarantors of the work.
Funding
This research received no specific grant from any funding agency, commercial or not-for-profit sectors.
Disclosures
Yoshiteru Takekita has received grant funding from Japan Society for the Promotion of Science, and speaker’s honoraria from Meiji-Seika Pharma, Dainippon-Sumitomo Pharma, Janssen Pharmaceutical, Otsuka, Eisai, MSD K.K. Daiichi-Sankyo, Pfizer, UCB Japan, Novartis and Ono Pharmaceutical. Naotaka Sunanda has received speaker’s honoraria from Meiji-Seika Pharma, Otsuka, Yoshitomiyakuhin and Ono Pharmaceutical. Nobuatsu Aoki has received speaker’s honoraria from Daiichi-Sankyo, Eli Lilly, Meiji-Seika Pharma, Janssen Pharmaceutical, Eisai, and Otsuka. Haruhiko Ogata has received speaker’s honoraria from Janssen Pharmaceutical. Masaki Kato has received grant funding from Japan Society for the Promotion of Science, SENSHIN Medical Research Foundation and Japan Research Foundation for Clinical Pharmacology, and speaker’s honoraria from Dainippon-Sumitomo Pharma, Otsuka, Meiji-Seika Pharma, Eli Lilly, MSD K.K., GlaxoSmithkline, Pfizer, Janssen Pharmaceutical, Shionogi, Mitsubishi Tanabe Pharma, Takeda Pharmaceutical, Lundbeck, and Ono Pharmaceutical. Toshihiko Kinoshita has received speaker’s honoraria from Otsuka, Dainippon-Sumitomo Pharma, Meiji-Seika Pharma, Janssen Pharmaceutical, Eisai, Daiichi-Sankyo, Takeda Pharmaceutical, Lundbeck and Ono Pharmaceutical. Toshiya Funatsuki, Chikashi Takano, Tomoyo Yanagida, Yosuke Koshikawa, Minami Naito, and Atsuko Yamamoto declare no conflicts of interest associated with this manuscript. Shuichi Hiraoka, and Yasuhiro Iwama are full-time employees of Meiji Seika Pharma, Co., Ltd.
Supplementary Materials
To view supplementary material for this article, please visit http://doi.org/10.1017/S1092852921000043.