Introduction
The term mild cognitive impairment (MCI), which covers a broad variety of cognitive impairment syndromes, was coined in the 1980s to refer to the intermediate stage of cognitive changes between normal aging and overt dementia (Petersen and Morris, Reference Petersen and Morris2005). MCI is usually categorized into amnestic MCI (with symptoms of impaired memory) and non-amnestic MCI, and the key differences are that amnestic involves memory impairment and non-amnestic involves non-memory domain impairment, which leads to impairment in cognitive functions (Malek-Ahmadi, Reference Malek-Ahmadi2016). Each subtype could be further classified into single-domain MCI and multiple-domain MCI (Huey et al., Reference Huey2013). It has been reported that up to 42% of the population aged over 60 are affected by MCI worldwide (Ward et al., Reference Ward, Arrighi, Michels and Cedarbaum2012). About 159 million people in China are over the age of 60, and an aging population has become a major concern in the country (Zhang et al., Reference Zhang2012). The prevalence of dementia was 4.38% among those over 65 years in China, and more than half of dementia patients were affected by Alzheimer's disease (AD) (Jia et al., Reference Jia2014a). Therefore, as an age-related chronic disease, dementia has become a public health concern, and early detection of MCI may guide clinicians to better predict the onset of dementia and AD.
Although the physical activities of patients are not affected (Van der Mussele et al., Reference Van der Mussele2014), individuals with multiple-domain amnestic MCI are associated with a high risk of AD, and amnestic MCI eventually triggers early-stage AD in many patients (Etgen et al., Reference Etgen, Sander, Bickel and Forstl2011; Malek-Ahmadi, Reference Malek-Ahmadi2016). Dementia is a degenerative process of many varieties including vascular dementia, fronto-temporal dementia, and dementia with Lewy bodies (Ahlskog et al., Reference Ahlskog, Geda, Graff-Radford and Petersen2011). However, some MCI patients remained stable and even may recover over time (Mitchell and Shiri-Feshki, Reference Mitchell and Shiri-Feshki2009). As suggested by Malek et al., cognitive abilities of MCI patients can be restored with an estimated reversion rate (RR) of 24% (Malek-Ahmadi, Reference Malek-Ahmadi2016). It was reported that clinic-based studies present a higher estimated RR than those in community-based studies. This heterogeneity remained a major challenge for the discovery of key factors for dementia prevention in MCI patients.
The RR of MCI patients reported by current literature contains a significant amount of variation (de Jager and Budge, Reference de Jager and Budge2005; Olazaran et al., Reference Olazaran2011), which may be attributed to difference in study baselines, such as population, sample size, subject selection criteria, and follow-up duration (Malek-Ahmadi, Reference Malek-Ahmadi2016). Also, large differences in the corresponding dementia rates (DR) among MCI patients have been reported by different studies (Rubin et al., Reference Rubin, Morris, Grant and Vendegna1989). One potential reason for this lies in the heterogeneity resulting from MCI definition inconsistency, MCI subtype, and patient selection (Mitchell and Shiri-Feshki, Reference Mitchell and Shiri-Feshki2009; Nie et al., Reference Nie2011). Thus, it is essential to carry out a systematic review to evaluate and summarize previous studies. The main goal of our research is to conduct a meta-analysis in order to explore the prevalence of MCI and the corresponding progression rate of MCI patients with respect to AD and dementia. We also expect to use this approach to determine the corresponding RR and stable rate (SR).
Material and methods
Inclusion criteria
Studies were considered eligible if they met the following criteria: (1) samples in the studies were original, (2) the clinical data are based on a number of firstly-assessed MCI patients, and (3) sufficient information regarding prevalence and progression is provided in the report. Studies were excluded if the above criteria were not satisfied. Two independent investigators cooperated to confirm the final included studies.
Search strategy
We searched Embase and PubMed for literature published from 1999 to June 2016 using the key words listed as follows: “MCI,” “prevalence,” “RR,” “stable disease,” “dementia,” and “AD.” All references acquired were reviewed by two independent reviewers to avoid omission. Detailed searching strategy is shown in Table S1, available as supplementary material attached to the electronic version of this paper at www.journals.cambridge.org/jid_IPG.
Data extraction
Two independent researchers conducted data extraction and documented author name, publication date, study design, settings, time of follow-up, sample size, baselines, methods of cognitive assessment, diagnostic criteria of MCI, prevalence rates and clinical outcomes, including stable disease rate (SR), RR, DR, and AR. If multiple studies included the same data set, the largest one or the one with the longest follow-up time interval was included. These data were rechecked by a third party researcher and any discrepancy was resolved by discussion.
Data analysis
We carried out the analysis using STATA version 12.0 (Stata Corp, College Station, TX, USA). The prevalence and progression rates were obtained by reported percentile and indirect data analysis. End points nearest to the baseline were retained if multiple end points existed during the calculation of progression rates, using effect size (ES) and 95% confidence interval (95% CI). Besides this, study size and follow-up time were taken into consideration and acted as a weighting factor in our meta-analysis to minimize systematic error. Additionally, we carried out sensitivity analysis of each index by excluding studies with the most publication bias. p-value for publication bias was calculated and the linear-fitted curves of the procedure were also obtained using Pearson's correlation to characterize the stability of each study.
Results
Study characteristics
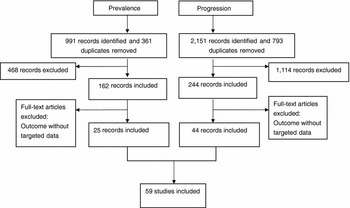
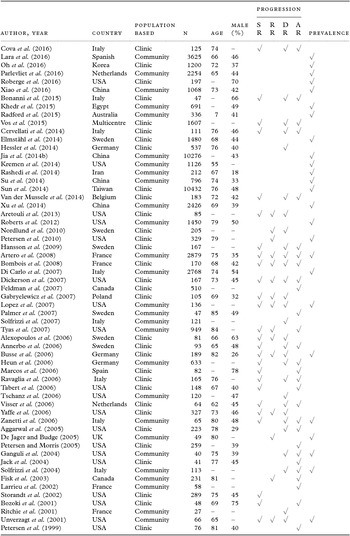
As shown in Figure 1, 3,142 studies were obtained by searching Embase and PubMed. 406 studies remained after duplicates were removed. 237 irrelevant studies were excluded during the full text-review. 59 studies from 1999 to 2016 were finally included in this meta-analysis (Petersen et al., Reference Petersen, Smith, Waring, Ivnik, Tangalos and Kokmen1999; Bozoki et al., Reference Bozoki, Giordani, Heidebrink, Berent and Foster2001; Ritchie et al., Reference Ritchie, Artero and Touchon2001; Unverzagt et al., Reference Unverzagt2001; Larrieu et al., Reference Larrieu2002; Storandt et al., Reference Storandt, Grant, Miller and Morris2002; Fisk et al., Reference Fisk, Merry and Rockwood2003; Ganguli et al., Reference Ganguli, Dodge, Shen and DeKosky2004; Jack et al., Reference Jack2004; Solfrizzi et al., Reference Solfrizzi2004; Aggarwal et al., Reference Aggarwal, Wilson, Beck, Bienias and Bennett2005; de Jager and Budge, 2005; Petersen et al., Reference Petersen2005; Alexopoulos et al., Reference Alexopoulos, Grimmer, Perneczky, Domes and Kurz2006; Annerbo et al., Reference Annerbo, Wahlund and Lokk2006; Busse et al., Reference Busse, Hensel, Guhne, Angermeyer and Riedel-Heller2006; Heun et al., Reference Heun, Kolsch and Jessen2006; Marcos et al., Reference Marcos2006; Ravaglia et al., Reference Ravaglia2006; Tabert et al., Reference Tabert2006; Tschanz et al., Reference Tschanz2006; Visser et al., Reference Visser, Kester, Jolles and Verhey2006; Yaffe et al., Reference Yaffe, Petersen, Lindquist, Kramer and Miller2006; Zanetti et al., Reference Zanetti, Ballabio, Abbate, Cutaia, Vergani and Bergamaschini2006; Di Carlo et al., Reference Di Carlo2007; Dickerson et al., Reference Dickerson, Sperling, Hyman, Albert and Blacker2007; Feldman et al., Reference Feldman2007; Gabryelewicz et al., Reference Gabryelewicz2007; Lopez et al., Reference Lopez2007; Palmer et al., Reference Palmer, Berger, Monastero, Winblad, Backman and Fratiglioni2007; Solfrizzi et al., Reference Solfrizzi2007; Tyas et al., Reference Tyas2007; Artero et al., Reference Artero2008; Bombois et al., Reference Bombois2008; Hansson et al., Reference Hansson, Buchhave, Zetterberg, Blennow, Minthon and Warkentin2009; Nordlund et al., Reference Nordlund, Rolstad, Gothlin, Edman, Hansen and Wallin2010; Petersen et al., Reference Petersen2010; Roberts et al., Reference Roberts2012; Aretouli et al., Reference Aretouli, Tsilidis and Brandt2013; Cervellati et al., Reference Cervellati2014; de Jager and Elmstahl and Widerstrom, Reference Elmstahl and Widerstrom2014; Hessler et al., Reference Hessler, Tucha, Forstl, Mosch and Bickel2014; Jia et al., Reference Jia2014b; Kremen et al., Reference Kremen2014; Rashedi et al., Reference Rashedi, Rezaei and Gharib2014; Su et al., Reference Su2014; Sun et al., Reference Sun2014; Van der Mussele et al., Reference Van der Mussele2014; Xu et al., Reference Xu2014; Bonanni et al., Reference Bonanni2015; Khedr et al., Reference Khedr2015; Radford et al., Reference Radford2015; Vos et al., Reference Vos2015; Cova et al., Reference Cova2016; Lara et al., Reference Lara2016; Oh et al., Reference Oh2016; Parlevliet et al., Reference Parlevliet2016; Roberge et al., Reference Roberge, Stortz, Frankel, Greene and Deng2016; Xiao et al., Reference Xiao2016). 52,304 individuals were involved, among which 19,742 patients came from clinic studies and 32,562 from community studies. Details regarding basic characteristics are presented in Table 1, including first author, year, country, source, age, gender, and major outcomes.
Flow chart of included studies.

Characteristics of studies included in the meta-analysis

Abbreviation: SR: stable disease rate; RR: reversion rate; DR: dementia rate; AR: Alzheimer's disease rate; MCI: mild cognition impairment.
Summary of prevalence and progression rates of MCI
Summary of prevalence and progression rates (SR, RR, DR, and AR) of MCI are listed in Table 2. According to the results of meta-analysis, the overall prevalence of MCI was 21% (95% CI = 17– 26%). Compared with clinic-based population (20%), community-based population appeared to have a higher incidence rate of MCI with a prevalence of 25%. As for progression rates, MCI had an overall chance of 48% with 95% CI from 37% to 58% to remain stable. The overall RR turned out to be 17% (95% CI = 9–25%), the overall DR was calculated to be 34% with 95% CI from 26% to 42%, while 31% (95% CI = 24–37%) of the patients developing AD. For clinic-based results, becoming stable was the most probable outcome for MCI (ES = 44%, 95% CI = 34–54%), while MCI patients were least likely to recover by themselves (ES = 10%, 95% CI = 6–14%). DR (ES = 39%, 95% CI = 31– 47%) and AR (ES = 35%, 95% CI = 27–43%) results were also presented. AR became the least frequent outcome in community-based results. Furthermore, when compared with clinic-based outcomes, SR (ES = 59%, 95% CI = 42–77%) and RR (ES = 26%, 95% CI = 15–37%) were recognizably higher in community studies, while a decrease was observed in DR (ES = 25%, 95% CI = 17–32%) and AR (ES = 19%, 95% CI = 14–24%) compared with results from clinical studies.
Summary of prevalence and progression rates of MCI

Abbreviation: SR: stable disease rate; RR: reversion rate; DR: dementia rate; AR: Alzheimer's disease rate.
Adjusted results after excluding biased studies
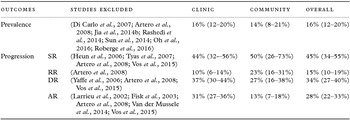
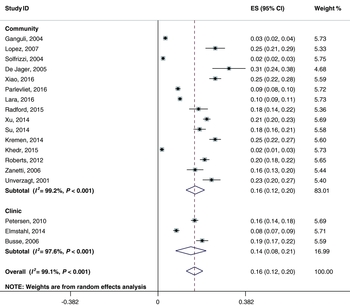
The results were reviewed to meet the requirements of our research, and some studies with little sample-capacity or large deviation from the overall results were excluded. The excluded studies were listed in Table 3, and the overall rates of each outcome were acquired for prevalence (ES = 16%, 95% CI = 12–20%), SR (ES = 45%, 95% CI = 34–55%), RR (ES = 15%, 95% CI = 10–19%), DR (ES = 34%, 95% CI = 27–40%), and AR (ES = 28%, 95% CI = 22–33%). These results were in accord with unadjusted conclusions that SR was the most frequent progression, while RR was the least common outcome. After comparing clinic-based and community-based results, MCI also presented a higher prevalence in clinics (ES = 16%, 95% CI = 12–20%) than in communities (ES = 14%, 95% CI = 8–21%). However, significant heterogeneity was observed in two subgroups and the overall group (community: I 2 = 99.2%, p < 0.001; clinic: I 2 = 97.6, p < 0.001; overall: I 2 = 99.1%, p < 0.001) indicating a strong inconsistency among different publications (Figure 2).
Results of sensitivity analysis

Studies were excluded due to influence analysis and publication bias.
Abbreviation: SR: stable disease rate; RR: reversion rate; DR: dementia rate; AR: Alzheimer's disease rate.
Forest plot of prevalence of mild cognitive impairment. Results are expressed as incidence rates and 95% CI.

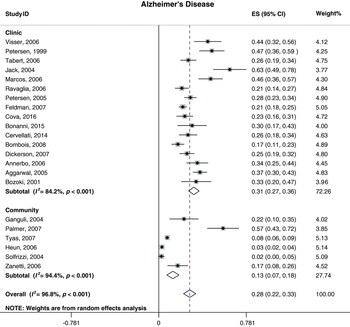
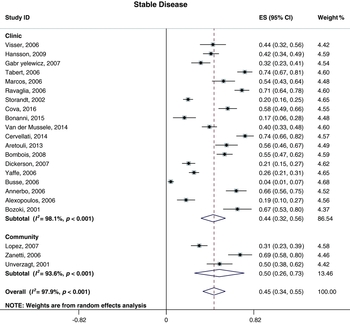
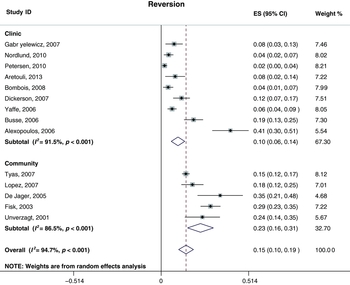
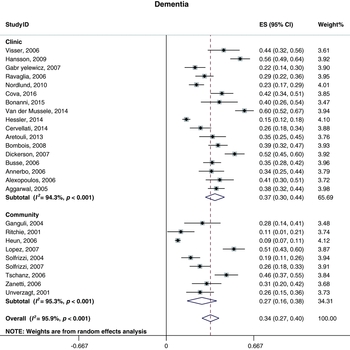
Similar trends could also be seen in the four branches of progression. AR became the rarest progression in community (ES = 13%, 95% CI=7–18%; Figure 3), and likewise there was an increase in SR and RR in community-based results (SR: ES = 50%, 95% CI = 26–73%; RR: ES = 23%, 95% CI = 16–31%) compared with clinic-based results (SR: ES = 44%, 95% CI = 36–56%; RR: ES = 10%, 95% CI=6–14%; Figures 4, 5), while DR (clinic: ES = 37%, 95% CI = 30– 44%; community: ES = 27%, 95% CI = 16–38%; Figure 6) and AR (clinic: ES = 31%, 95% CI = 27–36%; community: ES = 13%, 95% CI = 7–18%) both exhibited a decrease. Notably, the adjustment of our results lead to a slight decrease in almost all data, and there also existed strong heterogeneities in all outcomes with respect to progression (all I 2 > 50%, all p < 0.001) as shown in Figures 3–6.
Forest plot of Alzheimer's disease rate of mild cognitive impairment. Results are expressed as incidence rates and 95% CI.

Forest plot of stable disease rate of mild cognitive impairment. Results are expressed as incidence rates and 95% CI.

Forest plot of reversion rate of mild cognitive impairment. Results are expressed as incidence rates and 95% CI.

Forest plot of dementia rate of mild cognitive impairment. Results are expressed as incidence rates and 95% CI.

Robustness test with sensitivity analyses and publication bias analyses
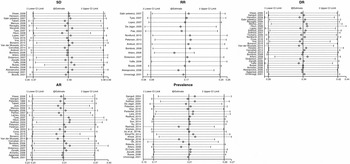
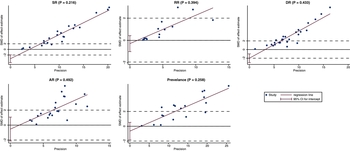
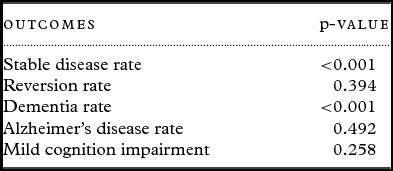
The results of sensitivity analysis were shown in Figure 7, which reflected the relationship between each individual study and the overall baseline. Obviously, none of the individuals’ result deviated significantly from the estimated overall result for all outcomes, indicating that none of them had a significant impact on the overall conclusion. p-value for publication bias was also evaluated for each index, and the specific linear-fitted curves for each study are shown in Figure 8 and Table 4. Among all five outcomes investigated, all p-values were greater than 0.05, indicating no significant differences and thus no publication bias could be derived, which was in agreement with the sensitivity analyses.
Influence analysis of SD, RR, DR, AR, and prevalence among observation results.

Publication bias of SD, RR, DR, AR, and prevalence among observation results.

p-value for publication bias

Discussion
We systematically reviewed studies on prevalence and progression of MCI from 1999 to 2016, comprised of 25 studies on MCI prevalence and 44 on the progression from MCI to other outcomes. Based on relevant studies, a pooled prevalence of 21% was concluded. The prevalence was corrected by excluding studies according to influence analysis and publication bias, resulting in a lower overall prevalence rate of 16%, which was consistent with the average prevalence of MCI of 18.9% (Petersen et al., Reference Petersen, Caracciolo, Brayne, Gauthier, Jelic and Fratiglioni2014). Over the past decades, higher estimates of prevalence have been reported due to the expansion of MCI's definition. In terms of study setting, the prevalence rate of MCI in clinic-based studies was 16%, higher than that of community-based studies (14%). On the contrary, RR in clinic-based studies was nearly the half of that in community-based studies. Malek et al. also concluded a lower RR in clinic studies than in community, consistent with our findings (Malek-Ahmadi, Reference Malek-Ahmadi2016). Several studies have demonstrated the correlation between outcome of MCI patients and their study environment. Petersen et al. revealed that patients from clinic-based assessments were more likely to have cognitive impairment or undergo MCI progression compared with those from communities (Petersen et al., Reference Petersen, Caracciolo, Brayne, Gauthier, Jelic and Fratiglioni2014), which explained the higher prevalence of MCI, DR, AR, and lower RR from clinic-based samples in our study. As higher SR indicates an increase in stable condition rather than deterioration into further cognitive impairment or recover, the higher SR in community may also be explained by this. It has also been suggested that the reasons are due to functional differences and that clinical samples may have advanced disease states (Farias et al., Reference Farias, Mungas, Reed, Harvey and DeCarli2009).
Notable variations were observed in both progression (SR: 4–74%; RR: 2–41%; AR: 2–63%; DR: 9–60%) and MCI prevalence (2–31%), indicating an obvious heterogeneity, which is consistent to previous reviews (Canevelli et al., Reference Canevelli2016)). Senility and gender are thought to be associated with MCI, but it is still unclear how these risk factors contribute to the heterogeneity of the study. The incidence rate of MCI was found to be significantly higher in males than in females (Roberts et al., Reference Roberts2012). In another study, greater risk of MCI was attributed to higher age, lower education, and higher blood pressure (Luck et al., Reference Luck, Luppa, Briel and Riedel-Heller2010). In this meta-analysis, the majority of the included studies had relatively a higher proportion of females than males, however, several authors included significant larger number of female participants, for instance Busse et al. (male representation: 26%) (Busse et al., Reference Busse, Hensel, Guhne, Angermeyer and Riedel-Heller2006) and Rashedi et al. (male representation: 18%) (Rashedi et al., Reference Rashedi, Rezaei and Gharib2014). The heterogeneity might be attributed to three studies with significantly lower prevalence (Ganguli et al., Reference Ganguli, Dodge, Shen and DeKosky2004; Solfrizzi et al., Reference Solfrizzi2007; Khedr et al., Reference Khedr2015). Khedr et al. included a relatively younger population (≥ 60 years) in their analysis, which might be a potential reason for lower prevalence (Khedr et al., Reference Khedr2015). Ganguli et al. demonstrated a notably lower estimations of prevalence, which may have resulted from the relatively lower percentage of male participants (Ganguli et al., Reference Ganguli, Dodge, Shen and DeKosky2004). In addition, the definitions of MCI applied by Khedr et al. and Ganguli et al. were restricted to memory problems alone. As discussed above, the decision to limit MCI criteria would result in lower prevalence of MCI in the research.
In a community-based study with 7,000 participants aged over 65 by Artero et al., age was also identified to be a significant risk factor in the progression from MCI to dementia (OR = 1.2, 95% CI = 1.4–40 for men; OR = 1.1, 95% CI = 1.1–1.2 for women) (Artero et al., Reference Artero2008). Jia et al. confirmed that old age was the most significant risk factor for AR and vascular dementia, with twice the prevalence in populations aged over 80 than in those aged between 75 and 79 (Jia et al., Reference Jia2014b). When considering the progression to dementia, lower DR was found to be linked with lower average age. In specific, studies conducted by Henu et al. observed a significantly lower DR (9%) compared with others (Heun et al., Reference Heun, Kolsch and Jessen2006), while DR results from Lopez et al. was the highest (51%) among community-based studies (Lopez et al., Reference Lopez2007). Accordingly, the average age of the latter study was nearly ten years older than the former.
The heterogeneity among the included studies was likely influenced by several factors arising from study design and baselines. Apart from the variations in study settings, senility and gender proportion were all potential sources of heterogeneity, suggesting that the prevalence or progression estimations should be adjusted after considering the age distribution. Moreover, studies from Europe, Asia and Oceania were also included in addition to the US. This variation on the country of origin, namely the underlying differences in population, education, and local healthcare might contribute to this heterogeneity. It has been reported that studies from North America and Europe had greater level of heterogeneity of RR than those from Asia (Malek-Ahmadi, Reference Malek-Ahmadi2016). MCI itself was also speculated to be a heterogeneous disorder with unidentified subtypes (Mitchell and Shiri-Feshki, Reference Mitchell and Shiri-Feshki2009). The high heterogeneity of each outcome may potentially impair the statistical power of our meta-analysis, which was amended after biased publications are excluded resulting in a more precise conclusion. However, this heterogeneity may still persist, since there existed an incompleteness of included data and disparity of MCI definitions, so a more unified evaluation system is required.
Conclusions
In summary, based on a total of 59 studies, adjusted prevalence and progression rates including SR, RR, DR, and AR in MCI patients were evaluated through meta-analysis. Senility and gender were concluded to be factors influencing the prevalence and progression of MCI. Age was also identified to be a dominant factor in the progression to dementia. A strong heterogeneity was observed in all results but no specific publication had significant impact on the overall results. This heterogeneity might result from variations in study design and baselines, and standardized MCI criteria were suggested to investigate clinical trials more systematically in the future.
Conflict of interest
None.
Description of authors’ roles
C. Hu and H. Qin designed the study, supervised the data collection and wrote the paper. D. Yu and X. Sun collected the data and assisted with writing the article. M. Zhang, L. Wang, and H. Qin were responsible for the statistical design of the study and for carrying out the statistical analysis.
Acknowledgments
It was funded by Shanghai Municipal Commission of Health and Family Planning (The risk of cognitive decreasing in mild cognitive impairment comorbided hypertension in community, Grant no. 201640298) and Shanghai Pudong New Area Science and Technology Committee (Investigation of the risk and the protective factors of mild cognitive impairment in community, Grant no. PKJ2016-Y29).
Supplementary material
To view supplementary material for this article, please visit https://doi.org/10.1017/S1041610217000473