INTRODUCTION
For an invading pathogen, the host's immune response is a key environmental variable determining establishment, survival and fecundity. The immune response against one pathogen may also affect these quantities in co-occurring infections, through cross-species effects. Furthermore, immune responses can influence the survival and fecundity of the host ‘resource’ itself, through energetic or immunopathological penalties. For these reasons the development of the host immune phenotype is a fundamental consideration in pathogen ecology, including the ecology of interactions between groups of co-occurring pathogen species. However, because vertebrate immunity is multi-faceted and complex, a key challenge for ecological studies of infection is to determine the most meaningful ways in which it can be measured. For instance, the functional compartmentalisation of the immune system and its tendency to operate through multiple counter-regulated effector arms (Reiner, Reference Reiner2007) means that host individuals probably cannot be thought of as displaying a single level of immunocompetence or resistance to all types of pathogen (Long and Nanthakumar, Reference Long and Nanthakumar2004; Viney, Riley and Buchanan, Reference Viney, Riley and Buchanan2005). Resistance to one pathogen, resulting from phenotypic commitment to one arm of the immune system, may produce susceptibility to other pathogens that are controlled by different arms. For some years this was exemplified by the concept that T-helper cell type 1 (Th1) responses are required for controlling microparasites, whereas T-helper cell type 2 (Th2) responses are directed against helminths: and each Th cell type is down-regulated by the other. More recently, however, the idea of a simple Th1 vs Th2 axis controlling Th cell responses has been, to some extent, superseded by the discovery of further cross-regulated Th cell subsets (discussed further below). Given this intrinsic complexity, the analysis of immune dynamics in natural populations will arguably be more incisive if it becomes possible to analytically ‘decompose’ the immune system into measurable elements that reflect its main functional arms (Graham et al. Reference Graham, Cattadori, Lloyd-Smith, Ferrari and Bjornstad2007). Although the immunological effects of infection in humans and laboratory rodent models are routinely dissected in great detail, the mainstream ecological literature contains little apart from relatively crude measures of ‘immune competence’ in the context of infection or individual host status (Viney et al. Reference Viney, Riley and Buchanan2005; Kennedy and Nager, Reference Kennedy and Nager2006). Methods are now available that will allow a far more sophisticated exploration of immune phenotypic variation in natural vertebrate populations. In the last 10–15 years great steps forward have been taken in understanding the regulation of adaptive immune responses by T-helper cells. At the same time the discovery of new innate immune receptors and responses by antigen presenting cells (APCs) that direct T-helper cell development have led to a greater knowledge of how the innate immune system translates information derived from pathogens into signals that drive adaptive responses (Janeway and Medzhitov, Reference Janeway and Medzhitov2002). Levels of mediators involved in this process provide measurable phenotypes that reflect responsiveness and functional bias in the immune system. Indeed, the measurement of detailed immunological phenotypes has often been valuable in describing infection in human populations (e.g. Roberts et al. Reference Roberts, Butterworth, Kimani, Kamau, Fulford, Dunne, Ouma and Sturrock1993; Grogan et al. Reference Grogan, Kremsner, Deelder and Yazdanbakhsh1998; Stewart et al. Reference Stewart, Boussinesq, Coulson, Elson, Nutman and Bradley1999; Cooper et al. Reference Cooper, Chico, Sandoval, Espinel, Guevara, Levine, Griffin and Nutman2001; Elias et al. Reference Elias, Wolday, Akuffo, Petros, Bronner and Britton2001; Turner et al. Reference Turner, Faulkner, Kamgno, Cormont, Van Snick, Else, Grencis, Behnke, Boussinesq and Bradley2003; Booth et al. Reference Booth, Mwatha, Joseph, Jones, Kadzo, Ireri, Kazibwe, Kemijumbi, Kariuki, Kimani, Ouma, Kabatereine, Vennervald and Dunne2004; Jackson et al. Reference Jackson, Turner, Rentoul, Faulkner, Behnke, Hoyle, Grencis, Else, Kamgno, Boussinesq and Bradley2004a; Babu et al. Reference Babu, Blauvelt, Kumaraswami and Nutman2006), albeit that these studies usually focus narrowly on the determinants of resistance/susceptibility or pathology rather than ecosystem function. Given this, the potential now exists to incorporate far more powerful immunological information into parasite community ecology than has previously been attempted. In the following review we outline some of the ways such detailed measurement of immune responses can increase the analytical power of ecological co-infection studies. We will also consider the immunological target variables and measurement techniques that might be most relevant.
Co-infection: the fundamental questions
Most individuals in natural vertebrate populations are infected with parasites and very often these occur as multiple infections, or ‘co-infections’, with more than one species (Esch et al. Reference Esch, Bush and Aho1990). Co-infection is of special biological importance if the outcome of multiple infections is different from that predicted if single-species effects were simply superimposed. In this case, the outcome could not be anticipated by a simple additive model, and special knowledge of the consequences of the co-infection state would be required to understand the dynamics of the host-parasite system. This potential for parasite×parasite interaction represents an important biological interest that has implications for the practical management of real-world systems where multiple infections are present. In any co-infection system there are therefore two fundamental initial questions, viewed either from the perspective of the host or parasite. Firstly, from the point of view of the parasite: is the overall mean abundance of any one species altered by the presence of another species or, in other words, does some form of interaction occur? Secondly, from the point of view of the host: do multiple-infection states drive hosts towards phenotypes different from those that would occur in single infection states?
With regard to the first of the two questions posed in the preceding paragraph, there is no doubt that interspecific competitive interactions, including facilitation (‘positive competition’), can occur between pathogens in individual hosts (Holmes, Reference Holmes1961; Christensen et al. Reference Christensen, Nansen, Fagbemi and Monrad1987; Behnke, in this special issue). Whilst these interactions can be mediated by a variety of resource or interference competitive mechanisms, they will often be driven indirectly through effects on the host immune system (Behnke, Wakelin and Wilson, Reference Behnke, Wakelin and Wilson1978; Behnke et al. Reference Behnke, Bajer, Sinski and Wakelin2001a). On the other hand, it remains controversial as to whether competitive processes are generally important in structuring communities of pathogens in nature (Stock and Holmes, Reference Stock and Holmes1988; Janovy, Clopton and Percival, Reference Janovy, Clopton and Percival1992; Lotz and Font, Reference Lotz and Font1994; Poulin, Reference Poulin1996; Rohde et al. Reference Rohde, Worthen, Heap, Hugueny and Guegan1998; Poulin and Luque, Reference Poulin and Luque2003; Lello et al. Reference Lello, Boag, Fenton, Stevenson and Hudson2004; Behnke et al. Reference Behnke, Gilbert, Abu-Madi and Lewis2005; Poulin, Reference Poulin2007), although there are a few instances where strong non-random patterns observed in field data have been followed up by definitive laboratory experiments (e.g. Jackson et al. Reference Jackson, Pleass, Cable, Bradley and Tinsley2006a; see also Jackson, Tinsley and Hinkel, Reference Jackson, Tinsley and Hinkel1998; Jackson and Tinsley, Reference Jackson and Tinsley2007).
The lack of widespread evidence of interspecific interaction between parasites in wild populations sits uncomfortably with at least two received facts. Firstly, the vertebrate immune system is known to make strong phenotypic commitments to different functional arms in response to infection (Mosmann et al. Reference Mosmann, Cherwinski, Bond, Gieldin and Coffman1986; Diaz and Allen, Reference Diaz and Allen2007; Reiner, Reference Reiner2007). These commitments can affect co-occurring (bystander) parasite species because they influence the fundamental balance of the immune system in terms of its bias towards particular effector mechanisms and also its overall level of responsiveness. There are clear examples in human populations where immune responses relevant to defence against one pathogen are modulated by infection with bystander pathogens. For example, helminth infections in humans have been shown to modulate responsiveness to Mycobacterium tuberculosis (see Stewart et al. Reference Stewart, Boussinesq, Coulson, Elson, Nutman and Bradley1999; Elias et al. Reference Elias, Wolday, Akuffo, Petros, Bronner and Britton2001). Secondly, a lack of non-random signals in field data is inconsistent with observations that interactions are often seen in empirical laboratory co-infection models. Understanding these apparent paradoxes is central to the relevance of parasite community ecology to the biology of host-parasite/pathogen interactions.
HOW MEASURING IMMUNE RESPONSES CAN HELP
Exposure vs resistance
Immune responses can be used in ecological infection studies in more than one context. In some cases they may correlate with and be used as a measure of exposure to infection. This might be the case for some specific antibody responses, for example IgG4 responses in human worm infections (Faulkner et al. Reference Faulkner, Gardon, Kamgno, Enyong, Boussinesq and Bradley2001; Turner et al. Reference Turner, Faulkner, Kamgno, Kennedy, Behnke, Boussinesq and Bradley2005), where levels may track the amount of antigenic stimulation. The same might apply to innate receptors involved in the recognition of pathogenic organisms, for example pattern response receptors of the types mentioned in sections below may sometimes be up-regulated by the presence of their ligands. In other circumstances, immune variables can be used as a functional measure of resistance or susceptibility. A potential complication may be that the distinction between immune responses as measures of exposure or protection can be blurred. Depending on the kinetics of parasite transmission and the induction and loss of immunity in individuals, there could theoretically be positive or negative associations between infection and mediators that are genuinely involved in protection (Woolhouse, Reference Woolhouse1992). For example, in young host cohorts with minimal acquired immunity to a pathogen, the induction of an (ultimately protective) immune response may initially depend directly on the force of infection, and therefore produce transient positive associations. On the other hand, in older hosts, some of whom will have acquired effective immunity, the resistant individuals with stronger protective immune responses may generate negative associations. Stratification of field samples by host age and longitudinal study designs with repeat observations for individuals (Woolhouse, Reference Woolhouse1992) may help detect such situations and identify correlates of resistance. Ultimately, the existence of direct experimental evidence from laboratory models for the role of particular mediators in resistance may add confidence to the interpretation of observational field data. For example, Th2 responses (production of antigen-specific IgE and type 2 cytokines) are associated with resistance in mouse-gastrointestinal nematode infection models (Gause, Urban and Stadecker, Reference Gause, Urban and Stadecker2003), and they also correlate negatively with these infections in age-stratified studies in humans, including re-infection studies, suggesting variation in such responses can be used as a predictor of resistance (Turner et al. Reference Turner, Faulkner, Kamgno, Cormont, Van Snick, Else, Grencis, Behnke, Boussinesq and Bradley2003; Jackson et al. Reference Jackson, Turner, Rentoul, Faulkner, Behnke, Hoyle, Grencis, Else, Kamgno, Boussinesq and Bradley2004a).
Cross-sectional association studies
Due to technical and logistical difficulties with capture-recapture studies and interventional experiments in the field, most work on parasite community structure has been based on cross-sectional epidemiological data (e.g. Esch et al. Reference Esch, Bush and Aho1990; Behnke, in this special issue), usually prevalences and/or counts. One approach with this type of data is simply to assign observed numerical associations between species to the effects of within-host interactions (e.g. Lello et al. Reference Lello, Boag, Fenton, Stevenson and Hudson2004; Cattadori et al. Reference Cattadori, Albert and Boag2007). Such associations can have multiple alternative explanations, requiring caution for their interpretation as evidence for interaction, let alone as estimators of interaction strength (Lello et al. Reference Lello, Boag, Fenton, Stevenson and Hudson2004). Non-interactive processes that lead to association include correlated age-dependent host exposure. For example, exposure to soil transmitted nematodes may co-vary with age in humans because geophagy reduces as children grow older. Such age-dependence can potentially be adjusted for statistically in some epidemiological data. However, it remains a major problem in field studies of non-human hosts, where age can be difficult to determine beyond a set of very broad categories unless individual sight-resight records are available, or a special technique such as skeletochronology is applied (in suitable lower vertebrates). In addition, differences in the temporal infection trajectories of different parasite species can generate apparent trends (Bottomley, Isham and Basanez, Reference Bottomley, Isham and Basanez2005), whilst altered pathogen-induced host mortality in co-infections might disguise some genuine interactions (Brown et al. Reference Brown, Mawa, Kaleebu and Elliott2006). Perhaps most importantly of all, there are often likely to be correlated age-independent transmission processes due to behavioural and fine-scale spatial variation (Booth and Dunne, Reference Booth and Dunne2004; Booth, Reference Booth2006; Pinot de Moira et al. Reference Pinot de Moira, Fulford, Kabatereine, Kazibwe, Ouma, Dunne and Booth2007) that cannot always be incorporated into an analysis. For instance, positive associations are frequently seen where parasites share similar transmission strategies, even when easily measured confounder variables are accounted for. A good example of this is the recurring confounder-adjusted positive association (Tchuem-Tchuenté et al. Reference Tchuem Tchuenté, Behnke, Gilbert, Southgate and Vercruysse2003; Faulkner et al. Reference Faulkner, Turner, Behnke, Kamgno, Rowlinson, Bradley and Boussinesq2005) between the soil-transmitted nematodes Ascaris lumbricoides and Trichuris trichiura discussed by Behnke in this special issue and considered further below. Also, it should not be forgotten that correlated underlying host susceptibility may generate non-random interspecific associations between pathogens. Thus there will often be environmentally-determined and intrinsic genetic or ontogenetic variability in pathogen-specific resistance in a host population that might produce correlated susceptibility to different pathogens. Finally, even when interspecific competition is detectable in associations amongst count or prevalence variables, the direction of the underlying interaction may sometimes be obscure. For example, two infections that compete by negative interference involving a common mechanism acting against both species might be positively correlated in count or prevalence data.
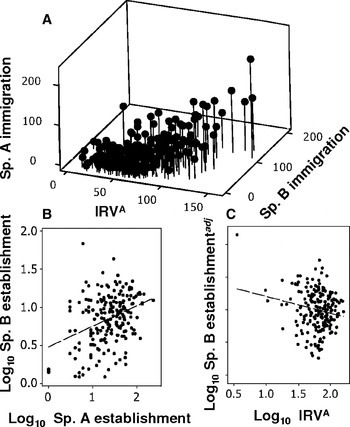
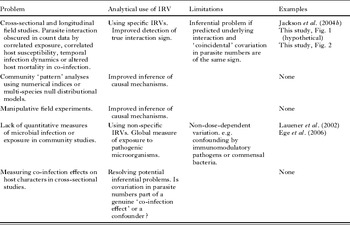
Potentially, therefore, correlated exposure or susceptibility, varying temporal infection dynamics, or even parasite-induced host mortality could obscure the numerical signature of competition or facilitation in field data based on individual counts or presence/absence alone (see Fig. 1). Even when such a signature is present, the numerical association may sometimes be of opposite sign to the underlying competitive interaction. Given these problems, the fact that many interactions between parasites and pathogens may be mediated through the immune system suggests that measuring functional specific immune response variables (IRVs) in field studies can be of great additional value (Table 1). This is because an IRV, which depends on within-host factors influencing immunogenicity and, in turn, influences parasite mortality processes, is partly independent from other sources of numerical covariation in parasite infection. Also, as IRVs can be key environmental drivers, their covariation with infection may reflect true interaction signs more clearly than covariation in count or prevalence data. In many circumstances, therefore, a specific IRV might be a better ‘index’ of the potential competitive force exerted by a given pathogen species than the numbers of that pathogen itself. A hypothetical example for two parasite species with strongly positively correlated exposure is illustrated by the quantitative simulation in Fig. 1. Here, one species (A) has an indirect negative influence on another (species B) via the immune response it stimulates. In this case, the amount of immune response (IRVA) against species A, can be related to the absolute numbers of species B (Fig. 1). As IRVA will be correlated with, but will partly vary independently from quantitative exposure to species A, it can be adjusted to be independent of the numbers of species A. This would result in removal, to a large degree, of the effects of correlated exposure between species A and B. Any residual association between adjusted IRVA and species B numbers, if it is of opposite sign to the association in worm numbers, may then be indicative of an interaction through the immune response. In the case of raw associations between IRVs and bystander species numbers that are of opposite sign to the numerical association in individuals, such adjustment is not necessary, as the clear inference is that an immune-mediated interaction has been revealed in the face of a contrasting covariation in numbers. Where both the parasite-parasite and adjusted IRV-parasite associations are of the same sign, interpretation remains problematical because IRVs may to some extent reflect past as well as present infection, and therefore adjustment for current infection may not perfectly account for covariation in exposure. Within certain limitations, therefore, measuring immune responses can provide a valuable extra dimension to the pair-wise analysis of competition amongst parasites and pathogens.
A simplistic numerical simulation that captures the opposing effects of quantitative covariation respectively generated by transmission processes and cross-immunity. Species A has a negative effect on species B via the immune response it generates (IRVA). The larval recruitment of both species and IRVA are highly positively inter-correlated due to non-independent transmission processes (e.g. Booth, Reference Booth2006). This is simulated (A) by generating random correlated data for each parasite and the immune response in 200 hosts. For the incoming parasite distributions, three random variables (x1, x2, x3) were generated from a negative binomial distribution using the negbin function from the R MASS library. Correlation was introduced by an overlapping sums method, so that numbers of species A, NA=x1+x2 and numbers of species B, NB=x1+x3. To simulate a correlated immune response, a further variable, x4 was generated from a normal distribution, so that IRVA=x1+x4. This gave data with strong inter-correlation (R=0·5–0·6) amongst the three variables. The parasite variables had means of 34–39 and variances of 1146–1220. The effect of species A on post-larval mortality in species B was simulated by (1/rsIRVA). NB, where rsIRVA was IRVA re-scaled to produce a mean mortality of 80% in the in-coming larval stages of species B. Species A establishment was assumed to be directly dose dependent. Although linear modelling suggested that the numbers of established species A and B were highly significantly positively associated (P<0·001) (B), inclusion of IRVA as an additional variate produced a significant negative association between IRVA and species B establishment (P<0·04). This is shown in (C) by the variation of species B residuals (adjusted for variation in species A) against IRVA. Although a high immune-mediated mortality in species B was necessary for the effect of IRVA to become detectable, this was due to the relatively tight inter-correlation of incoming infective stages and IRVA. However, with greater decoupling of immune responses from current infection abundance, which might realistically occur due to long-term and time-lagged build-up of immunity, this association would become more detectable. Furthermore, whilst the present simulation does not take into account functional specific responses against species B, and their possible inter-correlation with responses against species A, such responses could be measured and included in any regression analysis (see example in text).

Potential uses of immune response variables (IRVs) in improving inference in field studies of co-infection

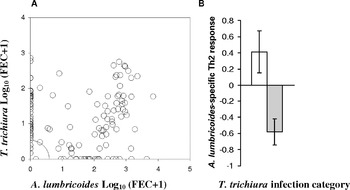
Going beyond simple cross-sectional designs, the addition of a longitudinal component to studies can provide stronger insights into competitive processes by revealing temporally variable or time-lagged patterns of covariation amongst parasite and immune variables. For example (Jackson et al. Reference Jackson, Turner, Rentoul, Faulkner, Behnke, Hoyle, Grencis, Else, Kamgno, Bradley and Boussinesq2004b) in an age-stratified study of the recolonization of anthelmintic-treated human hosts by gastrointestinal nematodes found that despite positive covariation in the per infection fecundity (Fig. 2A) of A. lumbricoides and T. trichiura, each species showed negative fecundity associations with an overall measure of anti-nematode Th2 immune responses at different points within the study design. These associations were restricted to a younger host age class (4–13 years). Whilst only A. lumbricoides fecundity was negatively associated with contemporary Th2 responses in the baseline data, at a later sampling point placed 8–9 months after treatment only T. trichiura fecundity was negatively associated with baseline Th2 responses. Across all age strata, relatively low re-colonization was also recorded for T. trichiura in comparison to A. lumbricoides at the later sampling point, and host re-infection probability for T. trichiura was negatively associated with baseline anti-nematode Th2 responses. Furthermore, a re-visitation of these data confirms that T. trichiura re-infection probability was strongly negatively associated (P<0·01) with A. lumbricoides-specific Th2 responses when T. trichiura-specific responses and A. lumbricoides abundance were adjusted for (Fig. 2B). For this re-analysis, interleukin (IL)-5 and IL-13 recall responses to species-specific antigens were ‘grouped’ for each species by taking the sum of the two variables after they had been standardized (zero mean, unit standard deviation). The grouped anti-A. lumbricoides Th2 variable was then analysed in a general linear model, with age group, sex and T. trichiura re-infection group as factors and anti-T. trichiura Th2 response and A. lumbricoides infection variables (baseline and 8–9 month) as covariates. The significant cross-species immunity effect confirmed here is the type of correlational ‘signature’ that would be expected where two species interact negatively via the induction of similar immune responses. Furthermore, the negative associations seen with the immunological variables suggest that at least one of the respective species populations, under the conditions studied, probably depresses the other via induced immune responses, despite the existence of the positive correlation in fecundity data.
Using immunological variables to infer negative parasite interactions against a probable background of positive correlation in exposure: an example based on data from Jackson et al. (Reference Jackson, Turner, Rentoul, Faulkner, Behnke, Hoyle, Grencis, Else, Kamgno, Bradley and Boussinesq2004b). A. Correlated occurrence (based on faecal egg count, FEC, data) of Ascaris lumbricoides and Trichuris trichiura in humans at Nyomo, Cameroon in baseline data from a treatment/re-infection study. Data point size proportional to number of observations (note large double zero point at origin). Prevalence of the two species was also significantly positively associated before and 8–9 months after treatment. B. Despite positive interspecific covariation in count and prevalence data, an analysis of A. lumbricoides- specific Th2 responses indicated that these were negatively associated with T. trichiura recolonization at 8–9 months post-treatment, even when T. trichiura-specific responses and A. lumbricoides FEC were accounted for (see text). Open and shaded bars respectively indicate hosts not re-infected and re-infected by T. trichuira; anti-A. lumbricoides Th2 responses (y-axis) are represented by residuals from a general linear model (Age class+Sex+anti-T. trichiura Th2 responses+A. lumbricoides FEC at baseline+A. lumbricoides FEC at 8–9 months).

Community-level comparisons
In addition to within-population studies analysing the pair-wise covariances of parasite species amongst individual hosts, the distributions of multiple species in ‘communities’ can also be compared amongst individual hosts or groups of hosts (Poulin, Reference Poulin2007). These comparisons can use derived measures of community composition, such as indices of diversity (the species diversity of a community), dominance (the tendency of one or a limited number of species to dominate the community numerically) or similarity indices (measures of compositional similarity between different communities). They might also use distributional metrics, for example nestedness (Poulin, Reference Poulin1996), that reflect the tendency of species to occur with some kind of non-random order. When groups of hosts are compared, these may represent populations at different locations or times (Behnke et al. Reference Behnke, Barnard, Bajer, Bray, Dinmore, Frake, Osmond, Race and Sinski2001b, Reference Behnke, Harris, Bajer, Barnard, Sherif, Cliffe, Hurst, Lamb, Rhodes, James, Clifford, Gilbert and Zalat2004; Bajer et al. Reference Bajer, Behnke, Pawelczyk, Kulis, Sereda and Sinski2005), or groupings within populations stratified according to some variable of interest such as age or sex. Community-level patterns, and departures from null distributional models, can give important clues about the processes driving assemblage formation (Poulin, Reference Poulin2007). An interesting possibility is that measures of individual host immune phenotypes could provide a valuable contribution to the interpretations based on the numbers or occurrence of parasites alone (Table 1). If dominance, similarity or diversity indices or particular non-random distributional patterns were associated with immune phenotypic variation, this might provide new insights into immune-mediated processes that could determine community structure. For instance, is it possible to distinguish a ‘non-interactive’ community structured by positive correlation in exposure from a community with random exposure that is structured by a parasite driving non-specific immunosuppressive effects and hence positive effects on survival in other species? In both cases, one might expect to see positive correlations between species, and perhaps positive associations between some individual species and measures of community diversity. However, if immunological variables were measured, there might be specific predictions to distinguish between the two types of community. In the case of a non-specifically immunosuppressive parasite, for example the heligmosomatid nematodes discussed elsewhere in this special issue (see Behnke), it might be predicted that the ‘suppressor’ species would be strongly associated with immune hypo-responsiveness or increased activity of regulatory mediators (Elliott et al. Reference Elliott, Setiawan, Metwali, Blum, Urban and Weinstock2004; Wilson et al. Reference Wilson, Taylor, Balic, Finney, Lamb and Maizels2005; Finney et al. Reference Finney, Taylor, Wilson and Maizels2007). Specific regulatory responses against this species (for example antigen-specific regulatory cytokine production in cellular recall assays) might also be expected to covary positively with community diversity and perhaps negatively with dominance. There might also be negative associations between a suppressor species and specific functional responses against other species in the community. Furthermore, similar communities in which the suppressor species is absent might be expected to show increases in the magnitude of specific immunity against remaining community members, and also changes in the relationships of specific IRVs with the abundances of their target species.
Experimental studies
Ultimately, correlational field studies may allow inferences to be made about underlying processes, but usually cannot determine cause and effect. Manipulative field experiments, possibly in conjunction with laboratory studies, will be necessary to fully understand the importance of interaction in parasite communities. A range of field experimental designs could be envisaged, including the addition or removal of some elements of the community (Graham et al. Reference Graham, Cattadori, Lloyd-Smith, Ferrari and Bjornstad2007; Pedersen and Fenton, Reference Pedersen and Fenton2007) or, the manipulation of host immune responses, such as increasing specific responses to one pathogen by vaccination. If based solely on responses in infection variables (e.g. prevalence or abundance) this type of study could demonstrate the principle that the overall mean population levels of one species can be affected by another. However, unless very simple communities are studied, or study designs become very complex, it is possible that the true magnitude of pair-wise competition would still be obscured by readjustments within multi-species interaction networks. For instance, removal of a non-specifically immunosuppressive species might result in decreases in the abundance of other pathogens. However, these pathogens, in a more immunologically responsive host environment, might then additionally undergo increased immune-mediated negative competition with each other. This, in turn, would mean that any observed population decreases might overestimate the direct effects of the ‘immunosuppressor’ species in the original community. Indeed, in general, the removal of one species might result in a variety of numerical responses in other community members that could be due, directly, to the absence of interaction with the removed species or, indirectly, to an altered interaction with other species whose behaviour in the host ecosystem has been modified by the removal. Whilst scenarios such as these are likely to form ‘knotty’ real-world problems, it is arguable that changes in immunological variables in the original and manipulated community might help understand the mechanisms involved and increase the interpretative power of field experiments (Table 1).
Markers of microbial infection pressure
The consideration of immunology may be especially relevant to the study of communities where interactions involving microbes are being considered. Indeed, given the possibility that the host immune system and its associated community of parasites and pathogens represent a complex mutually interdependent system, artificially limiting studies to just a subset of pathogens may ignore important dynamics driving real-world systems. Unlike metazoan parasites, where individuals can be counted, staged and identified with careful work by a competent parasite taxonomist, the infection levels of bacteria and viruses are often less easy to quantify. In fact, it may be impossible even to identify all of the species present. Measuring the broad immunological consequences of infection with certain types of pathogen, for example, stereotypical anti-viral or anti-bacterial pattern responses (see below), might therefore be a powerful way to summarise exposure to particular ‘types’ of microbial infection in co-infection studies (Table 1). In the context of anti-bacterial responses, it is worth mentioning that the immunological influence of commensal bacteria in the gut may be an important consideration. Interpretational problems might also arise if some pathogens are present that modulate innate immune activity independent of stimulation by co-infecting microbes.
Consequences of co-infection for the host
Leaving aside the existence of competition or facilitation between pathogen species, the consequences of co-infection for the status of the host itself (e.g. Graham et al. Reference Graham, Lamb, Read and Allen2005) are also of great interest and relate to the second fundamental question identified above. Field studies in this area (which are surprisingly rare) might potentially focus on response variables reflecting host condition or fitness. Examples might include specific measures of pathology, the degree of reproductive activity or investment, or markers of stress or adverse physiological states. This type of analysis has sometimes been approached by comparing hosts grouped according to the sets of species they contain, without considering individual infection intensity in the respective pathogens. In the case of correlated exposure rates or correlated underlying susceptibility (see above), this may confound the effects of genuine functional interactions with simple dose-dependent effects in the individual species. Here, to fully dissect ‘true’ co-infection effects from phenomena linked to coincidentally correlated transmission and establishment rates would require the measurement of interactions on the response variable with respect to intensity of the co-infecting parasites. A further complication arises where the mechanism of interspecies interaction produces immunological facilitation of one species by the other. In this instance, allowing for covariation in parasite numbers that results directly from the within-host interaction through the immune system would actually be removing some of the special effects of co-infection. This type of inferential problem highlights the importance of understanding underlying immunological mechanisms involved in pathogen×pathogen interactions (Table 1).
The complexity of the immune system
Often, in order to be meaningful, the immunological variables measured in field studies must have some relationship with other biologically significant aspects of the host's phenotype. This could be resistance to particular pathogens or parasites, or some biological marker of condition or fitness. A problem with the analysis of immune responses in ecological studies has been the fact that crude global measures (e.g. blood cell counts, lymphoid organ size, phytohaemagglutinin response, non-specific lymphocyte responsiveness, total circulating antibody levels, levels of complement activity), whilst not to be discounted as useful measures of overall investment, may not always correlate well with biologically significant phenotypic variation (e.g. Goüy de Bellocq et al. Reference Goüy de Bellocq, Porcherie, Moulia and Morand2007; Scharsack et al. Reference Scharsack, Kalbe, Harrod and Rauch2007). This is probably because the type of immune response elicited (e.g. which subset of lymphocytes) rather than overall immune responsiveness may determine resistance to particular pathogens. In other words, similar amounts of resources devoted to different effector arms may have very different consequences in terms of the resistance – susceptibility profile of the host. Consequently, in a situation where resources are limited, different response types may ‘trade-off’ against each other (Graham et al. Reference Graham, Cattadori, Lloyd-Smith, Ferrari and Bjornstad2007) and, in turn, against other non-immunological life-history traits (Martin et al. Reference Martin, Pless, Svoboda and Wikelski2004, Reference Martin, Weil and Nelson2006).
Given the complexity of the immune system, which elements represent the best targets for measurement in immuno-ecological studies? Whilst this is not the place for a full description of how vertebrate immunity works (for this see, for example, Janeway et al. Reference Janeway, Travers, Walport and Shlomchik2006), it will be useful to briefly describe components that reflect the responsiveness and functional bias of the immune system and that present easily measurable phenotypes. Of central interest is the T helper cell system, which can be divided into distinct phenotypes that drive different regulatory or effector responses. Naïve Th cells are thought to be multipotent, with phenotypic commitment at maturation being controlled by signalling from APCs. Also of great interest is the responsiveness of PRRs, of which the Toll-like receptor (TLR) system is a particularly important example. These innate receptors have wide specificities to molecular patterns that occur on broad categories of pathogen (Pathogen-Associated Molecular Patterns, PAMPs). Typically, one receptor will recognise patterns derived from one or more higher taxonomic grouping of organisms rather than an individual pathogen species or strain. There may also be responses to some endogenous ligands that provide ‘danger signals’ of pathological damage (Matzinger, Reference Matzinger2002). PRRs therefore detect the presence of an invading pathogen, or the damage that it causes. The signalling generated can initiate rapid innate responses. In addition, it can activate APCs and influence their maturation so that they polarize particular Th cell phenotypes (Janeway and Medzhitov, Reference Janeway and Medzhitov2002). It is also important to recognise that the innate-adaptive interaction is not a simple ‘one-way’ control circuit and immuno-regulatory signals generated during adaptive responses also feed back to channel the activities of cells functioning in innate immunity.
T helper cells
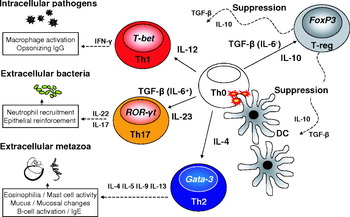
CD4+ Th cells are central to the control of adaptive immunity, producing signals that are fundamental to the development of both cellular and humoral responses. As introduced above, mature Th cells show functional division (Fig. 3) and provide cytokine and other signals, including help to B cells, that drive particular effector responses. Secreted cytokines may act locally, but also contribute to a systemic background influencing further innate and adaptive responses. The phenotype of Th cells is reflected in their cytokine production (Fig. 3), and global measurements of these molecules in cell populations can therefore be used to describe the functional balance of the immune system (Graham et al. Reference Graham, Cattadori, Lloyd-Smith, Ferrari and Bjornstad2007). At present four major phenotypic Th types can be defined, although, in reality, individual cell phenotypes may fall across a complex continuum. In simplified terms, Th1 cells produce responses appropriate for defence against intracellular pathogens. Typically, polarization of Th1 cells is associated with the presence of IL-12, and mature T-cells express the transcription factor T-bet and produce interferon (IFN) -γ. Th2 cells drive responses against extracellular parasites, such as parasitic worms. Mature Th2 cells express the transcription factor Gata-3 and secrete cytokines including IL-4, IL-5, IL-9 and IL-13. Until recently a simple counter-regulation of the Th1 and Th2 arms was thought to be the main control mechanism for Th responses (Mosmann et al. Reference Mosmann, Cherwinski, Bond, Gieldin and Coffman1986). Indeed, this Th1-Th2 paradigm may capture a significant amount of real variation and has been important in understanding resistance-susceptibility variation in a variety of pathogens (Scott et al. Reference Scott, Natovitz, Coffman, Pearce and Sher1988; Cliffe and Grencis, Reference Cliffe and Grencis2004). It is now recognized that there are also regulatory subsets of CD4+ and CD8+ (Jiang and Chess, Reference Jiang and Chess2004) cells that exert an overarching down-regulatory control on effector cell types. The diversity of regulatory Th cell subsets (Treg) is complex and has not been fully defined (Bluestone and Abbas, Reference Bluestone and Abbas2003; Weaver et al. Reference Weaver, Harrington, Mangan, Gavrieli and Murphy2006), but typical phenotypic characters can include persistent expression of the activation marker CD25 (Sakaguchi et al. Reference Sakaguchi, Sakaguchi, Asano, Itoh and Toda1995) and the transcription factor FoxP3 (Ramsdell, Reference Ramsdell2003). Regulatory cells can be induced in the presence of IL-10 (Wakkach et al. Reference Wakkach, Fournier, Brun, Breittmayer, Cottrez and Groux2003) and transforming growth factor (TGF)-β (Chen et al. Reference Chen, Jin, Hardegen, Lei, Li, Marinos, McGrady and Wahl2003), and also actively secrete one or both of these cytokines. Furthermore, a new functional category of effector T cells with distinctive properties has recently been characterized. These are the Th17 subset (Reiner, Reference Reiner2007; Zhou et al. Reference Zhou, Ivanov, Spolski, Min, Shenderov, Egawa, Levy, Leonard and Littman2007) that typically express the transcription factor ROR-γt and secrete IL-17 and IL-22. Th17 cells are thought to be important for pathogens localised at cell membranes, driving neutrophil recruitment and the reinforcement of epithelial defences.
Division of the immune system into functional arms: diversity in Th cell subsets. Schematic figure to show that under the influence of signals from antigen presenting dendritic cells (DCs), naïve Th cells (Th0) develop either into regulatory cells (Tregs) with over-arching suppressive functions, or into one of three mature phenotypes that drive different terminal effector mechanisms (boxed) appropriate for defence against different pathogen types. Systemically detectable cytokines are associated with the induction (solid lines) and subsequent function (dotted lines) of each effector phenotype.

In immuno-ecological studies, phentotypic commitment to each of these arms could be measured by the relative levels of production of their associated cytokines. These could be in vivo global measurements (from serum) or ex vivo measurements from defined cell subsets, either reflecting constitutive production or production under specific stimulatory conditions (e.g. antigen recall assays). Direct measurements of some circulating antibody isotypes may also, to some extent, reflect Th1/Th2 variation. IgE and, in humans, IgG4 may be a marker for a Th2-biased phenotype. Also, levels of IgG1 and IgG2a respectively reflect levels of Th2 and Th1 activity in mice (Finkelman et al. Reference Finkelman, Katona, Mosmann and Coffman1988). Transcription factor or cytokine expression could also be measured by quantitative real time reverse transcription PCR (Q-RT-PCR) although, in practice, direct measurements of protein production may be a more sensitive and reliable option. On the other hand, PCR expression analyses may allow rapid processing of samples in the field and provide feasible protocols where cold storage or cell culture facilities are inaccessible, or where non-model organisms are the object of study (see below).
Immuno-ecological studies of the type envisaged would generate large multivariable data-sets. Indeed, it is likely that multiple measurements of different immune mediators would often be desirable to increase the reliability of the phenotypic description (for example, more than one cytokine with over-lapping pleiotropic functions may often be measured to reflect a particular Th response type). In such cases, the employment of a multivariate technique, such as principal components analysis (PCA), prior to further analysis may help reduce multiple immune measures into a smaller set of variables, each of which is a linear combination of the original measures. The use of reduced data to carry out central hypothesis tests may be especially helpful to avoid difficulties in interpretation due to multiple testing (e.g. Jackson et al. Reference Jackson, Turner, Rentoul, Faulkner, Behnke, Hoyle, Grencis, Else, Kamgno, Boussinesq and Bradley2004a, Reference Jackson, Turner, Kamal, Wright, Bickle, Else, Ramsan and Bradley2006b). Reduced immunological variables might be used to represent different Th phenotypes, or combinations of phenotypes (e.g. Turner et al. Reference Turner, Faulkner, Kamgno, Cormont, Van Snick, Else, Grencis, Behnke, Boussinesq and Bradley2003; Jackson et al. Reference Jackson, Turner, Rentoul, Faulkner, Behnke, Hoyle, Grencis, Else, Kamgno, Boussinesq and Bradley2004a, Reference Jackson, Turner, Rentoul, Faulkner, Behnke, Hoyle, Grencis, Else, Kamgno, Bradley and Boussinesqb). A similar approach can also, potentially, be adopted to simplify variation in inter-correlated multi-species parasite communities (Legendre and Gallagher, Reference Legendre and Gallagher2001). Host individuals can thus be visualised in a multi-dimensional phenotypic space delimited by a relatively small number of composite immune response or parasite susceptibility variables. Associations between continuous immunological and infection variables can then be analysed by standard univariate statistical modelling techniques. Alternatively, individuals that are ordinated in the phenotypic spaces can be grouped or clustered and then group or cluster membership can be analysed with respect to other variables of interest.
Innate responses through PRRs
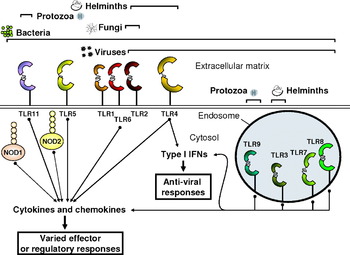
A further measure of functional disposition in the immune system is the expression and signalling responses of PRRs on and in cells (Fig. 4). In general, the expression levels and responsiveness of PRRs, such as TLRs, will be altered by exposure to their target ligands (Nomura et al. Reference Nomura, Akashi, Sakao, Sato, Kawal, Matsumoto, Nakanishi, Kimoto, Miyake, Takeda and Akira2000; Guillot et al. Reference Guillot, Le Goffic, Bloch, Escriou, Akira, Chignard and Si-Tahar2005) and may also respond to the general background of immuno-regulatory signals from both adaptive and innate compartments (Bosisio et al. Reference Bosisio, Polentarutti, Sironi, Bernasconi, Miyake, Webb, Martin, Mantovani and Muzio2002; Tamandl et al. Reference Tamandl, Bahrami, Wessner, Weigel, Ploder, Furst, Roth, Boltz-Nitulescu and Spittler2003; van Aubel et al. Reference van Aubel, Keestra, Krooshoop, van Eden and van Putten2007). In the case of TLRs, many distinct cell populations, including non-immune system cells, differentially express subsets of the overall repertoire of receptor types. Crucially, each TLR recognizes a unique set of ligands associated with particular pathogens. Also, some TLRs are located at the cell surface, to survey extracellular spaces, whilst others are expressed intracellularly. The degree of activity of particular receptor types, responding to particular ligands in particular localities, may therefore carry information about phenotypic commitment or ‘immunocompetence’ with regard to defence against different types of infection. It might also, perhaps in the same way as Th phenotypes, reflect resource allocation trade-offs between different components of the immune system. Receptor activity would also be expected to mirror the type of pathogenic challenges being experienced (e.g. Jackson et al. Reference Jackson, Turner, Kamal, Wright, Bickle, Else, Ramsan and Bradley2006b). Indeed, in the context of the difficulties in quantifying microbial infection mentioned above, levels of TLR expression or responsiveness might be a particularly useful measure of overall exposure to microbial pathogens (e.g. Lauener et al. Reference Lauener, Birchler, Adamski, Braun-Fahrländer, Bufe, Herz, von Mutius, Nowak, Riedler, Waser and Sennhauser2002; Ege et al. Reference Ege, Bieli, Frei, van Strien, Riedler, Üblagger, Schram-Bijkerk, Brunekreef, van Hage, Scheynius, Pershagen, Benz, Lauener, von Mutius and Braun-Fahrländer2006). A further important consideration is that in many TLRs, qualitatively different downstream signalling responses, with different functional consequences, may be generated through stimulation of the same receptor. Thus, individual TLRs may mediate pro-inflammatory responses in some circumstances in some cell subsets, or trigger regulatory activity in others (Sutmuller et al. Reference Sutmuller, Den Brok, Kramer, Bennink, Toonen, Kullberg, Joosten, Akira, Netea and Adema2006; Layland et al. Reference Layland, Rad, Wagner and Prazeres da Costa2007). The type of response mediated can depend on the ligand. For a particular ligand it may also be influenced by other responses in the host environment, including responses to infection (e.g. Ince et al. Reference Ince, Elliott, Setiawan, Blum, Metwali, Wang, Urban and Weinstock2006). When assaying ligand-specific TLR-mediated responses it may therefore be useful to measure a panel of mediators, such as cytokines, reflecting different possible downstream outcomes. For example, these might be pro-inflammatory (e.g. TNF-α), immunosuppressive (e.g. IL-10), or Type I interferons (IFN-α, IFN-β) important in anti-viral responses (De Maeyer and De Maeyer-Guignard, Reference De Maeyer and De Maeyer-Guignard1998).
Schematic representation of the cellular location and function of some important pattern response receptors (PRRs) involved in innate responses and the priming of adaptive immunity. Extracellularly-directed Toll-like receptors (TLRs) and intracellular NOD-like receptors are especially prominent in driving anti-bacterial responses. Endosomal TLRs that detect nucleic acid structures are particularly important in driving responses to viral infection. Brackets indicate known associations between receptor types and PAMPs from different pathogen groups.

In mammals, the extracellular TLRs (including TLRs 1, 2, 4, 5, 6 and 11) recognize a range of biomolecules from different source pathogens. Their ability to drive pro-inflammatory responses following exposure to bacterial PAMPs makes them a cornerstone of the body's anti-bacterial defences. Intracellular TLRs, expressed within endocytic vesicles (TLRs 3, 7, 8 and 9), detect nucleic acid motifs. Although they may respond to nucleic acids from a range of sources, their intracellular location and ligand specificity make them especially important for responses to viruses, including the production of anti-viral Type I interferon (Seth, Sun and Chen, Reference Seth, Sun and Chen2006). Although TLRs are currently seen as the most functionally diverse group of PRRs in vertebrates, with the greatest influence on the development of adaptive responses, other innate receptors are likely to be important. Examples include intracellular NOD-like receptors (Bourhis and Werts, Reference Bourhis and Werts2007), C-type lectin receptors (Willment and Brown, Reference Willment and Brown2008) and RNA helicase RIG receptors, such as RIG-1 (Yoneyama et al. Reference Yoneyama, Kikuchi, Natsukawa, Shinobu, Imaizumi, Miyagishi, Taira, Akira and Fujita2004).
In practice, in vivo receptor expression levels could be measured directly by fluorescence-activated cell sorting (FACS) analysis, or by Q-RT-PCR analysis of mRNAs. Functional responsiveness could also be quantified in ex vivo stimulatory cellular assays by the measurement of cytokine production, or by cell respiratory bursts in study organisms for which specific reagents are lacking (Scharsack et al. Reference Scharsack, Kalbe, Harrod and Rauch2007). Given that a single receptor may stimulate more than one signalling pathway (see above), it would be especially revealing to measure panels of possible down-stream cytokine responses in this type of assay. Data analytical approaches could be similar to those discussed for measures of Th-associated phenotypes in the preceding section. In an example of a study based on cellular assays in humans, Jackson et al. (Reference Jackson, Turner, Kamal, Wright, Bickle, Else, Ramsan and Bradley2006b) isolated monocytes from a Tanzanian cohort and measured a panel of individual pro- and anti-inflammatory cytokine responses following in vitro exposure to two PRR ligands, bacterial lipopolysaccharide (LPS, recognised by TLR-4) and peptidoglycan (now thought to trigger NOD-like receptors). It was found that pro-inflammatory, but not anti-inflammatory, cytokine responses were positively associated with gastrointestinal nematode infection. In particular, there was an increase in TNF-α production in response to LPS in wormier individuals. Whilst this was a simple ‘observational’ cross-sectional field study and therefore subject to confounding from unmeasured variables, the analysis may have revealed a potential candidate mechanism for interaction between parasitic worms and microbial pathogens that could be investigated further. Increased levels of responsiveness to bacterial molecular patterns might mean changes in resistance/ susceptibility to bacterial pathogens and high TNF-α levels might also have consequences for both resistance and immunopathological damage in other microbial infections such as malaria.
Future directions and application to different systems
It is worth emphasising that, whilst the cross-regulatory nature of many immune pathways and the likelihood of finite resource availability suggest that there should be functional or resource-allocation trade-offs between the different arms of the immune system, this has not been sufficiently investigated in experimental models (Lamb et al. Reference Lamb, Graham, Le Goff and Allen2005; Graham et al. Reference Graham, Cattadori, Lloyd-Smith, Ferrari and Bjornstad2007). Such trade-offs could occur within the adaptive arm (e.g. Th phenotypes) or innate arm (e.g. different TLR-mediated responses) of the immune system. Likewise, the existence of a trade-off between innate and adaptive immune defences is an intriguing possibility (Martin et al. Reference Martin, Weil and Nelson2007a; Wegner, Kalbe and Reusch, Reference Wegner, Kalbe and Reusch2007) that deserves further experimental investigation. The amount of host investment in innate ‘standing’ defences that are generated constitutively, such as complement (e.g. Maniero and Carey, Reference Maniero and Carey1997), anti-microbial peptides (Woodhams et al. Reference Woodhams, Voyles, Lips, Carey and Rollins-Smith2006) and natural antibodies (Matson et al. Reference Matson, Ricklefs and Klasing2005), should also not be ignored. Furthermore, the ‘shape’ of functional trade-offs within the immune system needs to be placed in the context of the wider phenotype and possible environmental influences. Thus, anti-pathogen defences are energetically costly and potentially subject to resource allocation trade-offs with other phenotypic traits (Martin et al. Reference Martin, Pless, Svoboda and Wikelski2004, Reference Martin, Weil and Nelson2006). The nutritional status of the host also appears to influence strongly the strength and phenotypic direction of some immune responses (Ing et al. Reference Ing, Su, Scott and Koski2000; Koski and Scott, Reference Koski and Scott2001; Martin et al. Reference Martin, Navara, Weil and Nelson2007b). There is therefore now a clear requirement for further experimental studies with laboratory models to elucidate how (and if) different elements of the immune response compete with each other under different conditions of infection and resource provision. There is also an accompanying need for an exploratory phase in field studies of non-human hosts to describe immune phenotypic variation in more detail, investigate its important life history correlates (if any), and confirm whether there are associations with pathogen-specific resistance and susceptibility that go beyond simple tracking of exposure/current infection levels. Here, there is a clear advantage to choosing study systems that can be paralleled by existing or new laboratory infection models, given some of the interpretational limits associated with field studies. The extension of immunological measurements to field systems is also, to some extent, limited by the choice of organism and the availability of immuno-reagents and/or genome sequence information. Antibody reagents are primarily available for humans and a small number of farmed and model organisms, especially the mouse, Mus musculus. This means that direct measurements of protein levels will mainly be possible only where the chosen study organisms are sufficiently closely related to one of these species to allow cross-reactivity. Future studies may well, therefore, focus on rodents, many of which are feasible laboratory and ecological field models and amongst which the level of evolutionary divergence may often allow cross-reactivity with antibodies designed for the laboratory mouse or rat. Studies of wild conspecifics or close relatives of other farmed or domesticated animals, however, may also be possible. The expanding amount of sequence information available in databases may make a wider range of non-model organisms accessible to study through the analysis of expression levels using Q-RT-PCR. Studies in non-mammalian vertebrates, which have often been historically popular, perhaps due to traditional taxon biases or to ease of sampling, are compromised to some degree by the fact that the function of the immune system remains less well understood. For example, in fishes, amphibians and birds, it is unclear whether the Th system shows the same functional division as in humans and mice. Cytokines associated with the Th2 cell subset, although present in birds, have been elusive in ectothermic vertebrates (but see Li et al. Reference Li, Shao, Xiang and Wen2007) and it is possible that some aspects of Th functional differentiation may have evolved along different paths in different vertebrate groups. However, the TLR system (Roach et al. Reference Roach, Glusman, Rowen, Kaur, Purcell, Smith, Hood and Aderem2005) and key pro-inflammatory cytokine mediators (e.g. Novoa et al. Reference Novoa, Romero, Mulero, Rodriguez, Fernandez and Figueras2006; Fast, Johnson and Jones, Reference Fast, Johnson and Jones2007) appear to be relatively structurally and functionally conserved amongst vertebrates and would provide valid candidates for study.
Practical and economic considerations may also affect the complexity of the immunological procedures attempted and the choice between mRNA analysis and the direct measurement of protein. Protein measurement would often be methodologically more robust (e.g. Huggett et al. Reference Huggett, Dheda, Bustin and Zumla2005), perhaps making this the method of first choice. A particular advantage of recent cytometric bead array technologies is that they permit multiplexed protein measurements from very small sample volumes at high sensitivities, but these analyses are relatively costly. Ex vivo cellular assays or FACS analyses also require rapid access to specialist facilities following sampling, and the labour-intensive nature and/or cost of the procedures may impose limits on the throughput of samples. In the case of mRNA analyses of in vivo expression, however, sampling and storage is less problematical (for example, samples of lymphoid tissues may be kept in RNAlater ® at room temperature and analysed after an indefinite period). This may make the processing of large numbers of samples more feasible. A further practical consideration inherent in field studies is non-random sampling due to the vagaries of where and when animals can actually be captured. Fortunately, standard modelling techniques are now available to account for spatially or temporally non-independent data. This includes the application of residual maximum likelihood (REML) mixed models (Paterson and Lello, Reference Paterson and Lello2003) which can be implemented in commercially available ‘off-the-shelf’ software packages or with publicly available routines for free software (R). Crucially for parasitological and immunological data, which often show skewed distributions, non-normal error structures can also be accommodated using both ‘fixed’ generalized linear models (Wilson and Grenfell, Reference Wilson and Grenfell1997) and ‘mixed’ generalized linear mixed models (Paterson and Lello, Reference Paterson and Lello2003). The availability of these and other advanced methods has removed many of the pitfalls that would previously have compromised the detailed analysis of field parasitological data. Indeed, the key impediment to progress in this field may not be further sophistication in statistical analysis, but technical and logistical issues surrounding the execution of large-scale field studies and the generation of sufficiently high quality parasitological and immunological data. One particular concern should be that the quantification of parasite communities in wild hosts may often be compromised by identification issues, given the accelerating collapse of traditional parasitological expertise in some countries and the limited amount of verified material that has been deposited in databases to aid molecular identifications.
CONCLUSIONS
There is currently a wide gap between our understanding of how the immune system is regulated in laboratory models and the application of this knowledge to ecological studies of infection in natural vertebrate populations. This is especially relevant in the study of co-infection states, where interspecific interactions may often be mediated through the host immune system. Some of the most interesting immunological target variables for future ecological studies are responses associated with different T-helper cell phenotypes and mediated through pattern receptor responses, such as the Toll-like receptors. These up-stream mediators trigger and control the plethora of different possible terminal immunological effector mechanisms and, therefore, most parsimoniously reflect the global responsiveness and functional bias of an individual immune system. Field immunological measurements at this level of detail, in a variety of settings, are highly desirable and may help us reveal interspecific interactions that are obscured by confounding processes, and to describe the force of infection by some pathogen groups whose communities are difficult to quantify by direct measurements. Ultimately, an increase in the sophistication of immunological measures used in field and laboratory ecological studies may allow us to understand how trade-offs and functional constraints acting on, and within, the immune system interact with infection and other biological pressures to shape the dynamics of host-parasite communities.
ACKNOWLEDGEMENTS
We thank co-workers in previous studies who have helped develop some of the approaches we describe here, especially Jerzy Behnke, Michel Boussinesq, Helen Faulkner and Joe Turner. We are also grateful to The Wellcome Trust, The Royal Society and the University of Nottingham for funding.