Introduction
Research on attention deficit hyperactivity disorder (ADHD) has identified specific cognitive measures, such as reaction time (RT) performance and commission errors on go/no-go tasks, as potential intermediate phenotypes that may mediate the association between genes and behavioral symptoms (Kuntsi et al. Reference Kuntsi, Rogers, Swinard, Borger, van der Meere, Rijsdijk and Asherson2006; Rommelse, Reference Rommelse2008; Jester et al. Reference Jester, Nigg, Puttler, Long, Fitzgerald and Zucker2009). ADHD is also associated with lower IQ, and this association has been shown to be due largely to shared genetic influences (Kuntsi et al. Reference Kuntsi, Eley, Taylor, Hughes, Asherson, Caspi and Moffitt2004; Polderman et al. Reference Polderman, Gosso, Posthuma, Van Beijsterveldt, Heutink, Verhulst and Boomsma2006). Yet it remains unclear to what extent impairment in general cognitive function can explain the observed associations with the other cognitive indices. Here we investigate, using a genetic model-fitting approach, the role of IQ in relation to cognitive impairments that are known to be associated with ADHD and share familial (genetic) influences with the clinical disorder.
Previous research has evaluated the suitability of cognitive performance measures as potential intermediate phenotypes using five main criteria (Gottesman & Shields, Reference Gottesman and Shields1973; Gottesman & Gould, Reference Gottesman and Gould2003). Two of the initial criteria are (1) that the cognitive performance measures are associated with the clinical disorder and (2) that the cognitive performance measures share overlapping genetic influences with the disorder or symptoms of the disorder in the general population. Until recently, ADHD research has mainly used a proband–sibling design to nominate potential intermediate phenotypes. This approach compares the means of cognitive performance measures in affected ADHD probands, unaffected siblings of probands and controls. Shared familial influences between the cognitive measure and the disorder are implied when the sibling mean is significantly different from the control group mean, in the direction of the proband mean. Although this method can provide an estimate of the size of the familial effects (Andreou et al. Reference Andreou, Neale, Chen, Christiansen, Gabriels, Heise, Meidad, Muller, Uebel, Banaschewski, Manor, Oades, Roeyers, Rothenberger, Sham, Steinhausen, Asherson and Kuntsi2007), it cannot be used to investigate the extent to which multiple cognitive measures share the same familial effects.
An alternative approach is to use structural equation modeling (SEM), which provides estimates of the size of shared familial influences between the experimental measure and the clinical disorder and also allows comparison between two or more potential intermediate phenotypes. SEM approaches in twin studies have found little or no evidence for shared environmental effects on either ADHD or the associated cognitive variables (Burt, Reference Burt2009; Wood et al. Reference Wood, Asherson, van der Meere and Kuntsi2009 b), so it can be assumed that the familial effects are genetic in origin (Andreou et al. Reference Andreou, Neale, Chen, Christiansen, Gabriels, Heise, Meidad, Muller, Uebel, Banaschewski, Manor, Oades, Roeyers, Rothenberger, Sham, Steinhausen, Asherson and Kuntsi2007). The multivariate SEM approach to the analysis of putative intermediate phenotypes will allow us to describe the underlying familial architecture and thus the degree to which cognitive variables share etiological influences with each other and with the clinical phenotype. These results will also facilitate reducing the number of intermediate phenotype measures to take forward into genetic mapping studies, where multiple testing is a major problem.
ADHD is associated with impairments on executive function tasks, especially those measuring RT, response inhibition (indexed by commission errors) and sustained attention (indexed by omission errors) (Willcutt et al. Reference Willcutt, Doyle, Nigg, Faraone and Pennington2005; Klein et al. Reference Klein, Wendling, Huettner, Ruder and Peper2006; Johnson et al. Reference Johnson, Wiersema and Kuntsi2009; Kuntsi et al. Reference Kuntsi, Wood, van der Meere and Asherson2009; Wood et al. Reference Wood, Asherson, van der Meere and Kuntsi2009 b). A strong association has emerged between ADHD and RT variability (RTV) (Klein et al. Reference Klein, Wendling, Huettner, Ruder and Peper2006; Rommelse et al. Reference Rommelse, Altink, Oosterlaan, Buschgens, Buitelaar and Sergeant2008; Kuntsi et al. Reference Kuntsi, Wood, van der Meere and Asherson2009; Wood et al. Reference Wood, Asherson, van der Meere and Kuntsi2009 b). In our own research, using a large proband–sibling and control sample, we previously showed an association with combined-type ADHD on subsets of the current sample for commission and omission errors on a go/no-go task (Uebel et al. Reference Uebel, Albrecht, Asherson, Borger, van der Meere, Butler, Chen, Christiansen, Heise and Kuntsi2010), in addition to mean RT (MRT) and RTV on the go/no-go and a four-choice RT tasks (Andreou et al. Reference Andreou, Neale, Chen, Christiansen, Gabriels, Heise, Meidad, Muller, Uebel, Banaschewski, Manor, Oades, Roeyers, Rothenberger, Sham, Steinhausen, Asherson and Kuntsi2007; Uebel et al. Reference Uebel, Albrecht, Asherson, Borger, van der Meere, Butler, Chen, Christiansen, Heise and Kuntsi2010). We also demonstrated an association with ‘choice impulsivity’ (CI; preference for smaller-immediate rewards, incorporating ‘delay aversion’; Marco et al. Reference Marco, Miranda, Schlotz, Melia, Mulligan, Muller, Andreou, Butler, Christiansen, Gabriels, Medad, Albrecht, Uebel, Asherson, Banaschewski, Gill, Kuntsi, Mulas, Oades, Roeyers, Steinhausen, Rothenberger, Faraone and Sonuga-Barke2009). Using identical tasks, similar findings emerged in a large general population twin sample (ages 7–10) for the RT variables commission errorsFootnote † (Kuntsi et al. Reference Kuntsi, Wood, van der Meere and Asherson2009) and CI (Paloyelis et al. Reference Paloyelis, Asherson and Kuntsi2009).
In the proband–sibling and control sample we observed improvements in RT mean and variability under incentive or combined fast/incentive conditions that was greater in cases than controls, suggesting an important role for motivational or energetic factors on the processes that underlie the response time measures (Andreou et al. Reference Andreou, Neale, Chen, Christiansen, Gabriels, Heise, Meidad, Muller, Uebel, Banaschewski, Manor, Oades, Roeyers, Rothenberger, Sham, Steinhausen, Asherson and Kuntsi2007; Uebel et al. Reference Uebel, Albrecht, Asherson, Borger, van der Meere, Butler, Chen, Christiansen, Heise and Kuntsi2010). By contrast, case-control differences in omission and commission errors were not altered under the different conditions, suggesting a potentially different underlying cognitive process that was not influenced by motivational or energetic factors for these variables (Uebel et al. Reference Uebel, Albrecht, Asherson, Borger, van der Meere, Butler, Chen, Christiansen, Heise and Kuntsi2010).
Using the population twin sample we estimated the heritability of MRT and RTV to be around 50–60% (Wood et al. Reference Wood, Asherson, van der Meere and Kuntsi2009 b). Furthermore, the estimates increased to around 70% when corrected for measured test–retest unreliability (Kuntsi et al. Reference Kuntsi, Rogers, Swinard, Borger, van der Meere, Rijsdijk and Asherson2006), nearing the average ‘broad sense’ heritability for ADHD of 70% (Burt, Reference Burt2009). Quantifying results from other studies that report shared familial variance between RT data and ADHD (Nigg et al. Reference Nigg, Blaskey, Stawicki and Sachek2004; Bidwell et al. Reference Bidwell, Willcutt, Defries and Pennington2007), the genetic correlation between the RT variables and ADHD symptom scores was estimated at around 0.7 (Wood et al. Reference Wood, Asherson, van der Meere and Kuntsi2009 b), indicating that approximately 70% of the genetic influences on ADHD also influence RT performance, and that the familial variance in sibling studies represents largely genetic influence. Previous analyses on a subset of the present ADHD-proband and control sibling-pair sample similarly indicated that 58–70% of the covariation between ADHD and RT variables was due to shared familial influences (Andreou et al. Reference Andreou, Neale, Chen, Christiansen, Gabriels, Heise, Meidad, Muller, Uebel, Banaschewski, Manor, Oades, Roeyers, Rothenberger, Sham, Steinhausen, Asherson and Kuntsi2007). In other analyses, performance on the stop signal RT from the stop task (Schachar et al. Reference Schachar, Crosbie, Barr, Ornstein, Kennedy, Malone, Roberts, Ickowicz, Tannock, Chen and Pathare2005; Waldman et al. Reference Waldman, Nigg, Gizer, Park, Rappley and Friderici2006; Bidwell et al. Reference Bidwell, Willcutt, Defries and Pennington2007; Rommelse et al. Reference Rommelse, Altink, Oosterlaan, Buschgens, Buitelaar and Sergeant2008) and commission errors on the continuous performance task (Bidwell et al. Reference Bidwell, Willcutt, Defries and Pennington2007) also indicated shared familial variance with ADHD, as indicated by mean scores in unaffected siblings or parents of ADHD-probands that were significantly different from those of controls. Using the go/no-go task, twin data indicated heritability estimates of up to 45% for error data (Kuntsi et al. Reference Kuntsi, Rogers, Swinard, Borger, van der Meere, Rijsdijk and Asherson2006) and ADHD–unaffected sibling–control means comparisons further suggested shared familial variance with ADHD, assumed to be largely genetic, as above (Slaats-Willemse et al. Reference Slaats-Willemse, Swaab-Barneveld, de Sonneville, van der Meulen and Buitelaar2003; Andreou et al. Reference Andreou, Neale, Chen, Christiansen, Gabriels, Heise, Meidad, Muller, Uebel, Banaschewski, Manor, Oades, Roeyers, Rothenberger, Sham, Steinhausen, Asherson and Kuntsi2007; Uebel et al. Reference Uebel, Albrecht, Asherson, Borger, van der Meere, Butler, Chen, Christiansen, Heise and Kuntsi2010).
ADHD is also associated with lower IQ and twin data indicate that this is also mainly the result of shared genetic influences (Kuntsi et al. Reference Kuntsi, Eley, Taylor, Hughes, Asherson, Caspi and Moffitt2004; Polderman et al. Reference Polderman, Gosso, Posthuma, Van Beijsterveldt, Heutink, Verhulst and Boomsma2006). An important clinical question therefore is whether lower general cognitive ability, as indexed by lower IQ, can explain some or all of the more specific cognitive performance deficits associated with ADHD. One investigation in ADHD sibling pairs suggested independent familial segregation of executive functioning and IQ in ADHD families (Rommelse et al. Reference Rommelse, Altink, Oosterlaan, Buschgens, Buitelaar and Sergeant2008), which concurred with results using SEM on the twin sample (7–10 years). Most of the genetic covariance (66–82%) between RT variables and ADHD symptom scores was due to genetic factors that are not shared with IQ, with 92–95% of the overall phenotypic covariance arising independently of etiological (genetic and environmental) factors shared with IQ (Wood et al. Reference Wood, Asherson, van der Meere and Kuntsi2009 b). Establishing whether this translates to a clinical sample is a key aim in the current analyses.
To address this question in a more clinically relevant sample, we now extend our previous IQ-related model-fitting analyses on the twin sample to a large clinical sample of ADHD probands, their siblings and a control sibling-pair sample, and further extend the analysis to additional cognitive variables. Using familial multivariate model fitting, we aimed to investigate whether the familial association between five measures of cognitive performance (MRT, RTV, OE, CE and CI) and a clinical diagnosis of ADHD is mediated through shared familial influences with IQ. A measure of CI was included in light of recent findings that suggest that (unlike the RT data findings) covariation between ADHD and reward preference may, at least in part, be explained by the covariation between ADHD and IQ (Bitsakou et al. 2009;Marco et al. Reference Marco, Miranda, Schlotz, Melia, Mulligan, Muller, Andreou, Butler, Christiansen, Gabriels, Medad, Albrecht, Uebel, Asherson, Banaschewski, Gill, Kuntsi, Mulas, Oades, Roeyers, Steinhausen, Rothenberger, Faraone and Sonuga-Barke2009). An additional aim is to examine whether there is justification for aggregating across measures of the same cognitive index, gained either from different tasks (RT variables) or from different conditions of the same task (accuracy variables). Such aggregation across measures is likely to be beneficial for future genetic analyses, as psychometrically robust variables are created (Kuntsi et al. Reference Kuntsi, Rogers, Swinard, Borger, van der Meere, Rijsdijk and Asherson2006) and the overall number of variables is reduced.
Method
Sample
ADHD probands and siblings
Participants were recruited from eight specialist clinics in seven European countries (Belgium, Germany, Ireland, Israel, Spain, Switzerland and the UK), through the International Multicenter ADHD Genetics (IMAGE) project (see Chen et al. Reference Chen, Zhou, Sham, Franke, Kuntsi, Campbell, Fleischman, Knight, Andreou, Arnold, Altink, Boer, Boholst, Buschgens, Butler, Christiansen, Fliers, Howe-Forbes, Gabriels, Heise, Korn-Lubetzki, Marco, Medad, Minderaa, Muller, Mulligan, Psychogiou, Rommelse, Sethna, Uebel, McGuffin, Plomin, Banaschewski, Buitelaar, Ebstein, Eisenberg, Gill, Manor, Miranda, Mulas, Oades, Roeyers, Rothenberger, Sergeant, Sonuga-Barke, Steinhausen, Taylor, Thompson, Faraone and Asherson2008 for a detailed description of ascertainment and diagnostic procedures). All participants were of European Caucasian descent and aged 6–18. All probands had a clinical diagnosis of combined subtype ADHD (ADHD-CT) and had one or more full siblings and biological parents available for ascertainment of clinical information and DNA. Siblings within the same age range as the ADHD probands were included in the study and were therefore unselected for ADHD status. Exclusion criteria applying to both probands and siblings included IQ <70, autism, epilepsy, general learning difficulties, brain disorders and any genetic or medical disorder associated with externalizing behaviors that might mimic ADHD. Where families had more than two siblings, the ADHD index cases were matched to only one of the siblings, to maintain a simple proband-sibling structure for all families included in this analysis. Sibling selection was based, first, on gender and, second, on nearest age to the index proband.
Control sample
The control group was recruited from primary (ages 6–11 years) and secondary (ages 12–18 years) schools in the UK, Germany and Spain, aiming for an age and sex match with the clinical sample. The same exclusion criteria were applied as for the clinical sample. In addition, one child subsequently withdrew after testing and three were excluded for having an IQ <70. A further 10 controls were excluded for having both parent and teacher Conners' DSM-IV ADHD subscale T scores >63, to exclude potential, undiagnosed ADHD cases.
Final sample
The ADHD proband and sibling sample consisted of 920 individuals and the control sample of 345 individuals. The final total sample therefore consisted of 1265 individuals, which comprised 580 complete sibling pairs and 105 singletons. Of the 1265 individuals, 524 with ADHD-CT were classified as affected, 16 who met criteria for the hyperactive-impulsive or inattentive subtypes were classified as a ‘subthreshold group’ (who met criteria for the hyperactive-impulsive or inattentive subtypes), and a further 664 individuals were unaffected siblings and controls.
An additional 61 participants had cognitive data, but no clinical data, and their affection status was coded as missing. Ethical approval was obtained from local ethical review boards.
Procedure
ADHD probands and their siblings were invited to the research centre for the cognitive assessments and for the parent interview. A minimum of a 48-h stimulant-medication-free period was required for cognitive testing. Patients on non-stimulant medications, such as atomoxetine, were excluded from the study. Controls and their siblings were either invited to the research centre or assessed in schools. Children were given short breaks as required and the total length of the test sessions, including breaks, was approximately 2.5–3 h.
Measures
Diagnosis
The Parental Account of Child Symptoms (PACS) interview (Taylor et al. Reference Taylor, Everitt, Thorley, Schachar, Rutter and Wieselberg1986) was conducted with the parents to derive the 18 DSM-IV symptoms for ADHD index cases plus siblings who were thought, on the basis of parents' descriptions of behavior or Conners' scores ⩾65, to have ADHD. Situational pervasiveness was defined as some symptoms occurring within two or more different situations from the PACS, in addition to the presence of one or more symptoms scoring 2 or more from the DSM-IV ADHD subscale of the teacher-rated Conners' (Conners et al. Reference Conners, Sitarenios, Parker and Epstein1998). Impairment criteria were based on severity of symptoms identified in the PACS. Across the IMAGE sites a mean κ coefficient of 0.88 and an average agreement of 96.6% were obtained for ADHD diagnostic categories (Asherson et al. Reference Asherson, Zhou, Anney, Franke, Buitelaar, Ebstein, Gill, Altink, Arnold, Boer, Brookes, Buschgens, Butler, Cambell, Chen, Christiansen, Feldman, Fleischman, Fliers, Howe-Forbes, Goldfarb, Heise, Gabriels, Johansson, Lubetzki, Marco, Medad, Minderaa, Mulas, Muller, Mulligan, Neale, Rijsdijk, Rabin, Rommelse, Sethna, Sorohan, Uebel, Psychogiou, Weeks, Barrett, Xu, Banaschewski, Sonuga-Barke, Eisenberg, Manor, Miranda, Oades, Roeyers, Rothenberger, Sergeant, Steinhausen, Taylor, Thompson and Faraone2008).
Cognitive tasks
Wechsler Intelligence Scales for Children, Third Edition/Wechsler Adult Intelligence Scale, Third Edition
The vocabulary, similarities, picture completion, and block design subtests from the Wechsler Intelligence Scales for Children (WISC-III; Wechsler, Reference Wechsler1991; Sattler, Reference Sattler1992), or the Wechsler Adult Intelligence Scale (for those over 16; WAIS-III; Wechsler, 1997) were used to obtain an estimate of the child's IQ.
The go/no-go task
On each trial of the go/no-go task (Borger & van der Meere, Reference Borger and van der Meere2000; Kuntsi et al. Reference Kuntsi, Andreou, Ma, Borger and van der Meere2005), one of two possible stimuli appeared for 300 ms in the middle of the computer screen. The child was instructed to respond only to the ‘go’ stimuli and to react as quickly as possible, but to maintain a high level of accuracy. The proportion of ‘go’ stimuli to ‘no-go’ stimuli was 4:1. The children performed the task under three conditions (slow, fast and incentive; see Uebel et al., 2010), matched for length of time on task. Here we present data from the slow condition, with an inter-stimulus interval (ISI) of 8 s and consisting of 72 trials, and the fast condition, with an ISI of 1 s and consisting of 462 trials. The order of presentation of the slow and fast conditions varied randomly across children. The variables obtained from the task are the MRT, standard deviation (SD) of the RT, or RTV, the commission error (CE) and the omission error (OE).
The fast task
The baseline condition of the fast task (Kuntsi et al. Reference Kuntsi, Rogers, Swinard, Borger, van der Meere, Rijsdijk and Asherson2006; Andreou et al. Reference Andreou, Neale, Chen, Christiansen, Gabriels, Heise, Meidad, Muller, Uebel, Banaschewski, Manor, Oades, Roeyers, Rothenberger, Sham, Steinhausen, Asherson and Kuntsi2007), with a fore period of 8 s and consisting of 72 trials, followed a standard warned four-choice RT. A warning signal (four empty circles, arranged side by side) first appeared on the screen. At the end of the fore period (presentation interval for the warning signal), the circle designated as the target signal for that trial was filled (colored) in. The child was asked to make a compatible choice by pressing the response key that corresponded directly in position to the location of the target stimulus. Following a response, the stimuli disappeared from the screen and a fixed inter-trial interval of 2.5 s followed. Speed and accuracy were emphasized equally. If the child did not respond within 10 s, the trial terminated. A comparison condition with a fast event rate (1 s) and incentives followed the baseline condition (further details in Andreou et al. Reference Andreou, Neale, Chen, Christiansen, Gabriels, Heise, Meidad, Muller, Uebel, Banaschewski, Manor, Oades, Roeyers, Rothenberger, Sham, Steinhausen, Asherson and Kuntsi2007). The variables obtained from the task are MRT and RTV; here reported for the baseline condition.
The Maudsley index of childhood delay aversion
Two conditions, each with 20 trials, were administered (Kuntsi et al. Reference Kuntsi, Rogers, Swinard, Borger, van der Meere, Rijsdijk and Asherson2006; Marco et al. Reference Marco, Miranda, Schlotz, Melia, Mulligan, Muller, Andreou, Butler, Christiansen, Gabriels, Medad, Albrecht, Uebel, Asherson, Banaschewski, Gill, Kuntsi, Mulas, Oades, Roeyers, Steinhausen, Rothenberger, Faraone and Sonuga-Barke2009). In each trial, the child had a choice between a smaller-immediate reward (one point involving a 2-s pre-reward delay) and a larger-delayed reward (two points involving a 30-s pre-reward delay). In the no post-reward delay condition, choosing the small reward led immediately to the next trial, reducing the overall length of the condition. In the post-reward delay condition, choosing the small reward led to a delay period of 30 s, and choosing the large reward led to a delay period of 2 s before the next trial; therefore, the overall delay was constant and independent of the choice made. The order of the two conditions was chosen randomly for each participant. Here, we report data for CI; the percentage of choices for the larger reward in the no post-reward delay condition (reverse scored), which showed the greatest association with ADHD (Marco et al. Reference Marco, Miranda, Schlotz, Melia, Mulligan, Muller, Andreou, Butler, Christiansen, Gabriels, Medad, Albrecht, Uebel, Asherson, Banaschewski, Gill, Kuntsi, Mulas, Oades, Roeyers, Steinhausen, Rothenberger, Faraone and Sonuga-Barke2009).
Selection of cognitive task variables for model-fitting analyses
RT data were available from the go/no-go and fast tasks: MRT and RTV were obtained from baseline (slow) conditions, where a strong association with ADHD is observed (Andreou et al. Reference Andreou, Neale, Chen, Christiansen, Gabriels, Heise, Meidad, Muller, Uebel, Banaschewski, Manor, Oades, Roeyers, Rothenberger, Sham, Steinhausen, Asherson and Kuntsi2007; Kuntsi et al. Reference Kuntsi, Wood, van der Meere and Asherson2009; Uebel et al. Reference Uebel, Albrecht, Asherson, Borger, van der Meere, Butler, Chen, Christiansen, Heise and Kuntsi2010). CE and OE data were available from the go/no-go task: here we use data obtained from slow and fast conditions only, which showed the strongest associations with ADHD (Kuntsi et al. Reference Kuntsi, Wood, van der Meere and Asherson2009; Uebel et al. Reference Uebel, Albrecht, Asherson, Borger, van der Meere, Butler, Chen, Christiansen, Heise and Kuntsi2010). CI data were obtained from the no post-reward delay condition of the choice-delay task, as this reflects the strongest association with ADHD from this task over and above ‘delay aversion’ (Marco et al. Reference Marco, Miranda, Schlotz, Melia, Mulligan, Muller, Andreou, Butler, Christiansen, Gabriels, Medad, Albrecht, Uebel, Asherson, Banaschewski, Gill, Kuntsi, Mulas, Oades, Roeyers, Steinhausen, Rothenberger, Faraone and Sonuga-Barke2009; Paloyelis et al. Reference Paloyelis, Asherson and Kuntsi2009).
Analyses
Familial structural equation models
The SEM program Mx (Neale et al. Reference Neale, Boker, Xie and Maes2006) was used to conduct the genetic analyses and to estimate phenotypic correlations. To account for the selected nature of the sample, the selection variable (ADHD status) is included in all models with its parameters fixed. This necessitated ordinal data analysis with the age- and sex-regressed residual scores of the cognitive variables ordinalized into five equal-sized categories, because the Mx program cannot include both ordinal and continuous data in the same analysis. Ordinal data analysis assumes the combination of ordered categories to reflect measurements of an underlying multivariate normal distribution of the traits, with one or more thresholds for each liability distribution to distinguish between the ordered categories. The threshold for ADHD status was fixed to a z value of 1.64 to give a population prevalence of 5%, and its parameters fixed to expected population estimates, with the familiality of ADHD fixed to 80% (sibling correlation of 0.40; see Rijsdijk et al. Reference Rijsdijk, van Haren, Picchioni, McDonald, Toulopoulou, Hulshoff Pol, Kahn, Murray and Sham2005 for further explanation and validation of this approach).
Phenotypic correlations
Sibling correlations are estimated from a phenotypic correlation model specified in a Gaussian decomposition to give maximum likelihood correlations between the phenotypic variance in each measure for each sibling, and to allow additional constraints. In addition to the constraints outlined above, further constraints reflect the assumptions of the familial model: that phenotypic correlations across traits are the same across siblings and that cross-trait cross-sibling correlations are independent of sibling status (first- or second-born).
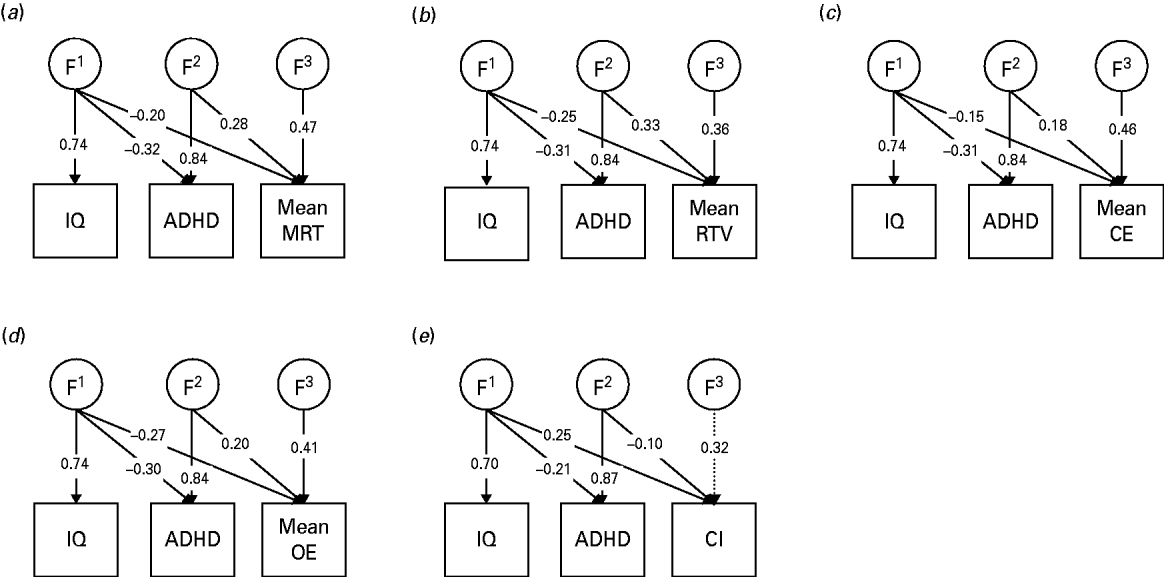
Genetic models: Cholesky decomposition (Fig. 1)
Using the information that siblings reared together share, on average, 50% of their segregating alleles, multivariate models use cross-trait cross-sibling correlations to decompose the covariation between traits into familial [F; 50–100% of additive genetic (A)+100% common environmental (C)] influences, and individual-specific environmental (E) influences, which include possible measurement error. Without knowing the underlying ratio of A:C influences for each variable, it is not possible to specify a variance/covariance structure that accurately estimates the amount of variance due to A+C influences, and as we are here focusing on shared variance, overall percentages for variance due to F and E parameters for each variable are not presented (although estimates are available in Fig. 1).
Familial parameter estimates from Cholesky models estimating the etiological influences across IQ, ADHD status, (a) mean reaction time (MRT), (b) mean reaction time variability (RTV), (c) mean commission errors (CE), (d) mean omission errors (OE) and (e) choice impulsivity (CI). Non-significant parameters are shown in dotted lines. F1 indicates the familial influences underlying IQ, which are allowed to contribute to the familial variance underlying ADHD and the cognitive measure. F2 indicates the residual familial variance accounting for ADHD that is not shared with IQ, which is in turn allowed to contribute to the familial variance in the cognitive measure. F3 indicates the residual familial variance underlying the cognitive measure, after the contributions of F1 and F2 have been taken into account.

A triangular, or Cholesky, decomposition is imposed on the data, which allows an estimation of the extent to which traits share common F and E influences. Although the ordering of variables in the Cholesky is often arbitrary for computational reasons, in the multivariate models we assigned IQ to be the first measured variable, to allow an estimation of the extent to which the covariance between cognitive data and ADHD was independent of risk factors shared with IQ. Because of the computational intensity of ordinal data analysis, 95% confidence intervals are not available. However, the significance of parameters in the main model (Fig. 1) were tested by dropping, in turn, each parameter and comparing the χ2 of the reduced model to that of the full model with a 1-df test of freedom at the p<0.05 level. A significant result indicates that the model was a worse fit without this parameter, and thus the parameter was significant with an α level of 0.05.
Results
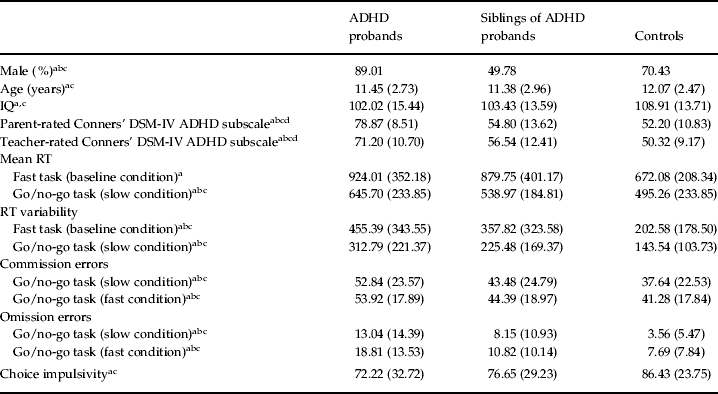
Group differences between ADHD-CT probands, siblings of probands and controls existed for gender and parent and teacher ratings of ADHD behaviors; and between probands and controls, and siblings and controls (but not probands and siblings) for IQ and age (Table 1). The use of definition variables in Mx was not possible because of the computational intensity of the integration in ordinal data analysis. Accordingly, the data were regressed for age and gender prior to the familial modeling and the age- and sex- corrected residuals used. IQ and ADHD status were included as measured variables.
Multivariate familial models across ADHD and MRT, RTV, CE or OE
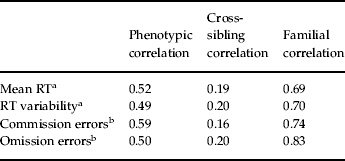
To examine whether cognitive variables across similar (theoretically related) tasks, or across different conditions of the same task, reflect similar etiological influences, models were run across two sets of data for each cognitive index (ADHD was also included to correct for ascertainment bias). The similar phenotypic and cross-sibling correlations from the constrained, phenotypic model indicate that shared familial effects underlie task (for MRT and RTV) or condition (for CE and OE) level covariance (Table 2). This is reflected in the high familial correlations between task- or condition-level data on the same cognitive construct of between rF=0.69 and 0.83 (Table 2).
Group means (and standard deviations) for sample characteristics and cognitive variables

ADHD, Attention deficit hyperactivity disorder; RT, reaction time.
a Significant differences between probands and controls (p<0.05).
b Significant differences between probands and siblings (p<0.05).
c Significant differences between siblings and controls (p<0.05).
d Ratings from the Conners' DSM-IV: ADHD total symptoms subscale.
Maximum likelihood phenotypic, cross-sibling and familial correlations for cross-taska or cross-conditionb data from constrained phenotypic models across ADHD (used for ascertainment correction) and cognitive variables

ADHD, Attention deficit hyperactivity disorder; RT, reaction time.
Choice impulsivity is not included as the variable is based on only one condition/task.
Multivariate familial models across IQ, ADHD, CI and mean MRT, RTV, CE or OE scores (Fig. 1)
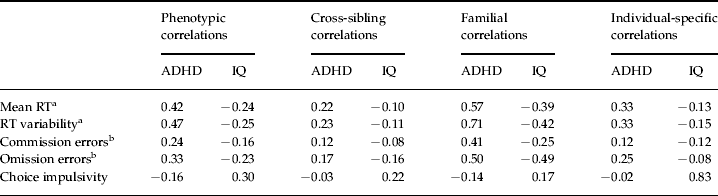
The correlations between ADHD and IQ were −0.20 at the phenotypic level and −0.17 at the familial level. Given the results outlined above, the extent to which etiology of any overlap between cognitive indices and ADHD was independent of etiology shared with IQ was examined using mean scores across the measures of MRT, RTV, CE or OE, using a Cholesky decomposition (Table 3). By summing the contribution of F and E factors that contribute to the covariation between cognitive indices and ADHD that do not influence the population variance in IQ, and taking them as a percentage of the total covariance, we obtain the percentage of the covariation that is independent of shared etiological influences with IQ.
Etiological correlations from correlated factors solutions of Cholesky models estimating the etiological influences across IQ, ADHD status, and cognitive variables

ADHD, Attention deficit hyperactivity disorder; RT, reaction time.
a Mean across fast task and slow condition of the go/no-go task.
b Mean across slow and fast conditions of the go/no-go task.
Etiological (F/E) correlations for mean scores with ADHD were as expected from task- or condition-specific measures (Table 2). The overlap between ADHD and the cognitive indices was largely independent of any shared etiology between ADHD and IQ. Between 73% and 81% of the familial influences that were shared between ADHD and the cognitive indices were independent of those shared with IQ. The exception was CI, which was lower at 62%, indicating a greater degree of overlap with the familial influences shared between ADHD and IQ. The percentage of the covariation with ADHD that was independent of shared familial influences with IQ was 58% for MRT, 62% for RTV, 67% for CE, 52% for OE and 53% for CI. Overall, the percentage of the covariation with ADHD that was independent of any shared etiological (F+E) influences with IQ was 85% for MRT, 87% for RTV, 84% for CE, 80% for OE and 61% for CI.
Discussion
Data from a large ADHD and control sibling-pair sample showed that the association between ADHD and several cognitive measures (MRT, RTV, CE and OE) is largely (80–87%) independent of etiological influences shared with IQ. This confirms and extends previous model-fitting findings on a general population twin sample (Wood et al. Reference Wood, Asherson, van der Meere and Kuntsi2009 b), and also previous findings on separate clinical samples using different analytical techniques (Rommelse et al. Reference Rommelse, Altink, Oosterlaan, Buschgens, Buitelaar and Sergeant2008; Jester et al. Reference Jester, Nigg, Puttler, Long, Fitzgerald and Zucker2009). The evidence is therefore accumulating that the relationship between ADHD and key cognitive phenotypes is not mediated by shared familial effects with IQ. This suggests that several distinct processes are involved and that impairments in general cognitive ability are unlikely to explain the specific deficits seen in ADHD.
For individual cognitive measures, the high familial correlations (0.69–0.83) obtained across conditions or tasks indicate that they are largely measuring the same underlying liability. These results, on familial sharing, indicate that performance seems to be relatively stable across task and condition, when focusing on the cognitive measures that are associated with ADHD. These results support the aggregation of data across the variables examined here for future genetic mapping analyses of the common genetic influences that span the various measures. They also suggest that the individual cognitive measures are indexing the same unitary construct across these two tasks, providing support for combining datasets for meta-analytic studies, where the data are gathered using similar paradigms. This is important for genetic mapping studies because replication of preliminary findings and pooling of data to reach genome-wide levels of significance are essential to confirm the identity of true genetic associations. Although these results are promising, caution must be advised in considering the exact task parameters. For example, for RTV we have shown, using the current sample (Andreou et al. Reference Andreou, Neale, Chen, Christiansen, Gabriels, Heise, Meidad, Muller, Uebel, Banaschewski, Manor, Oades, Roeyers, Rothenberger, Sham, Steinhausen, Asherson and Kuntsi2007; Uebel et al. Reference Uebel, Albrecht, Asherson, Borger, van der Meere, Butler, Chen, Christiansen, Heise and Kuntsi2010) and a separate population twin sample (Kuntsi et al. Reference Kuntsi, Wood, van der Meere and Asherson2009), how the strength of association with ADHD depends crucially on task condition parameters, such as event rate and incentives.
Our results across tasks and conditions show a striking similarity with results in a younger, general population twin study (Wood et al. Reference Wood, Asherson, van der Meere and Kuntsi2009 b). An example is the comparability of the genetic correlations between ADHD symptom scores and RTV in the fast and go/no-go tasks in the twin study (~0.6–0.7) and the familial correlations in the current study (~0.6–0.8). In addition to suggesting that the familial covariance is largely genetic, these findings emphasize the robustness of the methods and findings, which replicate not only across tasks and samples but also across definitions of ADHD (diagnosis versus a continuum of symptoms in the general population), supporting the conceptualization of ADHD as the extreme of a continuously distributed trait. Future analyses will aim to extend this work and examine whether there are separate pathways between the RT and error variables to account, for example, for bottom-up influences from subcortical arousal structures and brief reductions in the top-down control of sustained attention and inhibition (Halperin & Schulz, Reference Halperin and Schulz2006; Johnson et al. Reference Johnson, Kelly, Bellgrove, Barry, Cox, Gill and Robertson2007, Reference Johnson, Barry, Bellgrove, Cox, Kelly, Dáibhis, Daly, Keavey, Watchorn, Fitzgerald, McNicholas, Kirley, Robertson and Gill2008; Halperin et al. Reference Halperin, Trampush, Miller, Marks and Newcorn2008; O'Connell et al. Reference O'Connell, Bellgrove, Dockree, Lau, Fitzgerald and Robertson2008; Loo et al. Reference Loo, Hale, Macion, Hanada, McGough, McCracken and Smalley2009; Kuntsi et al. in press). The current data emphasize that these processes do not arise out of pathways shared with the more generalized deficit of lowered IQ.
The familial sharing between ADHD and CI was lower (with a familial correlation of −0.14) than that found for the other cognitive variables. The percentage of the covariation with ADHD that was independent of shared etiological influences with IQ was also lower, at 61%, indicating that CI and IQ are more closely related constructs at the etiological level. Research investigating whether there are separate and dissociable mechanisms, underpinned by different neural circuitry (Sonuga-Barke, Reference Sonuga-Barke2005), may clarify the role of CI in ADHD symptomatology. Overall, the evidence in support of CI as an intermediate familial phenotype in ADHD is less strong than for the other cognitive variables investigated here, but it is unclear at present whether this reflects, at least in part, psychometric properties of the particular measure used in this study (in particular, ceiling effects; see Kuntsi et al. Reference Kuntsi, Rogers, Swinard, Borger, van der Meere, Rijsdijk and Asherson2006) and should therefore be further investigated using alternative measures of this construct.
The current analyses add to the emerging understanding of the genetic architecture of the cognitive and energetic processes that underlie the symptoms of ADHD. For the first time, a clinical sample has been used to quantify that the familial influences ADHD shares with IQ are largely separable from those that ADHD shares with the other key cognitive indices associated with the disorder. The aetiological factors that give rise to lower IQ in ADHD seem to be largely distinct from those that give rise to the association of ADHD with RT variables, CE and OE. Lower IQ does not seem to be a general explanation for the impairments in these specific cognitive domains.
Acknowledgments
This work was supported in part by National Institutes of Health (NIH) grants R01MH62873 and R01MH081803 to S. V. Faraone and, in London, by a UK Medical Research Council grant G03001896 to J. Kuntsi. We thank all the families who kindly participated in this research. Principal investigators for this study were P. Asherson, T. Banaschewski, S. V. Faraone, M. Gill, J. Kuntsi, I. Manor, A. Miranda, F. Mulas, R. D. Oades, A. Rothenberger, H. Royers and H.-C. Steinhausen. The analyses were performed by A. C. Wood and F. Rijsdijk, who were also part of the writing group with J. Kuntsi, P. Asherson, K. Johnson and S. V. Faraone. B. Albrecht, P. Andreou, H. Christiansen and H. Uebel were further investigators at data collection sites. J. van der Meere contributed the go/no-go task and was involved in the review of the draft. A. Arias-Vasquez, J. Buitelaar, G. McLoughlin, N. Rommelse, J. Sergeant and E. Sonuga-Barke were involved in reviewing and discussing the data. We thank further team members at data collection sites of Dublin, Essen, Ghent, Göttingen, London, Tel Aviv, Valencia and Zurich for their important contributions.
Declaration of Interest
None.