

Introduction
The intrinsic, long pedestal of an intense short laser pulse unavoidably leads to the production of plasma coronas (pre-plasma) with finite scale-lengths in the target front, having profiles with densities below the critical value. At typical contrast ratios now available, pre-plasmas with density scale lengths of a few to tens of microns are usually produced as described in (Paradkar et al., Reference Paradkar, Wei, Yabuuchi, Steohen, Haines, Krasheninnikov and Beg2011), which may significantly influence the interaction in several ways. Especially, it may affect the particle acceleration, a subject which has attracted a vast number of attention, due to its potential applications. It has been frequently observed that a strong correlation exists between the density scale length and the observed spectrum of the accelerated particles (Paradkar et al., Reference Paradkar, Wei, Yabuuchi, Steohen, Haines, Krasheninnikov and Beg2011). For example, much recently, one-dimensional (1D) particle-in-cell (PIC) simulation of 1019–1021 W/cm2 intensity laser interaction with solid target for different preformed plasma scale lengths (1–15 µm) reveal an increase in mean and maximum energy of fast electrons with an increase in the plasma scale length (Paradkar et al., Reference Paradkar, Wei, Yabuuchi, Steohen, Haines, Krasheninnikov and Beg2011). However, despite many extensive studies by Paradkar et al. (Reference Paradkar, Wei, Yabuuchi, Steohen, Haines, Krasheninnikov and Beg2011); Santala et al. (Reference Santala, Zepf, Watts, Beg, Clark, Tatarakis, Krushelnick and Dangor2000), Mackinnon et al. (Reference Mackinnon, Borghesi, Hatchett, Key, Patel, Campbell, Schiavi, Snavely, Wilks and Willi2001), Yabuuchi et al. (Reference Yabuuchi, Paradkar, Wei, King, Beg, Stephens, Nakanii, Hatakeyama, Habara, Mima, Tanaka and Larensen2010), Culfa et al. (Reference Culfa, Tallents, Wagenaars, Ridgers, Dance, Rossal, Gray, Mckenna, Brown, James, Hoarty, Booth, Robinson, Lancaster, Pikuz, Faenov, Kampfer, Schulze, Uschmann and Woolsey2014), Culfa et al. (Reference Culfa, Tallents, Korkmaz, Rossal, Wagenaars, Ridgers, Murphy, Booth, Carroll, Wilson, Lancaster and Woolsey2017), Culfa et al. (Reference Culfa, Tallents, Rossal, Wagenaars, Ridgers, Murphy, Dance, Gray, Mckenna, Brown, James, Hoarty, Booth, Robinson, Lancaster, Pikuz, Faenov, Kampfer, Schulze, Uschmann and Woolsey2016), Andreev et al. (Reference Andreev, Pugachev, Povarenitsyn and Levashov2016), Fang et al. (Reference Fang, Xulei, Yang, Wenqing, Tongpu, Feng, Chen, Jingquan, Xiaohui, Zhengming and Zhang2016), and Holkundkar and Gupta (Reference Holkundkar and Gupta2008), the exact mechanism of impact of pre-plasma in a particle acceleration has remained still unclear.
An important question regarding the interaction of a laser pulse with pre-plasma, which is an underdense plasma, is the origin of super-hot electrons typically observed in experiments and simulations. A well-understood acceleration mechanism, which is active in the underdense plasma is parametric amplification in the ion channel, proposed by Pukhov et al. (Reference Pukhov, Sheng and Meyer-Ter-vehn1999). However, this mechanism is essentially multi-dimensional and is realized inside the pre-formed plasma channels or in the so-called self-focusing regime, both of which rely on relatively long propagation distances in long plasma profiles. This is while the typical scale lengths observed in actual pre-plasmas are of the order of few tens of microns and may not support the mentioned acceleration mechanisms.
Therefore, quickly operating mechanisms with being 1D in nature are very important in relation to pre-plasmas. Numbers of generically 1D mechanisms have been suggested by authors, including non-linear wave break in the vacuum–plasma interface published by Chakhmachi et al. (Reference Chakhmachi, Khalilzadeh, Pishdast and Yazdanpanah2017) and Bulanov et al. (Reference Bulanov, Naumova, Pegoraro and Sakai1998), non-wakefield interaction by Robinson et al. (Reference Robinson, Arefiev and Neely2013), and stochastic heating by Paradkar et al. (Reference Paradkar, Wei, Yabuuchi, Steohen, Haines, Krasheninnikov and Beg2011), Sheng et al. (Reference Sheng, Mima, Zhang and Meyer-Ter-vehn2004), and Boudier et al. (Reference Boudier, Patin and Lefebvre2007). According to recent studies, Paradkar et al. (Reference Paradkar, Wei, Yabuuchi, Steohen, Haines, Krasheninnikov and Beg2011), Sheng et al. (Reference Sheng, Mima, Zhang and Meyer-Ter-vehn2004), and Wu et al. (Reference Wu, Krasheninnikov, Luan and Yu2017), the last one is predominant in the case of pre-plasma.
The stochastic heating is based on the fundamental phenomenon of chaotic electron motion within the counter-propagating plane electromagnetic (EM) waves, which may lead to net energy gain by the electron, despite the situation with a single plane wave (Mendoca, Reference Mendoca1983). Interestingly, the operation of the mechanism does not require that both interacting waves achieve very high amplitudes, but rather, coexistence of a weak counter-propagating wave suffices along with an intense main pulse, that is, the auxiliary wave may have an amplitude of a few percent of the main pulse (Sheng et al., Reference Sheng, Mima, Zhang and Meyer-Ter-vehn2004; Mendoca, Reference Mendoca1983). This means that, this mechanism can be easily realized in an underdense plasma, as the plasma is proven to many scattering instabilities as mentioned by Paradkar et al. (Reference Paradkar, Wei, Yabuuchi, Steohen, Haines, Krasheninnikov and Beg2011), Sheng et al. (Reference Sheng, Mima, Zhang and Meyer-Ter-vehn2004), and Wu et al. (Reference Wu, Krasheninnikov, Luan and Yu2017), provided that the instabilities be quickly established.
Regarding realization of the stochastic heating in actual plasmas, a key question is the development of the scattered radiation up to the threshold for plasma heating by chaotic motion in terms to Mendoca (Reference Mendoca1983). Also, given the plasma density variations during the laser entrance from the plasma boundary, it is very important to understand the contribution of wave break in the vacuum–plasma interface discussed in [Chakhmachi et al., Reference Chakhmachi, Khalilzadeh, Pishdast and Yazdanpanah2017; Bulanov et al., Reference Bulanov, Naumova, Pegoraro and Sakai1998], which comes in conjunction with stochastic heating. Both these topics have remained still far from being completely understood in the context of existing studies. In this regard, as the light is eventually reflected from the critical surface, the plasma heating may loosely be attributed to the stochastic motion in the counter-propagating waves from the reflection. This is while we have found that, even in the absence of laser pulse backscattering from critical density or effect, there is a radiation scattering at the early stage of interaction which is responsible for plasma heating and electron acceleration. However, as the plasma scattering at high intensities and short pulse lengths are highly anomalous, (Tzeng et al., Reference Tzeng, Mori and Decker1996), the accurate quantitative examination of the establishment of plasma scatterings does not completely rely on the present theoretical models and usually needs numerical simulations.
In this paper, via sophisticated application of the PIC method, we numerically investigate the evolutions of radiation scattering and describe their relation to electron accelerations. In this regard, it is worthwhile to mention that Paradkar et al. (Reference Paradkar, Wei, Yabuuchi, Steohen, Haines, Krasheninnikov and Beg2011) demonstrate the ultimate role of pulse evolutions in particle acceleration, but the nature of pulse scatterings remained unexplored. As a key point, we clearly demonstrate the quick establishment of anomalous plasma scattering and describe the phenomenon in detail. We also find that the nature of scatterings is not essentially affected by the profile shape. Further, it is found that scattered waves support the stochastic heating descriptions in initially low-temperature plasma ( $k_{\rm B}T_{\rm e}\; \sim\; 10^{ - 4}m_{\rm e}c^2$) in the absence of wave break in the vacuum–plasma interface as a possible pre-heating mechanism. In fact, the wave break turns marginal when the pulse length exceeds the plasma wavelength.
The paper is organized into different sections as follow. A brief description of our PIC modeling is mentioned in the section “PIC simulation characteristics” and simulation results, discussion, and conclusion are presented in the section “Results and discussion”.
PIC simulation characteristics
The 1D 3 V PIC code equipped with Fourier analysis, developed by Yazdanpanah and Anvary (Reference Yazdanpanah and Anvary2012, Reference Yazdanpanah and Anvary2014), has been used in our simulations. In addition to PIC solution, this code is able to give the quasi-static fluid solution simultaneously.
Here we simulate the interaction of P-polarized laser pulses of 1 μmwavelength with intensities denoted by dimensionless amplitudes a 0 = eE 0/(m eωc) = 1, 2, propagating in the + x-direction with hydrogen-like plasmas having different plasma profiles. a 0 is the normalized transverse vector potential maximum amplitude, which relates to the laser intensity I as I = 1.37 × 10¹⁸ [a 0/λ(μm)]2(W/cm2). A long semi-sinusoidal laser pulse with 300 fs temporal duration has been considered in the simulations. The laser rises up within a first half of the pulse duration and then falls down to zero in the second half. A spatial resolution of 5 nm (200 cells per wavelength) with 64 particles per cell is used in the simulations. The considered cell size ensures no numerical heating and well resolved of the lowest scale length. The absorbing boundary condition is considered for particles and laser beam. The initial plasma temperature is set to be k BT e0/m ec 2 = 10−4 (50 eV) and the ions supposed to be cold and immobile.
The simulations have been performed in two different electrostatic (ES) and EM modes. In the ES mode, the transverse plasma current through Maxwell equations is ignored to eliminate the pulse evolutions because of scattering and modulation. Using this trick, the plasma optical response is artificially eliminated and the laser propagates unaffected through the plasma and so the radiation scattering effects on plasma heating are neglected. The equation of motion and the Poisson's equation are treated as in the usual EM model.
In order to outline the basic physics, in addition to variable plasma profiles, we firstly consider three different step-like density profiles at three density values, 0.01n c, 0.03n c, and 0.05n c, where n c is the plasma critical density. In all these simulations, the pulse length satisfies L p >λp = c/ωp (long pulse), meaning the pulse may undergo scatterings and modulations. Afterward, we go through the investigation of pre-plasma effects by using exponential and linear plasma density profiles having different initial scale lengths ranging from 2 to 80 µm, to find out the optimum value of pre-plasma scale length for electrons acceleration.
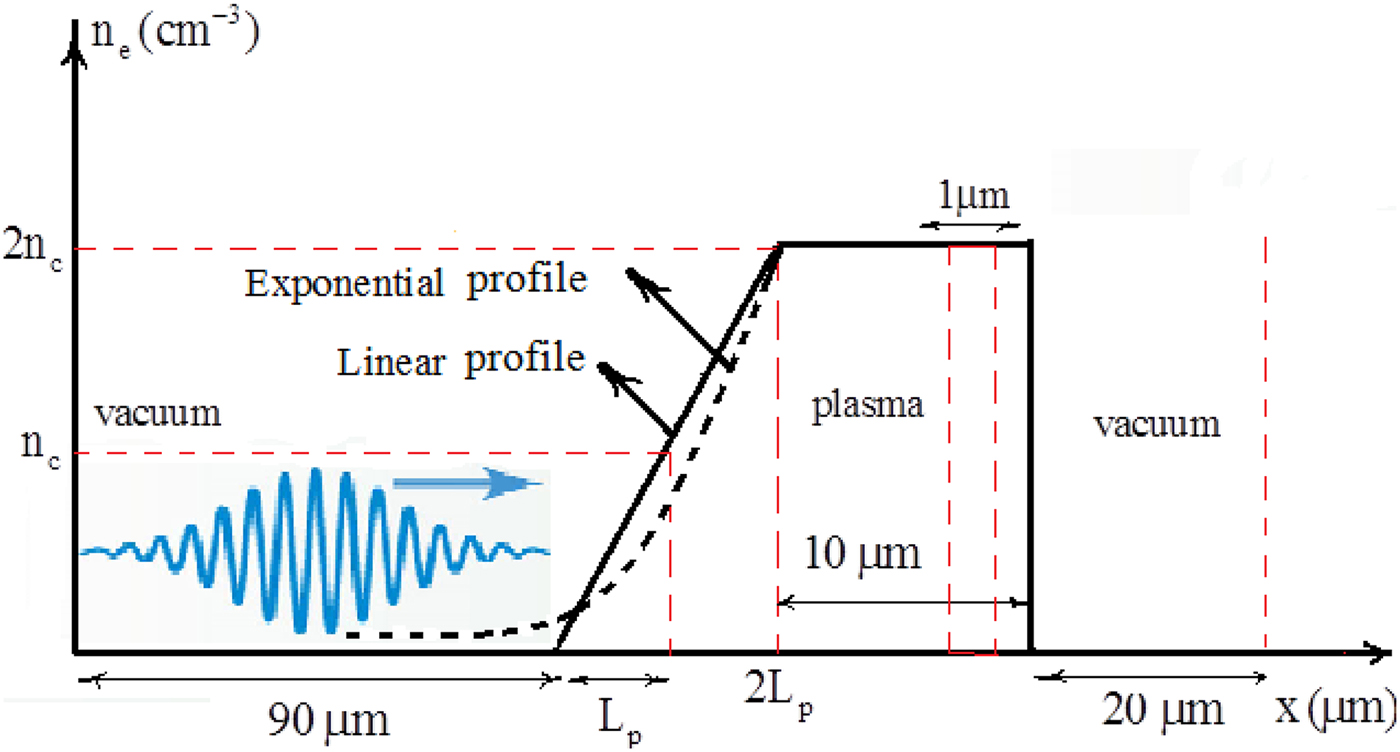
The initial pre-plasma densities for linear profile were chosen in such a way that it rises with constant ramp until reaches to 2n cat 2L p and then remains at this constant density for 10 µm (Figure 1), where L p denotes the pre-plasma density scale length. The exponential profile, on the other hand, is considered as  $n_{\rm e} = n_{{\rm e}0}e^{ - (x_0 - x/L_{\rm p})}$, where n e0 = 2n c and x 0 is the starting point of density's flat top. For all the scale lengths, the time-integrated electrons energy spectrum are calculated at the end of the flat top part of the density within 1 µm space to ensure that relativistic critical density (γ OSCn c) would prevent laser pulse penetration to that point and at the time that it gets saturated. Here, γ OSC is defined for the laser dimensionless amplitude as
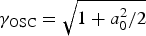 $\gamma _{{\rm OSC}} = \sqrt {1 + a_0^2 /2} $. Meanwhile, various simulation boxes are considered depending on the values of scale lengths. But in all simulations 90 and 20 µm vacuum gaps are applied to the first and last parts of the box, respectively (Figure 1).
Schematic representation of the simulation setup.
Results and discussion
As predicted by the linear theory, the plasma strongly reacts against the EM field oscillations and produces the scattered fields such as Raman forward scattering (RFS) and Raman backward scattering (RBS) (Kruer, Reference Kruer1988). RBS is the fastest growing of Raman scattering instabilities and its e-folding time can be as short as 1/ω0 in the strong coupling regime (Stabrook & Kruer, Reference Stabrook and Kruer1983; Stabrook et al., Reference Stabrook, Kruer and Lasinski1980). On the other hand, for RFS (Decker et al. Reference Decker, Mori, Katsouleas and Hinkel1996; Mori and Decker, Reference Mori and Decker1994), which is essentially active at densities below the quarter of the critical density n e0 <0.25n c, the e-folding time is of the order of n c/n e0ω0; therefore, it happens at the later time of the laser–plasma interaction.
As in the RFS, the excited plasma wave (Langmuir) has a phase-space velocity close to the speed of light and it is able only to accelerate electrons with initial high velocities. Such acceleration is realized for example when a long, intense laser pulse drives a very high amplitude plasma wave at the ultimate stages of modulation via RFS in the so-called self-modulated laser Wakefield acceleration (SMLWFA) published by Esarey et al. (Reference Esarey, Schroeder and Leemans2009). Another example of RFS acceleration is an acceleration of possibly pre-heated electrons via other active mechanisms. However, both of these scenarios are a part of long-term system behaviors and may not happen in the initial stages of interaction and short density profiles. Despite this character of RFS action, RBS-exited plasma wave has the phase velocity v p/c < 1, so that this type of plasma wave can trap the background thermal electrons described in (Esarey et al., Reference Esarey, Schroeder and Leemans2009), as soon as the RBS mode grows to high amplitudes. Therefore, in a short density scale length, the electrons are most likely preheated firstly by Raman backward radiation, and then are subjected to acceleration in counter-propagating waves of incident pump mode and reflected mode from the critical layer (Paradkar et al., Reference Paradkar, Wei, Yabuuchi, Steohen, Haines, Krasheninnikov and Beg2011), and the acceleration in both stages is of stochastic type which is essentially EM in nature.
On the other hand, space-charge oscillations which are generally excited in interactions of intense finite laser pulses are subjected to non-linear wave break (Whitham, Reference Whitham1974) in the vacuum–plasma interface (Bulanov et al., Reference Bulanov, Naumova, Pegoraro and Sakai1998). This wave break, which is ES in nature published by Chakhmachi et al. (Reference Chakhmachi, Khalilzadeh, Pishdast and Yazdanpanah2017), can accelerate electrons and may be considered as a generic mechanism being active at the front of the target and competing with RBS. In our simulations, we are able to isolate the wave-brake effect via choosing the ES mode and clarify its sole effect. Additionally, we are able to give a detailed account of all above-mentioned phenomena in the fully non-linear regime.
Figure 2 shows the intensity spectrum of total radiation (laser pulse plus scattered fields) versus wavenumber at different interaction times, when a 300 fs duration laser pulse strikes a step-like plasma density at 0.01n c. The results of both ES and EM modes are depicted in this figure. It is obvious from the blue diagram (covered by yellow), which shows the radiation spectrum of the incident laser before the interaction, that the laser is a single-mode pulse at k = k 0. The yellow diagram is related to the radiation spectrum for the ES mode at 0.3 ps after the interaction. This diagram indicates that, as it was expected, no pulse evolution occurs during interaction in this mode. Other diagrams show the total radiation spectrum at 0.1, 0.3, 1.8, and 2.7 ps after interaction for the EM mode. It is found that the pulse-scattering mechanism starts at the initial stage of interaction and then as the time passes, scattering mechanism could be attributed to Raman scattering, which begins at the very beginning and continuously develops up to long times. Generally, in the positive wavenumber space considered here, the RBS modes appear on both sides of the central mode.
The intensity spectrum of total radiation against wavenumber at different interaction times for a 0 = 2.

Figures 3a–3d show PIC and fluid simulation results of the plasma longitudinal electric field and transverse vector potential of the laser pulse (a y) at 0.1, 0.3, and 2.7 ps after interaction for EM, Figures 3a–3c and ES, Figure 3d modes respectively for n = 0.01n c. A noticeable mismatch is observed between PIC results in the EM mode and fluid solutions at initial stages (see Figs 3a and 3b). This while, according to Figure 3c, at long times, the results of PIC and fluid simulations at beginning and vicinity of the pulse turn close to each other which implies the relative stability of the scatterings. This behavior corresponds to the self-modulation of laser pulse due to RFS. The behavior of the ES mode is shown in Figure 3d. As it was expected, no pulse scattering and modulation occur in this case. Figures 3e–3h show the longitudinal momentum diagram related to Figures 3a–3d. Figures 3e–3g, which are obtained in the EM mode, show the initiation of plasma heating at the very beginning and its continuation as the time passes, indicating more plasma heating with an increment of scatterings results. On the other hand, as Figure 3h indicates, there is no plasma heating at 0.3 ps for the ES mode that rules out the efficient effectiveness of wave brake in the plasma–vacuum interface.
PIC and fluid simulation results of the (a–d) plasma longitudinal wave and the laser pulse amplitude, and (e–h) electron phase-space diagram at 0.1–2.7 ps after interaction for the EM and ES modes, n/n c = 0.01 and a 0 = 2.

To understand the importance of the initial density value of mentioned electron acceleration, we perform EM simulations of step plasma profiles at different initial plasma densities. Figures 4a–4d, represent the radiation spectrum for 0.01n c, 0.03n c, and 0.05n c initial densities at different interaction times 0.1, 0.3, and 0.8 and 2.7 ps. Results show that increasing the initial plasma density leads to faster growth of scatterings. So, it is expected that the increase of the scatterings with plasma density, results in more effective plasma heating and electron acceleration at higher initial plasma densities. This expectation is confirmed in the PIC and fluid simulation results of the plasma longitudinal electric field, transverse vector potential and electron longitudinal momentum diagram depicted in Figures 5a–5d at 0.1 ps, respectively for 0.03n c and 0.05n c.
The radiation intensity against wavenumber at 0.01n c, 0.03n c, 0.05n c plasma initial densities at different times of interaction 0.1–2.7 ps for a 0 = 2.

PIC and fluid simulation results of the (a, b) plasma longitudinal wave and the laser pulse transverse vector potential and (c, d) electron longitudinal momentum diagram at 0.1 ps for n/n c = 0.03 and 0.05 for a 0 = 2.

In terms to Figure 5, it is understood that, there is more powerful longitudinal electric wakefield and also more plasma heating for higher initial plasma densities even at 0.1 ps after interaction which according to Figure 4, is as a result of higher scattering for higher densities. These behaviors become clearer at later times of interaction, which typically are shown in Figure 6 for 0.3 ps.
PIC and fluid simulation results of the (a–c) plasma longitudinal wave and the laser pulse transverse vector potential and (d–f) electron longitudinal momentum diagram at 0.3 ps for n/n c = 0.01, 0.03, and 0.05 for a 0 = 2.

The results outlined so far indicate that during the laser interaction with an underdense plasma in 1D geometry, a generic acceleration mechanism is quickly stabilized via non-linear pulse evolutions which are of EM type. For long pulse length considered here, the density transition (variation) in the vacuum–plasma interface does not play an efficient role as the wave break does not really occur even at sharp density transition. Therefore, the generic physics of acceleration in pre-plasma with arbitrary profile shape does not alter dramatically with respect to the step density. In fact, a variable plasma profile may be considered as a definite assembly of large numbers of thin step profiles at different densities ranging between the extreme values of the variable profile. To better understand the behaviors of variable profiles, we study density profiles with a wide range of scale lengths, L p, from 2 to 80 µm, and with both linear and exponential shapes. The linear density profile is observed in experiments with gas targets (Willingale et al., Reference Willingale, Mangles, Nilson, Clarke, Dangor, Kaluza, Karcch, Lancaster, Mori, Najmudin, Schreibr, Thomas, Wei and Krushelnick2006), and used in simulation studies for example by Lefebvre and Bonnaud (Reference Lefebvre and Bonnaud1997). The exponential profile, on the other hand, is typically considered in experiments with solid targets (Santala et al., Reference Santala, Zepf, Watts, Beg, Clark, Tatarakis, Krushelnick and Dangor2000; Ovchinnikov et al., Reference Ovchinnikov, Schumachur, Mcmahon, Chowdhury, Chen, Morace and Freeman2013; Culfa et al., Reference Culfa, Tallents, Rossal, Wagenaars, Ridgers, Murphy, Dance, Gray, Mckenna, Brown, James, Hoarty, Booth, Robinson, Lancaster, Pikuz, Faenov, Kampfer, Schulze, Uschmann and Woolsey2016).
Evolution of the radiation spectrum, and an instance of longitudinal phase space for two different scale lengths, L p = 5 and 10 μm, have been depicted in Figures 7 and 8 for exponential and linear profiles, respectively. Figures 7, 8a, and 8b show that there are scattering at the very beginning of the interaction time for both 5 and 10 µm scale lengths. Comparing these figures implies that at the initial stages of interaction, there is a faster-growing scattering for shorter scale lengths which is in agreement with our mentioned results in the case of step density, as the scattering rate increases at higher densities. Self-consistent evolutions of phase space are presented in Figures 7, 8c, and 8d, showing the plasma heating at very short onset time of interaction.
(a, b) The radiation intensity and (c, d) phase-space diagram for two different, 5 and 10 µm exponential scale lengths at different times for a 0 = 1.

(a, b) The radiation intensity and (c, d) phase-space diagram for two different, 5 and 10 µm linear scale lengths at different times for a 0 = 1.

According to Figures 7c and 7d, in the case of an exponential profile, higher electron heating occurs for shorter scale length (5 µm). This is while, in the case of a linear profile, it can be seen in Figures 8c and 8d that larger scale length (10 µm) leads to higher electron heating.
In order to study the ultimate effect of variations of scattering rate and electron heating versus the scale length, we consider the electrons energy distribution function together with time history of hot electrons mean energy for different scale lengths (2–80 µm), for both exponential and linear profiles, as plotted in Figures 9a–9d. It is clearly observed that electrons have the highest maximum and mean energies at a median scale length, which is 5 µm for exponential profile and 20 µm for the linear profile, that is, an optimum scale length is expected. This behavior may be described in terms of results and behaviors obtained so far: It is reasonable to assume that the net energy gain by electrons is proportional to a factor of  $ \propto {\rm \tau} _{{\mathop{\rm int}}} R,$ where R is the evolution rate of pulse and
 ${\rm \tau} _{{\mathop{\rm int}}} $ is the interaction time. As observed above, shortening the density scale length results into increase in the evolution rate (R) and, simultaneously, decrease in the interaction time (
 ${\rm \tau} _{{\mathop{\rm int}}} $). As these effects compete with each other an optimum is expected.
(a) Electrons energy distribution function, (b) hot electrons mean energy, for exponential scale lengths, and (c, d) for linear scale lengths at a 0 = 1.

In conclusion, we have demonstrated the ultimate role of non-linear pulse evolutions in accelerating electrons during the entrance of an intense laser pulse into a preformed density profile. As a key point in our discussions, the non-linear pulse evolutions have been found to be very fast even at very low plasma densities; therefore, they are sufficiently developed during the propagation of typical short density scale lengths occurred at high contrast ratios of the pulse, and lead to plasma heating via stochastic acceleration in multi-waves. Further, simulations data at different physical parameters have been presented and analyzed, and used to describe the observed optimum value of the pre-plasma scale length for the maximum electron heating.



