

1. Introduction
In June 2005, the final National Assembly in Taiwan passed a constitutional amendment to halve the number of legislative seats from 225 to 113, increase the terms of legislators from 3 to 4 years, and change the electoral system for the legislature from a single non-transferable vote (SNTV) system to a mixed-member plurality–proportional representation (PR) system. In particular, this new electoral system regulates that two-thirds of Taiwan's legislators are elected by plurality rules from special municipalities, counties, and cities (i.e., 73 seats); six seats are elected, respectively, by the lowland and highland aborigines; and the remaining 34 seats are elected from the party list. Voters have two separate ballots – one for a district candidate and the other one for the party list. Only one candidate can be elected from each constituency, whereas a political party must receive at least 5% of party votes to be eligible to distribute list seats in proportion to its vote share (Reilly, Reference Reilly2007a). In addition, the new mixed-member system in Taiwan does not allow dual candidacies. That is, the same candidate cannot run in both a single-member district and on the party list simultaneously.
Because the majority of legislative seats are elected from single-member districts, the impact of this new electoral system on party system is similar to that of the single-member district system. That is, this new electoral system would reduce the number of political parties that could win legislative seats. The new electoral system was first implemented in 2008 that four political parties won legislative seats, but Kuomintang (KMT) and Democratic Progressive Party (DPP) together occupied 95.6% of legislative seats. The hegemonic status of the KMT and DPP has not been changed in the 2012 and 2016 legislative elections in which the KMT and the DPP together still won more than 90% of legislative seats. The only significant change is that the DPP won a legislative majority in the 2016 legislative elections. This is the first time in the history of Taiwan that a non-KMT party dominates the Legislature Yuan. In short, the new electoral system is very adverse to the development of small parties, and it is very difficult, even impossible, for small parties to win seats in the single-member plurality legislative districts.
However, we have seen in the past three legislative elections that small parties have nominated candidates to run for district seats, although they do not nominate candidates for every legislative district. Then we must ask why small parties want to nominate candidates in the single-member districts even though they have no chance to win district seats. To answer this question, this study argues that small parties expect to increase their party votes through the nomination of candidates in the legislative districts. Due to difficulty in winning district seats, small parties mainly target list seats by crossing the 5% threshold. However, most small parties are less well known by voters, so the nomination of candidates in the legislative districts is a good strategy for small parties to increase their public exposure. Therefore, voters are able to recognize small parties and might enhance their chances of casting party ballots for small parties. In short, this study expects that the appearance of a candidate in a legislative district will increase a small party's party votes in that district compared with the districts where it does not nominate a candidate. The empirical results show that the nomination of candidates in the legislative districts does lead to an increase in the vote share of smaller parties. Nevertheless, the candidate's strength plays a more important role in attracting party votes for small parties. This study uncovers why small parties run for district elections in a mixed electoral system and suggests how small parties can survive under an electoral system adverse to them.
The remainder of the study is organized as follows. Section 2 discusses the motivation of small parties to nominate candidates in the single-member districts and explains the theoretical relationship between candidate nomination in the single-member districts and party votes for small parties. Section 3 explains data source, operationalization of variables, and model specification. Section 4 presents empirical results for the effect of candidate nomination on the party list. The final section concludes with a summary of empirical findings and discusses the implications of this study.
2. Theoretical relationship between candidate nomination and party vote
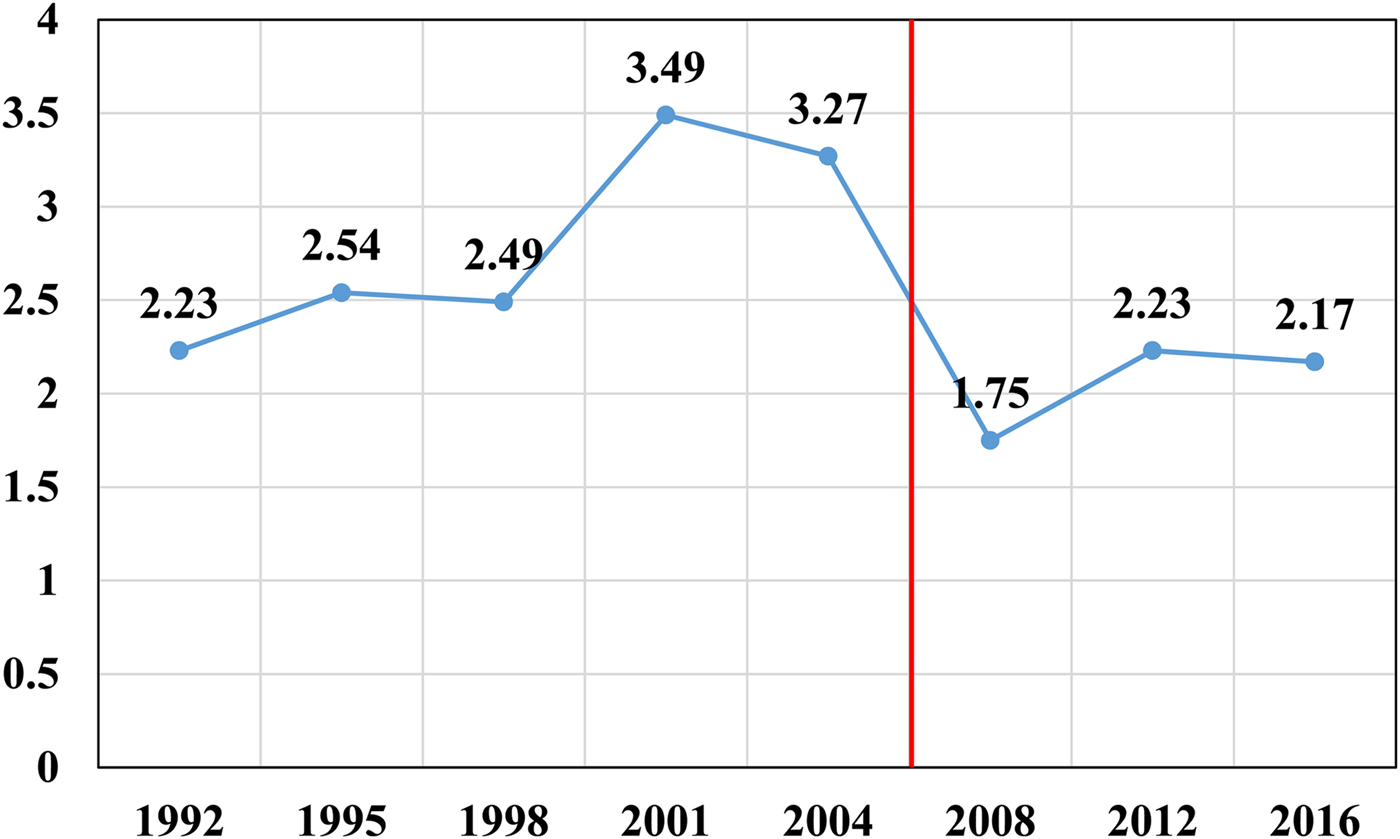
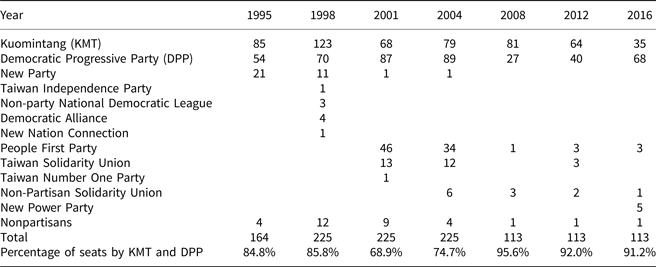
Before 2008, the SNTV system had been used for legislative elections in Taiwan. The SNTV system only allowed voters to cast one ballot in elections for multiple legislators per constituency, with the top vote-winning candidates taking those seats. Since the SNTV system exhibited a degree of proportionality equivalent to some party-list proportional systems with small districts, small parties were consistently able to win some seats under the SNVT system in Taiwan (Wang, Reference Wang1996). However, since the adoption of the mixed-member plurality–PR system in 2008, small parties and nonpartisan candidates have become less likely to win legislative seats. As shown in Table 1, the percentage of seats occupied by the KMT and DPP had never been higher than 90% before the 2008 legislative election. By contrast, the KMT and DPP together have won more than 90% of seats since the 2008 legislative election. Apparently, the new mixed electoral system has formed a barrier to hinder small political parties from winning seats and consolidated the electoral dominance of the KMT and DPP to some extent. Jou (Reference Jou2009) indicates that the new mixed electoral system remarkably reduces the effective number of parties in Taiwan. Specifically, the effective number of parties in Taiwan are, respectively, 3.49 in the 2001 legislative election and 3.27 in the 2004 legislative election. Nonetheless, the effective number of parties decreases to 1.75 in the 2008 legislative election. Although the effective number of parties increases to 2.23 in the 2012 legislative election, it slightly decreases to 2.17 in the 2016 legislative election. Figure 1 shows the change in the effective number of parties from 1992 to 2016. It is obvious that the effective numbers of parties under the mixed electoral system are lower than those under the SNTV. Due to electoral reform, the two-party system has emerged in Taiwan (Reilly, Reference Reilly2007b), and the mixed electoral system seems to pose a threat to the development of small parties.
Effective number of parties, 1992–2016.

Seat distribution of legislative elections, 1995–2016

Source: Central Election Commission, Taiwan.
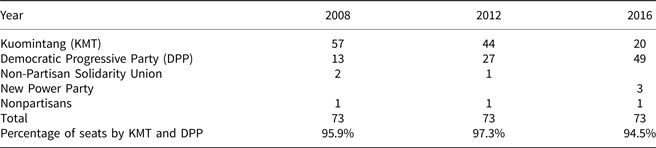
Under the mixed electoral system in Taiwan, the majority of legislative seats (i.e., about 65%) are elected from single-member districts using simple plurality rule. Since this single-member plurality electoral system only rewards a single winner, most voters would be inclined to cast votes for the candidate who is more likely to win given their rational consideration to not waste their ballots. Specifically, Duverger (Reference Duverger1952) contends that this rule tends to favor the two-party system in which party size is extremely critical to determine the probability that a party will obtain representation. Thus, the fundamental assumption that any party running for election would want to win makes Duverger propose that small parties would most likely be deterred from entering the election. As shown in Table 2, approximately more than 95% of district seats have been occupied by the KMT and DPP in the past three legislative elections, whereas small parties and nonpartisan candidates have never won more than four district seats.Footnote 1 Because small parties have trivial chances to win district seats, they should have no motivation to nominate candidates to run in the single-member districts. Contrary to our intuitive, however, small parties have consistently nominated candidates in the single-member districts in the past three legislative elections. Table 3 presents that the number of district candidates nominated by small parties has increased from 104 in the 2008 legislative election to 156 in the 2016 legislative election. On average, each small party nominated approximately seven candidates in each legislative election. Given the fact that the probability of small parties winning seats in the single-member districts is lower than 2% in the past three legislative elections, we must ask why small parties still want to nominate candidates to run in the single-member districts under mixed electoral rules.
Distribution of district seats in the legislative elections, 2008–2016

Source: Central Election Commission, Taiwan.
Number of district candidates in the legislative elections, 2008–2016

Source: Central Election Commission, Taiwan.
a 14 parties in 2008; 12 parties in 2012; 24 parties in 2016.
The answer to this question is particularly important given the impact the representatives of small parties may have on Taiwan's electoral politics. As strange as it may sound, small parties in Taiwan almost always nominate candidates in many single-member districts where most of them have no chance of winning. However, these small parties are not irrational, if we first recognize that parties do not enter the elections for only one reason, but for a variety of purposes. As demonstrated by previous studies, small parties aim to pursue three types of goals in the election – vote, policy, and position in the government (Müller and Strøm, Reference Müller and Strøm1999; Spoon, Reference Spoon2009; Spoon and West, Reference Spoon and West2015). While some ambitious small parties may aim to pursue all three of them, most small parties simply want to get votes. To achieve each of the aforementioned purposes under different electoral rules, parties may need to adopt different approaches. Using European Green Party's strategy in the past two decades as an example, Spoon (Reference Spoon2009) argues that a small party should concentrate on building up their ‘credibility’ as a capable party for voters’ consideration. In this sense, even when winning the election is unlikely to be foreseen at the moment, small parties still compete in elections, because they expect to obtain representation through their ‘credibility’ gained from the process of election campaigning.
Accordingly, how parties gain credibility and are considered as electable influences their strategies in elections. Given the mixed electoral rules in Taiwan, our focus is thus on how small parties’ strategic nomination could help them gain credibility and win representation in this mixed electoral system. There are two schools of thought regarding how small parties may strategically enter the elections. First, small parties view single-member-district (SMD) and PR list as two separate elections and decide their campaign strategies independently. Second, small parties recognize the SMD and PR races as an interactive campaign and always consider one and another simultaneously.
The first school of thought derives from Duverger's principles and believes that winning in both the SMD and PR races is the main purpose of small parties’ candidate nomination. Small parties nominate their candidates in many districts because they want to obtain seats in the districts. Accordingly, the small party's nomination strategy in the SMD races is independent of its strategy in the proportional tier. Specifically, if winning seats in the SMD competitions is the major goal that is apart from the concern about PR seats, the small parties’ nomination strategy would be derived from the application of Duverger's law and it thus means that voters may only consider the two most viable candidates and parties. In the sense, the small party would nominate candidates in some districts where their candidates may have chance for ‘Target to Win’. According to the same logic, in the PR system, especially where small parties compete in the only one national PR list, gaining representation signifies that the party could cumulate sufficient votes from various districts and the total party votes exceed the institutional threshold.Footnote 2 Again, while winning PR seats is a separate task from the party's SMD campaign, how to obtain more votes becomes the only concern. In short, this school of thought argues that even under the mixed electoral system, the SMD and PR tiers still maintain their respective independent effects on electoral outcomes. Several studies have indicated that SMD and PR electoral arrangements under the mixed electoral system tend to approximate their expected effects in contrast to the view that the interaction of SMD and PR rules mutates the effects of each part of the system (Moser, Reference Moser2001; Moser and Scheiner, Reference Moser and Scheiner2004, Reference Moser and Scheiner2012; Maeda, Reference Maeda2008).
Contrary to the viewpoint of the independence of SMD and PR tiers, the second school of thought argues that small parties should consider the two races simultaneously. Due to its interactive feature, a mixed electoral system creates a unique strategic environment for small parties to consider and it thus should be viewed as distinct from SMD and PR rules. Herron and Nishikawa (Reference Herron and Nishikawa2001) examine party's strategic entry and voters’ strategic voting in the mixed electoral system in Germany and find the existence of ‘contamination effect’. The ‘contamination effect’ refers to how parties could improve their performance in the PR tier via nominating as many candidates as possible in the SMD races. Along with the same logical line, Ferrara and Herron (Reference Ferrara and Herron2005) demonstrate that contamination effects exist in various countries where mixed electoral systems are used and identify the incentives of parties to nominate candidates in as many SMDs as possible. Specifically, they find that in a mixed electoral system where the proportional component is dominant, parties are more likely to nominate candidates in the SMDs because the placement of candidates in the SMDs provides them with the opportunity to boost their PR performance. Even in a mixed electoral system where the majoritarian and proportional components are separated and evenly balanced, parties are also likely to nominate more candidates than they would under pure SMD rules. Ferrara et al. (Reference Ferrara, Herron and Nishikawa2005) also find an evidence of contamination effect that nomination of SMD candidates affects a party's PR performance and the expectation of receiving a PR vote boost encourages multiparty competition in the SMD races. In addition, Nemoto and Tsai (Reference Nemoto, Tsai, Batto, Huang, Tan and Cox2016) argue that small parties will try to form pre-electoral coalitions in the SMD tier and boost their votes in the PR tier with the contamination effect. According to the above-mentioned studies, the logic of ‘contamination effect’ is quite straightforward. Although small parties may not have enough strong candidates in every SMD, nominating candidates in as many districts as possible to gain credibility may maximize small parties’ PR votes.
Both schools of thoughts on small parties’ strategic entry suggest that small parties should nominate more candidates in the SMD races. This could probably explain why small parties would be willing to waste their resources to nominate losing candidates in various districts. However, these two schools of thought can only provide partial explanation for Taiwan's electoral politics. In the context of Taiwan, we propose that the rationale for small parties to nominate candidates in the SMDs is twofold: first, it is to fulfill the institutional requirements and qualify for automatic ballot access; second, it is to gain credibility through nomination of strong candidates and campaigning process in order to obtain party votes for the proportional seats. The latter is similar to the contamination effect demonstrated in previous studies, but the former is derived from Taiwan's electoral rules.
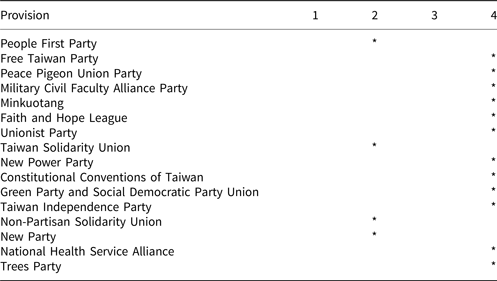
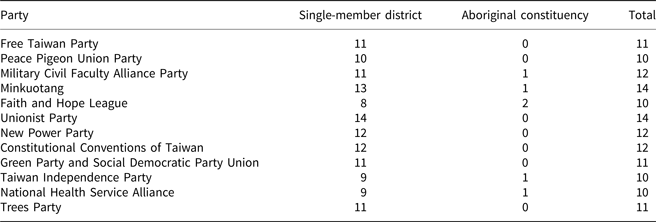
Given the electoral rules in Taiwan, small parties have experienced numerous restrictions to have their party names and candidates listed on the party ballot. According to Article 24 of the Civil Servants Election and Recall Act, parties must conform to one of the following provisions to enroll in the party list: (1) the total votes received by the recommended candidates in the recent presidential election have reached 2% and more of the total valid votes in the election; (2) party votes received in the recent three legislative elections have attained 2% and more; (3) there are five incumbent legislators; and (4) parties nominate 10 or more candidates in the single-member districts or aboriginal constituencies. As can be seen in the electoral rules, it is difficult for small parties to enroll in the party list using the first and third provisions.Footnote 3 Therefore, the majority of small parties use either the second or fourth provision to get access to the party list. In the 2016 legislative election, a total of 18 parties meet the requirements for enrolling in the party list. Table 4 shows how 16 parties except for the KMT and DPP achieve the qualification. Twelve out of 16 small parties nominate the required number of candidates in the single-member districts or aboriginal constituencies in order to qualify for the party list, whereas only four small parties can gain 2% and more of party votes in the previous elections to be qualified for the party list. As shown in Table 4, due to the institutional restrictions, nominating candidates in multiple single-member districts or aboriginal constituencies is the most feasible approach for small and new parties to qualifying for automatic ballot access in the party-list election. The number of candidates nominated by these small parties varies from 10 to 14 as shown in Table 5, implying that small parties only want to meet the minimum threshold for qualification of the party list.
Qualification of small parties for enrolling in the party list

Number of district candidates nominated by small parties in the 2016 legislative election

The institutional design forces small parties to nominate candidates in the single-member districts or aboriginal constituencies if they want to compete in the party-list election. Nevertheless, in addition to consideration of the institutional design, does the nomination of district candidates actually bring any benefits to small parties? As mentioned earlier, it appears to be irrational for small parties to nominate candidates in the single-member districts because they have much lower chances of winning seats. However, given that the majority of small parties are less known to the public, candidate nomination in the single-member district would provide effective propaganda for small parties. In particular, when the candidates nominated by small parties run the campaign in the single-member districts, they are able to increase public exposure to their party labels and help the public understand the policy positions of their parties. In other words, small parties can effectively promote their policy positions and reach out to the public through their nominated candidates, namely gaining credibility. Since voters are given two ballots for the legislative election in the Taiwanese mixed electoral system, it is possible for voters to split their votes. That is, voters can cast their two ballots – directly elected legislator and political party – for two different parties. In the single-member districts, voters might still vote for the candidates nominated by either the KMT or DPP because they do not want to waste their votes by voting for a third-party candidate who cannot win anyway. Nevertheless, in the party-list election, voters might cast their ballots for small parties that can best represent their policy positions. Accordingly, candidate nomination in the single-member districts provides a signal to voters that they can have other choices for their party votes. Although small parties cannot win seats in the single-member districts, they would be able to attract voters to cast party ballots for them by nominating candidates in the single-member districts. As suggested by previous studies, the positive correlation between candidate nomination in the SMD and PR seats refers to ‘contamination effect’. To examine the existence of ‘contamination effect’ in Taiwan, this study proposes the following hypothesis:
Hypothesis 1: Candidate nomination in the single-member districts can increase party votes of small parties.
As discussed above, previous studies on the party's strategic entry in Western mature democracies have demonstrated that there is a positive correlation between nomination in SMD competitions and PR vote share. Yet, they have not investigated whether the strength of candidates in the SMD races could influence the outcome of the PR election. Due to the interactive feature of the mixed electoral rule, a competitive and attractive candidate may create a strong ‘spillover effect’ to the affiliated party's PR ballots. In other words, the strength of candidates nominated by small parties in the single-member districts can play an important role in attracting party votes for small parties. If small parties nominate competitive and attractive candidates, voters should be more willing not only to vote for small parties’ candidates in the single-member districts but also increase their likelihood of voting for small parties in the party-list election. While contamination effect argues that the small party could gain more PR seats by increasing its number of nominated candidates in the SMD races, this study proposes that ‘spillover effect’ generated from nominating viable candidates in SMDs matters for the parties’ PR seats as well. Simply put, strong candidates are expected to help small parties receive more party votes. Thus, this study sets up the second hypothesis as follows:
Hypothesis 2: The strength of candidates nominated by small parties in the single-member districts is positively associated with party votes of small parties.
3. Data, measurement of variables, and model specification
In order to empirically test the above-mentioned hypotheses, this study collects data mainly from Taiwan's Central Election Commission to create a unique dataset by focusing on the 2016 legislative election.Footnote 4 The unit of observation in the dataset is the party. Since this study aims to examine the relationship between candidate nomination and party votes received by small parties, the KMT and DPP are excluded from the analysis.Footnote 5 Specifically, this study centers on 16 small parties in the party list of the 2016 legislative election and their party votes – the dependent variable in this study – in each administrative district such as county-controlled city, township, or district. Consequently, there is a total of 5,888 (i.e., 16 parties × 368 administrative districts) observations in the dataset.
With regard to operationalization of variables, the dependent variable is the small party's share of party votes in each administrative district. To account for the variation of small parties in party votes, this study focuses on whether a small party nominates a candidate in that district and that candidate's strength. Specifically, candidate nomination is coded as 1 if a small party nominates a district candidate and 0 otherwise, whereas the votes received by the district candidate is used as a proxy for the candidate's strength. If a small party does not nominate a district candidate in a district, this study codes the candidate strength as zero for this party in that district. In addition to the variables of primary interest, some variables are controlled in the model to explain the variation in the small party's share of party votes, including small party's share of party votes in the 2012 legislative election at the district level, turnout rate of the party list at the district level, percentage of female voters at the district level, percentage of voters aged 20–49 at the county level, and mayor's/county magistrate's partisanship.
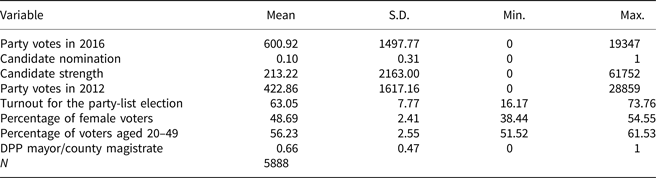
First of all, a small party's share of party votes in the 2012 legislative election could reflect to some extent its political strength in each district and should be a powerful predictor of a small party's vote share of party votes in the 2016 legislative election. It is noted that since not all small parties in the 2016 party list are included in the 2012 party list, this study recodes those small parties that are not listed in the 2012 party list as 0 for their share of party votes in the 2012 legislative election. While this coding would underestimate these small parties’ political strength in each district, it could provide a conservative estimate of small parties’ political strength. Second, this study argues that higher voter participation in the party-list election would be conducive to the increase in small parties’ party votes. It is noticed that many political commentators and politicians had publicized that voting for small parties is not a wasted vote and persuaded the public why they should cast ballots for small parties in the party-list election. Therefore, this study expects that higher levels of voter turnout in the party-list election are positively associated with small parties’ share of party votes. Third, since the majority of small parties put forward policy issues that attract more female voters’ attention, women should be more likely to cast party votes to small parties than men. In particular, this study expects that the more female voters there are in a district, the more party votes small parties would receive in that district. Fourth, since the Sunflower movement in 2014, young people in Taiwan have begun to pay attention to and care about politics. To some extent, the rise of small parties in the 2016 election campaign – many led by young people – reflects that young people are starting to make their voice heard in the Taiwanese political landscape. Therefore, younger voters are supposed to be more likely to support small parties. Specifically, this study expects that the more voters aged 20–49 there are in a county, the more party votes small parties would receive in that county.Footnote 6 Finally, although the DPP had initially endorsed the New Power Party, it changed its stance just before the election as the New Power Party's popularity quickly increased. Fearing that the New Power Party would take away the DPP's legislator seats, Tsai Ing-wen and many DPP candidates and politicians called on voters to ‘concentrate’ votes on the DPP. Therefore, this study expects that small parties would receive less party votes in cities and counties that are ruled by the DPP. Table 6 reports descriptive statistics of all variables used for empirical analysis.Footnote 7
Descriptive statistics of variables

Given that the data are structured into three different levels: (1) special municipality/provincial/county (hereafter referred to as county), (2) county-controlled city/township/district (hereafter referred to as district), and (3) party, this study would employ the multilevel model to estimate the effects of candidate nomination and candidate strength on small parties’ share of party votes. Specifically, this study estimates the random intercept model as the following equation:
 $$\eqalign{{\rm Party\; vote}{\rm s}_{ijk}\; =\;& \beta _0 + \beta _1({\rm Candidate\; nominato}{\rm n}_{ijk}) + \beta _2({\rm Candidate\; strengt}{\rm h}_{ijk}) \cr & + \; \beta _3({\rm Party\; votes\; in\;} 2012_{\,jk}) + \beta _4({\rm Turnou}{\rm t}_{\,jk}) + \beta _5({\rm Percentage\; of\; female\; voter}{\rm s}_{\,jk}) \cr & + \beta _6({\rm Percentage\; of\; voters\; aged\; 20\; to\; 4}9_k) + \beta _7({\rm DPP\; mayo}{\rm r}_k) + \varepsilon _{ijk} + {\epsilon} _{\,jk} + \sigma _k,} $$
where i is the party = {1, …, 16}, j is the district = {1, …, 368}, and k is the county = {1, …, 22}; ε ijk, ε jk, and σ k are errors, respectively, for individual-, district-, and county-level models.
4. Empirical results
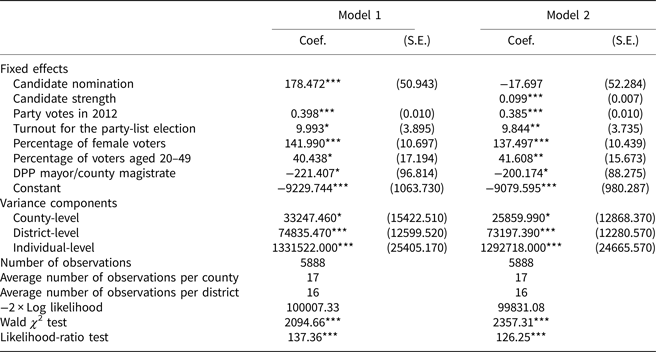
Table 7 reports the maximum likelihood estimates of the fixed effects and the variance components of the multilevel model. Specifically, model 1 simply focuses on the effect of candidate nomination on party votes, whereas model 2 takes both candidate nomination and candidate strength into consideration. The result of model 1 demonstrates that candidate nomination has a significant positive effect on small parties’ share of party votes and thus we would jump to the conclusion that nominating district candidates is conducive to the increase in party votes for small parties. This finding is consistent with ‘contamination effect’ in other Western democracies. Nonetheless, as shown in model 2, the coefficient of candidate nomination turns out to be statistically insignificant when candidate strength is entered into the model. That is to say, while taking the candidate's strength into account, nomination of district candidates alone does not have any substantive impact on party votes for small parties. The result of model 2 shows that candidate strength plays a more important role in increasing small parties’ party votes. Specifically, casting one more vote in district candidates is associated with approximately a 0.1 vote increase in small parties’ party votes. We contend that when voters support the district candidates nominated by small parties, they are more likely to cast their party votes for small parties as well. This ‘spillover effect’ is in the same direction as suggested by the contamination effect, but the two effects differ on how they view the significance of the candidates’ strength. While small parties in Taiwan nominate district candidates mainly want to be qualified to run for the party-list election, the result of this study implies that if small parties could nominate strong and competitive candidates to run for the seats in the legislative districts, they would benefit from their candidate nomination by generating ‘spillover effect’ to boost their party votes. Since there is no choice for small parties not to nominate candidates in the SMDs for the institutional reason, small party may want to start considering their candidates’ competitiveness and strength.
Multilevel analysis for small parties’ share of party votes

The models are estimated via maximum likelihood.
***p < 0.001; **p < 0.01; *p < 0.05.
On the other hand, this study finds that all other predictors exert significant influence on small parties’ share of party votes as well. First of all, it is not surprising to observe that party votes received by small parties in the 2012 legislative election is a powerful predictor of their party votes in the 2016 legislative election. Second, turnout in the party-list election has a significant positive effect on small parties’ party votes. In other words, a higher rate of voter participation in the party-list election is conducive to small parties to receive more party votes. To some extent, this result might reflect that the electorate does not regard votes for the small parties as a sheer waste. Third, both percentages of female voters and voters aged 20–49 exhibit significant positive effects on small parties’ party votes.Footnote 8 The results indicate that female and younger voters are more likely to cast party votes for small parties. The majority of small parties represent changes in politics and pay attention to social and welfare issues, and thus they attract support from female and younger voters. Finally, DPP mayor or county magistrate has a significant negative effect on small parties’ party votes. That is, small parties would obtain less party votes in cities and counties where the mayors and county magistrates are DPP members. This result suggests that the appeal made by Tsai Ing-wen and the DPP before the election indeed works and as mentioned by a DPP member after the election, some voters did ‘trickle back’ to the DPP (Liu, Reference Liu2016).
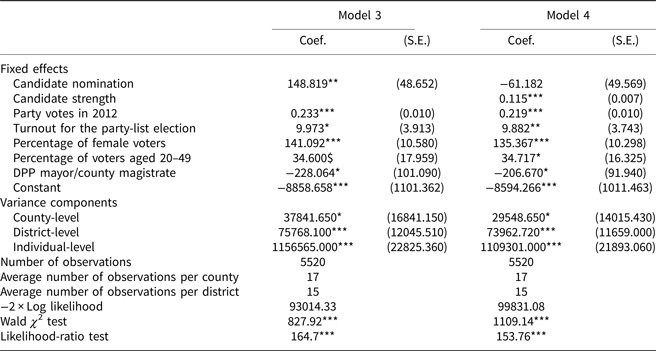
Although the above results provide clear evidence that nomination of district candidates is not associated with small parties’ share of party votes, whereas candidate strength is positively correlated with small party's share of party votes, some might cast doubt on the definition of small parties used by this study. In particular, some might argue that the People First Party should not be treated as a small party because it is the only party in addition to the KMT and DPP to have the capability to nominate presidential candidate in the 2012 and 2016 presidential elections. Consequently, the selection of observations might lead to biased estimates of the associations of candidate nomination and candidate strength with party votes for small parties as shown above. To get rid of that doubt, this study estimates another multilevel model that excludes the People First Party from the analysis. As shown in Table 8, the exclusion of the People First Party does not change the conclusion of this study that candidate strength, rather than candidate nomination, matters for small parties’ share of party votes, while all other control variables have the same direction of influence and remain statistically significant. As a consequence, the results are robust and are not subject to selection bias.
Multilevel analysis for small parties’ share of party votes – exclude the People First Party

The models are estimated via maximum likelihood.
***p < 0.001; **p < 0.01; *p < 0.05; $p < 0.10.
To sum up, the results provide strong support to the second hypothesis that candidate strength is positively associated with small parties’ share of party votes. With regard to the first hypothesis, namely whether the ‘contamination effect’ has an influence on small parties’ electoral outcome, our findings indicate that the ‘contamination effect’ may exist if we do not take the candidates’ strength into consideration. The results suggest that small parties can more effectively increase their party votes through nomination of district candidates based on the premise that they nominate strong and competitive candidates to run in district races. Therefore, although Taiwan's mixed electoral system makes small parties very difficult to win the seats in the district elections, it does not necessarily mean that nomination of district candidates does not bring any advantages to small parties. That is, small parties can make good use of nomination of district candidates to grab party votes.
5. Conclusion
The electoral systems exert a discernible and significant influence on the nature of party systems. It affects not only the number of parties winning legislative representation but also the distribution of seats among parties. Since the mixed electoral system was introduced in Taiwan's 2008 legislative election, small parties have confronted difficulty in winning legislative seats and a two-party system has been in force. Due to difficulty in winning district seats, small parties mainly target list seats. However, according to the electoral rules, parties must conform to one of four provisions as mentioned previously in order to be eligible for competing for list seats. As shown in this study, the majority of small parties obtain the qualification of running for the party-list election by nominating 10 or more candidates in the district elections. Given scarce resources, it is impossible, also unwise, for small parties to nominate candidates in every district election. As shown in this study, all 14 small parties that use nomination of district candidates to be eligible for competing for list seats simply nominate 10–14 district candidates, slightly above the minimum requirement of the electoral rules. Therefore, it is obvious that the purpose of small parties to nominate district candidates is to get the eligibility to run in the party-list election.
Although small parties do not expect their district candidates to win the election in most situations, this study provides robust evidence that small parties are able to increase their party votes through nominating strong district candidates. Since a party must receive at least 5% of party votes, a high threshold, to qualify for list seats, it is very important for parties to come up with various ways to strive for party votes and nomination of strong and attractive district candidates should be one of the best strategies to grab party votes. The New Power Party offers a great example. The New Power Party does not have a long history, just formed in early 2015, but it nominates several nationally renowned district candidates who are able to attract media attention and increase public exposure for the name of their party. Consequently, the New Power Party wins two list seats as well as three district seats.Footnote 9 Since nomination of district candidates is the main, perhaps the only, approach for small parties to getting the eligibility to run in the party-list election, small parties should fully utilize their nomination strategies to increase party votes. Every candidate must pay a security deposit of NT$200,000 (approximately US$6,360) in order to run in the district election. Only when a candidate receives at least 10% of the total votes in the district does she get her security deposit back. Accordingly, nomination of district candidates could put a financial burden on small parties. As a result, it would be wise to nominate strong district candidates because small parties are able not only to increase their party votes but also to get their security deposit back.
Although our findings on conditional ‘contamination effect’ on the party's PR performance need to be examined further, this study provides insight into how small parties can use nomination of district candidates to increase their party votes to win list seats in Taiwan. While this study simply focuses on the case of Taiwan, the results of this study can provide some implications for those countries that adopt a mixed electoral system, although there are some variations in different versions of a mixed electoral system. Currently 32 countries use some version of a mixed electoral system, such as Japan, Mexico, Ukraine, South Korea, Venezuela, Romania, Jordan, Hungary, Mongolia, and so on (Batto and Cox, Reference Batto, Cox, Batto, Huang, Tan and Cox2016). Therefore, the findings of this study can be generalized to these countries and demonstrate that small parties have the potential to win or increase their list seats by nominating strong and competitive candidates in the district elections.
Ching-Hsing Wang is a Postdoctoral Fellow in the Hobby School of Public Affairs at the University of Houston. His research interests include research methods, political behavior, political psychology, public opinion, and Asian politics. He has published articles in such scholarly journals as Electoral Studies, International Political Science Review, Issues & Studies, Party Politics, Social Science Quarterly, Taiwanese Political Science Review, The Social Science Journal, and so on.
Dennis Lu-Chung Weng is an Assistant Professor of Political Science at the Sam Houston State University. His research interests are comparative politics, political behavior, quantitative methods, and Asian politics. He has published articles in such scholarly journals as Electoral Studies, Asian Journal of Political Science, Asian Journal of Comparative Politics, and Taiwan Journal of Southeast Asian Studies.
Vincent Wei-Cheng Wang is the Dean of the School of Humanities and Sciences and a Professor of Politics at Ithaca College. He is the author of over 80 scholarly articles and book chapters on Asian political economy, security, international relations, East Asian–Latin American comparative development, Taiwan's foreign policy and domestic politics, cross-strait relations, and Chinese foreign policy and domestic politics.