Implications
In 2005, the Convention on Biological Diversity provided the first legally binding agreement for over 180 countries to examine genetic diversity and to develop optimal conservation strategies for their farm animal genetic resources (Food and Agriculture Organization (FAO), 2007). In order for Canada to fulfill its obligation, populations of various livestock species within its borders must be properly assessed, with regard to genetic diversity (FAO, 2007). The assessment of genetic diversity and admixture among Canadian, Mountain and Moorland and Nordic populations was performed to help to increase the knowledge and understanding of the Canadian equine genetic resources.
Introduction
The Food and Agriculture Organization (FAO; 2007) has recently reported that approximately 700 horse and pony (Equus caballus) populations are found worldwide. Of these populations, approximately 181 are listed to be at some risk of extinction, and another 272 are of unknown status (FAO, 2007). Many of the at-risk populations are pony breeds (Equus Surivial Trust, 2008; Rare Breeds Canada, 2009). Ponies are often phenotypically defined as indiviudals standing under 147 cm (14.2 hh) at the whiters, although exceptions to this rule exist, including the Haflinger and Caspian (classified as a coldblood and miniature horse breed, respectively; Lynghaug, Reference Lynghaug2009). Some of the most well-known groups of pony breeds include the Mountain and Moorland and Nordic populations. The Mountian and Moorland breeds originated from the British Isles and include the Connemara, Dale, Dartmoor, Eriskay, Exmoor, Fell, Highland, Kerry Bog, New Forest, Shetland and Welsh. The Nordic breeds also include the Shetland along with the Norwegian Fjord and Icelandic.
Canada is home to two pony populations – the Newfoundland and the Lac La Croix – along with one horse breed, the Canadian and one feral equine population located on Sable Island. All Canadian equine populations share hardiness, soundness, versatility and small population size; they are also maintained in situ. There is interest in understanding what breeds contributed to the development of the Newfoundland, as early management of these ponies involved releasing individuals to run feral until they were required for work. The Lac La Croix pony is a hardy breed traditionally thought to originate from crossing Canadian horses with Spanish mustangs (Lynghaug, Reference Lynghaug2009). This breed suffered a severe bottleneck in 1977, when the population was reduced to four females, which were then crossed with Spanish mustangs in an attempt to save the population (Lynghaug, Reference Lynghaug2009). The Canadian horse, Canada's heritage equine breed, traces its origin to the first shipment of French horses, which arrived in Canada in 1665. The Canadian horse became very popular both within and across borders and significantly influenced the development of many of the American trotting and pacing breeds including the Standardbred, Missouri Fox Trotter, Tennessee Walking horse, Morgan, and Saddlebred (Lynghaug, Reference Lynghaug2009). Lastly, Sable Island is home to a horse population that has had no human interference since 1960 (Plante et al., Reference Plante, Vega-Pla, Lucas, Colling, De March and Buchanan2007). Before 1960, it was not uncommon for horse breeders to release stallions on the island to breed with the feral population and then to collect the offspring and stallions the following year (Nova Scotia Museum of Nautural History, 2001). This practice makes it possible that the Sable Island population could have influenced other Canadian equine populations.
Microsatellites are simple tandem repeats and are often used in equine diversity studies because of their wide availability, simple Mendelian inheritance, wide coverage of the equine genome and selective neutrality (Cañon et al., Reference Cañon, Checa, Carleos, Vega-Pla, Vallejo and Dunner2000; Aberle et al., Reference Aberle, Hamann, Drögemüller and Distl2004; Solis et al., Reference Solis, Jugo, Mériaux, Iriondo, Mazón, Aguirre, Vicario and Estomba2005). These characteristics make microsatellite loci particularly useful for estimating genetic diversity and characterizing breeds, which are necessary for developing good and viable conservation strategies (Achmann et al., Reference Achmann, Curik, Dovc, Kavar, Bodo, Habe, Marti, Sölkner and Brem2004; Glowatzki-Mullis et al., Reference Glowatzki-Mullis, Muntwyler, Pfister, Marti, Rieder, Poncet and Gaillard2006; Eggert et al., Reference Eggert, Powell, Ballou, Malo, Turner, Kumer, Zimmerman, Fleischer and Maldonado2010). Recently, Leroy et al. (Reference Leroy, Callède, Verrier, Mériaux, Ricard, Danchin-Burge and Rognon2009) have reported that pony breeds tended to cluster distinctly and separately from horse breeds using 11 microsatellites to estimate genetic diversity in 34 French equine populations. European pony breeds (Connemara, Camargue, Landais, New Forest, Poney Français de Selle, Pottok and Welsh) clustered closely to Nordic pony breeds (Shetland, Icelandic and Fjord), but separately from both warmblood and coldblood horse breeds (Leroy et al., Reference Leroy, Callède, Verrier, Mériaux, Ricard, Danchin-Burge and Rognon2009). Despite this, large studies involving the estimation of genetic diversity of solely pony breeds have not been performed, and studies available today tend to focus only on a few breeds or compare a large number of horse breeds with only a few pony breeds; this may not be the best way to measure the genetic diversity in pony breeds (Plante et al., Reference Plante, Vega-Pla, Lucas, Colling, De March and Buchanan2007; Behl et al., Reference Behl, Behl, Gupta and Gupta2008; Leroy et al., Reference Leroy, Callède, Verrier, Mériaux, Ricard, Danchin-Burge and Rognon2009).
In order to estimate the genetic diversity and phylogenetic relationships of the Mountain and Moorland, Nordic and native Canadian equine populations, this study aimed to investigate 15 pony breeds, three feral equine populations and five horse breeds (thought to have influenced the development of some pony breeds and/or Canadian equine populations) using 38 microsatellite loci.
Material and methods
Sampling and genetic analysis
In total, 821 randomly selected individuals from 24 populations were examined. These populations consisted of feral (Grand Turk, Sable Island and Saint-Pierre et Miquelon); horse (Canadian, Caspian, Clydesdale, Haflinger, Mongolian Domestic (serving only as an out group for phylogenetic reconstruction) and Standardbred); and pony populations. Individual pony breeds were assigned to one of the following categories: Canadian pony (Lac La Croix and Newfoundland (with two separate herd samples: Canadian (CDN) and Saskatchewan (SK)), Mountain and Moorland (Connemara, Dale, Dartmoor, Eriskay, Exmoor, Fell, Highland, Kerry Bog, New Forest and Welsh) or Nordic (Fjord, Icelandic and Shetland). Most samples were collected from North American (Canada and the United States) sources, with the exception of a few pony breeds, feral populations and the Mongolian Domestic samples. All feral populations and Mongolian Domestic samples were collected from their respective native regions. In addition, the Eriskay, New Forest and Exmoor samples were collected in the United Kingdom, whereas the Shetland samples came from both the United Kingdom and North America.
DNA templates were prepared from hair follicles or blood samples following a modified procedure by Troy et al. (Reference Troy, MacHugh, Bailey, Magee, Loftus, Cunningham, Chamberlain, Sykes and Bradley2001). When blood samples were used, additional steps to lyse and remove the erythrocytes were incorporated. A lysis buffer containing 0.32 M Sucrose, 10 mM Tris-HCl, pH 8.0, 50 mM KCl and 0.5% Tween was mixed with 200 μl aliquots of whole fresh or frozen–thawed blood. The leukocytes were pelleted and the supernatant was aspirated. Each sample was washed twice with 400 μl of the same solution before DNA extraction.
Microsatellite loci were chosen based on a previous study by Glowatzki-Mullis et al. (Reference Glowatzki-Mullis, Muntwyler, Pfister, Marti, Rieder, Poncet and Gaillard2006) and the MoDaD microsatellite marker recommendations (Hoffmann et al., Reference Hoffmann, Ajmone Marsan, Barker, Cothran, Hanotte, Lenstra, Milan, Weigend and Simianer2004). In total, 38 microsatellite loci were genotyped (AHT4, AHT5, AHT31, ASB2, ASB17, ASB23, ASB43, CA425, COR7, COR22, COR69, COR71, HMS1, HMS2, HMS3, HMS5, HMS6, HMS7, HMS45, HTG03, HTG04, HTG06, HTG07, HTG10, I-18, LEX33, LEX34, LEX54, LEX78, TKY301, TKY325, TKY333, TKY337, TKY341, TKY343, TKY344, UM32 and VHL20) by PCR using 1 μl of DNA template and commercially available kits and protocols (Amplitaq Gold; Applied Biosytems, Foster City, CA, USA or Qiagen Multiplexing Kit; Qiagen Inc., Burlington, Ontario, Canada). Details regarding these loci can be found in the Supplementary Table 1. Allele frequency tables for the populations examined in this study are available upon request.
The microsatellite amplicons were purified using Agencourt® AMPure® (Agencourt Bioscience Corporation/Beckman Coulter Company, Mississauga, Ontario, Canada) using the recommended protocol. Samples (0.8 μl of purified PCR product, 1 μl of 600-Liz size standard and 8.2 μl of Hi-Di Formamide (Applied Biosystems) were denatured for 5 min at 95°C, quenched on ice for 2 min and loaded onto a Genetic Analyzer 3130xl (Applied Biosystems) equipped with a 50-cm array and filled with POP7 polymer. Genotypes were determined using GeneMapper® version 3.0 software (Applied Biosystems).
Statistical analysis
Deviations from the Hardy–Weinberg equilibrium (HWE) were estimated using MICRO-CHECKER (Hull, Yorkshire, UK; Van Oosterhout et al., Reference Van Oosterhout, Hutchinson, Wills and Shipley2004). Linkage disequilibrium and overall F-statistics per locus were estimated using GENEPOP on the web, available at http://genepop.curtin.edu.au/ (Raymond and Rousset, Reference Raymond and Rousset1995; Rousset, Reference Rousset2008). GENALEX version 6 (Peakall and Smouse, Reference Peakall and Smouse2006) was used to estimate the average (Na) and average effective (Ne) number of alleles, and inbreeding coefficient (FIS). ARLEQUIN version 3.5 (Excoffier and Lischer, Reference Excoffier and Lischer2010) was used to compute the analysis of molecular variance (AMOVA), and observed (Ho) and expected (He) heterozygosities. Allelic richness (AR) was estimated using FSTAT (Goudet, Reference Goudet2001).
Microsatellite Analyzer (A-1210 Wien, Austria; Dieringer and Schlötterer, Reference Dieringer and Schlötterer2003) was used to estimate and bootstrap (1000 times) three genetic distances: Nei's unbiased (Nei, Reference Nei1972), Nei's (Reference Nei, Tajima and Tateno1983) and the proportion of shared alleles (POSA; Bowcock et al., Reference Bowcock, Ruiz-Linares, Tomfohrde, Minch, Kidd and Cavalli-Sforza1994). In addition, Reynolds distance (Reynolds et al., Reference Reynolds, Weir and Cockerham1983) was also estimated and bootstrapped 1000 times using PHYLIP version 3.66 (Felsenstein, Reference Felsenstein1989 to 2006). Trees were created using the neighbor-joining method (Saitou and Nei, Reference Saitou and Nei1987), combined using CONSENUS (as implemented in PHYLIP version 3.66) and drawn using SplitsTree4 (Huson, Reference Huson1998; Huson and Bryant, Reference Huson and Bryant2006). A POSA individual phylogenetic tree was also estimated using Microsatellite Analyzer and drawn using Mega4 (Tamura et al., Reference Tamura, Dudley, Nei and Kumar2007).
Individuals were assigned to predefined populations using the ‘leave-one-out option’ and the maximum likelihood method (Paetkau et al., Reference Paetkau, Calvert, Stirling and Strobeck1995; Paetkau et al., Reference Paetkau, Slade, Burden and Estoup2004) as implemented in GENALEX version 6. Structure version 2.1 (Pritchard et al., Reference Pritchard, Stephens and Donnelly2000), with the parameter settings: K10 to 30, 50 000 burn-in, 100 000 Markov chain Monte Carlo (reaching equilibrium) with 10 replicates, was used to assign individuals to inferred clusters. Structure Harvester (Earl, Reference Earl2009) was used to estimate the optimal number of clusters using the Evanno et al.'s (Reference Evanno, Regnaut and Goudet2005) approach. Clumpp version 1.1.2 (Jakobsson and Rosenberg, Reference Jakobsson and Rosenberg2007) and Distruct version 1.1 (Rosenberg, Reference Rosenberg2004) were used to cluster the 10 independent runs into a single figure.
Contributions of each population to overall genetic diversity was also assessed using marginal loss (Weitzman, Reference Weitzman1992 and Reference Weitzman1993) and Nei's (1983) genetic distance as implemented in WEITZPRO (D'Arnoldi et al., Reference D'Arnoldi, Foulley and Ollivier1998). In addition, the loss in genetic diversity from the data set was also assessed using the Petit et al.'s (Reference Petit, Mousadik and Pons1998) approach and molecular kinship analyses as proposed by Caballero and Toro (Reference Caballero and Toro2002) and implemented in MOLKIN version 2 (Gutiérrez et al., Reference Gutiérrez, Royo, Álvarez and Goyache2005).
Results and discussion
In total, 821 individuals were examined across 24 populations. The analysis of the microsatellites revealed the presence of 468 alleles. This number is comparable with other studies that reported a total of 404 alleles while using 50 microsatellite loci and investigating seven equine populations (Glowatzki-Mullis et al., Reference Glowatzki-Mullis, Muntwyler, Pfister, Marti, Rieder, Poncet and Gaillard2006). The observation of more alleles with fewer microsatellite loci tested is likely a direct result of the increased number of populations sampled. The linkage disequilibrium analyses revealed varying results from complete equilibrium of all loci in the Newfoundland-SK and the Saint-Pierre et Miquelon population to as high as seven pairs of significantly linked loci (P ⩽ 0.05) in the Sable Island herd. As there were no pairs of loci consistently in linkage disequilibrium across populations, all markers were included in the analyses.
All populations were tested for deviation from the HWE, a test commonly utilized to check for null alleles that can result in excess homozygosity and an underestimation of the genetic diversity present (DeAssis et al., Reference DeAssis, DeLaat, Peixoto, Bergmann, Fonseca and Carvalho2009). Although, there was no specific evidence for the presence of null alleles in any of the loci tested, deviations from the HWE varied from zero loci in the Canadian, Highland, New Forest, Shetland, Standardbred and Welsh populations to as high as 13 loci in the Sable Island population (P ⩽ 0.05). Deviations from HWE have been reported previously in small populations (such as the Hucul, Icelandic, Jaca Navarra and Pottok), or populations that are highly inbred, and may explain the deviations seen in the Sable Island herd (Solis et al., Reference Solis, Jugo, Mériaux, Iriondo, Mazón, Aguirre, Vicario and Estomba2005; DeAssis et al., Reference DeAssis, DeLaat, Peixoto, Bergmann, Fonseca and Carvalho2009; Leroy et al., Reference Leroy, Callède, Verrier, Mériaux, Ricard, Danchin-Burge and Rognon2009). The excess homozygosity observed could also be a result of genetic drift, non-random mating, substructure or small effective population size. Many of the breeds within the Canadian, Mountain and Moorland and Nordic populations have relatively small population sizes, resulting in an increase of homozygosity seen within a breed, and therefore explaining some of the deviations from the HWE observed. Specifically, the Lac La Croix was bottlenecked to four females in 1977; according to historical records, the Saint-Pierre et Miquelon population arose from approximately 75 individuals left on the islands in the 1700s (Lynghaug, Reference Lynghaug2009). Published research has also found that different maternal harems found on Sable Island show different levels of inbreeding, which may be reflective of the resource distribution (Lucas et al., Reference Lucas, McLoughlin, Coltman and Barber2009). Lastly, the Newfoundland pony samples were treated as two separate groups (increasing the populations tested for this study to 25) as a result of a Wahlund effect detected by MICRO-CHECKER.
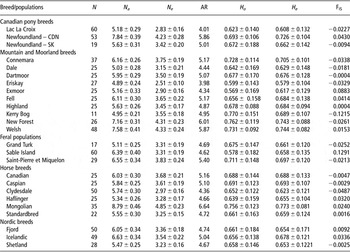
A summary of the population statistics can be found in Table 1. Individual locus Na varied from five in the microsatellite HMS5 to 23 in TKY333 with an average of 12.3 alleles per locus. The number of individuals per population analyzed varied from 11 in the Kerry Bog to 60 in the Lac La Croix and Sable Island herds. The Na observed in each population varied from 4.89 in the Eriskay to 7.84 in the Newfoundland-CDN population, and was followed closely by the Welsh with a value of 7.58. The low value for the Eriskay is likely due to the bottleneck experienced within the breed in the 1970s when it was reduced to one breeding stallion (Eriskay Pony Mother Stud Book Society (EPMSBS), 2010). The Welsh and Newfoundland likely have higher Na values as a result of the great diversity seen within the Welsh sections and a partially opened registry maintained in the past in the Newfoundland pony breed. AR was calculated by standardizing the populations to a sample size of 11 individuals, and results were similar to Na with 3.98 for the Eriskay, 5.87 for the Welsh and 5.86 for the Newfoundland-CDN population.
A summary of the basic statistics per population including sample size (N), average number of alleles (Na), effective number of alleles (Ne), allelic richness (AR), observed heterozygosity (Ho), expected heterozygosity (He) and inbreeding coefficient (FIS)

Following the same trend, Ne was the highest in the Welsh and New Forest breeds with values of 4.33 and 4.31, respectively. The Eriskay continued to show the lowest value at 2.51. The overall estimate for Ho and He, along with Na, Ne and F indices, for each locus can be found in the Supplementary Table 2. Within the populations, the He varied from 0.579 in the Eriskay to 0.744 in the Welsh, followed closely by the New Forest with a value of 0.743. The Ho was highest at 0.770 in the Kerry Bog and lowest in the Exmoor at 0.569. These results are consistent with other published studies, in which fewer loci or a smaller sample size were used, for several populations including the Connemara, Fjord, Haflinger, Newfoundland, Standardbred and Sable Island (Luís et al., Reference Luís, Juras, Oom and Cothran2007; Plante et al., Reference Plante, Vega-Pla, Lucas, Colling, De March and Buchanan2007; Leroy et al., Reference Leroy, Callède, Verrier, Mériaux, Ricard, Danchin-Burge and Rognon2009). In contrast, others have also found slightly higher values in the Connemara, Exmoor, Fell, Icelandic, Shetland, New Forest and Caspian (Cothran, Reference Cothran2004; Luís et al., Reference Luís, Juras, Oom and Cothran2007; Leroy et al., Reference Leroy, Callède, Verrier, Mériaux, Ricard, Danchin-Burge and Rognon2009). FIS varied from 0.1291 in the Sable Island and 0.0883 in the Exmoor to −0.1215 in the Kerry Bog, indicating that there is a high deficiency in heterozygotes in the Sable Island and Exmoor populations, whereas there is an excess of heterozygotes in the Kerry Bog population. The high amounts of inbreeding seen in the Sable Island and Exmoor are likely a result of the small population sizes and feral and semi-feral status, respectively (Plante et al., Reference Plante, Vega-Pla, Lucas, Colling, De March and Buchanan2007; Lynghaug, Reference Lynghaug2009). The combination of these two factors can lead to high levels of inbreeding and an increase in homozygosity. Results of the Kerry Bog showing an excess of heterozygotes may not reflect an accurate picture of the breed, but could be a result of the small number of samples obtained. All other populations were not significantly inbred or out crossed (<5%).
The AMOVA revealed expected results with 84.60% of genetic variance arising from within individuals, 2.07% among individuals and 13.33% occurring as a result of genetic differences among populations. These values are similar to previously reported data in which 10% to 17% and 83% to 90% of genetic diversity could be explained by breed differences and differences within individuals, respectively (Aberle et al., Reference Aberle, Hamann, Drögemüller and Distl2004; Glowatzki-Mullis et al., Reference Glowatzki-Mullis, Muntwyler, Pfister, Marti, Rieder, Poncet and Gaillard2006; Plante et al., Reference Plante, Vega-Pla, Lucas, Colling, De March and Buchanan2007).
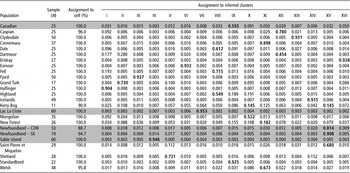
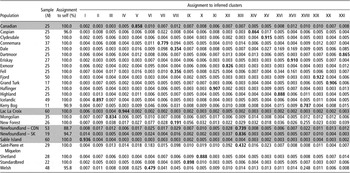
Individual assignment tests based on the maximum likelihood methods to predefined populations found that 98% of individuals were correctly assigned to their respective group (Tables 2 and 3). Of those that could not be properly assigned include one Kerry Bog, assigned to the Welsh; two Welsh, assigned to the Icelandic and New Forest groups; six Newfoundland-CDN, four assigned to Newfoundland-SK, one to the Welsh group and one to the Saint-Pierre et Miquelon population; and one Newfoundland-SK assigned to the Saint-Pierre et Miquelon population. It is not surprising that some animals that are not actually members of this breed were assigned to the Welsh group. Many breeds, especially the above listed pony breeds, were influenced at one time or another by one or more of the four Welsh sections (Lynghaug, Reference Lynghaug2009). One Caspian was also assigned to the Welsh group, and it is believed that this sample was either mislabeled or that the inidividual was not a purebred as these two breeds are not closely related.
The results from the population assignment (based on maximum likelihood methods) and the Bayesian analyses

The values under columns I to XVI are from population Q-matrices that show distribution of Q-values in identified clusters. Bold values identify the clusters with highest Q-values (proportion of genotype membership). Shaded areas represent populations which are indigenous to Canada.
The results from the population assignment (based on maximum likelihood methods) and the Bayesian analyses

The values under columns I to XXI are from population Q-matrices that show distribution of Q-values in identified clusters. Bold values identify the clusters with highest Q-values (proportion of genotype membership). Shaded areas represent populations which are indigenous to Canada.
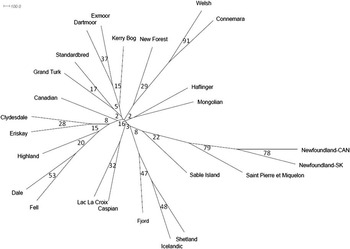
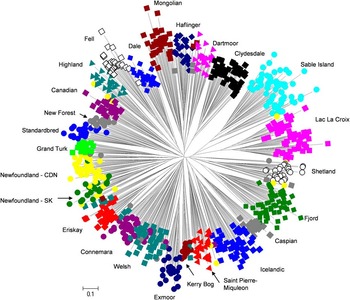
All phylogenetic reconstruction using genetic distances estimated showed similar topologies with low bootstrap values indicating that these breeds have likely diverged recently. Figure 1 illustrates the POSA approach that produced the phylogenetic tree making the most biological sense. The Lac La Croix and the Eriskay were not consistently placed throughout the different phylogenetic trees and is likely due to the bottleneck experienced in these breeds and subsequent hybridization with other breeds (Lynghaug, Reference Lynghaug2009; EPMSBS, 2010). An alternative explanation for the inconsistent placement of the Lac La Croix may be a result of not having Mustang samples from the area where admixture could have occurred in the past. In general, there appears to be two main groups observed in all the phylogenetic trees. The first is the Mountain and Moorland breeds group together, as expected, and share common ancestry. An interesting observation is that the Canadian horse, Grand Turk, Clydesdale and Standardbred also appear in this group. The Grand Turk and Standardbred populations were consistently paired together in all phylogenetic trees. It was originally thought that the Grand Turk population may have significantly influenced the development of Canadian equine populations due to the trade and movement flow of horses in the past; however, the phylogenetic trees do not support this opinion. The Clydesdale, also thought to have influenced the Canadian equine breeds, does appear to be distantly related to the Canadian in the POSA tree only. The relationships among horse breeds shown in this study are limited because only breeds that were expected to be closely related to the breeds of interest were examined. Thus, some horse breeds examined here may be more closely related to breeds not examined than to those in this study.
The unrooted population phylogenetic tree created using the proportion of shared alleles; individual confidence values on each branch are also included.

Within the Mountain and Moorland groups, several breeds also consistently shared several similarities among the phylogenetic trees. Specifically, the Dartmoor and Exmoor breeds paired together and appear to share common ancestry with the Kerry Bog ponies. This is not surprising as the Dartmoor and Exmoor breeds both developed in the South-West region of England (Lynghaug, Reference Lynghaug2009). In addition, the Welsh and Connemara breeds also consistently paired together with great confidence, supporting previously published data, and share common ancestry with New Forest breed (Leroy et al., Reference Leroy, Callède, Verrier, Mériaux, Ricard, Danchin-Burge and Rognon2009). Lastly, as previously reported, the Fell and Dale also paired together in all phylogenetic trees and share common ancestry with the Highland breed (Cothran, Reference Cothran2004).
More interestingly, the second broad group observed in all phylogenetic trees is the combination of the Nordic breeds, Canadian pony breeds and Sable Island and Saint-Pierre et Miquelon populations. Although the Nordic breeds always grouped together, they also share common ancestry with the feral populations and Canadian pony breeds (Plante et al., Reference Plante, Vega-Pla, Lucas, Colling, De March and Buchanan2007). The consistent grouping of the Saint Pierre et Miquelon population and Newfoundland breed may indicate that these populations share recent common ancestry. The Sable Island population is likely a more distant ancestor of both the Saint Pierre et Miquelon and Newfoundland populations.
Figure 2 illustrates the individual unrooted phylogenetic tree created using POSA as an estimator of genetic distance. This tree illustrates that most of the pony breeds are generally distinct from each other, and individuals from the same breed tend to cluster together. A few breeds within the tree were observed to have overlapping clusters including the two Newfoundland herds (CDN and SK) and the Connemara, Eriskay and Welsh breeds. The overlapping clusters of the Newfoundland populations are not unexpected as these populations represent the same breed. The overlap and splitting of the Welsh breed across the Eriskay and Connemara clusters may be a result of individuals from the Welsh breed representing the different sections (types). Different sections within the Welsh breed may have influenced the Connemara and Eriskay breeds in the past and therefore may explain why these breeds cluster together.
The unrooted individual phylogenetic tree created using a proportion of shared allele pairwise difference matrix.

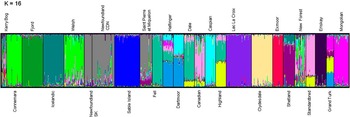
The Bayesian analysis provided a unique way to investigate the individuals within this study and cluster them together without previous breed information. Structure Harvester determined that the most likely K-value was 21, although some substructure was observed at K = 16. When K = 16 (Figure 3; Table 2), there appeared to be a strong admixture, varying from one to many breeds, and some breeds grouped into clusters together. This was the case with the Fell and Dale, Welsh and Connemara, Canadian and Standardbred, Dartmoor and Haflinger and Newfoundland and Saint-Pierre et Miquelon populations. In the recent past, some breed organizations feared that their pony breeds (and Canadian populations) may have been crossed with Standardbred horses in an effort to increase certain traits within their breed. The clustering of the Standardbred and the Canadian horse when K = 16 is not surprising given the historical influence of the Canadian on the development of the Standardbred (Lynghaug, Reference Lynghaug2009). In addition, this cluster appeared to have some admixture with the New Forest, Highland, Fell, Dale, Haflinger, Welsh and Kerry Bog populations, which also shared admixture among each other. The Caspian, interestingly, appeared to share common ancestry with the Dartmoor and Haflinger and may be a result of the known influence from the Arabian on all of these breeds (Lynghaug, Reference Lynghaug2009). In addition, the grouping of the Connemara and Welsh supports the close phylogenetic relationship observed in all four genetic distances estimated in this study.
The consensus band for the 10 independent structure runs at K = 16; each single line represents one individual.

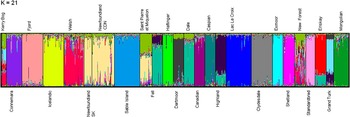
When K = 21 (Figure 4; Table 3), the Canadian and Standardbred, Dartmoor and Haflinger and Welsh and Connemara, separated out into breed-specific clusters, and the strong admixture observed when K = 16 between some of the pony populations was no longer seen. Some pony breeds, most notably the New Forest and Kerry Bog, still did not form their own individual clusters but rather appeared to be a mixture of breeds. A possible explanation for this may be that the New Forest breed was frequently bred with other Mountain and Moorland breeds until the 1930s as a way of improving the breed (Lynghaug, Reference Lynghaug2009). The Kerry Bog pony suffered a severe herd reduction to only 20 animals in the 1990s, and as a result the breed was also likely crossed with other Mountain and Moorland breeds in order to conserve the population (McGahern et al., Reference McGahern, Edwards, Bower, Heffernan, Park, Brophy, Bradley, MacHugh and Hill2006). The Newfoundland populations and the Saint-Pierre et Miquelon herd remain in a single cluster, indicating that there is likely strong admixture between these two populations or that they share very recent common ancestry. The Fell and Dale also continued to share a single cluster, which is not unexpected as the breeds developed in the same region (Lynghaug, Reference Lynghaug2009). The Grand Turk population, also thought to have influenced the Canadian populations, appeared to have admixture from both horse and pony breeds; however, none of them were populations native to Canada. Interestingly, populations such as the Sable Island, Icelandic, Fjord, Lac La Croix, Clydesdale, Exmoor and Eriskay are quite distinct from the other populations examined as these breeds segregated out even at early K-values, which has also been reported previously for the Sable Island and Icelandic populations when comparing them with horse breeds (Glowatzki-Mullis et al., Reference Glowatzki-Mullis, Muntwyler, Pfister, Marti, Rieder, Poncet and Gaillard2006; Plante et al., Reference Plante, Vega-Pla, Lucas, Colling, De March and Buchanan2007).
The consensus band for the 10 independent structure runs at K = 21; each single line represents one individual.

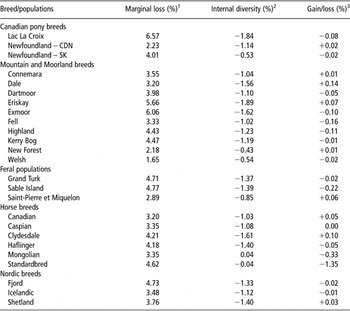
The contribution to overall genetic diversity (Table 4) revealed varying results for the three different approaches when trying to assess the priority of the breeds included in this study. Results using the Weitzman approach (Weitzman, Reference Weitzman1992 and Reference Weitzman1993) favored the Lac La Croix pony as having the greatest marginal loss (6.57%) of all the populations tested when removed from the data set and was followed closely by the Exmoor (6.06%) and Eriskay (5.66%) breeds. In contrast, the Welsh population was found to have the least marginal loss (1.65%), followed closely by the New Forest (2.18%) and Newfoundland-CDN population (2.23%). The Petit et al.'s (Reference Petit, Mousadik and Pons1998) approach followed similar trends to the Weitzman approach with the greatest loss of diversity occurring when the Eriskay (1.89%), Lac La Croix (1.84%) and Exmoor (1.62%) were removed from the data set. The populations that contributed the least amount of diversity to the data set were the New Forest (0.43%), Newfoundland-SK (0.53%) and Welsh (0.54%). In contrast to both the previous mentioned analyses, the Caballero and Toro's (Reference Caballero and Toro2002) approach favored the Sable Island population as having the greatest loss of diversity (−0.22%) when removed from the other populations examined, followed closely by the Fell (−0.16%) and Highland pony (−0.11%). Surprisingly, the removal of the Dale, Eriskay and Canadian actually increased the diversity observed within the data set examined with values of 0.14, 0.07 and 0.05%, respectively. A previous study using fewer microsatellites also has found that the removal of the Sable Island herd from their data set also greatly reduced the amount of diversity observed when comparing the feral herd with horse breeds (Plante et al., Reference Plante, Vega-Pla, Lucas, Colling, De March and Buchanan2007).
Results of the contribution to genetic diversity of each population within the data set using three different approaches: Weitzman's, Petit et al.'s and Caballero and Toro

1Data calculated using Weitzman's approach (Weitzman, Reference Weitzman1992 and Reference Weitzman1993).
2Data calculated using Petit et al.'s approach (Petit et al., Reference Petit, Mousadik and Pons1998).
3Data calculated using Caballero and Toro's approach (Caballero and Toro, Reference Caballero and Toro2002).
Conclusions
The Canadian, Mountain and Moorland and Nordic populations significantly contribute to the genetic diversity within the species. In addition, populations such as the Fjord, Icelandic, Sable Island, Eriskay, Exmoor and Lac La Croix appear to segregate out quickly with low K-values, indicating that they are likely more distinct from other breeds examined. Interestingly enough, the hypothesis that horse breeds such as the Clydesdale and Standardbred, originally thought to have influenced Canadian pony populations, does not appear to be supported from the data gathered in this study; however, the Standardbred did appear to show strong admixture, or common ancestry, as expected, with the Canadian horse when K = 16; also, the Clydesdale did appear to be distantly related in the POSA phylogenetic tree. One of the most surprising findings in this study was the close relation of the Newfoundland and Saint-Pierre et Miquelon populations, as well as the lack of influence of the Grand Turk on any of the native Canadian equine populations. The exact priority of the populations examined for the distribution of resources varies between the different approaches estimated, but in general the Lac La Croix and Sable Island populations, along with the Eriskay, Exmoor, Fell and Highland breeds appear to be the top priorities. Further study will have to be conducted to determine the relationship of the Lac La Croix among both horse and pony breeds, as this breed was not consistently placed in the phylogenetic trees using the four genetic distances estimated. This study provides the crucial first step in the breed characterization of several Canadian, Mountain and Moorland and Nordic populations, which should be combined in the future with other molecular information such as mitochondrial DNA sequence data, and/or currently available genealogical and phenotypic data to produce an optimal and effective conservation strategy for all breeds examined.
Acknowledgments
The authors wish to acknowledge the significant contributions of the many breed societies, Zoe Lucas with the Sable Island Green Horse Society, Patricia Morris from the Newfoundland Pony Society and Maxxam Analytics (Ontario, Canada) for providing valuable support and samples. This study was funded by the Agriculture and Agri-Food Canada.