


INTRODUCTION
This paper reconsiders the effect of democracy on the level of income inequality in society. We start from the simple observation that autocratic regimes are highly heterogeneous entities. From monarchistic, to business-friendly militaristic, to populistic, to communistic, since the Second World War autocratic regimes have varied dramatically in their ideologies concerning how spoils should be divided within the economies they govern. Indeed, the differences are not only ideological, but are reflected in the historical income inequality data—in our sample, autocratic countries have had gross Gini coefficients as low as 24 and as high as 72 (though also some with moderate income inequality levels, comparable to the mean level in democracies). The heterogeneity of inequality levels in autocracies logically implies that income distribution dynamics following transitions from autocracy to democracy will also be quite heterogeneous. Why should we observe a reduction in inequality in countries that were not particularly unequal prior to democratization? This simple observation is our starting point, from which we empirically investigate a nonlinearity that has not been examined in the literature. We demonstrate how inequality dynamics following a switch to democracy are conditional upon on the initial (predemocracy) level of inequality. Intuitively, our results suggest that democracy provides a “middle ground” in terms of inequality levels—autocratic regimes which governed extreme distributional outcomes are replaced by political processes that gravitate towards more centrist outcomes preferred by newly enfranchised voters in the middle of the income distribution.Footnote 1 Moreover, we also provide some evidence about the heterogeneous channels through which the conditional dynamics may operate.
A common narrative in the economics and political science literatures is that democratization is driven by distributional issues (Acemoglu and Robinson Reference Acemoglu and Robinson2000, Reference Acemoglu and Robinson2001, Reference Acemoglu and Robinson2006; Boix Reference Boix2003). Based on classic rational choice theories of democratically determined fiscal policy (e.g., Meltzer and Richard Reference Meltzer and Richard1981; Roberts Reference Roberts1977; Romer Reference Romer1975), these redistributionist theories of political transition show how following political enfranchisement, the decisive voter becomes relatively more poor and, all else equal, should call for inequality-reducing policies (though fiscal redistribution in their models). Ansell and Samuels (Reference Ansell and Samuels2010, Reference Ansell and Samuels2014) or Llavador and Oxoby (Reference Llavador and Oxoby2005) provide an alternative, elite-competition perspective in which an emerging middle class (or competing elite) seeks democratic voice to push for more competitive, modern economic structures. Rather than taxing and transferring from an ancien régime, the elite-competition view argues that democracy allows for a nouveau riche to emerge, which may increase inequalities. In any event, to the extent that the literature theorizes that distributional issues drive democratization processes, the logical expectation is that transitions to democratic governance should have profound impacts on inequality levels. Our middle ground results reconcile the logics of these two important strands of the literature on inequality and democratization and demonstrates that each branch of theory may be valid for different subgroups of countries.
To date, the empirical literature concerning the effect of democracy on economic inequalities has not found any compelling evidence of a relation. Acemoglu et al. (Reference Acemoglu, Naidu, Restrepo, Robinson, Atkinson and Bourguignon2015) carefully review this empirical literature, where results vary as widely as the methods employed and conclude that there is no clear evidence that inequality is impacted by democratization.Footnote 2 Employing fixed-effects dynamic panel regression models, Acemoglu et al. (Reference Acemoglu, Naidu, Restrepo, Robinson, Atkinson and Bourguignon2015) go on to show that there is no robust statistically significant relation between democratization and inequality. Such null results accord with recent reconsiderations of the extent to which drivers of democratization are distributive in nature (Aidt and Jensen Reference Aidt and Jensen2009; Haggard and Kaufman Reference Haggard and Kaufman2012; Kaufman Reference Kaufman2009; Keefer Reference Keefer2009; Knutsen and Wegmann Reference Knutsen and Wegmann2016).
However, the literature does not fully address the fact that autocracies are heterogeneous, a point made forcefully by Jones and Olken (Reference Jones and Olken2005), who demonstrate that economic performances of autocratic countries are highly leader specific.Footnote 3 Just as not all autocracies have histories of sclerotic growth, not all autocracies feature extremely high income inequality. Table 1 provides the distribution of the net Gini coefficient across different per capita income ranges for autocratic and democratic countries. Note that heterogeneity among autocracies does not vary dramatically across per capita income classifications.
Distribution of Gini Coefficients by Political Institutions

Note: Calculations by the authors on the data used in our baseline regression analysis. Regime classification follows our baseline coding of democracies and nondemocracies that we later explain in detail. Gini coefficients are calculated from net income (after taxes and transfers) by Solt (Reference Solt2016) and GDP per capita data comes from the Penn World Table. For the nondemocracies, there are 286 observations in each income quartile, while for the democracies there are 597 observations in each income quartile.
Our basic point is that without taking into account how the effect of democratization is conditional on initial inequality levels, the contrasting experiences of switches to democracy in high- and low-inequality autocratic countries will cancel each other out, yielding the familiar null result. Autocratic societies are highly heterogeneous and regression analyses that do not take this into account are ignoring important nonlinearities in the effect of democracy on income inequality.Footnote 4 We employ fixed-effects dynamic panel regression models to estimate the effect of switches to democracy that highlight the nonlinearity. Our main contribution to the literature on democracy and inequality is to demonstrate that the impact of democratic switches, conditional on initial levels of inequality, is a robustly statistically significant determinant of income inequality dynamics. We demonstrate that, on average, relatively egalitarian autocracies become more unequal following democratization, whereas democratization has an equalizing effect in the relatively unequal autocracies. Our finding that the effect of democracy on inequality is conditional on initial inequality levels rationalizes the mixed results in the empirical literature, where the relationship is typically estimated unconditionally. Contrary to prior findings in the literature, we demonstrate that democratization actually strongly affects inequality levels. In our baseline fixed-effects estimation, we calculate that a country with a predemocracy Gini coefficient in the 10th (90th) percentile among autocratic countries experiences an increase in around 2 Gini points (decrease of around 4 Gini points) in the long run. Instrumental variable (IV) specifications estimate very similar long-run effects.
We pursue a wide range of methods to establish that our main finding is robust and can be plausibly interpreted causally. Notably, throughout our analysis we employ a “democratic wave” IV for use in two-stage least squares (2SLS) estimations.Footnote 5 Roughly speaking, we calculate the dynamic regional share of countries that are democratic as an IV for democracy, with which we show that the instrumented conditional effect of a democratic switch is consistent with our baseline estimations.
We take care to convince readers of the robustness of our results and the validity of our instrumental variable strategy. First, we demonstrate that the result is robust to estimation over five-year as well as ten-year panels, which yields very similar estimated long-run effects. Second, we check that our results are not being driven by democratization in specific regions (most notably among the low-inequality, formerly Communist group of countries). When excluding regions one at a time, the conditional results hold with a similar magnitude, suggesting that the relationship is a quite general pattern among democratization episodes. We additionally consider several jackknifed specifications and other sensible sample restrictions. Third, given the debate in the literature on how to measure the democratization process, we use alternative democratization indicators to be sure that the result is not driven by the composite indicator we employ in the baseline specification. Finally, we run some placebo regressions in order to be sure we are not simply identifying a more global mean reversion process. Further robustness tests are collected in an Online Appendix.
We also provide an investigation into the policy changes after democratization that could be potential channels through which democratization may affect inequality. Interestingly, we find that the impact of democratization on the gross Gini coefficient is quite similar to the impact on the net Gini coefficient. This finding leads us to investigate more formally the extent to which democratization has an effect on the degree of fiscal redistribution. Contrary to the prominence of tax and transfer schemes in the redistributionist theories of democratization, we demonstrate that direct fiscal redistribution is not affected by democratic switches. We then show that democratization leads to different kinds of structural reforms according to the initial degree of inequality. For high-inequality countries, we show that democratization leads to an increase in the state’s fiscal capacity and provision of pro-poor public goods. This is consistent with the redistributionist principle of democratization, in that through fiscal policy democratic governance may economically empower a broader and poorer part of the population, which should reduce inequalities. On the other hand, we demonstrate that for the low-inequality countries, democratization leads to economic liberalizations and freedom to interact in the global economy, which could be the channel through which democratization increases inequalities in the low-inequality cases. An increase in inequality through mechanisms that favor the emergence of a nouveau riche is consistent with the elite-competition view of democratization. On the whole, our research on the channels suggests that the impact of democratization on inequality occurs primarily through reshuffling of economic empowerments and opportunities among citizens, rather than direct fiscal redistribution.
The paper proceeds as follows. In the next section, we put forth a brief theoretical argument concerning the middle ground effect that sets the stage for our empirical analysis. We then describe the variables of interest, the data used for the analysis, and give some preliminary results in the section called “Data and preliminary results.” The section titled “Panel regression results” provides the details of our empirical strategy, our baseline results, and a series of robustness checks. We then circle back to our theoretical argument and investigate some of the mechanisms through which the middle ground effect may operate in the section called “Discussion.” The final section offers our brief concluding remarks.
THEORETICAL REASONING FOR THE MIDDLE GROUND RESULT
In various theories of autocratic survival, autocrats rely on maintaining a “minimum winning coalition” of supporters that can be bought off the most efficiently (De Mesquita et al. Reference De Mesquita, Smith, Morrow and Siverson2003 or Acemoglu, Verdier, and Robinson Reference Acemoglu, Verdier and Robinson2004, for instance, which build on the classic work of Riker Reference Riker1962). The key point for our study is that the size of the winning coalitions in autocracies is much smaller than in democracies, and does not necessarily include the median preference individuals, which may result in relatively more extreme policy outcomes in autocracies. However, the characteristics of the coalition members in autocracies are not the same across autocratic regimes, which cultivate political support according to the relative power of the subgroups in society and form extreme policies to benefit their coalition members.
The identity and characteristics of the winning coalition members may depend on various factors. Naturally, the ideological position of leaders affects, to some extent, which segments of the population are targeted as coalition members. Also, intrinsic characteristics of various subgroups of the population could determine whether they are part of the winning coalition. For instance, the degree of group cohesion and their ability to overcome coordination problems should affect their ability to threaten the regime which in turn may force the leader to include such groups in order to survive. Also, the degree of preference homogeneity of each group should affect the ability of the ruler to obtain their support by making some policy concessions toward this group, as in the standard probabilistic voting model (see, e.g., Coughlin Reference Coughlin1992 or Lindbeck and Weibull Reference Lindbeck and Weibull1987).Footnote 6
The policies targeted to the winning coalition can take the form of pure redistribution and public goods provision (in the egalitarian autocracies) or protection of monopoly rights (in the elite-dominated autocracies) that both affect the distribution of economic opportunities in society and the distribution of income. For instance, if the autocrat’s coalition includes the relatively poor, it is likely that the government provides some targeted public goods, such as basic health services, that benefit disproportionately the poor segment of the population. Extreme policy positions that may emerge from narrow coalitions yield (or protect) extreme distributional outcomes, from highly equal communistic regimes to highly unequal elite-dominated regimes.
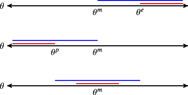
Upon democratization, leaders must establish broader coalitions of political support than those sufficient to maintain power in autocracy. As democratic governance is more inclusive and autocratic governments may court the extremes to form a coalition, the broader democratic coalitions naturally expand to the middle in order to include the median preference voter and obtain a majority of the votes. In other words, the critical member of the (more inclusive) winning coalition in a democracy will be more central in the distribution of policy preferences than previously in autocracies that were governing extreme outcomes (see also Lizzeri and Persico Reference Lizzeri and Persico2004). Democratic institutions should naturally prevent the formation of narrow coalitions based on extreme policy preferences. Since excluded members of the coalition vary substantially across autocracies, one should expect very different policy modifications to satisfy the center following democratization given the fact that the center is being approached from polar starting points. Put differently, those policies that are pursued in new democracies should be heterogeneous according to whether the previous autocratic coalition was pro-poor (low inequality) or pro-elite (high inequality). Thus, on the one hand, highly unequal autocracies are likely to see inequality reduced after democratization, when political institutions become more inclusive to the poorer segment of the population, which should pressure for more pro-poor policies. On the other hand, highly equal autocracies that relied on a poor segment of the population for political support are likely to see inequality rise, as democratic liberalization unwinds a legacy of restrictive economic policies, opening up new entrepreneurial opportunities and income creation. Of course, we also observe centrist autocracies, in which cases we would not expect the decisive voter (hence policy outcome) to shift dramatically upon transition to democracy. Figure 1 depicts the middle ground dynamics that we describe above.
Democratization Shifts Decisive Policy Preference Towards the Center
Note: The minimum winning coalition in democracy (blue) is bigger than that of an autocracy (red). The red line in the top panel depicts an autocratic coalition that serves elite policy preferences (represented by θe), and the red line in the middle panel depicts an autocratic coalition including the poor (represented by θp). We argue that the decisive policy preference in a democracy (represented by θm) will shift towards the middle in either case. In the bottom panel, we depict a centrist autocracy, in which there may be no change in the identity of the decisive voter (hence policy outcome) as the winning coalition broadens upon democratization

After we empirically establish the middle ground result, we consider how democratization impacts several policy areas that should affect the income distribution, and for which the consequences of democratization may be heterogeneous according to which groups were favored prior to democratization. We demonstrate that democratization (i) has no impact on direct fiscal redistribution, (ii) increases state capacity and pro-poor public goods proxied by public health in high-inequality countries but not low-inequality countries, and (iii) leads to less distortionary regulations and more economic freedoms in the low-inequality countries but not in the high-inequality countries.
Our results concerning the channels through which democratization impacts income inequality reveal that just as the impact on inequality levels is conditional upon the initial degree of inequality, so too are the policy modifications through which the effect may operate. High inequality autocracies that were dominated by the elite see democratization lead to more pro-poor policies, which increases the incomes of the poor and reduces inequality levels. Our interpretation is that this is accomplished through redistribution of economic empowerments and market opportunities, as opposed to direct fiscal redistribution, as is often supposed. On the other hand, egalitarian autocracies see democratization result in more free market policies, which allows for income growth and an increase in inequality levels. These results support the notion that autocratic ruling coalitions are narrow and heterogenous entities, since the policy changes after democratization are so asymmetrical. On the whole, we interpret the impact of democratization to be an expansion of economic empowerments and opportunities towards the previously excluded segment of society, which increases the market potential of those segments and drives the middle ground effect on inequality levels that we document in the following sections.
DATA AND PRELIMINARY RESULTS
To investigate the extent to which democratization affects inequality levels, we employ a country-level panel from 1960 to 2010. In the paper, we mainly present results from estimations on yearly panels, though all of our most important tables are also reproduced using five-year panels in the Online Appendix.
Democratic Political Institution Indicator
Our main measure of democracy is a binary indicator for the political system that follows Papaioannou and Siourounis (Reference Papaioannou and Siourounis2008a) and later Acemoglu et al. (Reference Acemoglu, Naidu, Restrepo, Robinson, Atkinson and Bourguignon2015, Reference Acemoglu, Naidu, Restrepo and Robinson2017). We combine the composite Polity2 index of the Polity IV dataset (Marshall, Jaggers, and Gurr Reference Marshall, Jaggers and Gurr2010) with the political freedom and civil liberties indexes of Freedom House (2013).Footnote 7 Specifically, we consider a state as democratic when Freedom House codes it as “Free” or “Partially Free” and the Polity2 index is positive. When one of those two criteria is not satisfied, the state is considered as autocratic. When one of the two criteria is satisfied but the other one is missing, we verify if the country is also coded as democratic by the binary indicator developed by Cheibub, Gandhi, and Vreeland (Reference Cheibub, Gandhi and Vreeland2010).Footnote 8 The democracy indicator [D(0, 1)i,t] takes value zero if country i is determined to be autocratic in period t and it takes value one if country i is determined to be democratic in period t.Footnote 9
The composite measure of democracy captures a bundle of institutions that characterize electoral democracies and affects how well the political process represents individuals in society. The Polity2 index captures the extent to which the political system features free and competitive elections, includes checks on executive power, and has an inclusive political process that permits the various groups of society to be represented politically through the electoral process. Freedom House’s index further incorporates civic rights, which are important to ensure the de facto power of individuals in society. Even when formal constraints on power are written into democratic governance structures, the elite can invest in de facto power and capture democratic governments (Acemoglu and Robinson Reference Acemoglu and Robinson2008). Strong civic rights that allow people to organize, be informed, and put pressure on the executive are essential elements of a well-functioning democracy that can produce policy outcomes near the median voter’s preferences.Footnote 10 By combining these indicators, we do not have priors about which dimension is the most important for affecting income inequality.
Of course, constructing a composite, binary measure of democracy also has its weaknesses: (i) it comes from several indicators which do not necessarily focus on the same dimensions of democratization and some dimensions could matter more than one others, (ii) it does not take into account that in many cases there are no clear jumps from autocracy to democracy but some progressive improvements, and (iii) thresholds are arbitrarily chosen. To demonstrate that our results are robust to these issues, we (i) construct a binary variable based solely on the Polity2 index and (ii) use the Polity2 index in its raw form as a continuous variable (values from −10 to 10). Isolating the Polity2 index captures changes in formal political institutions rather than freedom of civil society to organize. Examining the continuous measure allows us to estimate the effects of more gradual institutional change. As an alternative, we also employ the more recent indicator from Boix, Miller, and Rosato (Reference Boix, Miller and Rosato2012), which is a good alternative since it focuses on the openness of the political process along the dimensions of contestable elections and the participation rate, reflecting the extent to which citizens are included in the political process. Our results are robust to other alternative indicators as well, which we discuss later.
Both the political science and the economics literatures point to the possibility that democratization may be endogenously determined in this relationship, however. Inequality may be one of the grievances in society that affect the citizens’ demands for democracy, which in turn may affect the probability of having a transition (through revolution or concessions of the elite). The multitude of papers that use variation in lagged income inequality to explain democratic transitions (though without consistent results), alerts us to the possibility that trends in inequality may be sufficiently persistent that even future inequality dynamics are influencing contemporaneous transitions to democracy.Footnote 11 As such, we also pursue an instrumental variable strategy that isolates variation in our democracy indicator that is arguably exogenous to the dynamics of national income distributions. We follow the strategy of Acemoglu et al. (Reference Acemoglu, Naidu, Restrepo and Robinson2017) and employ an instrument that relies on the observation that political transitions have historically occurred in regional “waves”Footnote 12 by calculating the evolution of the fraction of countries with democratic institutions in a region among countries that shared the same political institutions at the beginning of the panel.Footnote 13
More formally, we construct the following instrument for democratization events in country i of region r in period t, which we denote by  $Z_{i,t}^r$:
 $$Z_{i,t}^r = {1 \over {N_{i,0}^r - 1}}\sum\limits_{j \in r,{D_{j,0}} = {D_{i,0}},j \ne i} {{D_{j,t}}} ,$$
where  $N_{i,0}^r$ corresponds to the number of countries in the region of country i with the same institution as country i at the beginning of the panel (D j,0 = D i,0). For a country i we sum the number of countries sharing i’s initial type of political institution (j ≠ i,
 $j \in N_{i,0}^r$) in the region r that are democratic at time t (D j,t) excluding country i. For instance, in a region in which initially 10 countries were autocratic, when considering one of them (country i), we look at the evolution of our democracy indicator in the nine others in order to explain changes in country i. Intuitively, we expect that what happens in the regional countries is not related to the degree of inequality in the domestic country i, except through its influence on domestic political institutions.Footnote 14 This instrument allows us to isolate an exogenous variation in democratic institutions that lends a causal interpretation to our results. We refer to the instrument for democracy as the “dynamic regional share of democracies.”
We have strong theoretical priors that such an instrument would be highly relevant, and indeed, we later report some first-stage F-statistics over 100. One limit of our instrument is the possibility that transitions in neighboring countries affect growths there, which could affect growth in country i if the regional economies are integrated and affect both inequality and the probability to observe a transition in country i. Growth rates may, for instance, affect the probability of democratization through the opportunity cost channel à la Acemoglu and Robinson (Reference Acemoglu and Robinson2001) or through a process of modernization à la Lipset (Reference Lipset1959). Growth may also affect inequality through the hypothesized “Kuznets curve” relation (Kuznets Reference Kuznets1955), though empirical evidence of such a relation is mixed. We thus control for the log of real GDP per capita in every specification of our paper. A section of the Online Appendix is dedicated to a detailed examination of the exclusion restriction and tests the impact of deviation from strict exogeneity of the instruments.
Income Inequality
For the inequality data, we use the most standard measure of income inequality, the Gini coefficient, which is a normalized measure between 0 and 100, where higher levels indicate a more unequal income distribution. We employ the Standardized World Inequality Indicators Database (SWIID), introduced by Solt (Reference Solt2009) and recently updated by Solt (Reference Solt2016) in the 6.1 version of the dataset.Footnote 15 The SWIID relies on many sources to provide data on inequality over a cross-national panel that is significantly enlarged from the individual databases.Footnote 16 The SWIID uses Bayesian techniques to standardize observations collected from those various sources and make them comparable (see Solt Reference Solt2016 for details).
The main advantage of this dataset is its impressive coverage. To our knowledge, this is the only dataset on inequality that allows for the study of long-run inequality dynamics at a cross-national level that includes developing countries. On the other hand, there are some drawbacks to using the SWIID, namely that it relies on estimations to fill in missing data points. Also, even if the SWIID harmonization procedure allows a maximal degree of comparability across time and space, one should recall that the various series come from different sources that use different methodologies to collect and compute the degree of inequality. Note, however, that the incomparability should be higher across than within countries since the sources differ more across countries. As our regression estimations include country fixed effects, the across-country comparability should not be a major concern.Footnote 17
In the SWIID database (6.1 version), the remaining incomparability is reflected in the standard errors of the SWIID estimates, where the Gini estimates and their associated uncertainty are represented by 100 draws from the posterior distribution. In other words, we have 100 imputations for each country/year observation. Whenever possible, as recommended by Solt (Reference Solt2016), we have used the multiple imputation (MI) regression tools provided by Stata for analyzing multiple imputation data. Basically, it performs regressions over each of the 100 imputations in order to provide a reliable estimate of the coefficients which takes into account the standard errors across the 100 imputations. This implies that the uncertainty of the SWIID estimates is taken into account in the MI regression estimates. Unfortunately, for some regression techniques, MI regression tools are not available (e.g., 2SLS and GMM). When employing techniques for which the MI regression tools were not available, we have taken the median imputed series for each country and performed the regressions on that single point estimate.Footnote 18 In our first table of results, we demonstrate that our baseline result with the MI regression over all 100 imputations is very similar to the analogous estimation using the median imputed series (see Table 3).
We are interested in observing how democratization events affect future inequality levels. We have hypothesized that the level of inequality before democratization will shape the direction of the relationship. In order to capture this conditional effect of democracy on inequality, we add an interaction between the democracy indicator and the degree of inequality in the country prior to democratization. We define a fixed predemocracy inequality variable for these interaction terms. Note that the level of inequality in the year of the democratic switch may not accurately reflect the level of inequality prevailing in autocracy since, for example, the regime may have made concessions through redistribution before being forced to democratize. Therefore, whenever possible, we take as the predemocracy level of inequality the level of inequality prevailing five years before democratization occurs. When not available, we take the closest observation available for inequality to the five-year window (for instance, four years before democratization occurs if the observation five years before is not available). We label this transition-specific variable as  $\overline {Gin{i_i}}$. Note that for each variable we generate using the SWIID data, 100 imputations are also generated and each imputation is linked across the various variables we create.Footnote 19
To provide further intuition for the battery of regression results that follow, we first consider several descriptive figures. We calculate the difference in the Gini coefficient ten years after a transition from its predemocracy initial level. The left-hand side of Figure 2 scatters this difference against the predemocracy level for the net Gini coefficients  $\left( {\overline {Gini} } \right)$. The negative relationship is strongly statistically significant and the R 2 is quite high for such a simple regression. The right-hand side of Figure 2 is the analogue for the gross Gini coefficient, for which the correlation is very similar, though slightly weaker. The figure shows that ten years after a switch to democracy, inequality increases in countries that were egalitarian autocracies and inequality decreases in countries that were unequal autocracies. The democratic switches and the raw data for the left-hand side of Figure 2 are presented in Online Appendix Table A.1.
Democratic Transition Episodes and Changes in Gini Coefficients
Note: The figures scatter the change in the Gini coefficient ten years after a democratic transition (y-axis) against the pretransition Gini coefficient for the 70 transition episodes in our data. The inequality measures are calculated using the median imputed series from the Solt (Reference Solt2016) data. The bivariate regression for the left-hand side is Δ Net Gini = 8.80*** − 0.23*** ×  $\overline {{\rm{Gini}}}$, with R 2 = 0.20. The bivariate regression for the right-hand side is Δ Gross Gini = 10.11*** − 0.23*** ×
 $\overline {{\rm{Gini}}}$ with, R 2 = 0.14

In the 2SLS estimations that instrument for democratization using the dynamic regional share of democracies, we also instrument for the interaction term by simply interacting the predemocracy level of inequality  $\left( {\overline {Gini} } \right)$ with the dynamic regional share of democracies, as recommended by Wooldridge (Reference Wooldridge2010).
Income Per Capita
Finally, in all regressions we have controlled for the lag of logged real GDP per capita, as measured by the Penn World Table (Feenstra, Inklaar, and Timmer Reference Feenstra, Inklaar and Timmer2015). For the OLS specifications, it is a routine and obvious control since both the likelihood of democracy and the evolution of income inequality may depend on economic development levels. For the IV specifications, controlling for economic growth should help to satisfy the exclusion restriction due to the indirect effect of democratization in neighboring countries on economic growth. Summary statistics of all the variables used in the benchmark analysis are presented in Table 2.
Summary Statistics for Baseline Sample

PANEL REGRESSION RESULTS
This section presents the results of a series of dynamic panel regression models that highlight how the effect of democratization on inequality depends on initial levels of inequality. Our table of baseline results (Table 3), estimated over yearly panels, first presents results from regressions where democratization and initial inequality are not interacted and then present a series of regressions that highlight how the effect of democratization significantly interacts with initial inequality levels. Our baseline specifications are estimated with OLS, for which we have implemented MI regression, as recommended by Solt (Reference Solt2016). We then provide OLS estimates with the median imputed series to verify that they are not significantly different from the MI regression estimates. Finally, Table 3 presents 2SLS estimates are run on the median imputed series. Table 4 estimates the conditional relationships with longer lags on the democracy variable and over longer-term panels. Table 5 considers several intuitive sample restrictions, Table 6 considers alternative democracy indicators, and Table 7 presents several placebo tests. Finally, we demonstrate that the results are quite similar when using the gross Gini coefficient as the dependent variable (in Table 8) and show that direct fiscal redistribution does not seem to react to democratization, which leads us into our investigation of the mechanisms that may be driving the middle ground result.
Effect of Democracy on the Net Gini Coefficient

Note: Robust standard errors clustered by country are in parentheses. Columns (1)–(4) perform multiple imputation regressions with OLS over all 100 imputations. Columns (5)–(8) present the second stage of 2SLS estimated on the point estimate of the median imputed series. The first stage of the 2SLS regression is presented in the Online Appendix. Referring to the Cragg–Donald (C–D) F-statistic, the test’s null hypothesis is that the set of instruments is weak. For this weak instrument test, Stock–Yogo critical values for 10%/25% maximal IV size are 13.43/5.45 for the 2SLS specification with three excluded instruments and 19.93/7.25 for the 2SLS specification with two excluded instruments. The Hansen J-statistic tests for exogeneity of the set of instruments and has null hypothesis that the set of instruments is exogenous. The panel runs from 1960–2010 for all specifications. ***/**/* represent significance at the 0.01/0.05/0.10 levels, respectively.
Longer Lag Periods and Longer Panels

Note: a represents 5 years in columns (1)–(2) and (5)–(6). a represents 10 years in columns (3)–(4) and (7)–(8). b represents 1 year in columns that employ yearly panels (1)–(4). b represents 5 years in columns (5)–(6) and 10 lags in columns (7)–(8). Robust standard errors clustered by country are in parentheses. ***/**/* represent significance at the 0.01/0.05/0.10 levels, respectively.
Alternative Samples

Note: Robust standard errors clustered by country are in parentheses. The first stage regressions of the 2SLS results can be found in the Online Appendix. Stock–Yogo critical values for 10%/25% maximal IV size are 19.93/7.25. The panel runs from 1960–2010 for all specifications. ***/**/* represent significance at the 0.01/0.05/0.10 levels, respectively.
Alternative Democracy Indicators

Note: Robust standard errors clustered by country are in parentheses. For the continuous measures of democracy, the long-run effects are calculated for a within-sample one-standard deviation of the Polity IV index. The first stage regressions of the 2SLS results can be found in the Online Appendix. Stock–Yogo critical values for 10%/25% maximal IV size are 19.93/7.25. The panel runs from 1960–2010 for all specifications for the binary indicators and 1961–2010 for the continuous indicator. ***/**/* represent significance at the 0.01/0.05/0.10 levels, respectively.
Placebo Tests

Note: Robust standard errors clustered by country are in parentheses. The panel runs from 1960–2010 for all specifications, but gets trimmed by the lead times for affected countries. ***/**/* represent significance at the 0.01/0.05/0.10 levels, respectively.
Effect of Democracy on the Gross Gini Coefficient and Fiscal Redistribution

Note: Robust standard errors clustered by country are in parentheses. The panel runs from 1960–2010 for all specifications. ***/**/* represent significance at the 0.01/0.05/0.10 levels, respectively.
Baseline Regression Analysis
The first column of Table 3 tests the extent to which democratization can explain within-country variation in inequality levels, using all of the available data. Running OLS through multiple imputations, we first estimate:
 $$\eqalign{Gin{i_{i,t}} = \rho Gin{i_{i,t - 1}} + \alpha D{\left( {0,1} \right)_{i,t - 1}} \quad\quad\cr+ \beta GD{P_{i,t - 1}} + {\gamma _i} + {\delta _t} + {u_{i,t}},$$
where D(0, 1)i,t is the indicator for democracy that was described above, the γi’s denote a full set of country dummies that capture any time-invariant country characteristics that affect inequality levels, and the δt’s denote a full set of period dummies that capture common shocks to inequality levels. As inequality levels may be path dependent and change rather slowly over time, we also include lagged dependent variables. The error term u i,t captures all other factors not correlated with our controls which may also explain democratic switches, with E(u i,t) = 0 for all i and t. All reported standard errors have been clustered at the country level. This initial estimation in column (1) demonstrates that the unconditional effect of lagged democratizations does not explain inequality levels with statistical significance.
Column (2) tests the extent to which the effect of democratization is conditional on initial inequality levels using an interaction term between the democracy indicator and initial inequality levels. Formally, we estimate:
 $$\eqalignb{Gin{i_{i,t}} = \rho Gin{i_{i,t - 1}} + {\alpha _1}D{\left( {0,1} \right)_{i,t - 1}} \cr+ {\alpha _2}D{\left( {0,1} \right)_{i,t - 1}} {\overline {Gini} _i} + \beta GD{P_{i,t - 1}} + {\gamma _i} + {\delta _t} + {u_{i,t}}.$$
Allowing for a conditional effect yields statistically significant estimates for the effect of democratization on inequality levels. For low initial levels of inequality a switch to democracy increases inequality, whereas for high initial levels of inequality democratization decreases inequality. When presenting estimation results that include the interaction term, we also report the p-value from an F-test of joint significance on the coefficients α1 and α2. Note that the marginal effect of democratization when we include the interaction term is given by  ${\alpha _1} + {\alpha _2} \times {\overline {Gini} _i}$. For concreteness, we calculate the long-run effect at the 10th and 90th percentile predemocracy inequality level (among autocratic countries,
 ${\overline {Gini} ^{10}} = 31.3$ and
 ${\overline {Gini} ^{90}} = 51.3$) as
 $${{{{\hat{\alpha }}_1} + {{\hat{\alpha }}_2}{{\overline {Gini} }^{{\it\,{pc}}}}} \over {1 - \sum\limits_{j = 1}^L {{{\hat{\rho }}_{t - j}}} }},$$
where L indicates the number of lagged dependent variables we include in the specification.Footnote 20 In the baseline specifications presented here, we only use one lag due to the fact that further lags of the dependent variable are not significant and close to zero. The regression estimates from column (2) imply that the long-run impact of a switch to democracy for a country in the 10th percentile of inequality is for the net Gini coefficient to increase by almost 2 points. By contrast, the long-run impact for a country in the 90th percentile of inequality is for the Gini coefficient to decrease by more than 3.5 points.Footnote 21 This simple and transparent estimation demonstrates how transitions to democracy, on average, bring extreme income distributions to a “middle ground.” Columns (3)–(4) estimate the same pair of equations using the sample that is available for the 2SLS specification. Columns (5)–(6) then estimate the same pair of equations using the point estimates from the median imputed series, which we employ in our 2SLS estimations. We can see that results in column (4) using multiple imputations and column (6) using the median imputed series are very similar, justifying the use of the median imputed series for the 2SLS estimates.
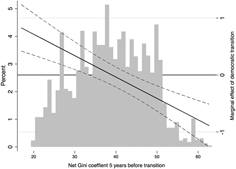
Figure 3 provides a visualization of the conditional marginal effect estimated in column (6). The plotted line shows the marginal effect of a switch from D i,t−2 = 0 to D i,t−1 = 1 on inequality levels in period t as a function of predemocracy inequality levels. The plot is superimposed over a histogram of the distribution of net Gini coefficients to provide a sense of the empirical relevance of the range of initial inequality levels for which the effect of a switch to democracy is statistically significant.
Marginal Effect of Democracy as a Function of the Initial Inequality Level
Note: The figure is based on regression estimates from column (6) of Table 3. Dashed lines represent 95% confidence intervals. The histogram is of the predemocracy levels of income inequality

Estimating a dynamic model with a lagged dependent variable as a regressor may suffer from the so-called dynamic panel bias (Nickell Reference Nickell1981). We note, however, that the size of the bias (1/T) decreases with T (Judson and Owen Reference Judson and Owen1999) and should not be a first-order concern given the time period we consider. In the Online Appendix, we provide some alternative specifications using alternative estimators.Footnote 22
Columns (7)–(8) of Table 3 present results from a 2SLS procedure. We consider both the democracy indicator and its interaction term as potentially endogenous and instrument for both of them. Thus, the first stage equations we estimate are:
 $$\eqalignb{&{ D{\left( {0,1} \right)_{i,t - 1}} = \zeta Gin{i_{t - 1}} \hskip-1pt+ \hskip-1pt{\eta _1}{Z_{i,t - 1}} \hskip-1pt+\hskip-1pt {\eta _2}{Z_{i,t - 1}}} \,{\times \,{\overline {Gini} _i}} \cr&+ \,\theta GD{P_{i,t - 1}} + {\gamma _i} + {\delta _{t - 1}} + {e_{i,t - 1}} \cr&{ D{\left( {0,1} \right)_{i,t - 1}}} \times \,{\overline {Gini} _i} = \zeta Gin{i_{t - 1}} + {\eta _1}{Z_{i,t - 1}}{+ \,{\eta _2}{Z_{i,t - 1}}} \times \,{\overline {Gini} _i} \cr& + \theta GD{P_{i,t - 1}} + {\gamma _i} + {\delta _{t - 1}} + {e_{i,t - 1}}, }}$$
where Z i,t−1 is the excluded democratic wave instrument. We use the fitted values from equation (5) in the second stage to estimate:
 $${{Gin{i_{i,t}} = \rho Gin{i_{i,t - 1}} + \alpha _{\rm{1}}^{{\rm{2S}}}D{\widehat {\left( {0,1} \right)}_{i,t - 1}}}{ + \,\alpha _{\rm{2}}^{{\rm{2S}}}D{{\hskip2pc\vscale190%\hscale1690%\widehat }{\hskip-2pc\left( {0,1} \right)}_{i,t - 1}}} {{{ \, \times\, {\overline {Gini} _i}}}} {\,\,+\,\, \beta GD{P_{i,t - 1}} + {\gamma _i} + {\delta _t} + {u_{i,t}}.}$$
In the main text, we present only the second stage results (with the required first-stage diagnostics). We report results from 2SLS specifications that are over-identified. In order to have an over-identified specification, as a third excluded instrument we also use the regional wave measure from five years before our one-year lagged democratization regressor (or the sixth lag of the share of a country’s region that is democratically governed). As in the OLS regressions, the unconditional effect of a switch to democracy is insignificant when we instrument for democracy. However, conditional on initial levels of inequality, the effect is highly statistically significant [columns (7)–(8)]. Cragg–Donald F-statistics indicate that the set of instruments is strong (well above the rule of thumb 10). Moreover, the tables report the Stock–Yogo critical values to which the Cragg–Donald F-statistics refer and the null hypothesis that the set of instruments is weak is soundly rejected. The Hansen J-test has a null hypothesis that the set of excluded instruments can be considered exogenous and the large p-values comfortably confirm the validity of the set of instruments along this dimension as well. First stage results are available in Online Appendix Table A.2.
We also calculated the implied long-run impact of a switch to democracy and report similarly that democratization, on average, brings extreme income distributions towards a middle ground. The estimates from column (8) imply that a switch to democracy for an autocracy with an initial inequality level at the 10th (90th) percentile leads to a long-run increase by more than three points (decrease by about three points) of the Gini coefficient. Such movements correspond to a nearly one-third reduction in the gap between the 90th and 10th percentile inequality levels for autocratic countries. Moreover, the long-run effects from 2SLS estimates are quite close to those from the simple OLS estimates.
We note the large coefficient on the lagged dependent variable (around 0.90) across the Table 3 specifications, which indicates that the inequality indicator does not change a lot from one year to another. Since the weight of the autoregressive coefficient is crucial for the computation of the long-run effect [see equation (3)], we consider alternative estimations to get at the long-run effect of a democratization episode. In Table 4, we consider longer lags of the democratization variable as well as longer panel lengths. With the annual panel data, columns (1) and (2) estimate the five-year lagged effect of the democratization variable, while columns (3) and (4) estimate the effect of democratization events lagged by ten years. Tables A.4 and A.5 in the Online Appendix show the corresponding 2SLS results from these specifications.
Table 4 also considers longer panel lengths in columns (5)–(8). Longer panel lengths may capture more substantive variation in the variables between each observation, which should reduce the impact of the autoregressive term.Footnote 23 Starting from 1960, we take the variables’ values in the first year of each five-year time period (for the five-year panels) and in the first year of each ten-year time period (for the ten-year panels). Lagged variables are thus lagged by one panel period. Note that the autoregressive term is much less important in the longer-term panels and the estimated coefficients of interest are larger, since they already reflect a longer run impact (five or ten years). For the ten-year panel, the autoregressive term is much less important (0.25 against 0.90 for the yearly panel) and the estimated coefficients of interest are even bigger, reflecting a larger portion (almost all) of the entire long-run effect. The long-run impact computed for the 90th and 10th percentile inequality levels are quite similar to those from the yearly panel data. This suggests that the yearly panel estimations, with their strong autoregressive term, consistently estimate the long-run impact of democratization. Since the yearly panel seems to provide a consistent estimate of the long-run impact in line with the longer-run panels, we have chosen to show results from the yearly panel in the core of the paper. However, the Online Appendix presents our main results estimated over five-year panels as well.
Robustness Analysis and Further Results
This subsection presents some of the various robustness checks that we have conducted as well as several further results.
Restricted Sample: Dropping the Eastern Bloc and Other Regions
Table 5 considers restricting the sample by geographical region. In Panel A we present the results from MI OLS estimations, and Panel B presents the results of 2SLS estimations on the median imputed series. First, column (1) drops countries that were part of the former Soviet Union or signatories to the Warsaw Pact.Footnote 24 That the results are generally quite similar after dropping these groups of countries is reassuring.Footnote 25 Columns (2)–(5) alternatively drop the other geographical regions that may have been influential from the sample. For both the MI OLS and the 2SLS regressions, coefficient estimates and predicted long-run changes in inequality levels remain stable across the various samples. The nonlinearity is not being driven by a particular group of countries, but the pattern appears to be more general.Footnote 26
Alternative Democracy Indicator Coding
Our composite indicator has the merit of including many dimensions of democracy that could be relevant and which are possibly complementary in explaining public policy outcomes that affect inequality levels. However, as explained earlier, it has also some weaknesses. In Table 6, we provide a sensitivity analysis focusing on alternative democracy indicators. Estimating both OLS specifications with the multiply imputed data and 2SLS specifications with the median imputed series, we consider the following alternative indicators. First, we construct a binary indicator based only on the Polity2 score. As is common, the indicator defines a country-year observation as a democracy for positive values and as a nondemocracy for nonpositive values of the Polity2 index. Next, we simply use the raw Polity2 index as a continuous variable. As there is no precise transition date, we use the once-lagged Gini coefficient for the interaction term when employing the continuous measure.Footnote 27 The long-run effects are calculated for a within-sample one-standard deviation of the Polity2 index. Third, we use the binary indicator provided by Boix, Miller, and Rosato (Reference Boix, Miller and Rosato2012). Results are robust to these alternative codings for the democracy indicator.Footnote 28 Columns (1)–(3) perform multiple imputation regressions over all 100 imputations, while columns (4)–(6) present the second stage of 2SLS regressions using the median imputed series. Note that we have reconstructed analogous instrumental variables using these data sets as in equation (1). First stage results from the 2SLS specifications are shown in Online Appendix Table A.7.
Placebo Tests
In Table 7, we have conducted several placebo tests to demonstrate that it is the process of democratization that leads to the “middle ground” convergence of inequality levels, rather than some more general mean reversion process. For each of the four placebos we consider, we first present the unconditional effect of the placebo and then the conditional effect, where the placebo treatment is interacted with the level of inequality five years earlier. First, we consider in columns (1)–(2) a ten-year lead on within-sample democratization episodes as the placebo treatments. For example, Hungary democratized in 1989, so we set its placebo treatment to 1979. Columns (3)–(4) alternatively consider a fifteen-year lead. Reassuringly, neither the placebo treatments nor their interactions with the initial inequality level have a statistically significant effect on net income inequality levels. In columns (5)–(6), we consider the effect of democratic breakdowns. The placebo here takes value one for country-years where the political institution switches from democratic to autocratic and zero otherwise. Notice that the conditional effect of democratic breakdown is statistically significant, but the effect is opposite from a transition to democracy—inequality levels revert away from the middle ground, back to the extremes. Finally, columns (7)–(8) investigate the impact of a civil conflict, using the coding of an “internal armed conflict” from the data presented by Themnér and Wallensteen (Reference Themnér and Wallensteen2013). The civil conflict placebo treatment is also insignificant.
Further Results and Robustness Checks
In addition to the robustness checks already presented in the main text, we have some further results that appear in the Online Appendix that are worth mentioning here. In Table A.8, we include a battery of time-varying covariates into the baseline 2SLS regressions in order to block off channels through which the exclusion restriction might be violated. Notably, we add time-varying controls for economic openness, migration patterns, incidence of civil conflict in the region, and regional trends in inequality. In all cases, the set of excluded instruments remains strong when we control for these time-varying variables, the coefficients of interest remain highly statistically significant, and the calculated long-run effects are quite close to those from our baseline specification.Footnote 29
Tables A.10–A.11 consider further analysis on sample restrictions, including dropping the countries that perform the worst according to economic transparency and several jackknifing procedures. Table A.12 presents estimation results from alternative dynamic panel models (LSDVC and GMM). Table A.13 examines some more alternative democracy indicators. Table A.14 controls for autocratic regime type and Table A.15 shows the results from models with simplified interaction terms. Furthermore, in Tables A.18–A.20, we show that all of our OLS results using the multiple imputations data from the main text are robust to estimation over the five-year panels.
Market Income Inequality
In Table 8, we use the gross Gini coefficient, rather than the net Gini coefficient. When using the gross Gini, the coefficient estimates on the effect of democratization are very similar to the impact on the net Gini—the estimated effects lie well within their respective confidence intervals. This may indicate that the impact of democratization on the net Gini mostly occurs through changes in the market Gini and that pure fiscal redistribution is not the driving force behind the changes in the net Gini that we observe following democratization. Moreover, columns (3)–(4) provide some evidence to this effect. Here, we take the difference between the market and the net Gini, normalized by the market Gini, as a measure of fiscal redistribution. Splitting the sample at the median value for the net Gini, we show that there is no impact of democratization on this measure of fiscal redistribution, for neither the low nor the high inequality countries.Footnote 30
DISCUSSION
Heterogeneous Outcomes and Heterogeneous Mechanisms
In this section, we evaluate several possible mechanisms that could be driving the conditional income inequality dynamics. From the theoretical perspective, we expect policy adjustments that follow democratization to be heterogenous according to whether the autocratic political coalition that precedes democratic transition included the elite (characterized by high inequality) or the poor (characterized by low inequality). We view these differentiated policy changes as an indication that the coalitions that benefited from (or were targeted by) autocratic policies had very different characteristics across the sample of democratizations. We also argue that the variation in coalition-preferred policies among the autocracies may explain the variation in pre-transition inequality levels. This section provides an exploratory analysis into how a range of policy areas, which may be transmission mechanisms for inequality dynamics, respond differentially to democratization. To do so, we conducted a series of split-sample regressions. For each policy area that we investigate, we split the sample with respect to initial, predemocracy inequality levels at the calculated predemocracy inequality level at which the estimated impact of democratization on the Gini coefficient switches from positive to negative [at 38.55 from column (6) of Table 3]. The two main policy area categories are (i) fiscal redistribution, state capacity, and public goods and (ii) economic regulation and economic freedoms.
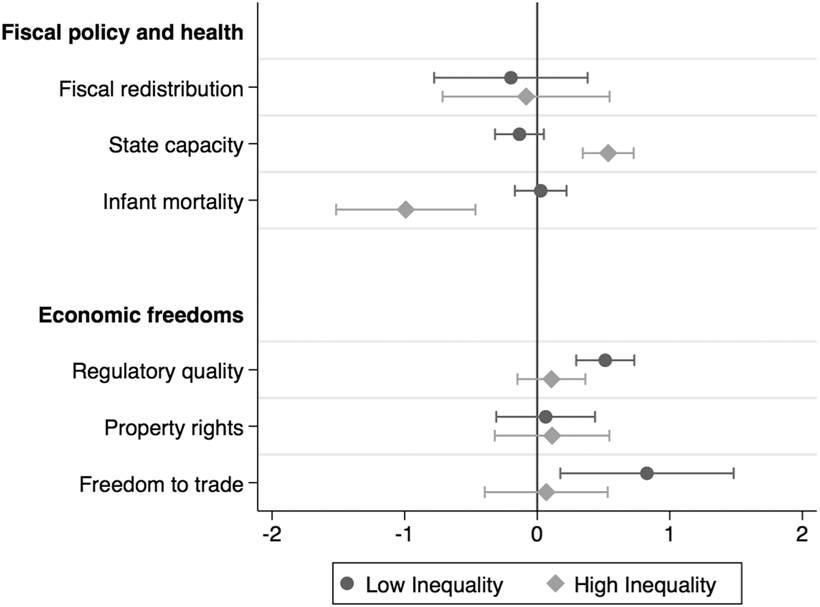
Our investigation concerns six different specific public policy outcomes, for each of which we have run the pair of subsample regressions. For expositional ease, we have plotted the coefficient of interest (on democratization) for each of these 12 regressions in Figure 4. Lines around the point estimates represent 95% confidence intervals. Tables A.16 and A.17 in the Online Appendix present the dynamic fixed-effects panel regressions that underlie the coefficient plots presented here.
Some Heterogeneous Transmission Mechanisms
Note: The estimated marginal effect of a democratic transition on a series of policy areas for the subsamples with high initial inequality (gray diamonds) and low initial inequality (black dots), where the subsample cutoff is a net Gini coefficient of 38.55. The lines about the point estimates represent 95% confidence intervals

Fiscal Policy and Redistribution
We do not expect democratization to affect inequalities through a pure fiscal redistribution mechanism. Columns (3)–(4) of Table 8 establish this point when the sample is split at the median value for the net Gini coefficient. Here, we repeat the exercise, splitting the sample according to initial inequality levels at 38.55 and estimate the impact of democratization on direct fiscal redistribution, calculated as the normalized difference between the market and net Gini coefficients. Figure 4 reveals that direct fiscal redistribution is not affected by democratization, for neither the low nor the high inequality subsamples.
As direct fiscal redistribution does not seem to be driving the middle ground effect, we proceed to investigate other potential channels. First, and perhaps most generally, democracies tend to invest in state capacity, in the sense that states with greater capacity are more able to make citizens pay taxes, which in turn may be used to intervene in the economy. Following Acemoglu et al. (Reference Acemoglu, Naidu, Restrepo, Robinson, Atkinson and Bourguignon2015), we use the state capacity measure of Arbetman-Rabinowitz et al. (Reference Arbetman-Rabinowitz, Fisunoglu, Kugler, Abdollahian, Johnson, Kang and Yang2014), which corresponds to the tax revenue to GDP ratio compared to what would be predicted by the development level and other characteristics of a country. Figure 4 indicates that democratization increases state capacity in the high inequality subsample, but there is no statistically significant effect in the low inequality subsample.Footnote 31 We interpret this as support for the notion that newly democratic governments develop fiscal capacity that allows them to provide some pro-poor public goods that may reduce inequalities in the high inequality subsample. Our next result confirms this interpretation.
Public Goods
There is existing evidence of an unconditional impact of democratization on the public health of the poor, proxied by infant mortality (Acemoglu et al. Reference Acemoglu, Naidu, Restrepo and Robinson2017; Besley and Kudamatsu Reference Besley and Kudamatsu2006; Kudamatsu Reference Kudamatsu2012), though disputed by some scholars (notably, Ross Reference Ross2006). We also investigate infant mortality rates, using data from the WDI, but find a heterogeneous effect of democratization. In Figure 4, we see that democratization improves infant mortality only for the high-inequality subsample, which supports the notion that democratization improves pro-poor policies in the autocracies whose winning coalitions previously excluded the poor.Footnote 32 This outcome can of course be seen as a by-product of more general policies targeted to the poor that reduce inequality (in line with the narrow coalition stories we presented previously) but it can also be seen as a direct channel through which inequality can be reduced as it can directly affect economic empowerment. Good health affects labor productivity (Bloom, Canning, and Sevilla Reference Bloom, Canning and Sevilla2004), increases life expectancy and thus fosters investment in education (Jayachandran and Lleras-Muney Reference Jayachandran and Lleras-Muney2009), or improves school attendance and performance (Jackson et al. Reference Jackson, Vann, Kotch, Pahel and Lee2011).
Economic Liberalization
We next examine the extent to which liberalizing political institutions are associated with economic liberalizations that make economies more competitive through, for example, the removal of barriers to entry or trade (Chen and Li Reference Chen and Li2018; De Haan and Sturm Reference De Haan and Sturm2003; Djankov et al. Reference Djankov, La Porta, Lopez-De-Silanes and Shleifer2002; Fidrmuc Reference Fidrmuc2003; Méon and Sekkat Reference Méon and Sekkat2016; Rode and Gwartney Reference Rode and Gwartney2012). Increased entrepreneurial opportunities may allow for some new high incomes to be created, increasing inequality, especially in economies where opportunities for income growth and the resulting income inequality were suppressed by egalitarian populist policies. We expect that this mechanism could explain the increase in inequality observed in low inequality countries. We use data from the Fraser Institute on the degree of regulation on credit, labor, and good markets; the strength of property rights protection; and the extent to which domestic actors are “free to trade” internationally.Footnote 33 For all three indicators, higher values indicate more free-market policy environments, i.e., greater economic freedom. For regulatory quality and freedom to trade, Figure 4 confirms our intuition that increases in inequalities in the egalitarian autocracies upon political liberalization may have been driven by an accompanying economic liberalization (at least concerning regulatory quality and freedom to trade internationally).Footnote 34 There was, however, no impact on the protection of property rights for either of the subsamples.
On the whole, our results concerning the channels through which democratization impacts income inequality reveal that just as the impact on inequality levels is conditional upon the initial degree of inequality, so too are the policy channels through which the effect may operate.Footnote 35 Autocracies that were dominated by the elite see democratization expand the winning political coalitions to include the poor and a shift towards more pro-poor policies, which increases the incomes of the poor and reduces inequality levels. Our results suggest that this is accomplished through a redistribution of market opportunities via state development and public goods provision, as opposed to a direct fiscal redistribution as is often supposed. On the other hand, egalitarian autocracies see democratization expand the winning political coalitions to include more higher class interests and a shift towards more free market policies, which allows for income growth through entrepreneurial activities and an increase in inequality levels. On the whole, we interpret the impact of democratization to be an expansion of economic empowerment and opportunities towards the previously excluded segment of society, which increases the market potential of those segments and drives the middle ground effect on income inequality levels that we have documented in our principal analysis.
Comparison with Related Literature
The paper is most closely related to Acemoglu et al. (Reference Acemoglu, Naidu, Restrepo, Robinson, Atkinson and Bourguignon2015), who also investigate the effect of democracy on levels of inequality. The literature review found there convincingly argues that there is no empirical consensus concerning the effect of democracy on inequality levels. Using fixed-effects panel regression techniques, Acemoglu et al. (Reference Acemoglu, Naidu, Restrepo, Robinson, Atkinson and Bourguignon2015) find mainly null results in tests of the unconditional correlation between democracy and income inequality, which are confirmed by Gründler and Krieger (Reference Gründler and Krieger2016) and Knutsen (Reference Knutsen2015).
Acemoglu et al. (Reference Acemoglu, Naidu, Restrepo, Robinson, Atkinson and Bourguignon2015) do, however, include some specifications which allow for democracy to have heterogeneous effects according to land inequality, share of agriculture in the economy, as well as top and bottom decile income shares. They find some evidence of a heterogeneous effect with regard to the distribution of land and with regard to the agricultural share.Footnote 36 However, they find no consistent evidence that bottom or top decile income shares shape postdemocratization income inequality dynamics. Our paper complements their results substantially. The conditional effect that we have investigated is more general and rests on the intuition that democracy provides a middle ground on which societies with relatively extreme income distributions can converge. Furthermore, we have pursued an instrumental variables strategy and demonstrated that the conditional effect of democracy on income inequality can be interpreted causally.
In our investigation of the channels through which democratization may affect inequality, the result that direct fiscal transfers do not increase upon a transition to democracy is consistent with existing evidence for England and European countries provided by Aidt, Dutta, and Loukoianova (Reference Aidt, Dutta and Loukoianova2006) and Aidt, Daunton, and Dutta (Reference Aidt, Daunton and Dutta2010). As in our study, those authors find that democracy increases the amount of public expenditure on health (as well as education). We push the analysis further by investigating a conditional effect and focus on a broader range of countries.
Even though our paper has considered the effect of democratization on inequality levels, it is also relevant for the literature on the causes of democratization. The canonical rational choice model of democratization (Acemoglu and Robinson Reference Acemoglu and Robinson2001, Reference Acemoglu and Robinson2006; Boix Reference Boix2003) supposes that democratically determined fiscal redistribution follows the logic established by Meltzer and Richard (Reference Meltzer and Richard1981), where democracies with greater inequality redistribute more. In those models of democratization, higher inequalities affect the probability of a transition and are associated with greater redistribution if the country democratizes.
We have demonstrated that inequality does fall following democratization, but on average, only in countries where inequality was initially high. Therefore, high inequality levels can be a source of tension that drives democratization, but it is not a general pattern because some autocracies are quite egalitarian with little to redistribute. Furthermore, the mechanism that drives reductions in inequality in the high inequality countries is not direct fiscal redistribution, as supposed by the redistributionist models of transition. The result that democratization does not affect inequality through a purely redistributive channel is consistent with an emerging literature that suggests that the primary motive for democratization is not purely redistributionist (Aidt and Jensen Reference Aidt and Jensen2009; Ansell and Samuels Reference Ansell and Samuels2014; Haggard and Kaufman Reference Haggard and Kaufman2012; Knutsen and Wegmann Reference Knutsen and Wegmann2016). However, the fact that highly unequal countries become more equal through other fiscal mechanisms or due to changes in economic empowerment does not invalidate the mechanism highlighted by previous models in which inequality is the grievance. We see our contribution as a confirmation that this grievance may well describe the pressures on autocrats to democratize. We show, however, that this grievance does not concern all countries but only a subgroup whose initial inequality levels were relatively high.
On the other hand, for countries that are initially characterized by low inequality, the increase in inequality that follows democratization seems to be driven by changes in market opportunities, which in this case generate new inequalities. In our mind, this is consistent with theories of democratization in which elite competition plays a crucial role (e.g., Ansell and Samuels Reference Ansell and Samuels2014, Larsson-Seim and Parente Reference Larsson-Seim and Parente2013, or Llavador and Oxoby Reference Llavador and Oxoby2005) or where inefficient economic policy is a source of grievance (Dorsch, Dunz, and Maarek Reference Dorsch, Dunz and Maarek2016; Dorsch and Maarek Reference Dorsch and Maarek2015). In these theories, democratization may be associated with reforms of economic institutions that enhance competition, open up the economy, and promote economic freedoms in general. Such reforms may foster structural transformation and the emergence of a new elite, which operates in new sectors of the economy, leading to new economic opportunities for many citizens, enhancing growth but also increasing inequality levels. Our middle ground result and our investigation into the mechanisms reconcile these two strands of the literature on democracy and inequality and more generally on the causes of democratization.
CONCLUDING REMARKS
There is no empirical consensus about whether or not autocracies that democratize become more egalitarian. We propose that the reason for this is that autocracies are highly heterogeneous with respect to how incomes are distributed. Intuitively, autocracies allow for extreme policy outcomes that might not be possible in democratically governed societies, where policy outcomes should follow more closely to the middle of the distribution of policy preferences. Allowing for the effect of democracy to interact with predemocracy inequality levels, we demonstrate a robustly statistically significant conditional effect of democratization on inequality levels. Highly unequal autocracies become more equal following switches to democracy, whereas egalitarian autocracies become less equal. In sum, democratization has a strong impact on inequality levels, but the effect pushes in opposite directions depending on prevailing levels of inequality prior to the switch to democracy, which rationalizes the typical null result found in the literature. An instrumental variable analysis suggests that the conditional effect of democracy on income inequality can be interpreted causally.
Moreover, we have provided an initial empirical venture into the mechanisms that may be driving the result and demonstrated a heterogeneity there too. In autocratic countries that were initially egalitarian, democratization leads to economic liberalization, both domestically and internationally, which may be leading to increased inequality following a switch to democracy in those countries. On the other hand, in autocratic countries that were initially unequal societies, democratization seems to improve the state’s capacity, in general, and it’s provision of pro-poor public goods, in particular. Both of these mechanisms would be consistent with our broader theoretical observation, that policy decisions shift towards a middle ground following a democratization and that income distributions tend to follow. In general, it seems that democratization’s impact on income distribution works through a redistribution of economic empowerment and opportunity, rather than through direct fiscal redistributions that have been emphasized in previous theoretical work.
SUPPLEMENTARY MATERIAL
To view supplementary material for this article, please visit https://doi.org/10.1017/S0003055418000825.
Replication materials can be found on Dataverse at: https://doi.org/10.7910/DVN/D64FNB.









Comments
No Comments have been published for this article.