Introduction
Transition metal dichalcogenide (TMD) monolayers are promising optoelectronic platforms because of their direct bandgap near 2 eV and 102 pm/V second-order nonlinear susceptibility, χ(2). Interfacing monolayer TMD with metal nanoantennas offers additional degrees of freedom in design of optoelectronics via surface plasmon light manipulation. Examination of optoelectronic processes in nanoantenna-TMD heterostructures has to date focused on linear optical operations, where polarization, P, responds linearly to the excitation field Eω at a frequency ω according to χ(1). As examples, far-field optical absorption and scattering activity,[Reference Forcherio and Roper1] 10–1000 × enhanced TMD absorption/emission,[Reference Palacios, Park, Butun, Lauhon and Aydin2] photoluminescence (PL) quenching,[Reference Bhanu, Islam, Tetard and Khondaker3] and 11–38% efficient plasmonic hot electron transport[Reference Yu, Ji, Zu, Du, Kang, Li, Zhou, Shi and Fang4, Reference Forcherio, Dunklin, Backes, Vaynzof, Benamara and Roper5] have been reported. Extraordinary second harmonic generation (SHG) and frequency mixing have been measured from two-dimensional (2D) TMD arising from the second-order nonlinear contribution to P that scales with  ${\bi E}_{\omega} ^2 $ according to their large χ(2).[Reference Clark, Senthilkumar, Le, Weerawarne, Shim, Jang, Shim, Cho, Sim, Seong, Rhim, Freeman, Chung and Kim6–Reference Fryett, Zhan and Majumdar10] Although SHG and third harmonic generation (THG) have been demonstrably augmented 60–1700 × by plasmonic fields in many nanomaterial heterostructures,[Reference Chen, Durak, Heflin and Robinson11–Reference Metzger, Hentschel, Schumacher, Lippitz, Ye, Murray, Knabe, Buse and Giessen17] such activity remains largely unexplored for nanoantenna-TMD systems.
Fryett et al. first reported 200 × enhancement of SHG from a sub-region of mechanically-exfoliated monolayer tungsten diselenide (WSe2) by a linearly-polarized Si cavity photonic crystal, after deconvoluting SHG from background PL bands.[Reference Fryett, Zhan and Majumdar10, Reference Fryett, Seyler, Zheng, Liu, Xu and Majumdar18] Enhanced SHG was ostensibly due to the augmented Eω strength from the photonic cavity crystal. Wang et al. later used selective excitation of lateral gap plasmons within 20 nm trenches of a Au film that supported a WSe2 monolayer to point-wise enhance SHG 47 × within the trench sub-regions, and 7000 × relative to WSe2 on sapphire.[Reference Wang, Dong, Zhu, Jin, Chiu, Li, Xu, Eda, Maier, Wee, Qiu and Yang19] Equation (1) classically describes SHG intensity, I 2ω, for such heterostructures in the absence of SHG contributions from the resonator component:
 $$I_{2\omega} = \displaystyle{{\pi ^2c\epsilon _o} \over {2n_\omega ^2 n_{2\omega} \lambda _\omega ^2}} \left[ {\chi _{2\omega} ^{(2)}} \right]^2L^2\left( {\gamma \left \vert {{\bi E}_\omega} \right \vert} \right)^4$$
according to constants (free-space permittivity, ε o; speed of light, c), nonlinear source material parameters ( $\chi _{2\omega} ^{(2)} $; linear refractive index, n; thickness, L), the pump field strength, E ω, at wavelength λ ω, and a field augmentation factor, γ, induced by the single-mode resonator component.
This work examines enhanced SHG from ~4 × 10⁵ nm2 molybdenum disulfide (MoS2) monolayers in the presence of localized surface plasmon resonances (LSPR) excited on single 150 nm gold@silica (Au@SiOx) shell@core nanoantenna monomers and dimers using a tunable Ti:Sapphire-pumped multiphoton microscope and discrete dipole approximation (DDA). The Au@SiOx nanoantenna(s) and MoS2 function as the single-mode resonator(s) and nonlinear source material in this work, respectively. Results in the forthcoming sections are organized as follows:
(1) Raw SHG data for MoS2 with a single Au@SiOx nanoantenna
(2) Control experiments for Au@SiOx nanoantennas and MoS2
(3) SHG enhancement from MoS2 by two different Au@SiOx nanoantenna dimers
(4) Calculated SHG conversion efficiencies for each Au@SiOx nanoantenna-MoS2 heterostructure.
Results
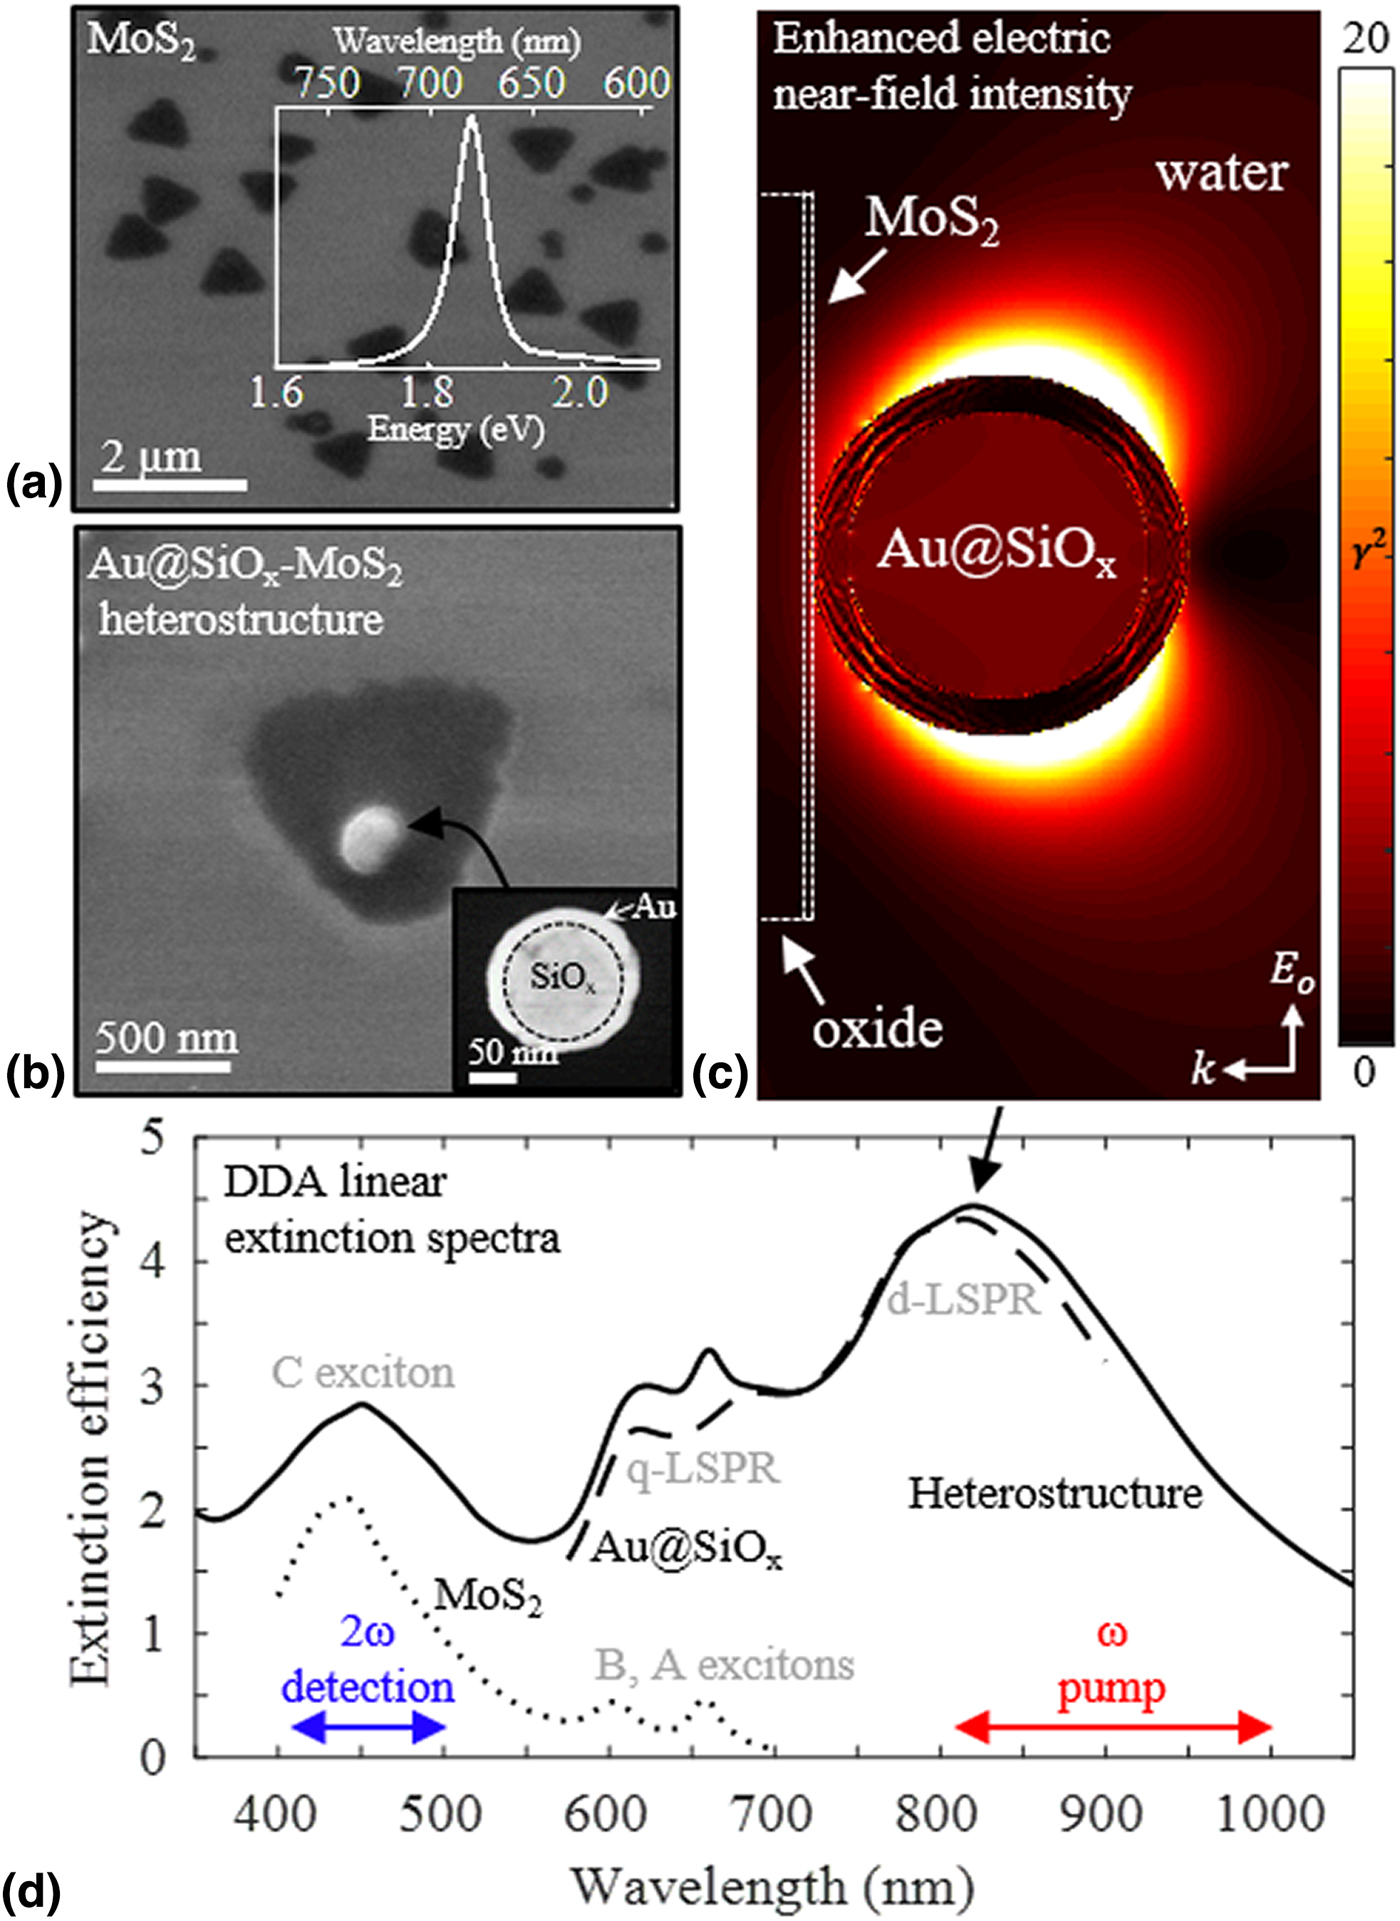
Au@SiOx shell@core nanoantennas were drop-cast onto MoS2 monolayers (~1 µm edge length, 4 × 10⁵ nm2 area) fabricated via chemical vapor deposition (CVD) onto silicon (Si) wafer with 300 nm oxide (CVD-MOS2; 2Dsemiconductors, Scottsdale, AZ, USA). Figure 1(a) shows a scanning electron microscopy (SEM; Philips XL40, FEI, Hillsboro, OR, USA) micrograph of MoS2, with PL inset revealing a 1.86 eV maxima coinciding with the A exciton transition. The 148 ± 8 nm overall diameter Au@SiOx nanoantennas had a 15 ± 6 nm Au shell on a 120 nm SiOx core (lot MGM1774; nanoComposix, San Diego, CA, USA). Figures 1(b) shows a SEM micrograph of a representative Au@SiOx-MoS2 monomeric heterostructure. Scanning transmission electron microscopy (STEM; Tecnai F-20, FEI, Hillsboro, OR, USA) analysis, inset in Fig. 1(b), revealed the core-shell architecture of the Au@SiOx nanoantenna. Stochastic deposition of nanoantennas by the drop-cast protocol resulted in isolated Au@SiOx nanoantennas and MoS2 monolayers, in addition to the heterostructures, within the same sample. Particular isolated nanoantennas and monolayers were analyzed independently as negative controls. Figure 1(c) shows enhanced optical near-field intensity, 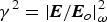 $\gamma ^2 = \vert {{\bi E}/{\bi E}_o} \vert_\omega ^2 $, at the 820 nm dipole LSPR of a monomeric heterostructure calculated using DDA solutions to Maxwell's equations. Figure 1(d) shows the calculated linear extinction spectra, absent any nonlinear interaction. Exciton transitions and LSPR features in the spectra are labeled. Details of computation, fabrication, and microscopic/spectroscopic characterization are in the Supplementary Material.
(a) SEM micrograph of CVD MoS2 on a Si wafer and PL from 488 nm excitation (inset). (b) SEM micrograph of a representative Au@SiOx-MoS2 heterostructure. Inset is a STEM image of a single Au@SiOx nanoantenna with labeled Au shell and SiOx core. Accelerating voltages in SEM and STEM were 5 and 120 kV, respectively. (c) Enhanced optical intensity factor,  $\gamma ^2 = \vert {{\bi E}/{\bi E}_o} \vert_\omega ^2 $, in the heterostructure excited at the 820 nm dipole LSPR mode of the nanoantenna. The scale was truncated to a maximum of 20 from a simulated high value near 60 to emphasize the dipole pattern. (d) Calculated linear optical extinction spectra via DDA for a Au@SiOx-MoS2 heterostructure (solid), single Au@SiOx nanoantenna (dashed), and a MoS2 monolayer (dotted), each on a silica substrate and immersed in water. Resonant modes of the system (gray text) and pump/detection frequencies from which SHG was experimentally interrogated are labeled.

Enhanced SHG from microscale MoS2 by a single Au@SiOx nanoantenna
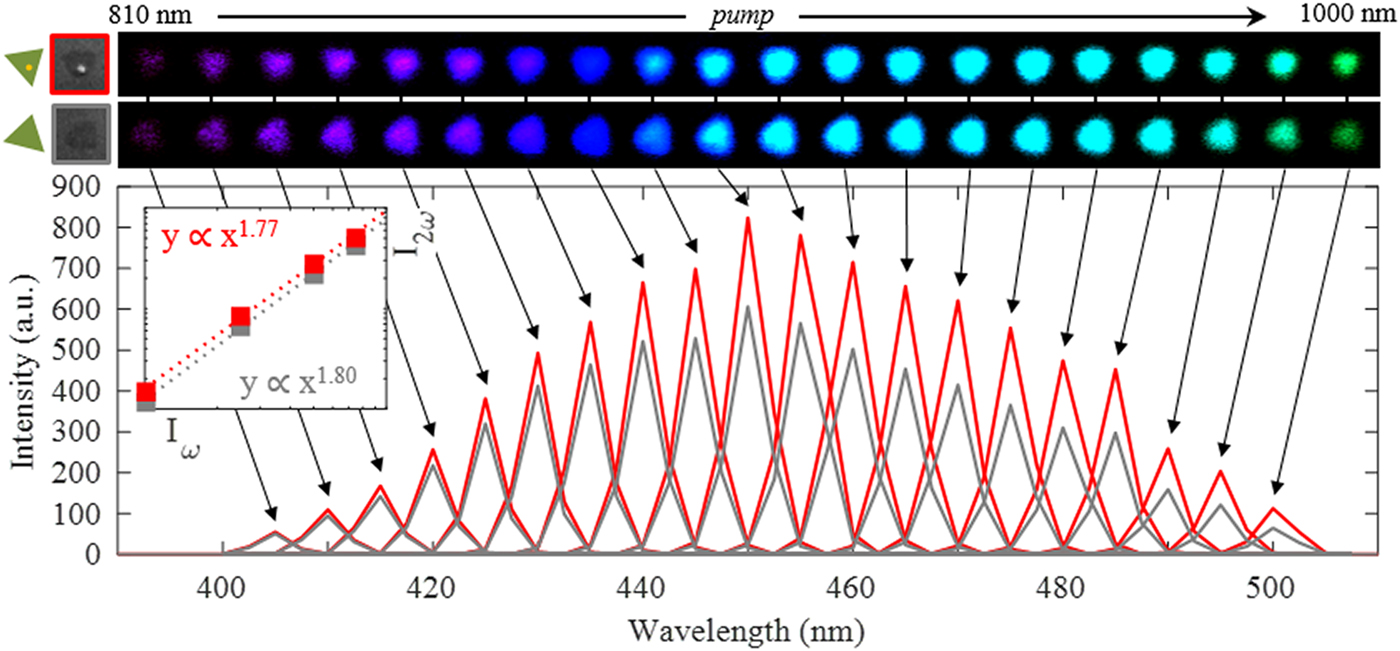
SHG from monolayer MoS2 in the presence of a single Au@SiOx nanoantenna was measured with a laser-scanning multiphoton microscope (A1R-MP; Nikon Instruments Europe, Amsterdam, NLD) coupled to a wavelength tunable, 100 fs Ti:Sapphire laser (MaiTai Deep See; Spectra-Physics, Santa Clara, CA, USA). Figure 2 shows detected spectra arising from 810 to 1000 nm ω excitation of a CVD-synthesized, ~4 × 10⁵ nm2-area MoS2 monolayer in the absence (gray) and presence (red) of one 150 nm Au@SiOx nanoantenna at its center. Scattered photons were collected by a 60×, 1.27 NA water-immersion objective and delivered to a photomultiplier tube (PMT) array at 2.5 nm wavelength binning. Corresponding SEM and SHG micrographs are shown above; arrows correlate each SHG micrograph with its associated spectra. Inset confirms second-order nonlinear behavior with a 1.8 power-dependence for the heterostructure. It is noted SHG remains finite at pump wavelengths less than 810 nm and greater than 1000 nm, but acquisition conditions were optimized for this spectral range.
Scattered SHG (per unit area) spectra from a MoS2 monolayer, ~4 × 10⁵ nm2 area, at 810–1000 nm excitation (10 nm step) in the absence (gray) and presence (red) of a single Au@SiOx nanoantenna (15 nm Au shell; 120 nm SiOx core). The inset shows 1.77- and 1.80-power dependence between SH and pump intensities taken at 880 nm excitation, confirming a second-order nonlinear process for the heterostructure and MoS2 control, respectively. SEM and SHG micrographs at each excitation wavelength are shown (top) with arrows to corresponding spectra.

Integrated SHG intensity from the ~4 × 10⁵ nm2 MoS2 area was enhanced 17–84% across the spectrum in the presence of a single 150 nm Au@SiOx nanoantenna, ostensibly due to the surface plasmon-augmented local field. This was despite the relatively small ~5–10% MoS2 surface area shadowed by the nanoantenna, estimated from SEM. At conditions evaluated, ~90–95% of the MoS2 monolayer did not experience local field augmentation by the nanoantenna. Previous reports of plasmon-enhanced SHG citing order-of-magnitude improvements in SHG signal at the LSPR consider (i) a nonlinear medium doped isotropically with nanoantennas or a lithographed nanoantenna lattice or (ii) local, point-wise SHG data. Highest MoS2 SHG enhancements by the single nanoantenna here were observed off-resonance, away from its LSPR. In contrast, maximal MoS2 SHG enhancement by Au@SiOx nanoantenna dimers was near their LSPR (discussed in forthcoming sections). It is hypothesized that off-LSPR occurrence of the maximal SHG enhancement was in part due to plasmonic losses, which consequently caused different laser excitation conditions for TMD at each pump wavelength. Putative dampening of laser energy by plasmonic activity on nanoantenna could arise from: in-plane scattering away from TMD and/or transduction into Landau-damped hot electrons injected into TMD (approximately 11–38% of LSPR dephasing),[Reference Yu, Ji, Zu, Du, Kang, Li, Zhou, Shi and Fang4, Reference Forcherio, Dunklin, Backes, Vaynzof, Benamara and Roper5] for example. Such plasmonic losses alter how the pump laser couples with the MoS2, but are neglected for simplicity in Eq. (1) and will be discussed in more detail in forthcoming sections. SHG from MoS2 and Au@SiOx nanoantenna controls are discussed in the proceeding section to provide context for enhanced SHG from the heterostructures.
MoS2 and Au@SiOx nanoantenna control experiments
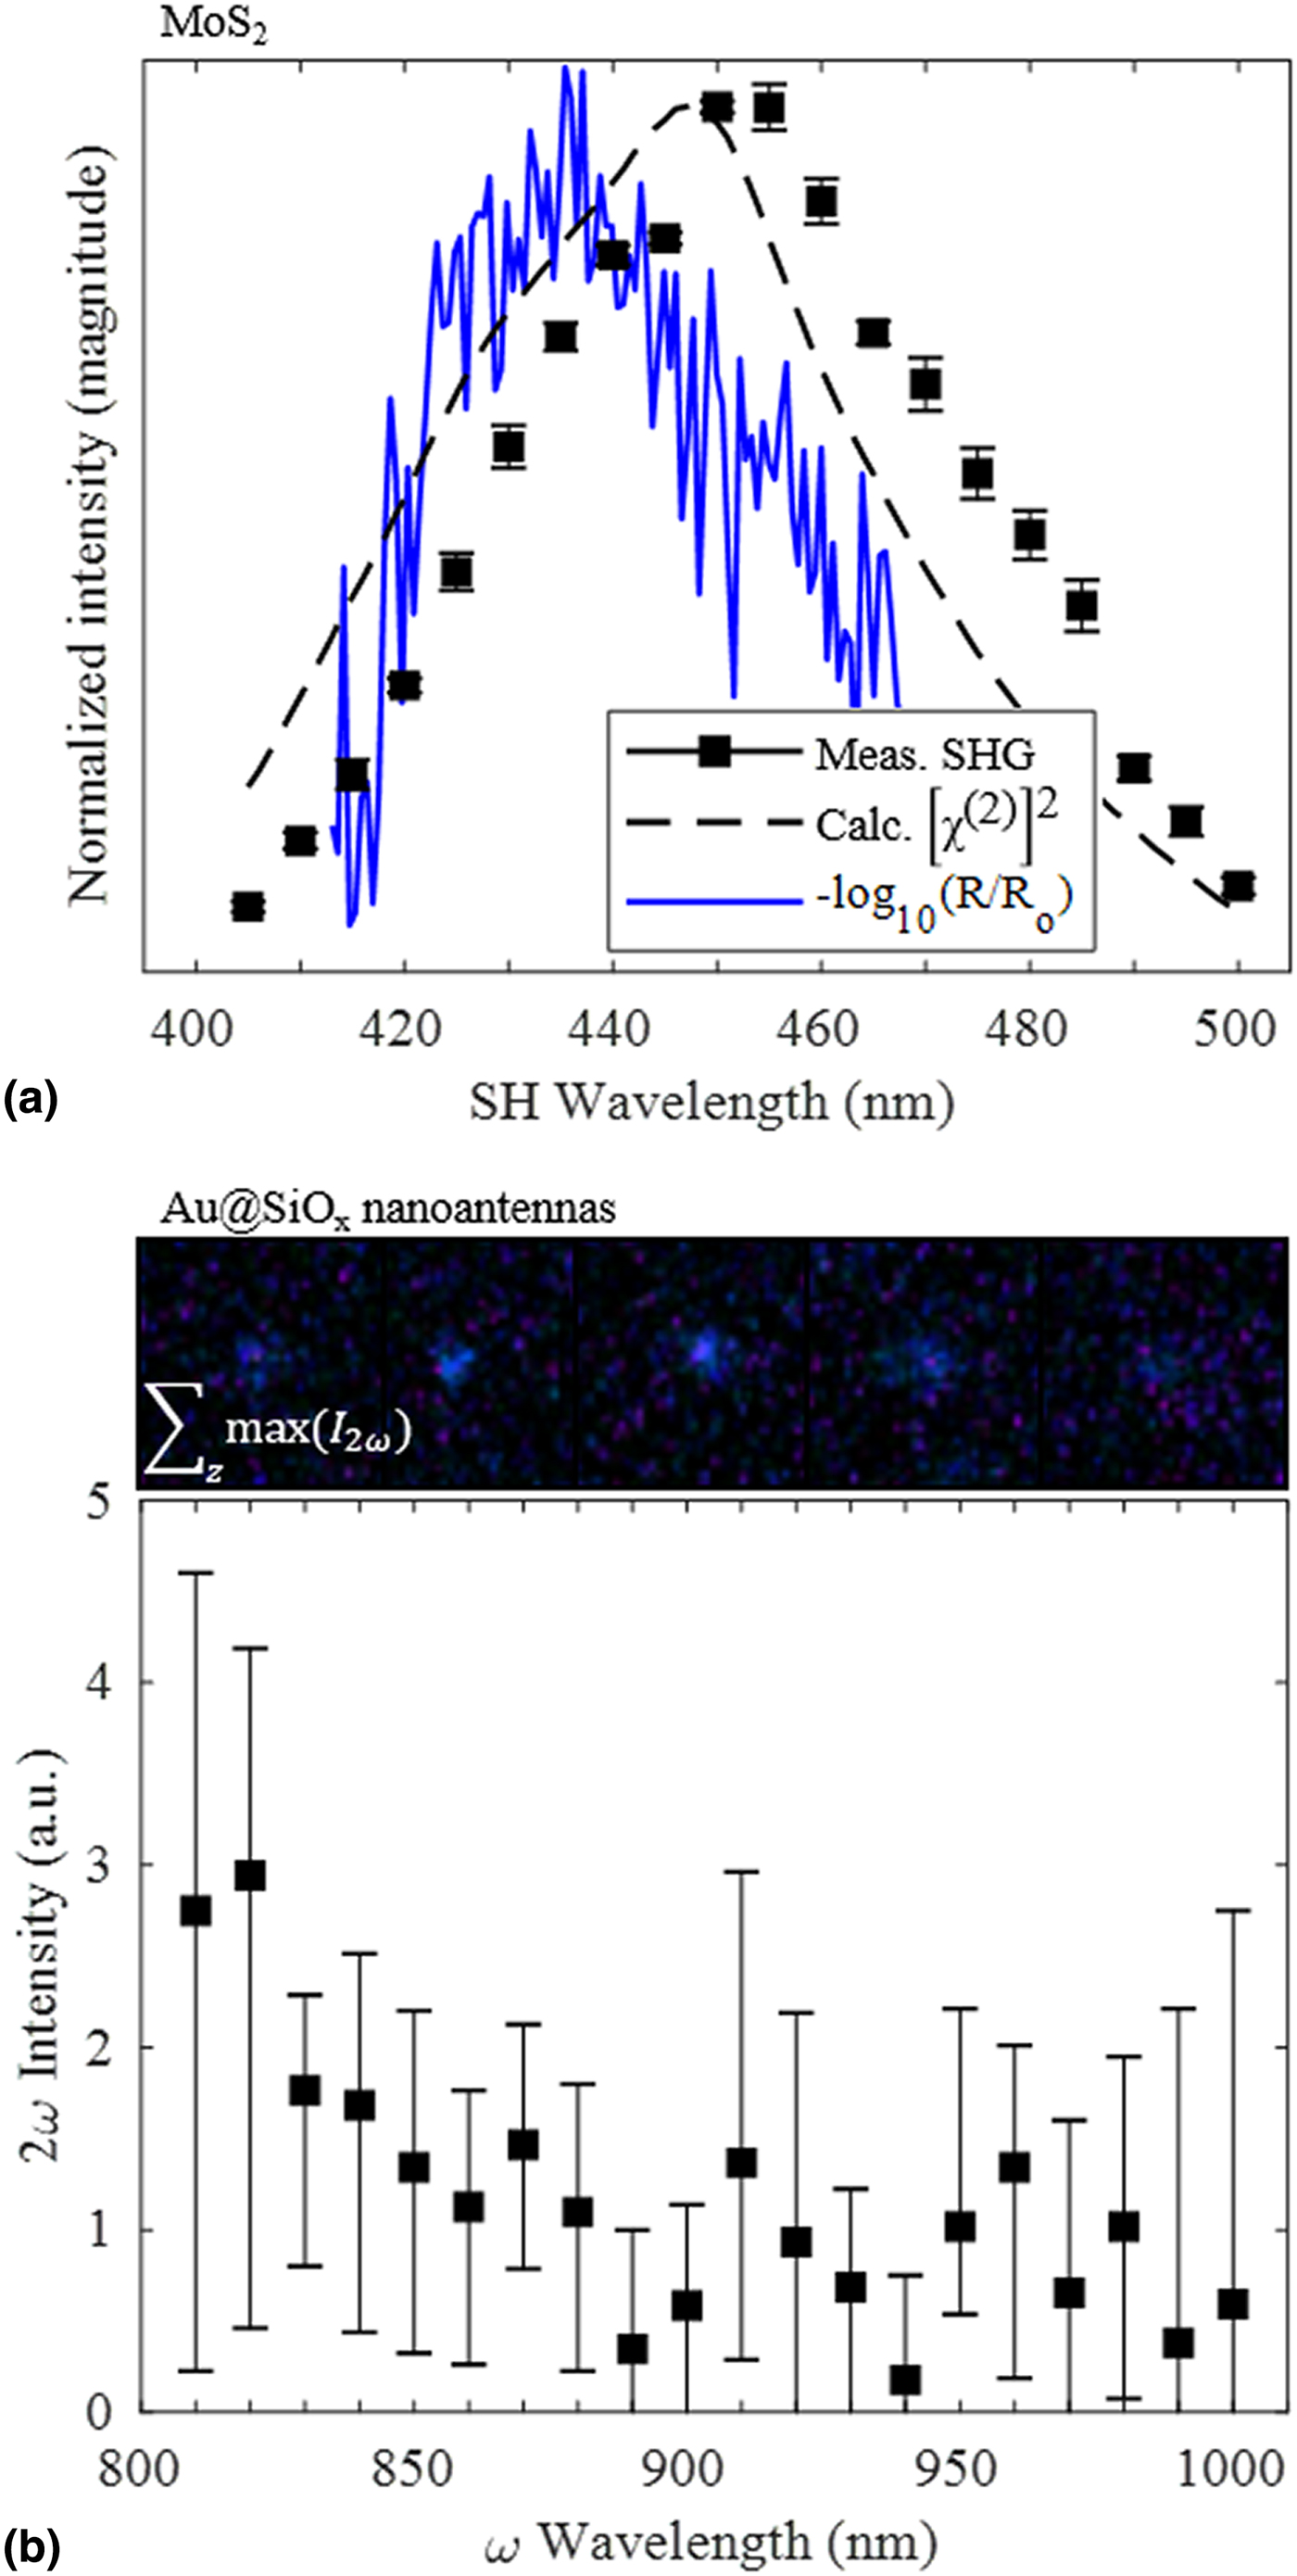
Mean SHG intensity measured from ten distinct MoS2 monolayers exhibited a frequency-dependence corresponding with the expanded density of states along the C exciton transitions.[Reference Klots, Newaz, Wang, Prasai, Krzyzanowska, Caudel, Ghimire, Yan, Ivanov, Velizhanin, Burger, Mandrus, Tolk, Pantelides and Bolotin20] The C transition is associated with the van Hove singularity of MoS2. Malard et al. also measured an association of SHG in this spectral range to the direct C exciton transition near the Γ point at approximately 2.8 eV (450 nm).[Reference Malard, Alencar, Barboza, Mak and de Paula7] Figure 3(a) shows the frequency-dependence of SHG from 810 to 1000 nm ω excitation averaged from ten crystals (black squares). Superimposed are DDA-calculated bulk-like  $\left[ {\chi _{2\omega} ^{(2)}} \right]^2$ spectra [black dashed line; proportional to SHG via Eq. (1)] and measured linear differential reflectance spectra (blue solid line) of the MoS2, revealing the C transition. The C transition concomitantly acts as a loss (via absorption of SH signal) and as a SHG gain (via χ (2) resonance).[Reference Malard, Alencar, Barboza, Mak and de Paula7] SHG intensity did not decrease over time, indicating no photodamage. Power dependence of SHG exhibited typical quadratic behavior.
SHG control experiments. (a) Normalized SHG intensity (integrated over SH bandwidth) versus central SH wavelength averaged from ten distinct MoS2 monolayers (black squares). Superimposed are bulk-like  $\left[ {\chi _{2\omega} ^{(2)}} \right]^2$ magnitude calculated DDA (black dashed line) and measured differential reflectance spectra (blue line) for MoS2 monolayers. (b) Mean 2ω emission intensity (per unit area) for five distinct Au@SiOx nanoantennas (15 nm Au shell; 120 nm SiOx core). The top panel shows 2ω images of the five individual Au@SiOx nanoantennas according to summed, maximum 2ω luminescence from 400 to 480 nm detected within a 5 µm z-scan using 820 nm excitation. Error in each graph reflects the maximum and minimum from the mean.

Measured SHG profile for undecorated MoS2 monolayers aligned closely with DDA-simulated bulk-like  $\chi _{2\omega} ^{(2)} $ (black dashed line), which was based on Miller's rule using linear MoS2 susceptibility, χ (1), as detailed in the Supplementary Material. The measured C exciton transition (blue line) occurred 15 nm blue-shifted from the 450 nm SHG maximum, consistent with measurements by Malard et al.[Reference Malard, Alencar, Barboza, Mak and de Paula7] Density functional theory (DFT) calculations and a Bethe-Salpeter exciton model of χ (2) for MoS2 corroborate the measured SHG trends.[Reference Clark, Senthilkumar, Le, Weerawarne, Shim, Jang, Shim, Cho, Sim, Seong, Rhim, Freeman, Chung and Kim6, Reference Wang and Guo21, Reference Trolle, Seifert and Pedersen22] This is illustrated in Fig. S7. An approximate 7 nm offset between SHG maximum and simulated bulk-like
 $\left[ {\chi _{2\omega} ^{(2)}} \right]^2$ was attributable to the water environment of the immersion-objective used here versus the air environment[Reference Mao, Chen, Liu, Zhang and Xie23] of the MoS2 sample used to obtain linear dielectric data by Mukherjee et al.[Reference Mukherjee, Tseng, Gunlycke, Kumar, Eda and Simsek24] from which
 $\chi _{2\omega} ^{(2)} $ was derived via DDA. Polarization-resolved SHG from the MoS2 to elucidate depolarization or crystal axis orientation was not measured herein but has been well-characterized elsewhere.[Reference Clark, Senthilkumar, Le, Weerawarne, Shim, Jang, Shim, Cho, Sim, Seong, Rhim, Freeman, Chung and Kim6, Reference Malard, Alencar, Barboza, Mak and de Paula7]
Isolated Au@SiOx nanoantennas atop SiOx exhibited broadband 2ω luminescence when excited across the ω wavelength range of 810–1000 nm, whereas SHG was observed from MoS2. This was attributable to interband relaxation of d-orbital electrons in the Au[Reference Palomba, Danckwerts and Novotny25] rather than SHG originating from the nanoantenna. Figure 3(b) shows the mean detected intensity in the 2ω spectrum from five Au@SiOx nanoantennas; intensity magnitude was negligible compared with that of MoS2 SHG in Fig. 2. The centrosymmetric fcc structure of Au and amorphous SiOx prohibited SHG beyond minute surface contributions, where crystalline symmetry is inherently broken. Luminescence decreased as ω was detuned from the 817 nm dipole LSPR, consistent with the LSPR profile in Fig. 1(d) and other reports.[Reference Grinblat, Rahmani, Cortes, Caldarola, Comedi, Maier and Bragas15] Broadband luminescence has been widely noted for high-fluence laser excitation of metal nanoantennas.[Reference Palomba, Danckwerts and Novotny25] Multiphoton identification of single Au@SiOx nanoantennas, corroborated independently with SEM, was facilitated by a secondary method of multiphoton image acquisition where maximal detected 400–480 nm luminescence from 820 nm excitation across a 5 µm z-scan was translated into a 2D projection [see top of Fig. 3(b) and Fig. S5].
SHG from nanoantennas has been shown to increase with the degree of non-centrosymmetry in antenna geometry. For example, Walsh et al. enhanced SHG 40 × from Au nanocylinder arrays by plasmon-phonon transduction at various laser intensities to introduce morphological disorder into the otherwise centrosymmetric cylinders.[Reference Walsh and Dal Negro26] Augmentation of surface SHG by plasmon-enhanced local electric fields is an alternative mechanism that has been studied.[Reference McMahon, Ferrara, Bowie, Lopez and Haglund27] The Au@SiOx nanoantennas studied herein had centrosymmetric core-shell morphology that resulted in negligible SHG with no appreciable surface contribution.
Enhanced SHG from MoS2 by Au@SiOx nanoantenna dimers
SHG intensity from MoS2 monolayers was enhanced in presence of Au@SiOx nanoantenna dimers, ostensibly due to augmentation of the local electric field governed by the inter-nanoantenna gap within the dimer. Figure 4 shows the measured SHG intensity enhancement factors, X, by a Au@SiOx nanoantenna dimer with 280 nm (blue) or 170 nm (black) gap, relative to two comparably sized MoS2 controls. Corresponding SEM micrographs are inset. Overall SHG gain was low. Likewise, Metzger et al. cited difficulty in clearly resolving THG gain from an indium tin oxide nanoparticle placed within a resonating plasmonic Au nanodimer.[Reference Metzger, Hentschel, Schumacher, Lippitz, Ye, Murray, Knabe, Buse and Giessen17] Linear extinction spectra calculated by DDA for each nanoantenna dimer suspended in water (due to water immersion objective) are superimposed onto the measured X values. Trend and relative magnitudes of the measured X values were consistent with their respective nanoantenna dimer extinction spectra. Field strength between nanoantenna dimer elements increases exponentially as gap size narrows due to capacitive coupling.[Reference Kadkhodazadeh, De Lasson, Beleggia, Kneipp, Wagner and Kneipp28] Power-dependence of SHG was measured to be 1.87 and 1.82 for 280 and 170 nm gap dimers, respectively. Error bars reflect maximum and minimum from the mean due to minute variation in the size of MoS2 controls.
Measured SHG enhancement factor, X, for MoS2 monolayers, each ~4 × 10⁵ nm2 in area, by nanoantenna dimers composed of 150 nm Au@SiOx (15 nm Au shell; 120 nm SiOx core) separated by 170 nm (black) and 280 nm (blue). Error reflects the maximum and minimum from the mean enhancement over two nearby, comparably-sized MoS2 controls. One dimer was measured for each gap distance. Superimposed are DDA-calculated linear extinction spectra (dashed lines) for MoS2-free Au@SiOx chains in water with spacing equal to each measured dimer gap, and was scaled to show correlation with their respective X profile. SEM micrographs for each dimeric heterostructure are shown.

Enhancement of SHG from MoS2 at the Au@SiOx LSPR was highest for the 170 nm gap dimer, reaching up to 88% (i.e., X = 1.88) at 810 nm. Expanding the gap to 280 nm decreased X to 74%, which is consistent with reduced coupling as the two Au@SiOx nanoantenna comprising the dimer separate. SHG enhancement by the 280 nm gap dimer decreased as ω was detuned from the LSPR. The decrease coincided DDA-calculations of optical field intensity enhancement factors, i.e., γ 2, at the MoS2 monolayer by the LSPR (see Fig. S13). For the 170 nm gap dimer, however, X increased beyond 860 nm excitation in correspondence with the emergence of a second plasmon resonance near 960 nm arising from the capacitive interaction. The emergence of capacitively-coupled plasmon resonances at energies lower than the single-particle LSPR has also been observed elsewhere.[Reference Kadkhodazadeh, De Lasson, Beleggia, Kneipp, Wagner and Kneipp28] DDA simulation of parallel-polarized excitation of single Au@SiOx nanoantennas arranged in a chain with 170 nm gap confirmed the emergence of such a coupled resonance (see the black dashed line in Fig. 4 and black solid line in Fig. S11). Higher X exhibited by the 170 nm gap dimer in the 800–890 nm range relative to the 280 nm gap dimer appears counter to the absolute, MoS2-absent extinction magnitudes of the nanoantenna dimers shown in Fig. S11. However, their true optical extinction could differ upon the inclusion of the MoS2 (prohibitive computationally, detailed later) and the local field around a nanoantenna differs from the field at its interface with a MoS2 sublayer.
Normalized SHG conversion efficiency analysis
Measured enhancement of MoS2 SHG in the presence of Au@SiOx nanoantennas, X, was consistent with augmentation of the local electric field by LSPR excitation, quantified numerically by a factor γ = |E/Eo|ω. Overall SHG conversion efficiency is proportional to γ 4, as in Eq. (1).[Reference Ishifuji, Mitsuishi and Miyashita12] An ab initio estimate of overall SHG conversion efficiency, η 2ω, for MoS2 in the absence of a nanoantenna was calculated to be up to 7.8 × 10⁻⁸ at the 100 GW/cm2 irradiation intensity used herein, per Eqs. (2) and (3) (derived in §S8 of the Supplementary Material) under the following assumptions:[Reference Kumar, Samanta, Devi and Ebrahim-Zadeh29] (i) interaction length, L = 6.5 Å for monolayer MoS2, was within the focus depth; (ii) no pump depletion by the MoS2; (iii) phase coherence; and (iv) bulk-like  $\chi _{2\omega} ^{(2)} $ for monolayer MoS2 calculated from a Miller's rule calculation with DDA (see Supplementary Material):
 $$\eta _{2\omega} \equiv \displaystyle{{I_{2\omega}} \over {I_\omega}} = \eta _{{\rm norm}}\; L^2I_\omega $$
 $$\eta _{{\rm norm}} \equiv \displaystyle{{2\pi ^2{\left[ {\chi _{2\omega} ^{(2)}} \right]}^2} \over {n_\omega ^2 n_{2\omega} c\epsilon _o\lambda _\omega ^2}} \; $$
Here, the normalized SHG conversion efficiency, η norm, is introduced to allow direct comparison of SHG performance with other materials or heterostructures by removing dependence on extrinsic parameters I ω and L.[Reference Kumar, Samanta, Devi and Ebrahim-Zadeh29] Absolute determination of η 2ω using measured values of I 2ω and I ω was precluded by the absence of rigorously characterized signal losses within the microscope (e.g., ω-dependent losses at each lens/mirror, PMT quantum efficiencies, etc.).
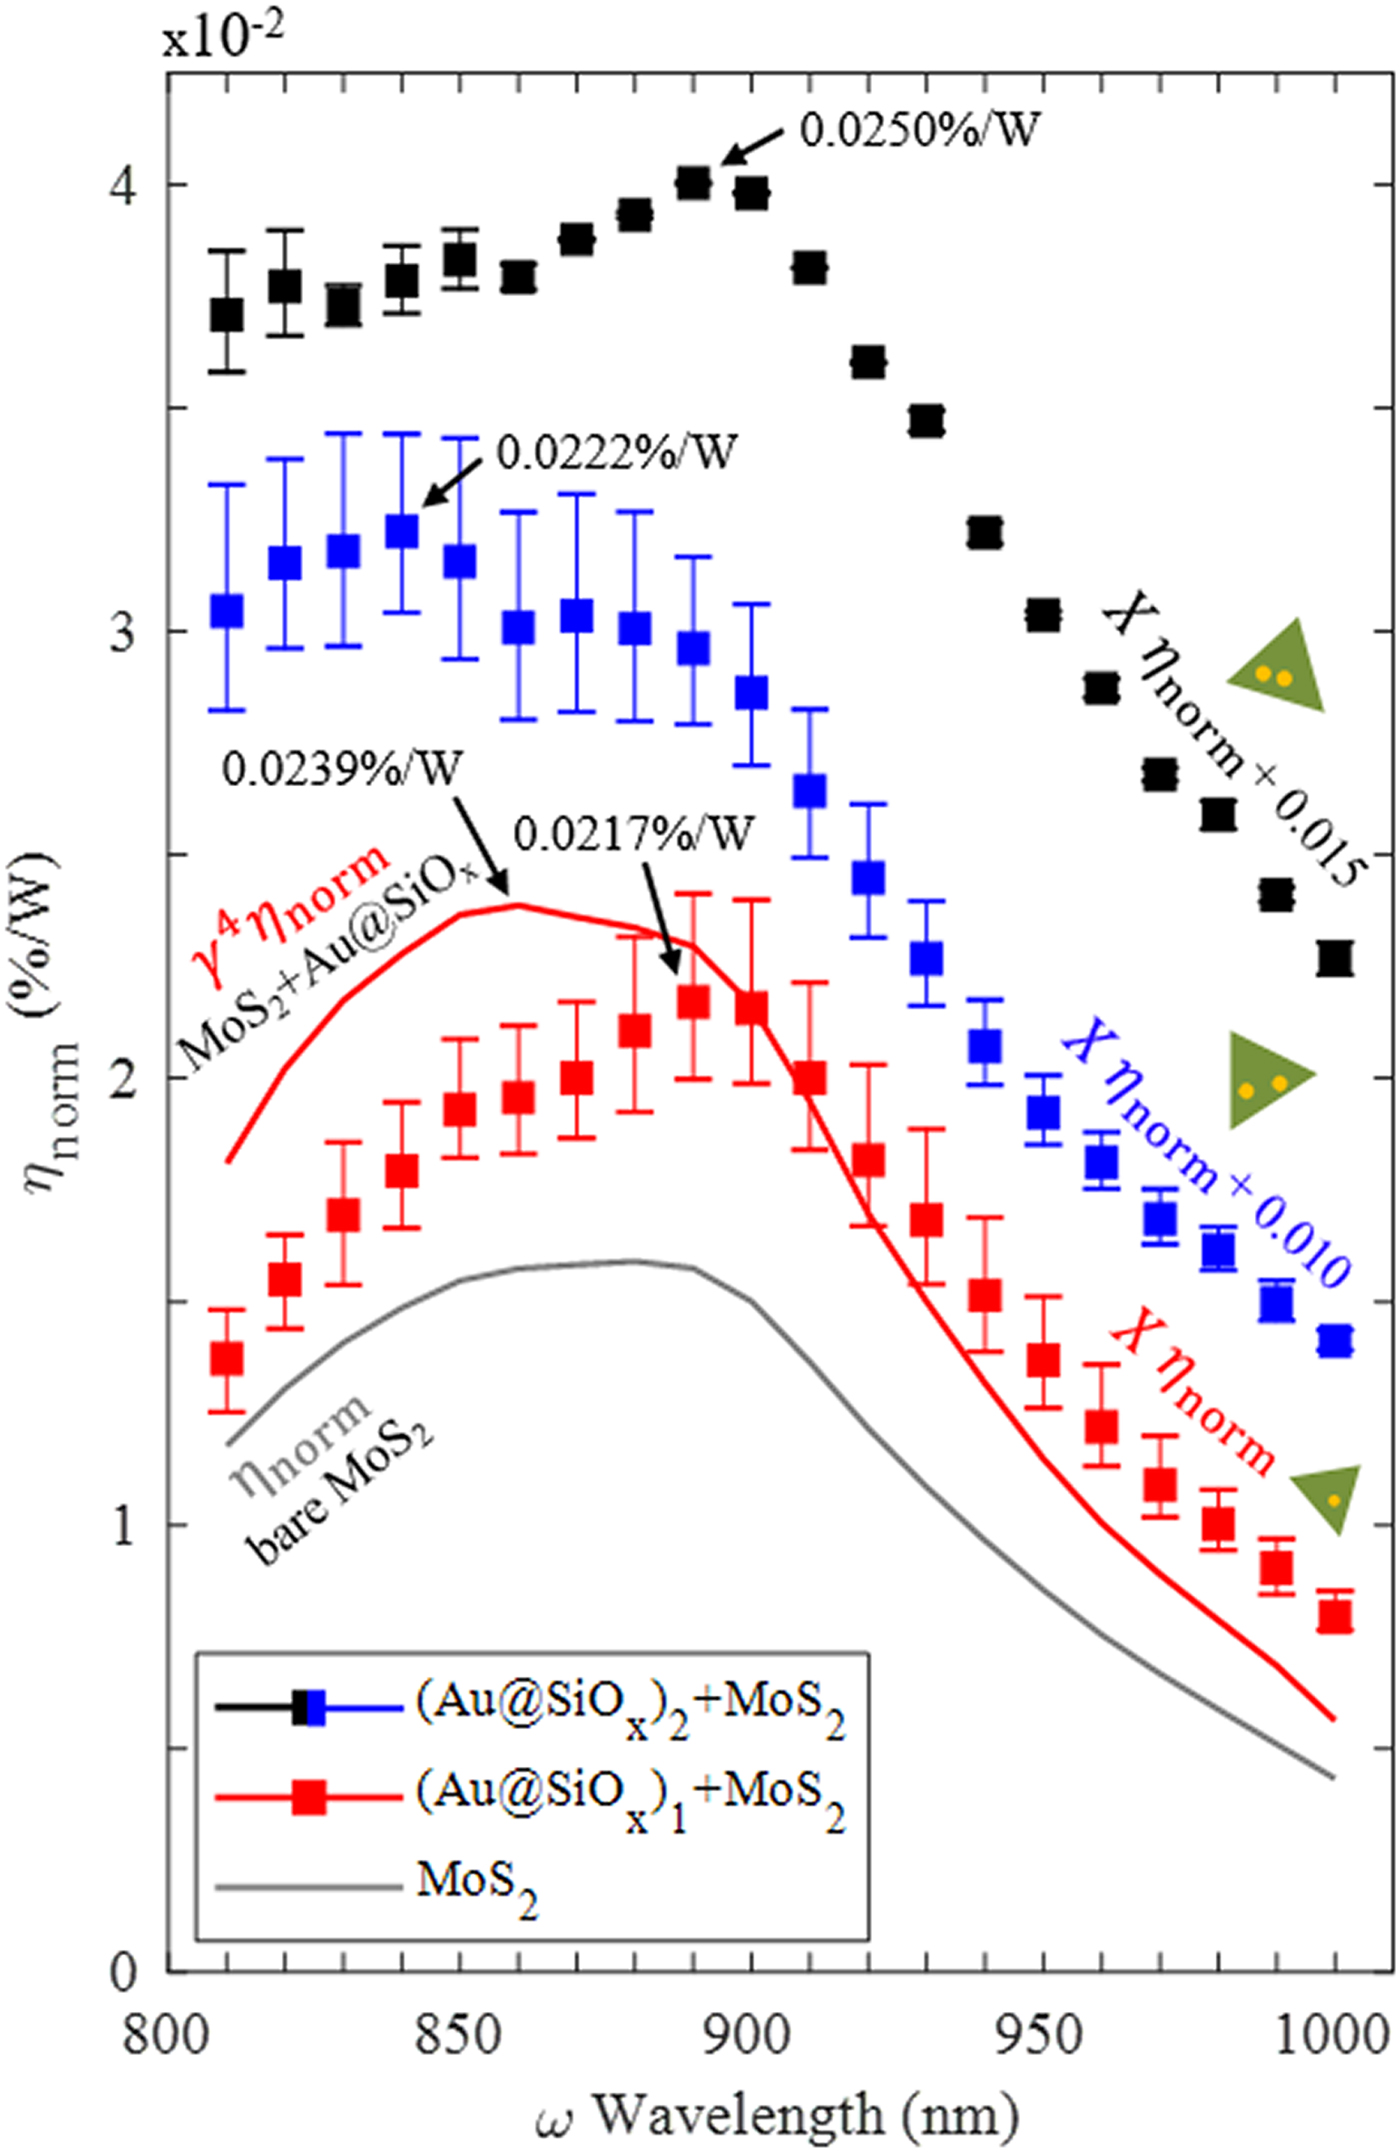
Figure 5 shows η norm for an isolated MoS2 monolayer (gray line) calculated by Eq. (3) using the DDA-calculated bulk-like χ (2) via Miller's rule, which closely matches the measured intensity profile in Fig. 3. Equation (3) accounts for the wavelength and optical dispersion at the ω and 2ω frequencies, respectively, which advances an interpretation of SHG spectrum profiles beyond only χ (2). The undecorated MoS2 had a calculated peak η norm of 0.0159%/W. By comparison, lithium niobate technology performs near 0.0001%/W.
Normalized SHG conversion efficiency, η norm, for a MoS2 monolayer in the absence [gray line; calculated using Eq. (3)] and presence of a (Au@SiOx)i nanoantenna, where subscript i is 1 for the monomer (red square) or 2 for the dimers (blue and black squares). Au@SiOx nanoantennas were a 15 nm Au shell/120 nm SiOx core particle. “γ 4 η norm” (red line) is the calculated enhancement in η norm [see Eq. (2)] using DDA-calculated values of γ for nanoantenna monomer-decorated MoS2 monolayer. “X η norm” shows measured η norm for the Au@SiOx-MoS2 heterostructures (squares), where X was the measured SHG enhancement factors relative to MoS2 controls, under the condition that accrued SHG resulted solely from local field augmentation by the nanoantenna (i.e., X = γ 4). Note that X η norm for the 280 nm (blue squares) and 170 nm (black squares) gap dimers are vertically offset by 0.010 and 0.015 units from their absolute magnitudes, respectively, for clarity. The error is the maximum and minimum from the mean from 4 and 2 sample sizes for the monomer and dimer data, respectively.

Full-field DDA calculations indicated the presence of a single Au@SiOx nanoantenna as a passive SHG gain element could increase peak η norm to 0.0239%/W, labeled as γ 4η norm [red line; see Eq. (1) and (S5)–(S7)]. This calculation assumed the nanoantenna (i) did not contribute SHG (confirmed earlier) and (ii) passively enhanced MoS2 η norm according to its local plasmonic field factor, γ. In the latter, γ 2 incident upon the MoS2 was calculated by DDA at each ω. Although γ 2 “seen” by the MoS2 from interaction with the nanoantenna followed the LSPR spectral profile in Fig. 1(d), its magnitude remained within ±5% across the 810–1000 nm excitation spectrum, as detailed in Fig. S13.
Plasmonic field-augmentation appeared responsible for the measured SHG enhancements from MoS2. This was implied by a heuristic comparison in Fig. 5 between MoS2 η norm multiplied by (i) DDA-calculated field-enhancement factors by the nanoantenna (γ 4η norm; red line) and (ii) measured SHG enhancement factors (Xη norm; red squares). The peak measured Xη norm for the single nanoantenna-MoS2 heterostructure was 0.0217%/W at 890 nm excitation. Good agreement in magnitude and frequency-dependence is observed at off-resonant wavelengths beyond 880 nm, with an evident dip proximal to the 820 nm LSPR frequency, putatively due to plasmonic losses.
Plasmonic dampening of the pump laser at wavelengths proximal to the 820 nm Au@SiOx nanoantenna LSPR appeared to diverge measured SHG-enhanced η norm (i.e., Xη norm) of the monomeric heterostructure from its DDA-calculated γ 4η norm profile. Good agreement was observed at off-resonant excitation wavelengths. It is hypothesized that plasmonic activity of the nanoantenna dampened the pump laser via plasmon-phonon transduction, plasmonic re-radiation in-plane with the MoS2 and/or 11–38% plasmonic hot electron injection losses.[Reference Yu, Ji, Zu, Du, Kang, Li, Zhou, Shi and Fang4, Reference Forcherio, Dunklin, Backes, Vaynzof, Benamara and Roper5] For example, frequency-dependent plasmonic re-radiation from a nanoantenna could scatter resonant pump photons away from the MoS2, thus preventing the production of a SH photon from their annihilation. Plasmonic losses in nanoantenna-TMD heterostructures change the degree to which the pump laser can couple to the TMD, which was not taken into account in Eqs. (1)–(3). Incomplete characterization of these interactions to date precluded quantitation of such pump-TMD coupling effects in presence of plasmonic nanoantennas, but hold interest as future work. At wavelengths beyond 900 nm where plasmonic losses were less appreciable, Xη norm converged near the calculated γ 4η norm profile with good agreement in magnitude.
Measured SHG enhancement factors for the dimeric nanoantenna-MoS2 heterostructures gave Xη norm profiles in Fig. 5 (scaled vertically by 0.010 and 0.015 units for clarity) that were akin to the monomeric heterostructure sans pump losses, despite their distinct capacitively-coupled plasmonic activity. Interestingly, these dimer Xη norm data closely resemble their raw SHG measurements in a laboratory setting. The 280 nm-gap (170 nm-gap) dimer enhanced peak Xη norm from 0.0217%/W for the monomer to 0.0222%/W at 840 nm (0.0250%/W at 890 nm). The largest value of overall η 2ω for any measured Au@SiOx nanoantenna-MoS2 heterostructure using Eq. (2) was 1.24 × 10⁻⁷ at the I ω = 100 GW/cm2 employed to collect these data.
Quantitation of γ-factors for the dimers to distinguish contributions from multiple single nanoantennas versus inter-nanoantenna coupled interactions (see Fig. S12) was computationally prohibitive to compare with measured X values. DDA computation time scales with the cube of total target dipoles, (N dipole).[Reference Bhanu, Islam, Tetard and Khondaker3] The 15 nm thick Au shell necessitated a 3 nm inter-dipole spacing for solution convergence of optical extinction spectra calculations, giving N dipole of 65,257 dipoles for one Au@SiOx nanoantenna in DDA (excluding any substrate). By comparison, a uniform Au sphere with equal volume to the shell@core nanoantennas would have allowed 98 × reduced computation time with 14,147 dipoles at a 5 nm spacing. Accurate calculation of near-field enhancement magnitudes necessitates ~1 nm spacings, giving 1,767,063 dipoles that further exacerbate computational expense. A boundary element approach may circumvent these obstacles in future work.
Discussion
Plasmonic enhancement of SHG and THG from several nonlinearly-active materials via Au- and Ag-loading/deposition schemes have been studied: ionic polymer bilayer films,[Reference Chen, Durak, Heflin and Robinson11] organic dyes,[Reference Ishifuji, Mitsuishi and Miyashita12] silicon carbide nanoparticles,[Reference Zakharko, Nychyporuk, Bonacina, Lemiti and Lysenko14] barium titanate nanoparticles,[Reference Pu, Grange, Hsieh and Psaltis13] zinc oxide nanowires,[Reference Grinblat, Rahmani, Cortes, Caldarola, Comedi, Maier and Bragas15] rubidium titanyl phosphate,[Reference Sánchez-García, Tserkezis, Ramírez, Molina, Carvajal, Aguiló, Díaz, Aizpurua and Bausá16] and indium tin oxide.[Reference Metzger, Hentschel, Schumacher, Lippitz, Ye, Murray, Knabe, Buse and Giessen17] Relative to these materials, 2D TMD offer rich capabilities as a nonlinear medium for nano-optoelectronics[Reference Fryett, Zhan and Majumdar10] due to its 2–3 orders-of-magnitude higher χ (2) of 102–103 pm/V,[Reference Clark, Senthilkumar, Le, Weerawarne, Shim, Jang, Shim, Cho, Sim, Seong, Rhim, Freeman, Chung and Kim6, Reference Malard, Alencar, Barboza, Mak and de Paula7, Reference Wang and Guo21, Reference Trolle, Seifert and Pedersen22] mechanical flexibility, direct bandgap near 2 eV, and susceptibility to field gating.[Reference Seyler, Schaibley, Gong, Rivera, Jones, Wu, Yan, Mandrus, Yao and Xu30] For the interested reader, Ref. Reference Fryett, Zhan and Majumdar10 reviews work to date on enhanced nonlinear responses from 2D TMD after integration with dielectric cavity crystals (spanning SHG, saturable absorption, third-order processes, and exciton–polariton interactions), which is an alternative approach to plasmonic resonances for nonlinear response gain.
This work showed SHG from 2D TMD materials can be augmented by localized plasmon fields supported by metal nanoantennas. The degree of SHG augmentation by single-mode plasmonic nanoantennas, however, remains lower than theoretical potential. Such a difference was acknowledged by Fryett et al. for WSe2 interfaced with a Si cavity crystal,[Reference Fryett, Seyler, Zheng, Liu, Xu and Majumdar18] although recent work by Wang et al. demonstrating >47 × local SHG augmentation has begun to bridge the experiment-theory gap.[Reference Wang, Dong, Zhu, Jin, Chiu, Li, Xu, Eda, Maier, Wee, Qiu and Yang19] Similarly, Pu et al. and Zakharko et al. measured 500 × and 72 × plasmon-enhanced SHG from barium titanate and silicon carbide, despite their electrodynamic field simulations suggesting 3500 × and 220 × enhancements were possible, respectively.[Reference Pu, Grange, Hsieh and Psaltis13, Reference Zakharko, Nychyporuk, Bonacina, Lemiti and Lysenko14] Intrinsic material losses not accounted in continuum electrodynamic models that likely contribute to the shortfall herein may include:
(1) Weak local field enhancement by single nanoantenna seen by the MoS2 sublayer (see Figure S13) relative to isotropic nanoantenna doping of 3D nonlinear media and/or micron-scale coverage by regular lattices of nanoantenna[Reference Chen, Durak, Heflin and Robinson11–Reference Metzger, Hentschel, Schumacher, Lippitz, Ye, Murray, Knabe, Buse and Giessen17]
(2) Reabsorption of SH signal (2.48–3.06 eV) above the MoS2 bandgap (1.86 eV) featuring high density of states,[Reference Fryett, Seyler, Zheng, Liu, Xu and Majumdar18] where classical models cannot simultaneously account for both linear and nonlinear processes
(3) Intrinsic dampening of the pump laser at wavelengths proximal to the nanoantenna LSPR prior to TMD excitation, e.g., via ohmic-relaxation of Landau-damped plasmons, plasmon re-radiation, or trapping of hot electrons/holes into intermediary interface states
(4) Carbon buildup on the MoS2 and Au surfaces from correlative SEM characterization prior to evaluating SHG performance in the multiphoton microscope
(5) Confounding metrological influences
Energetic conversion of the pump into plasmonic hot electrons injected into the TMD is a quantum mechanical phenomena. Atomistic-level optoelectronic properties and transport at metal-2D semiconductor interfaces remain difficult to account for at the continuum levels interrogated by available measurement techniques. Advancing classical electrodynamic models to accommodate quantum-level metal–TMD interactions could allow improved, multi-scale design and description of such heterostructured hybrid nanomaterials in future work.
Conclusion
Frequency dependence and plasmon-driven intensity enhancements of up to 88% to SHG from ~4 × 10⁵ nm2 CVD-synthesized MoS2 monolayers in the presence of monomeric and dimeric 150 nm Au@SiOx shell@core nanoantennas were comparable with estimates from ab initio theory and DDA simulation. SHG from (i) MoS2 in the presence of a Au@SiOx monomer and dimer (170 and 280 nm gaps), (ii) ten MoS2 controls, and (iii) five Au@SiOx nanoantenna controls were measured using a 810–1000 nm tunable Ti:Sapphire laser coupled into a multiphoton microscope with hyperspectral imaging. Improved normalized SHG conversion efficiency, η norm, of the nanoantenna-TMD heterostructures was quantitatively consistent with local field augmentation by the 820 nm dipole LSPR of the nanoantenna monomer by comparing (i) measured SHG enhancement with (ii) DDA-calculated enhanced local field strength at the MoS2 by the nanoantenna. SHG activity of MoS2 controls in the 810–1000 nm ω range, coinciding with a resonant 2ω interaction with the C exciton transition, followed their DDA-calculated χ (2) profile and agreed with previous reports. The inversion-symmetric Au@SiOx nanoantennas did not exhibit SHG in favor of broadband 2ω luminescence from d-orbital electrons. A capacitively-coupled plasmon resonance near 960 nm emerged for the 170 nm-gap nanoantenna dimer, which augmented MoS2 SHG to a peak η norm of 0.0250%/W.
Supplementary material
The supplementary material for this article can be found at https://doi.org/10.1557/mrc.2018.133.
Acknowledgments
This work was supported in part by NSF EEC-1260301, NSF Graduate Research Fellowship awarded to G.T.F, The University of Arkansas Foundation, Walton Charitable Foundation, NCCR MUST instrument of the Swiss National Research Council, and USARL Cooperative Agreement Number W911NF-17-2-0057 award to G.T.F. DDA simulations were performed on the supercomputers of the Arkansas High-Performance Computing Center, supported by NSF 918970 and 959124. The views and conclusions contained in this document are those of the authors and should not be interpreted as representing the official policies, either expressed or implied, of the National Science Foundation, Army Research Laboratory or the US Government. The US Government is authorized to reproduce and distribute reprints for Government purposes notwithstanding any copyright notation herein.
G.T.F. directed the work, performed experiments and data analysis, and drafted text and figures for the manuscript. L.B. and J.-P.W. developed the experimental setup. D.K.R. initiated consideration of nanoantenna-enhanced nonlinear activity in TMD. L.B. and D.K.R. refined compilation of text and figures. The authors acknowledge 2D Semiconductors for supplying CVD MoS2 samples. The authors thank Drs. Gregory J. Salamo, Surendra P. Singh, Hameed A. Naseem, and Jeremy R. Dunklin for engaging discussions of the data, Dr. Vasyl Kilin for supporting the experiments, and Manoj Seeram for DDA assistance.