

Employment is considered to be fundamentally necessary for the well-being of all people, including those who live with a disability (Dutta et al., Reference Dutta, Gervey, Chan, Chou and Ditchman2012) . However, unemployment rates among people with disabilities (PWDs) remain at levels that are much higher than those of the general population (Burke et al., Reference Burke, Bezyak, Fraser, Pete, Ditchman and Chan2013; Turcotte, Reference Turcotte2014). These high rates of unemployment are linked to three social and psycho-emotional factors – the legislative environment, the values found within various organizations, and the personal characteristics of disabled employees and co-workers (Stone & Colella, Reference Stone and Colella1996). Although legislation in support of PWDs has been introduced in many countries, including the United States, Canada, and Great Britain, none has resulted in improvements to these rates of unemployment (Barnes & Mercer, Reference Barnes and Mercer2003; Clayton et al., Reference Clayton, Barr, Nylen, Burström, Thielen, Diderichson and Whitehead2011; Kidd, Sloane, & Ferko, Reference Kidd, Sloane and Ferko2000).
Examinations of the internal values within organizations continue to indicate overarching concerns associated with the hiring of PWDs (Campbell, Reference Campbell and Tremain2005). A survey of 3,797 American employers found that 72.6% of respondents believed that the work required by their organizations could not be effectively carried out by PWDs (Domzal, Houtenville, & Sharma, Reference Domzal, Houtenville and Sharma2008). Similar corporate values have been found in many other countries, including Australia (Darcy, Taylor, & Green, Reference Darcy, Taylor and Green2016), France (Louvet, Reference Louvet2007), and Armenia (Breen, Havaei, & Pitassi, Reference Breen, Havaei and Pitassi2018). Within the third of these factors, the attitudes of others within the workplace are considered by many researchers to be the most significant influence on the employment success of PWDs (Antonak, Reference Antonak1982; Burke et al., Reference Burke, Bezyak, Fraser, Pete, Ditchman and Chan2013; Vornholt, Uitdewilligen, & Nijhuis, Reference Vornholt, Uitdewilligen and Nijhuis2013).
Attitudes, measures, and validity
Attitudes are frequently described as a mental process used to evaluate a stimulus (Eagly & Chaiken, Reference Eagly and Chaiken1993; Gawronski & Baudenhausen, Reference Gawronski and Baudenhausen2006). However, there is an ongoing debate among theorists whether these mental processes are principally representative of cognitive processes (Eagly & Chaiken, Reference Eagly and Chaiken1993; Fishbein & Ajzen, Reference Fishbein and Ajzen1975) or affective processes (Damasio, Reference Damasio2010; Zajonc, Reference Zajonc and Forgas2000). Fiske (Reference Fiske and Zajonc2004) states that, based on a review of academic abstracts, these two perspectives have been relatively evenly represented since 1984. This basis for attitude formation is critical when considering the evidence for theoretical validity of the Co-Worker Acceptance of Disabled Employees (CADE) Scale.
Current validity theory indicates that the inferences generated from test scores, which include measures of workplace attitudes toward PWDs, must be supported by both theoretical and empirical evidences (American Educational Research Association, American Psychological Association, National Council on Measurement in Education, & Joint Committee on Standards for Educational and Psychological Testing. (U.S.). [AERA et al.], 2014). In addition, as noted by many researchers, a clear articulation of the “personal politics” (Brennan, Reference Brennan2001, p. 12), in this case the ontological framework applied to the scale development process, adds to this evidence and provides transparency (e.g., Hubley & Zumbo, Reference Hubley and Zumbo2011; Messick, Reference Messick and Linn1989, Reference Messick1995).
As indicated in a recent systematic review of instruments that have been employed to measure workplace attitudes toward PWDs (Breen, Reference Breen2018a), each provided a reasonable degree of empirical validity and reliability evidences. However, none articulated evidence of theoretical validity or indicated that its development was based on a specific structure or model of disability. Those measures which could be analyzed on an item-by-item basis revealed some degree of reliance on each of three prominent models of disability (medical, social, and embodiment models).
Measures that are available to quantify workplace attitudes toward PWDs are lacking in “formal evaluation or detailed psychometric analyses” (Antonak, Reference Antonak and Yuker1988, p. 110). This observation has been more recently supported in a systematic review of current measures (Breen, Reference Breen2018a). In addition, a systematic review of 31 instruments measuring more general attitudes toward disability (Palad et al., Reference Palad, Barquia, Domingo, Flores, Padilla and Ramel2016) indicated that a significant number of these measures were found to have “poor overall utility” (p. 370). In addition, at least 26 provided no evidence of their responsiveness to attitude change.
As pointed out by DeVellis (Reference DeVellis2017), various items within a single measure may relate positively or negatively to a particular construct. Without an articulation of the particular construct – in this case the specific model of disability – upon which a scale has been developed, it is difficult to know how to determine the intended valence of each item. As stated by Vehmas and Watson (Reference Vehmas and Watson2016), “without clearly articulated normative judgments,” (p. 5) we do not have the guidelines necessary to interpret respondent scores. A clear articulation of these normative judgments, referred to variously as value implications (Hubley & Zumbo, Reference Hubley and Zumbo2011; Messick, Reference Messick1998), personal politics (Brennan, Reference Brennan2001), and ontological bias (Breen, Reference Breen2018a), is understood as critical to any validity analysis of test measures (Breen, Reference Breen2018b). Critically, these “value implications both derive from and contribute to score meaning, (therefore) different value perspectives may lead to different score implications” (Messick, Reference Messick1998, p. 37).
In a consideration of the medical, social, and embodiment models of disability, each was identified as being cognitively based and located along a dimension of responsibility (Breen, Reference Breen2018a). The medical model assigned responsibility to the individual PWD (Bickenbach et al., Reference Bickenbach, Jerome, Chatterji, Badley and Ustun1999; Parsons, Reference Parsons1951); the social model to society (Oliver, Reference Oliver1990; Oliver & Barnes, Reference Oliver and Barnes2012); and the embodiment model to a combination of the two (Garland-Thomson, Reference Garland-Thomson and Davis2006; Hughes & Paterson, Reference Hughes and Paterson1997).
The application of any of these cognitively based models to the remediation of the ongoing employment challenges of PWDs has failed to improve employment rates for PWDs. These rates have remained relatively constant since the late 1980s (Rioux & Patton, Reference Rioux, Patton and Agócs2014). To illustrate, although the social model (Oliver, Reference Oliver1990) has had an undeniably positive effect on both the self-image of PWDs and many of the relationships between PWDs and others (Shakespeare, Reference Shakespeare2014), Oliver (Reference Oliver2013) notes that the social model “has barely made a dent in the employment system” (p. 1025).
Aims of the Study
The purpose of this article is to add to the knowledge available to improve employment opportunities for PWDs. The CADE Scale is intended to provide a well-validated means to gauge workplace attitudes toward PWDs and, of critical importance, to monitor changes in these attitudes resulting from various interventions.
This article examines the development process of the CADE Scale, with an emphasis on both theoretical and empirical evidences generated in its support. The scale is positioned within the newly described difference model of disability, positing an affect-based ontological relationship between others within the workplace and PWDs. Empirical evidence includes validity and reliability evidences generated first by a content validity study and second by an initial validation (pilot) study. Forty items that address the four general aspects of employment that are most commonly grieved by PWDs – hiring, performance, accommodations, and supervision/termination – are reviewed for relevance and clarity by 21 subject matter experts (SMEs), resulting in an initial 20-item scale. This scale is then presented to a convenience sample of respondents (n = 288). These response data are then considered through an exploratory factor analysis and an examination of reliability statistics. These analyses suggest further adjustments, resulting in a 14-item scale.
Method
Theoretical validity evidence
To address the twin challenges of the limited effect exerted by cognitively based models of disability on the employment success of PWDs and the need to delineate a specific model against which scale items may be evaluated, the author based the development of the CADE Scale upon a new model of disability, named the difference model. The difference model is differentiated from cognitively based models of disability in two significant manners.
First, the difference model postulates that others’ responses to disability are first generated as affective reactions, which require only the most basic mental processes and which do not require a cognitive analysis (Gawronski & Baudenhausen, Reference Gawronski and Baudenhausen2006). Cognition is considered to be a secondary process employed to make meaning out of these initial affective responses and to provide a coherence to the worldview of the individual (Damasio, Reference Damasio1999, 2000; Guidano, Reference Guidano1995; Zajonc, Reference Zajonc1980, Reference Zajonc and Forgas2000).
Second, as a noncognitive model, the difference model of disability does not require purpose, the need to generate fault, or purposeful meaning-making (Dhamoon, Reference Dhamoon2009) as an explanation for the relationship between disability and society. Instead, this relationship only comes into existence when PWDs are perceived to be sufficiently different to rise above “the horizon of social notice (italics in original)” (Breen, Reference Breen2017, p. 2723). Within this context, a difference is named as a disability only when that difference is perceived as a negative attribute (Vehmas & Watson, Reference Vehmas and Watson2014). This perception may change over time and location and is understood as a fluid social construct (Shildrick, Reference Shildrick2012).
Empirical validity evidence
Evidence of empirical validity was generated through a content validity study and through an initial validation study. The content validity study was implemented as a judgmental study (AERA, 2014) which engaged 21 SMEs from Canada (11), the United States (5), Great Britain (4), and Australia (1). The initial validation study examined the internal structure of the scale (AERA, 2014) and was based on data obtained through a convenience sample of 288 respondents.
Judgmental study
Evidence based on content serves as a foundation upon which test scores, including measures such as the CADE Scale, may be interpreted (Messick, Reference Messick1980). Content validity is an evaluation of the degree to which the several items within a measure are relevant to and representative of the construct under consideration (Haynes, Richard, & Kubany, Reference Haynes, Richard and Kubany1995).
SMEs were recruited for participation in this study through personal communication by the author. Each of the SMEs was either known to the author through professional contact or was well-known in practice, as a disability awareness trainer, or in academia. Of the 35 experts contacted, 21 agreed to participate; four were female and 17 were male; eight SMEs had PhDs, two had LLBs, six had Master’s degrees, and three had undergraduate degrees. The education level of the remaining three SMEs is not known. Eight indicated that they considered themselves to be PWDs.
Each of the SMEs rated an initial list of 40 items for both relevance and clarity. These ratings were then evaluated through a Content Validity Index (Lynn, Reference Lynn1986), and, where indicated, items were either removed or edited.
Employing SMEs within this form of judgmental study is a commonly recommended method to gather evidence of content validity (e.g., Beck & Gable, Reference Beck and Gable2001; Lynn, Reference Lynn1986). Recommended numbers of SMEs vary from a minimum of three (Lynn, Reference Lynn1986) to between five and ten (Beck & Gable, Reference Beck and Gable2001) to a maximum of 20 (Grant & Davis, Reference Grant and Davis1997). However, Lynn (Reference Lynn1986) notes that no maximum number of SMEs has been established.
With complex constructs, such as workplace attitudes toward PWDs, it is recommended to recruit SMEs from several disciplines with varying aspects of expertise (Davis, Reference Davis1992). In addition, a representation from a broad geographic area is useful in anticipation of regional differences in language (Grant & Davis, Reference Grant and Davis1997), as is the case when considering the language of disability.
The recommended number of initial items to be reviewed by the SMEs varies from fifty percent more than expected in the final scale (DeVellis, Reference DeVellis2012) to twice as many (Miller, McIntire & Lovler, Reference Miller, McIntire and Lovler2011). Based on the author’s review of current scales (Breen, Reference Breen2018a) and his own professional experience (Beck & Gable, Reference Beck and Gable2001; DeVellis, Reference DeVellis2017), a maximum number of 20 items was determined to be appropriate for the CADE Scale. Therefore, 40 items were generated for evaluation by the SMEs.
Each of the above considerations – categories of expertise, number of SMEs, and geographic distribution – was addressed within the SME selection process. Three categories of expertise were selected to provide a broad understanding of workplace attitudes toward PWDs. These included extensive delivery of disability-related training in the workplace, an understanding of the structural and functional aspects of the workplace through either an academic or practice perspective, or participation as a PWD in a variety of personal and professional workplace relationships.
To generate the initial list of items for consideration by the SMEs, the author first reviewed data from various government commissions that accepted filings of human rights grievances (referred to as complaints in Australia and Canada and charges in the USA). These included the Equal Employment Opportunities Commission (USA), the Canadian Human Rights Commission, and the British Columbia Human Rights Tribunal (Canada). Overall, workplace-based filings by PWDs were most commonly associated with discharge, followed in order by reasonable accommodations (referred to as workplace adjustments in the UK), performance and supervision, and hiring. The author also conducted a systematic review of the literature (Breen, Reference Breen2018a). This initial list of 40 items was comprised of four subsets of 10 items – each of which addressed one of the four abovementioned categories of complaint.
Finally, these 40 items were screened by the author through the difference model of disability. The purpose was to ensure that all of the scale items provided respondents with a workplace circumstance that would suggest a possible perceived difference between PWDs and others. The structural coherence provided by each item having a foundation within the difference model of disability responded to the requirement to clearly delineate the normative judgments (Hubley & Zumbo, Reference Hubley and Zumbo2011) or value implications (Messick, Reference Messick1998) underlying the development of the scale.
The 21 SMEs reviewed these 40 items and categorized each on a four-point scale for relevance and clarity (Lynn, Reference Lynn1986). Items were rated for relevance as – not relevant, somewhat relevant, quite relevant, or very relevant. Similar categories were used for ratings of clarity.
The Content Validity Index indicates the proportion of SMEs required to endorse individual items (I-CVI ratings) and the scale as a whole (S-CVI rating) in order for each to be considered content valid (Hubley & Palepu, Reference Hubley and Palepu2007; Lynn, Reference Lynn1986; Polit, Beck, & Owen, Reference Polit, Beck and Owen2007). As the number of SMEs increases, this proportion may be less than 1.0; with 10 SMEs, this proportion is calculated at 0.78. No further reductions in proportion are recommended for larger groups of SMEs (Lynn, Reference Lynn1986). By making use of the average agreement method to consider the scale as a whole, a similar proportion of agreement of 0.80 was applied (Polit et al., Reference Polit, Beck and Owen2007).
Initial validation study
The 20-item CADE Scale was administered within an initial validation study to a convenience sample of 288 respondents. This sample was generated through two principal efforts. First, a newspaper article describing the development and purpose of the CADE Scale was published on September 29, 2017, in a daily newspaper in Whitehorse, Yukon, Canada. This article included the internet address of a secure website, hosted by the University of British Columbia, which could be accessed to respond to the survey. The online survey provided additional information about the CADE Scale, indicated that participation was both anonymous and confidential and that the completion and submission of the questionnaire would indicate consent on the part of the respondent.
Second, the CADE Scale was similarly described by the author to participants attending a conference focused on issues of disability and employment in Albany, New York, on October 12, 2017. Participants were invited to access the secure website and complete the survey. Both of these groups were encouraged to pass on the information and website address to others. All responses were gathered between September 29 and October 31, 2017.
Participant responses were provided within a seven-point Likert-type response format, anchored by Strongly Agree (scored as 1) and Strongly Disagree (scored as 7). All response data were analyzed through SPSS (v. 24).
Results
Judgmental study
The CVI analysis of the SME responses led to the removal of 20 items, resulting in a 20-item scale.
As recommended by Schilling et al. (Reference Schilling, Dixon, Knafl, Grey, Ives and Lynn2007), written instructions to the SMEs included a statement that confirmed that all responses to the several items were to be based upon the relevance of each item to the construct under consideration not on whether the SMEs agreed with the specific item statement. However, the response scores provided by three of the SMEs, in conjunction with several narrative comments provided by each, indicated that these SMEs were responding to their normative political beliefs. Scores for each of these three SMEs (M = 13.67, SD = 1.53) were much below those provided by other SMEs (M = 34.8, SD = 4.2). These three sets of SME scores were treated as outliers and removed from further calculations (Waltz, Strickland, & Lenz, Reference Waltz, Strickland and Lenz2010).
Originally, it was intended to calculate the response data from SMEs as one group, combining the scores of trainers, workplace experts, and PWDs with workplace experience, from the several geographic locations (Davis, Reference Davis1992; Grant & Davis, Reference Grant and Davis1997). However, with a total of eight SMEs identified as living with a disability, an unanticipated opportunity was identified to generate a comparative analysis between PWDs and non-PWDs. As shown in Table 1, the PWD group generated lower I-CVI scores for relevance than the non-PWD group in nine items, higher in three items, and the same scores in eight items. Overall, the PWD group scored an S-CVI score of 89 as compared with a score of 95 by the non-PWD group. Overall I-CVI scores and the S-CVI scores exceeded the minimum recommended requirements (e.g., Hubley & Palepu, Reference Hubley and Palepu2007; Lynn, Reference Lynn1986; Polit, Beck, & Owen, Reference Polit, Beck and Owen2007).
SME relevance scores

Removal of three outliers resulted in a total of 18 SMEs.
Initial validation study
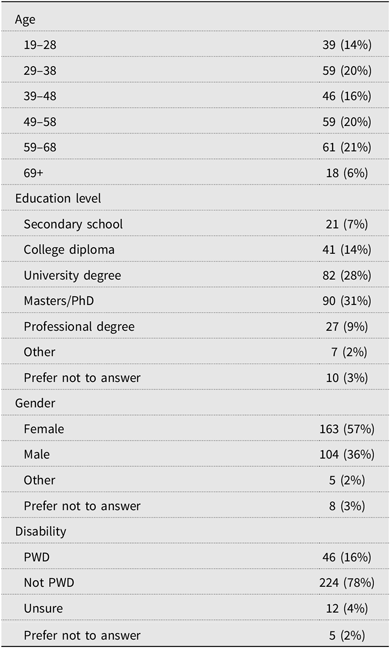
With a 20-item scale, a minimum of 200 responses is necessary for an exploratory factor analysis (DeVellis, Reference DeVellis2017). Therefore, the sample size of this study of 288 respondents was considered to be adequate. Over half of the participants were female (57%) and most were between the ages of 29 and 68 years (77%). The greatest percentage indicated that they had a postsecondary degree (68%). Most participants indicated that they did not have a disability (78%). Key demographic information is shown above in Table 2.
Demographic information (288 respondents)

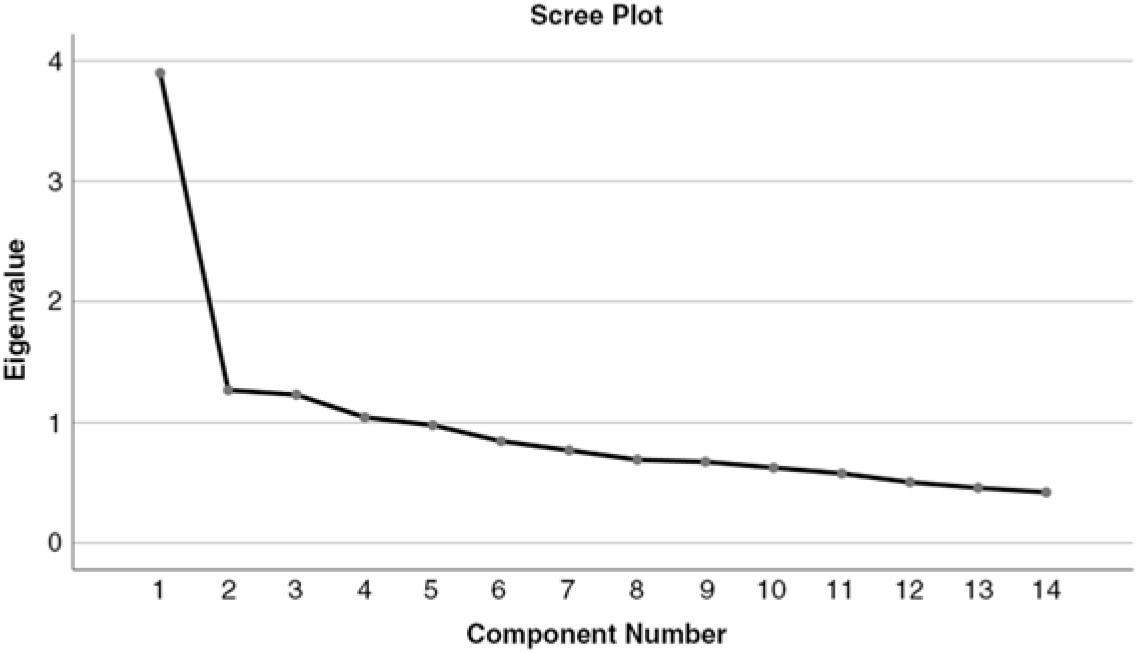
A series of exploratory factor analyses, using principal component analysis (PCA), was conducted on the 20-item CADE Scale. This resulted in the elimination of six items, resulting in a 14-item scale. An exploratory factor analysis using PCA with Oblimin rotation was conducted on this shortened version of the CADE Scale to determine the underlying components. Initially, a four-component solution was extracted explaining 53% of the variance; however, analysis of the four-component solution revealed that the first factor, with a score of 3.90 (27.86% of the variance explained), was more than three times that of the second factor at 1.27 (9.08% of the variance explained).
Such a large difference between the relative sizes of factors, particularly when subsequent differences are relatively small, indicates that only those large factors are significant (Furr & Bacharach, Reference Furr and Bacharach2014). In this case, the difference of more than three times the variance explained between the first and second factors and the relatively small differences between the remainder of the factors indicate that the CADE Scale should be understood as a one-factor scale. Furr & Bacharach (Reference Furr and Bacharach2014) suggest that a scree plot analysis (Cattell, Reference Cattell1966) may support this interpretation. The scree plot, as shown in Fig. 1, is a visual representation of eigenvalues. Factors to the left of the elbow, where the scree plot levels off, are typically considered to be significant. In this example, only one factor is indicated.
Additional supporting evidence for a one-factor solution was obtained by conducting a parallel analysis (PA). In a PA, the number of variables (14 items) and participants (288) are input into a program that generates random numbers based on a correlation matrix, performs a PCA, and determines the eigenvalues for those specified variables (Horn, Reference Horn1965; Watkins, Reference Watkins2000). Only those factors which generate higher numbers in the original data analysis are retained. When the PA data were compared with the CADE Scale data, only the first factor in the original analysis produced a higher score than that generated by the PA (3.90–1.39), providing additional evidence for a one-factor solution. When computed as a one-factor PCA, each of the 14 items in the reduced CADE Scale was loaded with a coefficient greater than 0.30. This loading indicates that each of the items is measuring the same construct (Furr & Bacharach, Reference Furr and Bacharach2014).
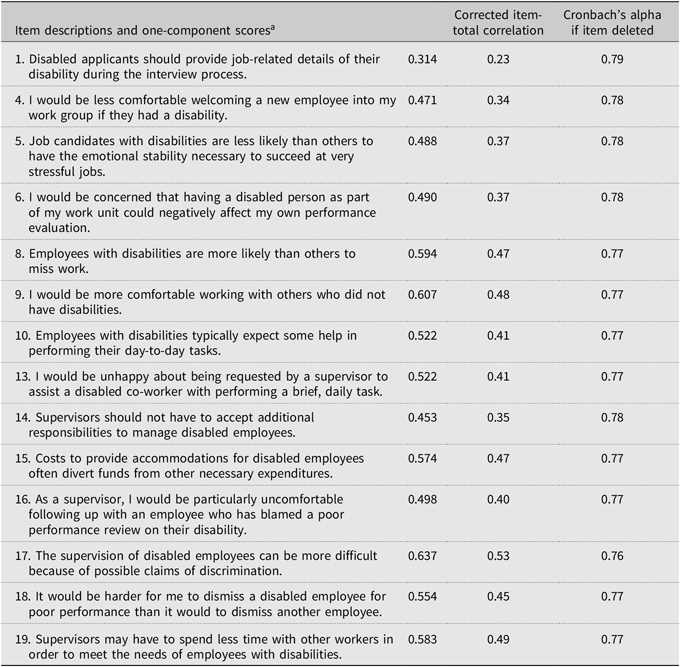
Reliability indices were also examined (Table 3). The Cronbach’s alpha was 0.79, indicating high internal consistency for the 14-item scale (DeVellis, Reference DeVellis2017; Furr & Bacharach, Reference Furr and Bacharach2014). With the exception of Item 1, the Cronbach’s alpha decreased if an item was deleted. When Item 1 was deleted, the Cronbach’s alpha remained at 0.79. These decreases in the Cronbach’s alpha score, with the possible exception of Item 1, indicate that each of the items is measuring the same construct. Inter-item correlations and item-total correlations were also examined. Satisfactory corrected item-total correlations ranged from 0.23 to 0.53. Inter-item correlations were small to strong, ranging from 0.04 to 0.47. The average inter-item correlation was 0.22. Analysis of descriptive statistics revealed that, at an item level, Item 6 had the highest mean at 6.76 and Item 1 had the lowest mean at 3.13. The mean total scale score was 76.14 (SD = 11.03).
Fourteen-item CADE Scale

Extraction method: principal component analysis.
a One component extracted.
The CADE Scale is designed to measure a midlevel aspect of attitudes toward PWDs (i.e., attitudes limited to the workplace but directed toward individuals with a range of perceived disabilities). Item-total correlations at the midrange are more appropriate than those that are too high (>0.8); these latter correlations, for a midlevel scale, are considered to be redundant (Penfield, Reference Penfield and Geisinger2013).
Discussion
Unemployment for PWDs continues to remain at unacceptably high levels (Burke et al., Reference Burke, Bezyak, Fraser, Pete, Ditchman and Chan2013). The attitudes of others within the workplace contribute significantly to the workplace success of PWDs (Vornholt, Uitdewilligen, & Nijhuis, Reference Vornholt, Uitdewilligen and Nijhuis2013).
The CADE Scale has been developed to address the validity challenges of earlier disability-related measures by clearly articulating both the theoretical and empirical validity evidences generated in its support. The CADE Scale is also distinguished from earlier measures in that it has been developed specifically as a tool for application in the workplace and as a measure of attitudes toward those PWDs perceived as different from the observer. Many other existing scales measure attitudes toward specific disabilities, categories of disabilities, or disability in general (e.g., Palad et al., Reference Palad, Barquia, Domingo, Flores, Padilla and Ramel2016). However, none of these specifically measures this perception of difference.
The difference model
The new difference model of disability provides a clearly delineated theoretical framework within which the CADE Scale was evaluated at both an item level and at a scale level by SMEs. In addition, this delineation of theory addresses a key requisite of scale development that was absent from earlier scales intended to measure attitudes toward disability.
Workplace attitude surveys toward PWDs commonly indicate that these attitudes are most strongly influenced by perceptions that PWDs cannot satisfactorily perform the tasks required of a specific organization (Domzal et al., Reference Domzal, Houtenville and Sharma2008). Some authors have noted that anticipation of poor performance specifically outweighed concerns over social interaction within the workplace (Nota et al., Reference Nota, Santilli, Ginevra and Soresi2014). However, the results of this study indicate that these attitudes are most strongly influenced by perceptions that PWDs are different from others. In particular, each of the 14 items retained within the exploratory factor analysis included a relational aspect that differentiated PWDs from others. These include examples such as less comfortable (Item 4), more likely than others (Item 8), particularly uncomfortable (Item 16), harder … to dismiss (Item 18), etc.
These findings have implications for the focus of workplace interventions and training. If workplace attitudes toward PWDs are influenced by perceptions of difference, these interventions would include materials and techniques that would be different from those employed if attitudes were considered to be based on perceptions of an inability to perform certain job functions.
Empirical evidence
The judgmental study generated a substantial degree of content validity evidence in support of a 20-item CADE Scale. By conforming to the CVI guidelines set out by Lynn (Reference Lynn1986), the results of this study were sufficiently clear to warrant proceeding to the next step of conducting an initial validation study. This next study provided additional evidence in support of the hypothesized model of disability underlying the CADE Scale – that of an affect-based response to perceived difference.
Exploratory factor analyses of scales developed to measure attitudes toward PWDs have produced both unidimensional (e.g., Yuker et al., Reference Yuker, Block and Younng1970) and multidimensional (e.g., Antonak, Reference Antonak1982) solutions. Although Yuker et al. (Reference Yuker, Block and Younng1970) eschewed any consideration of theoretical validity as a part of scale development, those authors considered that respondent scores “may be interpreted as reflecting either the subject’s perceiving the disabled as basically the same as or different from the non-disabled” (p. 42). Later writers, such as Antonak (Reference Antonak1982) argued that the concept of disability was too complex to be interpreted as a unidimensional construct. Factor analyses of the 31 studies reviewed by Palad et al. (Reference Palad, Barquia, Domingo, Flores, Padilla and Ramel2016) revealed solutions that ranged from two to seven factors.
Within the CADE Scale initial validation study, exploratory factor analysis produced a unidimensional scale with one factor (DeVellis, Reference DeVellis2017; Furr & Bacharach, Reference Furr and Bacharach2014). This factor was labelled as perceived differences and included each of the 14 items. It addressed a wide range of workplace perceptions of PWDs that extended beyond any specific characteristic of an individual disability. These perceptions centered on challenges to collegial and supervisory relationships and the perceived negative effects on individuals without disabilities at both a personal and corporate levels. All items, with the exception of Item 1, had corrected item-total correlations between 0.34 and 0.53, indicating that they provided moderate to large amounts of information (Furr & Bacharach, Reference Furr and Bacharach2014; Warner, Reference Warner2008). Although Item 1 showed a relatively low correlation of 0.24, this score was likely somewhat lower than the others due to it being distinguished as the only item to focus on an interview scenario. This item was retained because it had been retained in the one-factor simple structure and because it addressed a topic that has been raised as problematic by many of the SMEs in the content validity study.
It is not surprising that a one-factor solution was generated from the initial validation study. As noted above, the questionnaire design was predicated upon the difference model of disability and each item was crafted within that specific framework. With the exception of the Attitudes Toward Disabled People Scale (Yuker et al., Reference Yuker, Block and Younng1970), none of the scales reviewed in the systematic reviews by Breen (Reference Breen2018a) or Palad et al. (Reference Palad, Barquia, Domingo, Flores, Padilla and Ramel2016) demonstrated either evidence of theoretical validity or a unidimensional factor structure. Although many researchers indicated that the construct of disability is too complex to allow for a unidimensional factor structure (e.g., Antonak, Reference Antonak1982), a comparative analysis of the relationship between factor structure and theoretical validity appears to have been unreported within the literature.
Implications for rehabilitation counselling and research practice
Applications of the CADE Scale will address a gap in determining whether interventions promoting disability awareness make a statistically significant difference in workplace attitudes. In addition, measures of these attitudes over time within various organizations will provide rehabilitation counsellors with tangible indicators of whether positive changes have occurred – leading to more successful placement opportunities.
Of particular interest within research practice would be comparisons between measures of positive changes in workplace attitudes toward PWDs and increases in the hiring, retention, and promotion of PWDs.
Limitations and Next Steps
The process described herein provides theoretical and empirical validity evidences in support of the CADE Scale. Although SMEs were recruited from four different countries, these were all self-selected and English speaking. A different set of SMEs, with different skill sets and from different locations, may have delivered different results. The potential for an acquiescence bias on the part of the SMEs is also a possibility; their responses were not anonymous to the author, who was known to many of them. In addition, as the scale developer, the potential exists for a confirmation bias on the part of the author (DeVellis, Reference DeVellis2017; Furr & Bacharach, Reference Furr and Bacharach2014; Kane, Reference Kane2016).
The initial validation study was based on a convenience sample of respondents recruited initially through two appeals to participate; these appeals may have encouraged participants with an interest in supporting employment opportunities for PWDs and which may have introduced a positive bias into the responses. An additional validation study that is administered to a more diverse range of respondents may yield different results. As such, results of this initial validation study may not be generalizable.
Scree plot.

As noted by Messick (Reference Messick1990), test validity is ultimately based on an “evaluative judgment of the degree to which empirical evidence and theoretical rationales” (p. 5) actually support interpretations of test scores. Judgments formed by a consideration of this study will also be strengthened through analyses of data generated through the administration of the CADE Scale on a pre- and post-intervention basis. (AERA, 2014).
(The above study was conducted under the University of British Columbia Behavioural Research Ethics Board Certificate #H15-02011).
Author ORCIDs
Jonathon S. Breen 0000-0002-2382-4753
Acknowledgements
This study was supported by the Canadian Institutes of Health Research (Award #140346). This report was written while a Postdoctoral Fellow at the University of British Columbia.
Financial support
This research received no specific grant from any funding agency, commercial, or not-for-profit sectors.
Conflicts of interest
No potential conflict of interest was reported by the authors.