Introduction
The globally distributed green turtle (Chelonia mydas) is classified as threatened (IUCN, 2023). Renowned for its complex life cycle and migratory behaviour (Meylan and Meylan, Reference Meylan, Meylan, Eckert, Bjorndal, Abreu-Grobois and Donnelly1999; Godley et al., Reference Godley, Broderick, Frauenstein, Glen and Hays2002; Bolten, Reference Bolten, Lutz, Musick and Wyneken2003; Proietti et al., Reference Proietti, Reisser, Kinas, Kerr, Monteiro, Marins and Secchi2012), this species occupies diverse ecological niches. Conservation efforts have traditionally focused on identifying threats to nesting grounds, where sea turtles spend a mere 1% of their lives (Bjorndal, Reference Bjorndal2000). Consequently, research on the demographic composition of feeding areas has been relatively limited, despite its importance for understanding population dynamics (Sears et al., Reference Sears, Bowen, Chapman, Galloway, Hopkins-Murphy and Woodley1995; Bass and Witzell, Reference Bass and Witzell2000; Luke et al., Reference Luke, Horrocks, Leroux and Dutton2004; Bass et al., Reference Bass, Epperly and Braun-Mcneill2006; Naro-Maciel et al., Reference Naro-Maciel, Becker, Lima, Marcovaldi and DeSalle2007; Dutton et al., Reference Dutton, Balazs, Leroux, Murakawa, Zarate and Martínez2008; Velez-Zuazo et al., Reference Velez-Zuazo, Ramos, van Dam, Diez, Abreu-Grobois and Mcmillan2008).
Mitochondrial DNA (mtDNA) control region analysis has become a cornerstone in sea turtle research. The development of genetic markers based on this region has significantly advanced our understanding of various aspects of sea turtle biology, including population structure, phylogeographic, systematics, native origins, and natal homing (Moritz, Reference Moritz1994; Avise, Reference Avise, Hewitt and Fulbright2007; Bowen and Karl, Reference Bowen and Karl2007; Naro-Maciel et al., Reference Naro-Maciel, Bondioli, Martin, Almeida, Baptistotte, Bellini, Marcovaldi, Santos and Amato2012; Proietti et al., Reference Proietti, Reisser, Kinas, Kerr, Monteiro, Marins and Secchi2012; Jensen et al., Reference Jensen, Fitzsimmons, Dutton, Wyneken, Lohmann and Musik2013; Jordão et al., Reference Jordão, Bondioli, Guebert, Thoisy and Toledo2015; Almeida et al., Reference Almeida, Santos and Mott2021).
One approach to study feeding grounds and understand the composition and natal origins of this aggregation is through mixed stocks analysis (MSA) (Komoroske et al., Reference Komoroske, Jensen, Stewart, Shamblin and Dutton2017). This is a genetic-ecological analysis that allows the estimation of the natal origins of turtle aggregations by determining the contribution of different rookeries to a specific foraging area (Pella and Masuda, Reference Pella and Masuda2001). The MSA has been widely used to understand sea turtle migration patterns and the composition of mixed stocks in foraging aggregations (Naro-Maciel et al., Reference Naro-Maciel, Becker, Lima, Marcovaldi and DeSalle2007; Proietti et al., Reference Proietti, Reisser, Kinas, Kerr, Monteiro, Marins and Secchi2012; Almeida et al., Reference Almeida, Santos and Mott2021).
Another common approach to study sea turtle stocks in feeding areas is through stranding data, which provide consistent information on the distribution of species in the adjacent marine area where they occur (Pyenson, Reference Pyenson2010; Peltier et al., Reference Peltier, Dabin, Daniel, Canneyt, Doremus, Huon and Ridoux2012; Farias et al., Reference Farias, Alencar, Bomfim, Fragoso, Rossi, Moura, Gavilan and Silva2019; Bomfim et al., Reference Bomfim, Farias, Silva, Rossi, Santana and Pontes2022). Studies on strandings along the northeastern Brazilian coast, specifically within the Potiguar Basin, have highlighted this region as a critical habitat for green turtles, supporting their development and feeding requirements (Farias et al., Reference Farias, Alencar, Bomfim, Fragoso, Rossi, Moura, Gavilan and Silva2019).
However, the Potiguar Basin has experienced significant environmental degradation, including mangrove destruction, poor exploitation of the area and unsustainable fishing practices (Attademo, Reference Attademo2007; Farias et al., Reference Farias, Alencar, Bomfim, Fragoso, Rossi, Moura, Gavilan and Silva2019; Silva-Júnior et al., Reference Silva-Júnior, Farias, Bomfim, Freire, Revoredo, Rossi, Matushima, Grisi-Filho, Silva and Gavilan2019; Bomfim et al., Reference Bomfim, Farias, Silva, Rossi, Santana and Pontes2022). These anthropogenic pressures have likely contributed to the high rate of sea turtle strandings observed in the region.
This study aimed to investigate the distribution and genetic characteristics of green turtles (C. mydas) within the Potiguar Basin, northeastern Brazil. Specifically, we sought to determine the population's genetic composition, identify potential natal origins, and characterize the ecological features of this important foraging area.
Materials and methods
Study site and data collection
This study analysed data from 5617 stranded green turtles collected through daily beach monitoring along approximately 300 km of the northeastern Brazilian coast, between Caiçara do Norte (58401.1500S, 3684036.4100W), Rio Grande do Norte (RN), and Icapuí (4838048.2800S,153 37832052.0800W), Ceará (CE), within the Potiguar Basin. Monitoring activities, conducted from January 2010 to December 2019, involved trained personnel using quad bikes equipped with GPS to record the location of stranded individuals (Figure 1). This research was part of the Beach Monitoring Program of the Potiguar Basin (PMP-BP), conducted implemented by the Projeto Cetáceos da Costa Branca – Universidade do Estado do Rio Grande do Norte (PCCB-UERN) under the mandate of Brazil's environmental agency, IBAMA, in response to oil and gas exploration activities by PETROBRAS (Agreement No. 2500.005657510.2).
Geographic distribution of the study site, Brazilian Northeastern coast.
Source: Projeto Cetáceos da Costa Branca – Universidade do Estado do Rio Grande do Norte (PCCB-UERN).

To assess temporal trends in stranding frequency, we examined data from 2010 to 2019. However, as previous research indicated stable stranding rates during this period (Farias et al., Reference Farias, Alencar, Bomfim, Fragoso, Rossi, Moura, Gavilan and Silva2019), this study focused on data from 2019 (N = 477). To visualize stranding distribution, kernel density maps were generated using ArcMap 10.4.1 for both the entire dataset (2010–2019) and the 2019 data specifically (Figure 2).
Density maps by the Kernel method: (a) stranding data of green turtles in all monitored years (2010–2019) and (b) with stranding data of green turtles recorded in the year 2019, in the Potiguar Basin.

A small fragment (6 mm in diameter) of skin was collected from each recorded green turtle for genetic analysis, removed with the aid of surgical tweezers and sterile blades, to avoid contamination. The collected samples were stored with absolute alcohol.
To select representative skin samples for genetic analysis (n = 39), individuals were chosen based on their alignment with the overall stranding dataset (n = 477), ensuring similar proportions in terms of sex (male, female, and undetermined), life stage (juvenile, subadult, and adult), and animal status (alive or dead) (Table 1).
Relative frequency (%) of the sampled individuals according to sex, life-stage, and status

To determine life stage, curved carapace length (CCL) was measured from the nuchal notch to the supracaudal scales for all individuals (Bolten, Reference Bolten, Eckert, Bjorndal, Abru-Grobois and Donnelly1999). Juveniles were defined as those with a CCL less than 90 cm, based on minimum nesting size for female green turtles in nearby nesting areas (Almeida et al., Reference Almeida, Moreira, Bruno, Thomé, Martins, Bolten and Bjorndal2011). For sex determination, we analysed the sexual dimorphism in adult animals (larger tail for males and smaller for females) and in juveniles, when possible, macroscopic analyses of the gonads were performed.
Following sample selection based on similarity to the overall stranding dataset, skin samples were collected for genetic analysis and subsequently transferred to the Laboratory of Comparative Pathology of Wild Animals (LAPCOM), School of Veterinary Medicine and Animal Science, University of São Paulo (FMVZ/USP).
Molecular analysis
Total DNA was extracted from skin samples of 39 green turtles stored in absolute alcohol, using the DNeasy Blood and Tissue kit (Qiagen, Hilden, Germany) according to the manufacturer's instructions. Previously primers were used to amplify a fragment of the mitochondrial control region: LCM15382 (5′-GCTTAACCCTAAAGCATTGG-3′) and H950 (5′-GTCTCGGATTTAGGGGTTTG-3′), as described by Abreu-Grobois et al. (Reference Abreu-Grobois, Horrocks, Formia, LeRoux, Velez-Zuazo, Dutton, Soares, Meylan, Browne, Frick, Panagopoulou, Rees and Williams2006).
End-point PCR reaction (25 μl) were conducted in 0.2 μl microtubes containing 1 μl (10 pmol) of each primer, 0.2 mM of dNTP mixture, 1.25 U of Platinum Taq DNA polymerase (Invitrogen, Life Technologies, Brazil), 1 × PCR buffer (20 mM Tris–HCl pH 8.4 and 50 mM KCl), 2.5 mM MgCl2, 4 μl of DNA template, and ultrapure sterile water to a final volume of 25 μl. Amplifications were performed in a thermal cycler (Bio-Rad, Hercules, CA, USA) using the following end-point PCR protocol: denaturation for 2 min 94 °C, followed by 40 cycles of 1 min at 94 °C, 1 min at 57 °C and 1 min at 72 °C, and a final extension of 10 min at 72 °C (Abreu-Grobois et al., Reference Abreu-Grobois, Horrocks, Formia, LeRoux, Velez-Zuazo, Dutton, Soares, Meylan, Browne, Frick, Panagopoulou, Rees and Williams2006). Negative controls (nuclease-free water) were included in each DNA extraction and PCR reaction. A skin sample with confirmed amplification and sequencing of mitochondrial control region was selected as positive control. The PCR products were visualized in 1.5% agarose gels and bands were excised and purified using the GFX gel extraction kit (GE Healthcare, IL, USA). Positive samples were confirmed through direct Sanger sequencing. Nucleotide sequences (481 bp) obtained were aligned with similar ones available at Genbank (http://ncbi.nlm.nih.gov) and Archie Carr Center for Sea Turtle Research (http://accstr.uf.edu/) using the Clustal W method followed by p-distance analysis in MEGA X (Kumar et al., Reference Kumar, Stecher, Li, Knyaz and Tamura2018) to determine the mitochondrial haplotypes. Representative nucleotide sequences of the mitochondrial haplotypes identified were submitted to Genbank under accession numbers OQ915344 and OQ946727 to OQ946733.
Genetic diversity was estimated by haplotype (h) and nucleotide (π) diversity indices (Nei, Reference Nei1987) with the Arlequin 3.11 program (Excoffier and Lischer, Reference Excoffier and Lischer2010). To verify differences on the frequency of the haplotypes between feeding grounds across the Brazilian coast, population structure was evaluated using Wright's Fst fixation index (Reference Wright1949), based on haplotype frequencies using the same software as from the genetic diversity. The degree of genetic differentiation based on Fst values was classified as low (0–0.05), moderate (0.05–0.15), high (0.15–0.25), or very high (>0.25) according to Wright (Reference Wright1949). The structure was evaluated using the study area and studies carried out on the Brazilian coast in Almofala/CE and Ubatuba/SP (Naro-Maciel et al., Reference Naro-Maciel, Becker, Lima, Marcovaldi and DeSalle2007), Bahia, Espírito Santo, Fernando de Noronha, and Atol das Rocas (Naro-Maciel et al., Reference Naro-Maciel, Bondioli, Martin, Almeida, Baptistotte, Bellini, Marcovaldi, Santos and Amato2012), Ilha Arvoredo/SC and Praia do Cassino/RS (Proietti et al., Reference Proietti, Reisser, Kinas, Kerr, Monteiro, Marins and Secchi2012), Paranaguá Estuarine Complex (PEC)/PR (Jordão et al., Reference Jordão, Bondioli, Guebert, Thoisy and Toledo2015; Savada et al., Reference Savada, Prosdocimi, Domit and Almeida2021), and Alagoas (Almeida et al., Reference Almeida, Santos and Mott2021). A haplotype network was built using the PopArt v1.7 software (Leigh and Bryant, Reference Leigh and Bryant2015) to illustrate the frequency and relationship between the haplotypes found in the Potiguar Basin using the neighbour-joining method (Bandelt et al., Reference Bandelt, Forster and Röhl1999).
A ‘many-to-one’ MSA (Pella and Masuda, Reference Pella and Masuda2001; Bolker et al., Reference Bolker, Okuyama, Bjorndal and Bolten2007) with modifications following Stahelin et al. (Reference Stahelin, Hofman, Qintana-Ascencio, Reusche and Mansfeld2022) was applied to infer the natal origins of C. mydas from the Potiguar Basin using the R software, version 4.1.3 (R Core Team, 2022). To establish a baseline, we utilized genetic data from previously described nesting grounds found in the literature – Florida, Mexico (Encalada et al., Reference Encalada, Lahanas, Bjorndal, Bolten, Miyamoto and Bowens1996), Costa Rica (Bjorndal et al., Reference Bjorndal, Bolten and Tröeng2005), Surinam (Bjorndal et al., Reference Bjorndal, Bolten and Tröeng2005; Shamblin et al., Reference Shamblin, Bjorndal, Bolten, Hillis-Starr, Lundgren, Naro-Maciel and Nairn2012), Atol das Rocas, Fernando de Noronha, Trindade Island (Bjorndal et al., Reference Bjorndal, Bolten, Moreira, Bellini and Marcovaldi2006), Aves Island (Shamblin et al., Reference Shamblin, Bjorndal, Bolten, Hillis-Starr, Lundgren, Naro-Maciel and Nairn2012), Bioko, São Tomé and Príncipe (Formia et al., Reference Formia, Godley, Dontaine and Bruford2006), Ascencion Island (Formia et al., Reference Formia, Broderick, Glen, Godley, Hays and Bruford2007), Cuba (Ruiz-Urquiola et al., Reference Ruiz-Urquiola, Riveron-Giro, Perez-Bermudez, Abreu-Grobois, González-Pumariega, James-Petric, Dıaz-Fernandez, Álvares-Castro, Jager, Azanza-Ricardo and Espinoza-López2010), and Guinea Bissau (Patrício et al., Reference Patrício, Formia, Barbosa, Broderick, Bruford, Carreras, Catry, Ciofi, Regalla and Godley2017). The number of nests laid on each rookery per year was obtained from the International Union for Conservation of Nature (IUCN) Marine Turtle Specialist Group regional reports (Kouerey Oliwina et al., Reference Kouerey Oliwina, Honarvar, Girard and Casale2020; Marcovaldi et al., Reference Marcovaldi, Thomé and Fallabrino2021; Nalovic et al., Reference Nalovic, Ceriani, Fuentes, Pfaller, Wildermann, Uribe-Martínez and Cuevas2021) and available literature (Varela et al., Reference Varela, Quílez and Harrison2015). The distance estimated between rookeries and the feeding ground was based on superficial currents.
Markov Chain and Monte Carlo (MCMC) were applied to obtain the posterior distributions of stock contributions, integrating data likelihood with informative prior. We used ten chains of 1,000,000 iterations with an initial burn-in of the first 500,000 resulting in posterior distributions with 95% credibility intervals. The Gelman–Rubin shrink factor (Gelman and Rubin, Reference Gelman and Rubin1992) was utilized to assess chain convergence by comparing variances and all regions achieved values below 1.05, satisfying the Gelman–Rubin convergence criteria.
Statistical analyses
To assess data normality and homogeneity of variance, Kolmogorov–Smirnov and Levene's tests were conducted, respectively. Kruskal–Wallis and Bonferroni tests were employed to analyse monthly stranding frequency across three CCL size groups (0–29.9, 30–59.9, 60–90 cm), determined through cluster analysis. These size groups were significantly different based on Kruskal–Wallis test results. The analyses were performed using IBM SPSS Statistics (version 20) with a significance level of P < 0.05.
To compare our findings with previous studies along the Brazilian coast, a generalized additive model (GAM) was applied, assuming a Beta distribution for data correction. Comparisons were made with previous studies conducted along the Brazilian coast in specific regions: Almofala/CE and Ubatuba/SP (Naro-Maciel et al., Reference Naro-Maciel, Becker, Lima, Marcovaldi and DeSalle2007), Bahia, Espírito Santo, Fernando de Noronha, and Atol das Rocas (Naro-Maciel et al., Reference Naro-Maciel, Bondioli, Martin, Almeida, Baptistotte, Bellini, Marcovaldi, Santos and Amato2012), Ilha Arvoredo/SC and Praia do Cassino/RS (Proietti et al., Reference Proietti, Reisser, Kinas, Kerr, Monteiro, Marins and Secchi2012), Paranaguá Estuarine Complex (PEC)/PR (Jordão et al., Reference Jordão, Bondioli, Guebert, Thoisy and Toledo2015; Savada et al., Reference Savada, Prosdocimi, Domit and Almeida2021), and Alagoas (Almeida et al., Reference Almeida, Santos and Mott2021).
Results
Ecological features of green turtles
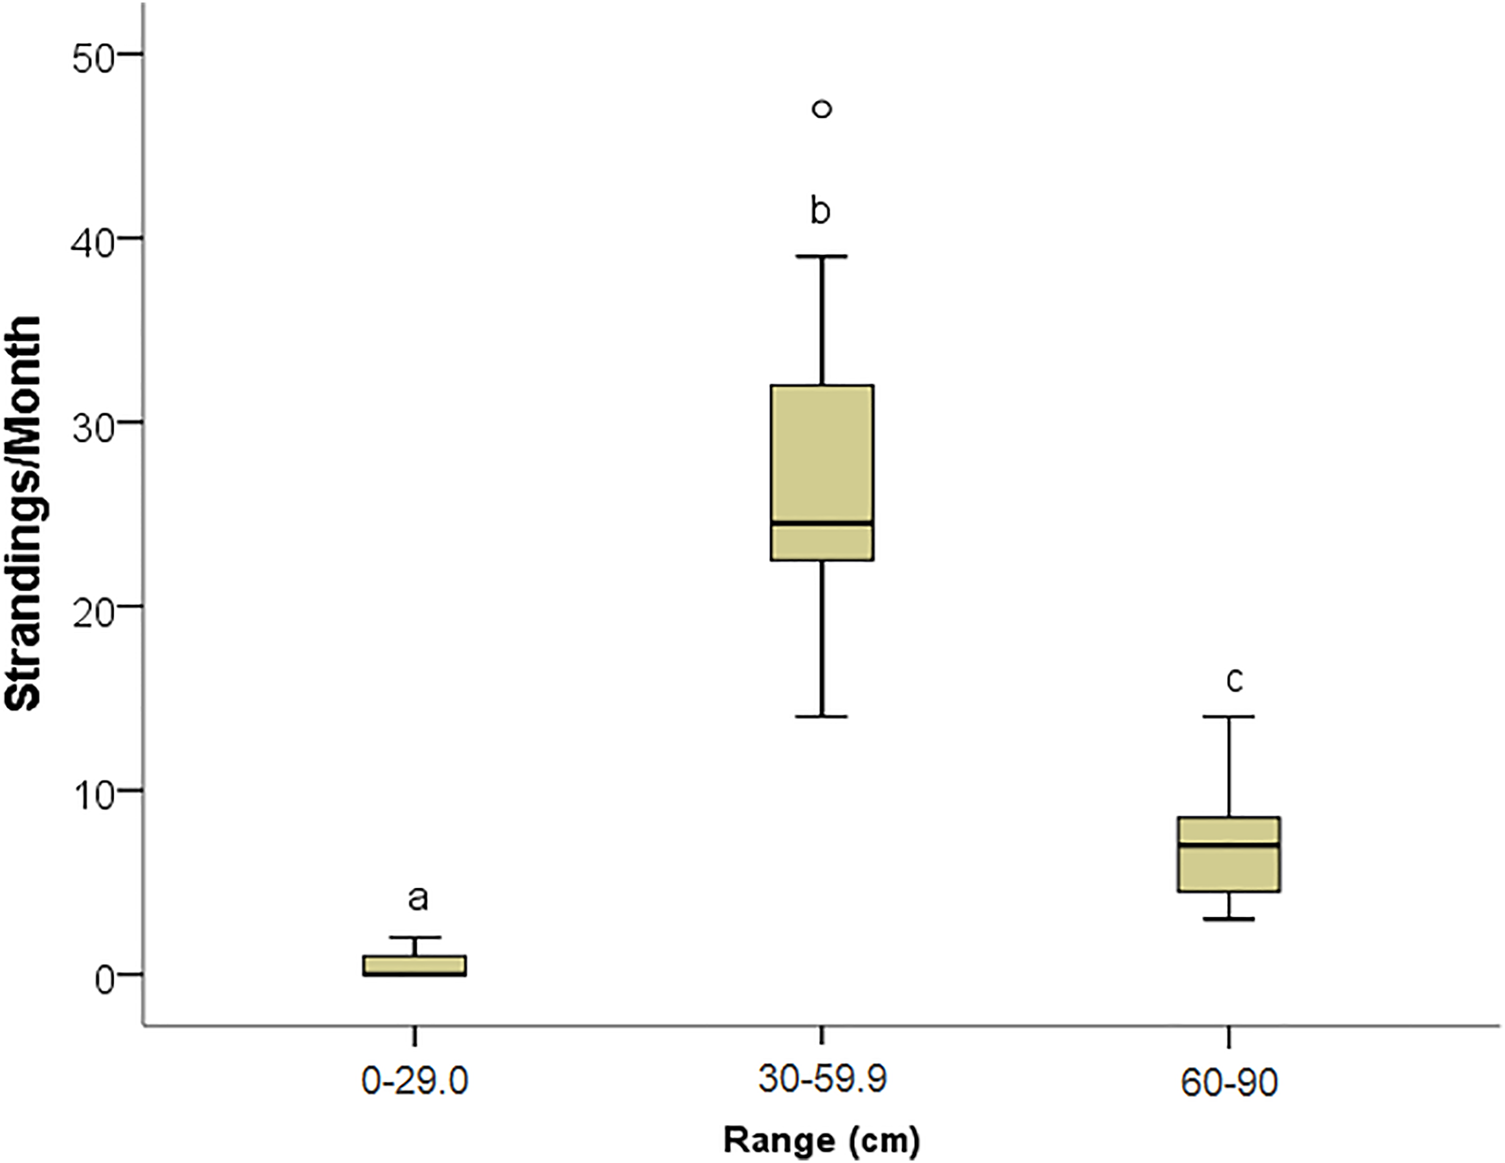
Analysis of 477 stranded green turtles in 2019 revealed that 87.36% (n = 417) were juveniles with a CCL below 90 cm (Almeida et al., Reference Almeida, Moreira, Bruno, Thomé, Martins, Bolten and Bjorndal2011). Of these, 465 were dead and 12 were alive. Within the juvenile spectrum, the Kruskal–Wallis test showed that there is an effect of the size of the CCL on the monthly frequency of strandings [χ2 (2) = 31.407; P < 0.001]. Results indicated significant differences in stranding frequency among three CCL size groups (0–29.9, 30–59.9, 60–90 cm), with the intermediate (30–59.9 cm) group exhibiting the highest frequency and the smallest group the lowest to 29.9 cm (Figure 3).
Comparison between the number of green turtles’ strandings (Chelonia mydas) and the three size groups of CCL (0–29.9, 30–59.9, and 60–90 cm) during the year 2019, in the Potiguar Basin – northeastern Brazil.

Regarding the sex-ratio analysis, although the largest records of the present study presented indeterminate sex (60.52%), comparing the frequency of males and females, it is observed that the green turtles registered in Potiguar Basin were generally female (31.57%).
Genetic composition of green turtles
Eight haplotypes of the mtDNA control region (n = 39, 481 bp) were identified: CM-A1 (GenBank accession number OQ915344), CM-A3 (GenBank accession number OQ946727), CM-A5 (GenBank accession number OQ946728), CM-A6 (GenBank accession number OQ946729), CM-A8 (GenBank accession number OQ946730), CM-A9 (GenBank accession number OQ946731), CM-A10 (GenBank accession number OQ946732), and CM-A45 (GenBank accession number OQ946733). CM-A8 was the predominant haplotype (48.7%), followed by CM-A5 (30.8%), while the remaining haplotypes occurred at frequencies below 6%. Although the haplotype composition showed some divergence, our results are like those found in other feeding grounds in the Southwestern Atlantic Ocean (Naro-Maciel et al., Reference Naro-Maciel, Becker, Lima, Marcovaldi and DeSalle2007, Reference Naro-Maciel, Bondioli, Martin, Almeida, Baptistotte, Bellini, Marcovaldi, Santos and Amato2012; Proietti et al., Reference Proietti, Reisser, Kinas, Kerr, Monteiro, Marins and Secchi2012; Prosdocimi et al., Reference Prosdocimi, Carman, Albareda and Remis2012; Jordão et al., Reference Jordão, Bondioli, Guebert, Thoisy and Toledo2015; Almeida et al., Reference Almeida, Santos and Mott2021).
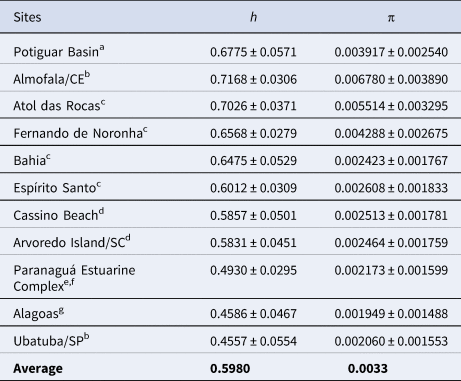
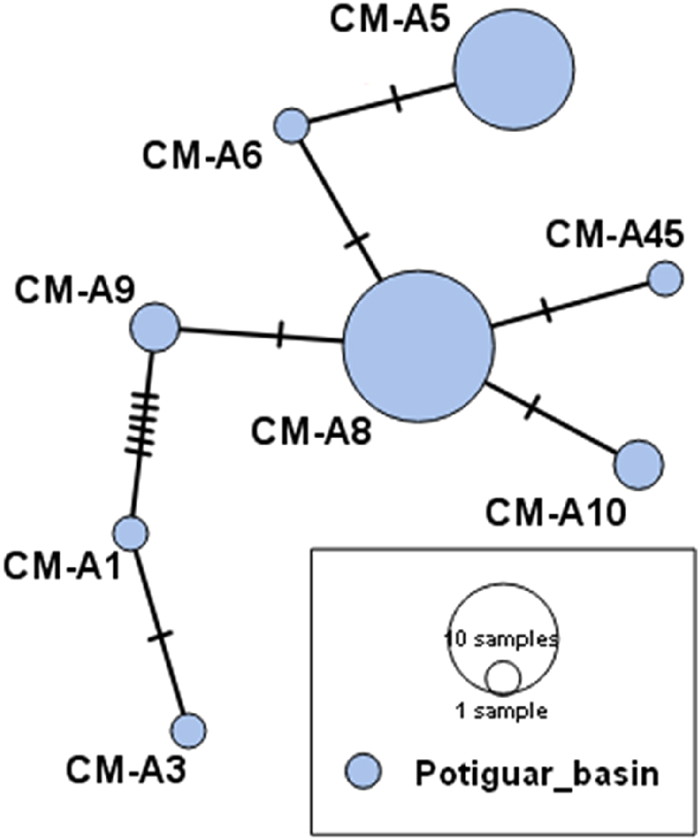
The haplotype (h = 0.6775 ± 0.0571) and the nucleotide diversity (π = 0.003917 ± 0.00254) found for the Potiguar Basin is in accordance with other regions with genetic description, and it is like regions geographically close to the study area, such as Almofala/CE (Naro-Maciel et al., Reference Naro-Maciel, Becker, Lima, Marcovaldi and DeSalle2007) and Atol das Rocas/Fernando de Noronha (Naro-Maciel et al., Reference Naro-Maciel, Bondioli, Martin, Almeida, Baptistotte, Bellini, Marcovaldi, Santos and Amato2012) (Table 2). Most of the haplotypes identified in the study area differ by a single nucleotide, consistent with the observed low nucleotide diversity. This is depicted in the haplotype network presented in Figure 4, which illustrates the relationships among haplotypes. In the network, the size of each circle represents the frequency of a haplotype, while the black dashes denote mutational steps, with each dash corresponding to a single nucleotide difference.
Chelonia mydas haplotype (h) and nucleotide (π) diversity estimates and their standard deviation for all compared foraging aggregations

aPresent study; bNaro-Maciel et al. (Reference Naro-Maciel, Becker, Lima, Marcovaldi and DeSalle2007); cNaro-Maciel et al. (Reference Naro-Maciel, Bondioli, Martin, Almeida, Baptistotte, Bellini, Marcovaldi, Santos and Amato2012); dProietti et al. (Reference Proietti, Reisser, Kinas, Kerr, Monteiro, Marins and Secchi2012); eJordão et al. (Reference Jordão, Bondioli, Guebert, Thoisy and Toledo2015); fSavada et al. (Reference Savada, Prosdocimi, Domit and Almeida2021); gAlmeida et al. (Reference Almeida, Santos and Mott2021).
Haplotype network of the C. mydas found in the Potiguar Basin, constructed by the neighbour-joining network. The circle size represents the frequency of the haplotypes and the black dashes the mutational steps.

Structure analysis showed an overall low genetic structure, with values raging between 0.02 and 0.11 (P < 0.05). The Potiguar Basin presented a non-significant value for most of the regions evaluated, and only presented a low genetic differentiation between Paranaguá Estuarine Complex (Fst = 0.03, P < 0.05) and Alagoas (Fst = 0.04, P < 0.05) and a slightly moderate differentiation between Ubatuba/SP (Fst = 0.05, P < 0.05).
The best fitted model, considering the haplotype group, explained about 78% of the variance of the entire model, and an R 2 of 0.76. Furthermore, the adjusted model analysis reveals a significant increase in the proportion of the CM-A8 haplotype (P < 0.01), indicating a positive correlation between latitude and the frequency of this haplotype, with higher values observed at southern latitudes (Figure 5).
Comparison between genetic haplotype proportion of the Brazilian Chelonia mydas feeding grounds in the Southwest Atlantic Ocean according to the latitude. CE (Almofala) (Naro-Maciel et al., Reference Naro-Maciel, Becker, Lima, Marcovaldi and DeSalle2007); PB (Potiguar Basin – present study); FNA (Fernando de Noronha Archipelago) and AR (Atol das Rocas) (Naro-Maciel et al., Reference Naro-Maciel, Bondioli, Martin, Almeida, Baptistotte, Bellini, Marcovaldi, Santos and Amato2012); AL-F (Alagoas – females) and AL-M (Alagoas – males) (Almeida et al., Reference Almeida, Santos and Mott2021); BA (Bahia) and ES (Espírito Santo) (Naro-Maciel et al., Reference Naro-Maciel, Bondioli, Martin, Almeida, Baptistotte, Bellini, Marcovaldi, Santos and Amato2012); SP (Ubatuba) (Naro-Maciel et al., Reference Naro-Maciel, Becker, Lima, Marcovaldi and DeSalle2007); PEC (Paranaguá Estuarine Complex) (Jordão et al., Reference Jordão, Bondioli, Guebert, Thoisy and Toledo2015; Savada et al., Reference Savada, Prosdocimi, Domit and Almeida2021); IA (Avoredo Island) and RS (Cassino Beach) (Proietti et al., Reference Proietti, Reisser, Kinas, Kerr, Monteiro, Marins and Secchi2012).

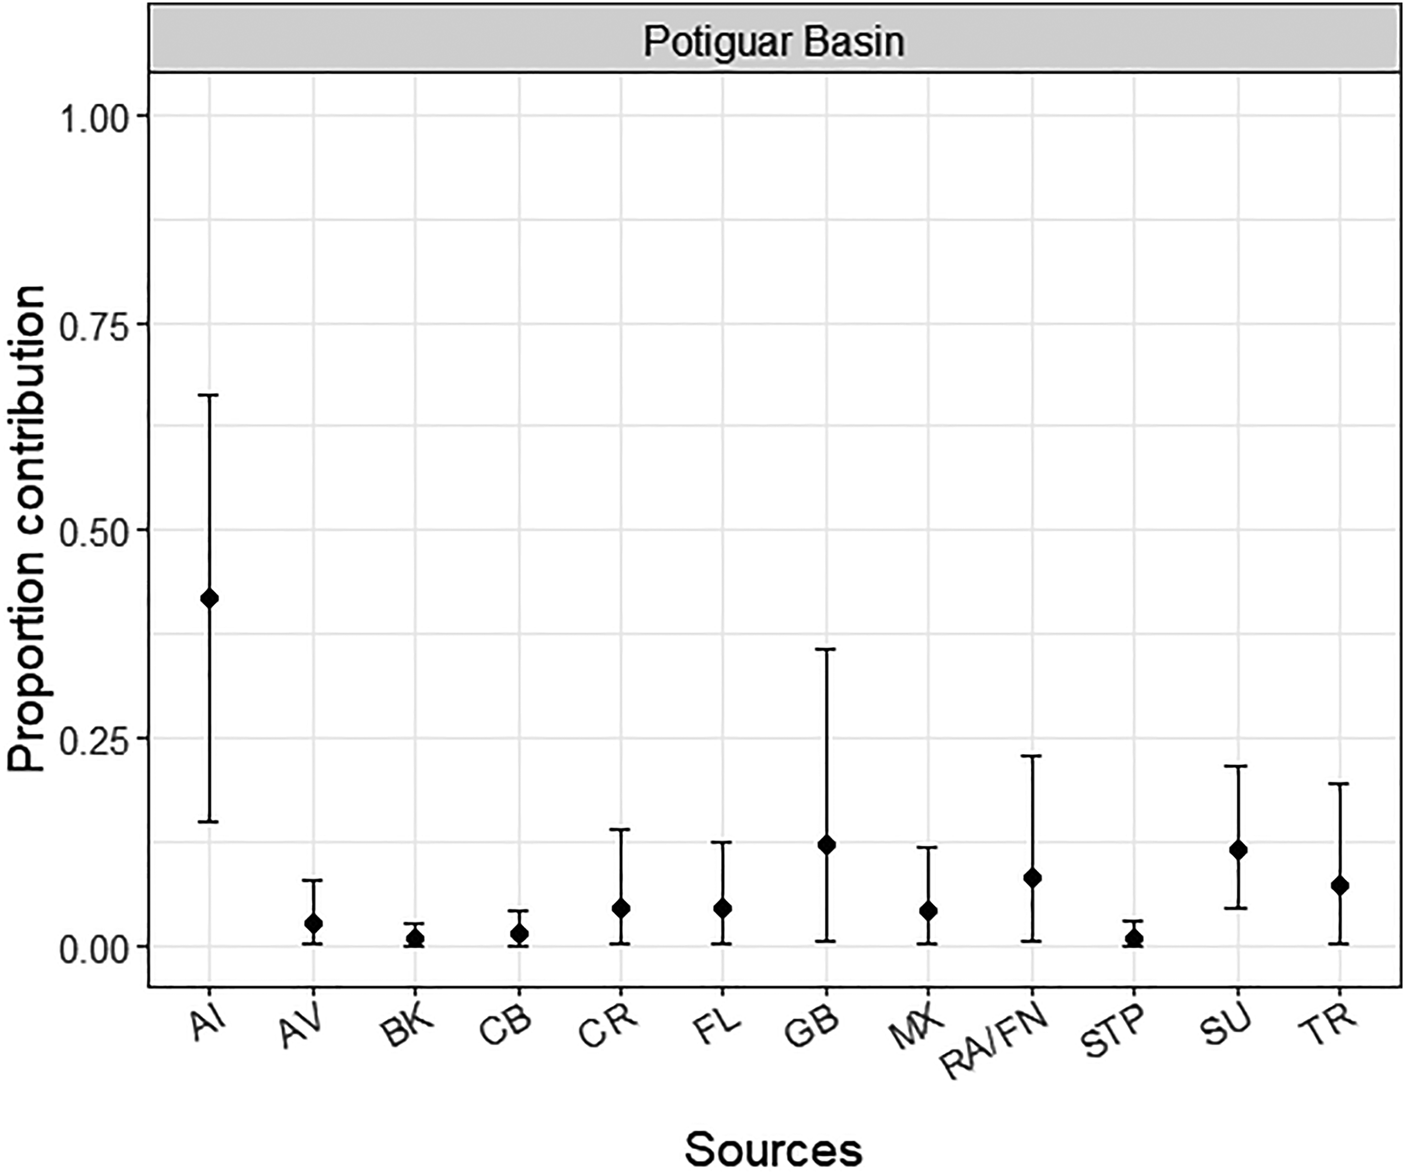
In our MSA (Figure 6) the Ascencion Island presented the major contribution (41.7 ± 13.6%) followed by Guinea Bissau (12.1 ± 9.3%) and Surinam (11.7 ± 4.5%). Atol das Rocas/Fernando de Noronha and Trindade Island also presented a small contribution (8.2 ± 6% and 7.4 ± 5.3%, respectively). All other regions presented contributions of less than 5%.
Estimated contribution of Atlantic C. mydas rookeries to the Potiguar Basin foraging ground, based on Bayesian Markov Chain Monte Carlo MSA. Mean values shown with 2.5 and 97.5% values indicate the upper and lower bounds of the 95% credibility interval. AI, Ascencion Island; AV, Aves Island; BK, Bioko; CB, Cuba; CR, Costa Rica; FL, Florida/USA; GB, Guinea Bissau; MX, Mexico; RA/FN, Atol das Rocas/Fernando de Noronha; STP, São Tomé and Principe; SU, Surinam; TR, Trindade Island.

Discussion
Juvenile green turtles from Potiguar Basin
The high prevalence of stranded juvenile green turtles along the northeastern Brazilian coast, particularly within the 30–59.9 cm size class, underscores the region's critical role as a foraging habitat. This size range suggests a potential shift in diet and habitat preference as individuals transition from the oceanic to the neritic environment, focusing on coastal areas, particularly in the Potiguar Basin. In this region, these turtles predominantly adopt an herbivorous diet, primarily consuming macroalgae and seagrasses, a feeding pattern that persists into adulthood (Bjorndal and Bolten, Reference Bjorndal and Bolten1988; Bjorndal, Reference Bjorndal, Lutz and Musick1997; Brand-Gardner et al., Reference Brand-Gardner, Lanyon and Limpus1999; Arthur et al., Reference Arthur, Boyle and Limpus2008; Lenz, Reference Lenz2013; Farias et al., Reference Farias, Ventura, Silva, Cavalcante, Rossi, Gavilan, Santana and Amaral2023).
This region has emerged as a significant foraging and feeding ground for green turtles, with juveniles constituting a substantial portion of the population (Farias et al., Reference Farias, Alencar, Bomfim, Fragoso, Rossi, Moura, Gavilan and Silva2019). Unfortunately, the species’ coastal feeding habits have rendered it particularly vulnerable to human impacts, especially uncontrolled artisanal fishing prevalent in the Potiguar Basin (Gallo et al., Reference Gallo, Macedo, Giffoni, Becker and Barata2000; Attademo, Reference Attademo2007; Sales et al., Reference Sales, Giffoni and Barata2008; Farias et al., Reference Farias, Alencar, Bomfim, Fragoso, Rossi, Moura, Gavilan and Silva2019; Bomfim et al., Reference Bomfim, Farias, Silva, Rossi, Santana and Pontes2022). This anthropogenic pressure is directly reflected in the high number of stranded turtles recorded in this study, with 97.5% of cases resulting in mortality in 2019.
The observed higher proportion of females in the Potiguar Basin aligns with global trends for green turtles (Hays et al., Reference Hays, Mazaris and Schofield2014; Almeida et al., Reference Almeida, Santos and Mott2021). Temperature-dependent sex determination, with warmer temperatures producing more females (Hamann et al., Reference Hamann, Fuentes, Ban, Mocellin, Wyneken, Lohmann and Musik2013), combined with rising global temperatures, poses a significant threat to population viability through skewed sex ratios (Harnik et al., Reference Harnik, Lotze, Anderson, Finkel, Finnegan, Lindberg, Liow, Lockwood, McClain, McGuire, O'Dea, Pandolfi, Simpson and Tittensor2012; Laloe et al., Reference Laloe, Esteban, Berkel and Hays2016).
Haplotypic composition of the green turtles from the Potiguar Basin
Previous studies have demonstrated the philopatric behaviour of C. mydas and the heterogeneous composition of sea turtle feeding grounds, characterized by mixed stocks of multiple haplotypes (Lahanas et al., Reference Lahanas, Miyamoto, Bjordnal and Bolten1994; Encalada et al., Reference Encalada, Lahanas, Bjorndal, Bolten, Miyamoto and Bowens1996; Naro-Maciel et al., Reference Naro-Maciel, Becker, Lima, Marcovaldi and DeSalle2007, Reference Naro-Maciel, Bondioli, Martin, Almeida, Baptistotte, Bellini, Marcovaldi, Santos and Amato2012; Jensen et al., Reference Jensen, Fitzsimmons, Dutton, Wyneken, Lohmann and Musik2013; Jordão et al., Reference Jordão, Bondioli, Guebert, Thoisy and Toledo2015; Almeida et al., Reference Almeida, Santos and Mott2021; Savada et al., Reference Savada, Prosdocimi, Domit and Almeida2021). The Potiguar Basin, as a key foraging area, reflects this pattern through the presence of diverse haplotypes, indicating contributions from different rookeries.
The predominance of the CM-A8 haplotype in the study area aligns with its widespread distribution in Atlantic nesting colonies. Originating from core nesting regions like Guinea-Bissau, Bioko, São Tomé and Príncipe, Ascension Island, Atol das Rocas, and Fernando de Noronha, this haplotype's central position in the haplotype network suggests its ancestral role in Atlantic colonization (Encalada et al., Reference Encalada, Lahanas, Bjorndal, Bolten, Miyamoto and Bowens1996; Formia, Reference Formia2002).
CM-A5 haplotype was the second most frequent, exhibiting a higher occurrence in nesting sites closer to the Caribbean and North Atlantic (Encalada et al., Reference Encalada, Lahanas, Bjorndal, Bolten, Miyamoto and Bowens1996; Formia et al., Reference Formia, Godley, Dontaine and Bruford2006; Shamblin et al., Reference Shamblin, Bjorndal, Bolten, Hillis-Starr, Lundgren, Naro-Maciel and Nairn2012). The Potiguar Basin's CM-A5 frequency of 31% is notably higher than that reported in other Brazilian regions, such as Almofala/CE (24%), Atol das Rocas (27%), Santa Catarina and Rio Grande do Sul (22 and 20%, respectively), and the Paranaguá Estuarine Complex (PEC) (13%) (Naro-Maciel et al., Reference Naro-Maciel, Becker, Lima, Marcovaldi and DeSalle2007, Reference Naro-Maciel, Bondioli, Martin, Almeida, Baptistotte, Bellini, Marcovaldi, Santos and Amato2012; Proietti et al., Reference Proietti, Reisser, Kinas, Kerr, Monteiro, Marins and Secchi2012; Prosdocimi et al., Reference Prosdocimi, Carman, Albareda and Remis2012; Jordão et al., Reference Jordão, Bondioli, Guebert, Thoisy and Toledo2015; Almeida et al., Reference Almeida, Santos and Mott2021; Savada et al., Reference Savada, Prosdocimi, Domit and Almeida2021). This elevated frequency might be attributed to the region's strategic geographic position, on the ‘corner’ of the South American continent, influenced by both Northern and Southern Hemisphere genetic lineages.
Regarding the haplotypes recorded at a lower frequency in the Potiguar Basin (5.1%), the CM-A10 and CM-A9 were primarily associated with southern Brazilian feeding grounds (Avoredo Island, Cassino Beach, Paranaguá Estuarine Complex) (Proietti et al., Reference Proietti, Reisser, Kinas, Kerr, Monteiro, Marins and Secchi2012; Jordão et al., Reference Jordão, Bondioli, Guebert, Thoisy and Toledo2015; Savada et al., Reference Savada, Prosdocimi, Domit and Almeida2021) and potential South Atlantic origins (Bondioli, Reference Bondioli2009).
The rare haplotypes CM-A45 and CM-A6, each representing less than 3% of our sample, provide additional insights into the genetic structure of the population. CM-A45, exclusively described for Ascension Island, has been previously documented in foraging grounds both north (Almofala/CE) (Naro-Maciel et al., Reference Naro-Maciel, Becker, Lima, Marcovaldi and DeSalle2007) and south (Avoredo Island, Cassino Beach) (Proietti et al., Reference Proietti, Reisser, Kinas, Kerr, Monteiro, Marins and Secchi2012) of the Potiguar Basin. CM-A6, linked to Ascension Island and other African nesting sites, further emphasizes the influence of this significant Atlantic breeding colony on the region (Broderick et al., Reference Broderick, Fraunstein, Glen, Hays, Jackson, Pelembe, Ruxton and Godley2006). Such records reinforce the contribution of the second largest colony in the Atlantic, the Ascension Islands, to the foraging area of the Potiguar Basin.
While CM-A3 is more common in northern regions (Almofala/CE, Atol das Rocas) (Naro-Maciel et al., Reference Naro-Maciel, Becker, Lima, Marcovaldi and DeSalle2007, Reference Naro-Maciel, Bondioli, Martin, Almeida, Baptistotte, Bellini, Marcovaldi, Santos and Amato2012), CM-A1, typically associated with the North Atlantic, has a limited presence in the South Atlantic on the Brazilian coast, only in Fernando de Noronha and Atol das Rocas (Naro-Maciel et al., Reference Naro-Maciel, Bondioli, Martin, Almeida, Baptistotte, Bellini, Marcovaldi, Santos and Amato2012) and now in the present study in the Potiguar Basin.
The observed high haplotype and low nucleotide diversity in the Potiguar Basin aligns with patterns documented in other Brazilian foraging grounds (Naro-Maciel et al., Reference Naro-Maciel, Becker, Lima, Marcovaldi and DeSalle2007, Reference Naro-Maciel, Bondioli, Martin, Almeida, Baptistotte, Bellini, Marcovaldi, Santos and Amato2012). This genetic signature is often associated with populations experiencing recent demographic expansion or historical bottlenecks (Formia et al., Reference Formia, Godley, Dontaine and Bruford2006). The haplotype network, characterized by numerous haplotypes separated by few mutational steps and the central role of CM-A8, supports this interpretation. While further demographic analyses are needed to confirm these inferences, the present findings contribute to a broader understanding of the genetic structure of green turtle populations in the Southwestern Atlantic (Formia et al., Reference Formia, Godley, Dontaine and Bruford2006, Reference Formia, Broderick, Glen, Godley, Hays and Bruford2007).
The low genetic structure revealed by Fst analysis aligns with previous studies suggesting a homogenous genetic composition among Brazilian C. mydas foraging grounds, despite minor variations between mixed stocks (Proietti et al., Reference Proietti, Reisser, Kinas, Kerr, Monteiro, Marins and Secchi2012; Savada et al., Reference Savada, Prosdocimi, Domit and Almeida2021). Our findings indicate greater genetic differentiation between northern and southern Brazilian foraging grounds, with Fernando de Noronha and Paranaguá Estuarine Complex exemplifying this pattern. This observation corroborates previous studies (Naro-Maciel et al., Reference Naro-Maciel, Bondioli, Martin, Almeida, Baptistotte, Bellini, Marcovaldi, Santos and Amato2012; Proietti et al., Reference Proietti, Reisser, Kinas, Kerr, Monteiro, Marins and Secchi2012; Savada et al., Reference Savada, Prosdocimi, Domit and Almeida2021) and is further supported by the GAM results linking higher CM-A8 haplotype frequencies to southern latitudes.
The MSA results identified Ascension Island as the primary source population for green turtles within the Potiguar Basin, aligning with previous findings that emphasized its significant contribution to Brazilian foraging grounds (Kouerey Oliwina et al., Reference Kouerey Oliwina, Honarvar, Girard and Casale2020). Guinea-Bissau, Surinam, Atol das Rocas, Fernando de Noronha, and Trindade Island also emerged as notable source populations (Naro-Maciel et al., Reference Naro-Maciel, Becker, Lima, Marcovaldi and DeSalle2007, Reference Naro-Maciel, Bondioli, Martin, Almeida, Baptistotte, Bellini, Marcovaldi, Santos and Amato2012; Proietti et al., Reference Proietti, Reisser, Kinas, Kerr, Monteiro, Marins and Secchi2012; Prosdocimi et al., Reference Prosdocimi, Carman, Albareda and Remis2012; Jordão et al., Reference Jordão, Bondioli, Guebert, Thoisy and Toledo2015; Almeida et al., Reference Almeida, Santos and Mott2021).
While neighbouring feeding grounds (Almofala/CE, Atol das Rocas, Fernando de Noronha) (Naro-Maciel et al., Reference Naro-Maciel, Becker, Lima, Marcovaldi and DeSalle2007, Reference Naro-Maciel, Bondioli, Martin, Almeida, Baptistotte, Bellini, Marcovaldi, Santos and Amato2012) identified Surinam as a secondary source, our analysis indicated Guinea-Bissau in this role. The geographic closest feeding grounds to our site study – Almofala/CE, Atol das Rocas, and Fernando de Noronha – shows Surinam as the second contributor to their feeding ground. This discrepancy may be attributed to methodological differences in MSA implementation, specifically the inclusion of distance between nesting and feeding grounds as a prior in our study (Stahelin et al., Reference Stahelin, Hofman, Qintana-Ascencio, Reusche and Mansfeld2022). The relatively high credibility intervals associated with MSA estimates highlight the complex interplay of factors influencing source population contributions and emphasize the need for further research to refine these estimates.
Conclusion
This study presents the first genetic characterization of green turtles in the Potiguar Basin, a critical foraging area for juveniles. Our findings reveal a complex genetic structure influenced by multiple source populations, with a predominance of the CM-A8 haplotype, likely linked to the region's geographic position. While the Potiguar Basin shares similarities with other Brazilian foraging grounds, subtle genetic differences suggest unique population dynamics. The identification of the Potiguar Basin as an important foraging area for green turtles underscores the need for comprehensive conservation strategies. Future research incorporating a multidisciplinary approach, including studies on natal origins, seasonal movements, and life history stages, is essential to fully understand the complex ecological requirements of this threatened species. By combining genetic data with demographic and ecological information, we can develop effective management plans to protect both foraging and nesting habitats.
Data
The datasets generated during and/or analysed during the current study are available from the corresponding author on reasonable request.
Acknowledgements
We thank the staff of Projeto Cetáceos da Costa Branca – Universidade do Estado do Rio Grande do Norte (PCCB-UERN), the Laboratory of Comparative Pathology of Wild Animals (LAPCOM), of the Faculty of Veterinary Medicine and Animal Science of the University of São Paulo (FMVZ/USP), to the researchers Rafael A. Revorêdo and João Damasceno for their statistical support and the creation of figures and graphs, and Silmara Rossi for her support on revision of the manuscript draft.
Author contributions
All authors contributed to the study conception and design. Material preparation, data collection, and analysis were performed by Daniel Solon Dias de Farias, Aline da Costa Bomfim Ventura, Igor Peres Puertas, Simone Almeida Gavilan, Flávio José de Lima Silva, and Roberta Ramblas Zamana. The first draft of the manuscript was written by Daniel Solon Dias de Farias and Viviane Souza do Amaral and all authors commented on previous versions of the manuscript. All authors read and approved the final manuscript.
Financial support
This work was conducted with data collected from the Potiguar Basin Beach Monitoring Project (PMP-BP), carried out since 2009 by the PCCB-UERN team, through the Licensing Environmental Conditioner conducted by the Instituto Brasileiro do Meio Ambiente e dos Recursos Naturais Renováveis (IBAMA) – Ministry of the Environment for Petrobras Oil and Gas Exploration and Production activities in the Potiguar Basin (ABIO 269/2013, Process: 02022.000050/2013); and Chico Mendes Institute for Biodiversity Conservation (ICMBio) – Ministry of the Environment through the Biodiversity Information and Authorization System (SISBIO13694-6). Viviane Souza do Amaral is the recipient of fellowship by the Conselho Nacional de Desenvolvimento Científico e Tecnológico (CNPq 305163/2020-5) and is part of the universal project Chamada MCTIC/CNPq N° 28/2018 - Universal/Band B.
Competing interests
The authors have no relevant financial or non-financial interests to disclose.