Exotic species can sometimes become more problematic in their introduced range than in their native range due to rapid evolution (e.g., Colautti and Barrett Reference Colautti and Barrett2013; Li et al. Reference Li, She, Zhang and Liao2015; Maron et al. Reference Maron, Vilà, Bommarro, Elmendorf and Beardsley2004; Ridley and Ellstrand Reference Ridley and Ellstrand2010). At the same time, those species provide ideal opportunities to study evolutionary processes on contemporary timescales (Colautti and Lau Reference Colautti and Lau2015; Sax et al. Reference Sax, Stachowicz, Brown, Bruno, Dawson, Gaines, Grosberg, Hastings, Holt, Mayfield, O’Connor and Rice2007). Evolutionary studies of invasive species have often been conducted by comparing the genetic structure of populations living in their native and introduced habitats. These studies can detect the mechanisms of invasion, including hybridization, increasing/decreasing genetic diversity, or multiple introductions (Kolbe et al. Reference Kolbe, Glor, Schettino, Lara, Larson and Losos2004; Lavergne and Molofsky Reference Lavergne and Molofsky2007; Ridley et al. Reference Ridley, Kim and Ellstrand2008).
Management Implications
Identifying the route of invasion is the first and highly valuable step for biosecurity, because it is one of the most rewarding, cost-effective attempts to prevent invasion. Although studies about invasion routes have recently been in demand, few studies of invasion routes were published in a comprehensive way in Japan. Lolium species have been introduced to Japan by two routes, intentional introduction as forage and unintentional introduction as contaminants in grain commodities, and have naturalized along the sandy coasts. Because ryegrasses are an economically important exotic forage in Japan, their potential for invasion should be judged carefully. Our analysis revealed that preadaptation of seaport lineages derived from contaminants facilitated the invasion to coasts where cropland lineages derived from cultivars failed to colonize. Although the deliberate introduction previously seemed to be the major source of invasive Lolium populations in Japan, our results indicated that the relatively minor, unintentional pathway also had the potential to result in the colonization of new habitats and highlighted the importance of considering multiple pathways of invasion for successful weed management. One prevention measure against further introduction of new genotypes into coastal areas could be appropriately timed control of weeds before Lolium species mature in seaport areas.
During invasion, however, alien species must undergo many processes to survive. These include transport, introduction, establishment, and range expansion (Blackburn et al. Reference Blackburn, Pyšek, Bacher, Carlton, Duncan, Jarošík, Wilson and Richardson2011). Because different types of selective pressure and stochastic events are at work, a large proportion of individuals fail to survive, and the demographic and genetic characteristics of populations are inevitably changed (Blackburn et al. Reference Blackburn, Pyšek, Bacher, Carlton, Duncan, Jarošík, Wilson and Richardson2011). Therefore, each invasion process should be considered separately to correctly understand its underlying mechanisms and develop tactics for management (Suarez and Tsutsui Reference Suarez and Tsutsui2008).
The postintroduction process, from first establishment to range expansion, is especially important in ecological and evolutionary terms and can determine the success of an invasion by an alien species (Lambrinos Reference Lambrinos2004; Sakai et al. Reference Sakai, Allendorf, Holt, Lodge, Molofsky, With, Baughman, Cabin, Cohen, Ellstrand, McCauley, O’Neil, Parker, Thompson and Weller2001). Colonizing the new habitat may activate selection pressures that differ from those of the first-established habitat, and different genotypes may be favored (Kawecki and Ebert Reference Kawecki and Ebert2004; Leimu and Fischer Reference Leimu and Fischer2008). Genetic admixture between different lineages of the same species resulting from multiple introductions may stimulate range expansion by heterosis or by enhancing evolutionary potential (Chun et al. Reference Chun, Femanal, Laitung and Bretagnolle2009; Keller and Taylor Reference Keller and Taylor2010). In contrast, alien species may invade new habitats despite a shortage of genetic variation if they have a wide range of phenotypic plasticity (Geng et al. Reference Geng, Pan, Xu, Zhang, Li, Chen, Lu and Song2007), reproductive assurance (Hao et al. Reference Hao, Qiang, Chrobock, van Kleunen and Liu2011), or preadaptation in a particular lineage (Le Roux et al. Reference Le Roux, Wieczorek and Meyer2008).
Keller and Taylor (Reference Keller and Taylor2008) have warned that unrepresentative samplings of dame/lineage may result in apparent adaptive evolution when studying the evolution of invasive species. Because multiple introductions are common during invasion events (Bossdorf et al. Reference Bossdorf, Auge, Lafuma, Rogers, Siemann and Prati2005; Dormontt et al. Reference Dormontt, Lowe and Prentis2011), and different lineages may be introduced to distinct areas or habitats, failing to take their introduction histories into account may result in a misleading picture of their subsequent evolution. However, because of a lack of historical and observational records relating to the time and location of introductions (Estoup and Guillemaud Reference Estoup and Guillemaud2010; Hulme et al. Reference Hulme, Bacher, Kenis, Klotz, Kühn, Minchin, Nentwig, Olenin, Panov, Pergl, Pyšek, Roques, Sol, Solarz and Vilà2008), few studies have directly compared the genetic variation in alien plant populations before and after expansion in a new habitat.
In the present study, the annual outcrossing species Lolium multiflorum L. and Lolium rigidum Gaudin (family Poaceae) were used to investigate selective forces and demographic effects involved in the primary introduction of new species and their subsequent expansion in new habitats. Both species are self-incompatible, and the interspecific cross occurs easily (Naylor Reference Naylor1960; Terrell Reference Terrell1966). The species are native to the Mediterranean region but have spread across the world as both a forage crop and a weed (Humphreys et al. Reference Humphreys, Feuerstein, Vandewalle and Baert2010; Terrell Reference Terrell1968). Because the interfertility and continuous morphological variation within these species has made their taxonomic identification difficult (Bennett Reference Bennett1997; Bennett et al. Reference Bennett, Hayward and Marshall2000; Terrell Reference Terrell1968), we treated them as a Lolium species complex throughout this study.
In Japan, L. multiflorum is widely recognized and listed as a problematic weed (National Institute for Environmental Studies 2015). Unlike most alien plants, Lolium species are known to have been introduced into Japan by two routes. First, they were introduced deliberately as forage or revegetation materials and have become a major agricultural weed in croplands (Figure S1a and b; Asai and Yogo Reference Asai and Yogo2005; Kurokawa et al. Reference Kurokawa, Kobayashi and Ikeda2010). Second, it has recently been recognized that Lolium species were unintentionally introduced as contaminants of trading commodities (Figure S1c and d; Asai et al. Reference Asai, Kurokawa, Shimizu and Enomoto2007; Shimono et al. Reference Shimono, Takiguchi and Konuma2010).
Although Lolium species are usually found in anthropogenically disturbed habitats, including croplands, roadsides, and vacant lands, they are also common in the sandy coasts around Japan (Figure S1e and f). These coastal habitats are quite distinctive and subject to strong winds that create a challenging living environment characterized by sand burial and wind abrasion (Maun Reference Maun1994). Moreover, coastal plants must contend with high soil and airborne salinity, and these stresses restrict the distribution of many species (Barbour Reference Barbour1978; Lowry et al. Reference Lowry, Rockwood and Willis2008). Because they were not introduced directly to these sandy coastal habitats, the Lolium plants must be derived from other locations.
In the present study, we investigated the invasion process of Lolium populations established in sandy coasts, where this invasion occurred via the two introduction routes discussed earlier. By comparing the morphological and genetic microsatellite variation between plants found as secondary invaders on the coast with those in the original areas of introduction, we addressed the following questions: Which lineages and introduction routes are responsible for the expansion into coastal habitats, or does an admixture of different lineages account for this? Have coastal populations undergone a reduction in genetic diversity during their expansion? Do Lolium species show different morphological traits according to habitats?
Materials and Methods
Study Sites and Sampling
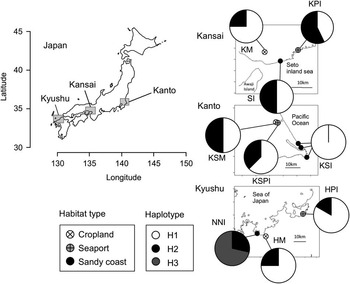
Sampling was conducted in three geographic regions in Japan (Kansai, Kanto, and Kyushu) (Figure 1). In each region, three distinct habitats were chosen: cropland, seaport, and sandy coast. All of the selected seaports (Kobe, Kashima, and Hakata ports) are major international trading ports where more than 100 kt of imported wheat is unloaded every year (Ministry of Land, Infrastructure, Transport and Tourism 2013).
Sampling locations of Lolium species used in this study. Left: locations of three regions in Japan. Right: locations of populations in each region. The small points indicate habitat types. Pie charts shown in the right figure indicate geographic distribution of cpDNA haplotypes of Lolium species based on Table 3. The colors of the chart segments show the haplotype proportion of individuals within a population.

In each habitat, three transects were set and one flowering tiller from each of 10 Lolium plants was collected along each transect at intervals of at least 2 m. The sampled plants grew along the roadside at seaports, on paddy levees in the croplands, and in sandy areas within 200 m of the coastline along sandy coasts. Basically, we set transects parallel to levees, traffic roads, and shorelines, except when the number of plants was small and installation was difficult. In the Kanto region, Lolium plants were distributed sparsely, and the 30 samples in total were collected from three coasts (Figure 1). The distances between populations within each region ranged from 1 to 43 km. All samples were collected in 2014, except those from the Suma coast in the Kansai region, which were collected in 2013. Sample leaf tissue was stored at −80 C for DNA extraction, and the remaining samples were used for morphological measurements.
Measurement of Morphological Characteristics
Ten morphological characteristics were measured from each flowering tiller: rachis length, rachis width, number of spikelets per spike, spikelet width, spikelet length, glume length, number of florets per spikelet, floret length, anther length, and awn density. The measured characteristics were chosen for their usefulness in the identification of Lolium species (Bennett Reference Bennett1997; Terrell Reference Terrell1968). Awn density was graded on a scale of 1 to 3 depending on the number of awns on a spike (1=no awn, 2=some florets have awns, 3=almost all florets have awns).
DNA Extraction and Molecular Analysis
Total DNA was extracted from leaves using a slightly modified cetyl trimethyl ammonium bromide method (Murray and Thompson Reference Murray and Thompson1980) and diluted to a concentration of 10 ng/µl. Nuclear microsatellite and chloroplast DNA (cpDNA) sequence analyses were performed. For nuclear microsatellite DNA analysis, seven loci (LMgSSR 02–05D, 02–11G, 03–04F, 08–12G, 11–06E, 16–04F, and 17–02F; described in Hirata et al. Reference Hirata, Cai, Inoue, Yuyama, Miura, Komatsu, Takamizo and Fujimori2006) were used for genotyping. Polymerase chain reaction (PCR) was performed in a final reaction volume of 8 µl, containing 10 ng of genomic DNA, 0.2 µM fluorescently labeled (Beckman dye D2, D3, and D4) forward primer, 0.2 µM unlabeled reverse primer, and 0.25 U Taq DNA polymerase (New England BioLabs, Ipswich, UK) in a 1× Thermopol reaction buffer. Amplification included an initial denaturation step at 95 C for 30 s followed by 30 cycles of denaturation at 95 C for 15 s, annealing at 60 C for 30 s, and extension at 68 C for 20 s, and then a final extension step at 68 C for 5 min. Because a universal fluorescent Tail A primer (Blacket et al. Reference Blacket, Robin, Good, Lee and Miller2012) was used for loci 11–06E and 17–02F, two-step PCR was conducted for reliable amplification. First, we performed PCR containing 10 ng of genomic DNA and 0.2 µM unlabeled tailed (Tail A) forward primer; then a second PCR reaction was performed using 1 µl of the products from the first PCR and 0.2 µM universal Tail A primer with fluorophore (D2). The remaining reaction mixture and the amplification conditions were identical to those described above, with the exception of the number of cycles that included the annealing step; 15 cycles were used for the first PCR reaction, and 25 cycles were used for the second reaction. Determination of allele sizes in the amplified products was carried out automatically on a CEQ 8000 Genetic Analysis System (Beckman Coulter, Krefeld, Germany) using the internal size standard 400, and then genotyped manually. Some individuals that apparently amplified more than two alleles or none at all were treated as missing data for that particular locus.
For the cpDNA sequencing, we randomly chose seven to eight individuals from each population and used PCR to amplify the two intergenic regions psbA–matK and trnS–trnT, using previously described primers (Demesure et al. Reference Demesure, Sodzi and Petit1995; Yasuda and Shibayama Reference Yasuda and Shibayama2006). The amplification conditions for each reaction included an initial denaturation step at 95 C for 30 s. For trnS–trnT, the initial denaturation step was followed by 28 cycles of denaturation at 95 C for 15 s, annealing at 68 C for 30 s, and extension at 68 C for 1 min, with the annealing temperature decreasing by 1 C per cycle for the first 8 cycles, down to 60 C. For psbA–matK, the initial denaturation step was followed by 35 cycles at 95 C for 15 s, annealing at 68 C for 30 s, and extension at 68 C for 40 s, with the annealing temperature decreasing by 1 C per cycle for the first 10 cycles, down to 58 C. Both reactions included a final extension step at 68 C for 5 min. After amplification, these products were sequenced by the Fasmac DNA sequence service (Fasmac, Kanagawa, Japan).
Data Analysis
To summarize the variation in morphological characteristics, we conducted a principal component analysis (PCA) for the 10 morphological measurements. Morphological differences among habitats and regions were examined using a stepwise multiple regression analysis in which the first and second principal component scores (PC1 and PC2) were treated as dependent variables, and the habitat, region, and interactions were treated as fixed factors. The model with the lowest Akaike information criteria (AIC; Akaike Reference Akaike1973) was selected as the best fit.
The difference by habitat for each morphological characteristic and the PCs (PC1 and PC2) were examined in generalized linear mixed models (GLMMs) using population as a random factor and Tukey’s honestly significant difference (HSD) test for pairwise habitat comparisons. For the two PC axes and all characteristics except the number of florets per spikelet, number of spikelets per spike, and awn density, a GLMM with Gaussian errors (identity link) was used. The number of florets per spikelet and the number of spikelets per spike were analyzed using a GLMM with Poisson errors (logarithmic link). For awn density, the Steel–Dwass test was used instead of Tukey’s HSD test, because it is categorical data. All statistical tests were performed using R v. 3.0.2 (R Development Core Team 2013).
For each microsatellite locus and population, Hardy–Weinberg disequilibrium and linkage disequilibrium between pairs of loci were examined using Genepop on the Web v. 4.2. Null allele frequencies were estimated using CERVUS v. 3.0.7 (Marshall et al. Reference Marshall, Slate, Kruuk and Pemberton1998). Standard genetic statistics were calculated for each population. The number of private alleles (N p), the observed heterozygosity (H o), and the unbiased estimate of the expected heterozygosity (H e) were estimated using GenAlEx v. 6.501 (Peakall and Smouse Reference Peakall and Smouse2012). Allelic richness (A r) and Weir and Cockerham’s (Reference Weir and Cockerham1984) estimators of the inbreeding coefficient (F IS) for each population were estimated using FSTAT v. 2.9.3 (Goudet Reference Goudet2001).
The genetic differentiation of each population was estimated with the global and pairwise fixation index (F ST) using FSTAT. Significant differentiation was tested using the Bonferroni correlation. To assess the genetic variation between habitats and among populations within each region, we performed analysis of molecular variance (AMOVA) using GenAlEx. We also performed AMOVA for populations in each habitat separately. The probabilities of variance components were estimated from 9,999 random permutations. To compare the individual-based genetic structure among habitats and detect potential hybrids, we used a Bayesian approach implemented in Structure v. 2.3.4 (Pritchard et al. Reference Pritchard, Stephens and Donnelly2000) to cluster similar multilocus genotypes, allowing for population admixture and correlated with allelic frequency. The simulation was run with the number of clusters (K) from one to nine, and repeated ten times for each K to confirm the repeatability of the results. Each run comprised a burn-in period of 100,000 iterations, followed by 500,000 Markov-chain Monte Carlo steps. As recommended by Evanno et al. (Reference Evanno, Regnaut and Goudet2005), we calculated the ad hoc statistic ΔK on the basis of the rate of change in the log likelihood of data between consecutive K values. We identified the most likely number of clusters (K) that maximized ΔK.
Sequencing data were aligned using CodonCode Aligner v. 5.1.5 (CodonCode, Dedham, MA). We determined cpDNA haplotypes from nucleotide substitutions and indels from a combined data set including the two regions. All indel size variations at one location were treated as one insertion/deletion event.
Results
Morphological Characteristics
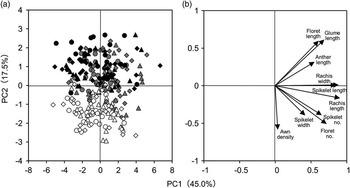
According to the PCA for 10 morphological characteristics, the second principal component axis (PC2) separates cropland populations from the other habitat populations (Figure 2a). PC1 explains 45.0% of the total variation and shows a positive correlation with all traits, suggesting that PC1 is the parameter for plant size. PC2 explains 17.5% of the total variation and shows a positive correlation with glume length, floret length, and anther length, but a negative correlation with awn density, number of florets, number of spikelets, and spikelet width (Figure 2b). Stepwise multiple regression analysis indicated that models including habitat and geographic region as factors without interaction best fit both PCA axes (PC1, AIC=378.28; PC2, AIC=−106.50). Although both habitat and region had a significant effect for those two PCA axes, habitat affected morphological variation more strongly (F=7.30, df=2, P<0.001 for PC1; F=214.82, df=2, P<0.001 for PC2) than did region (F=3.72, df=2, P=0.026 for PC1; F=4.78, df=2, P=0.009 for PC2), especially on the PC2 axis. In PC1, a significant difference (P=0.024) was found only between seaport and cropland populations. In PC2, all pairwise habitat population comparisons were significantly different (P<0.05).
Principal component analysis of 10 morphological characteristics of Lolium species. (a) Distribution of measured samples in the PC1–PC2 score plane. Each symbol indicates a different region (triangle: Kanto; diamond: Kansai; circle: Kyushu), and each color indicates a different habitat (white: cropland; gray: seaport; black: sandy coast). (b) Display of the principal loading score of each of the morphological characteristics along PC1 and PC2.

Considering morphological characteristics separately, no significant difference was found among habitats for rachis length (Table S1). The mean glume length, floret length, and anther length in cropland populations were significantly lower than those in other habitats. Additionally, cropland populations usually had denser awns than other populations. Spikelet length was larger in seaport populations. Spikelet width, the number of spikelets, and the number of florets per spikelet were lowest in sandy coastal populations. The number of florets per spikelet was highest in cropland habitats, but a significant difference was not found between cropland and seaport populations (Table S1).
Microsatellite Genetic Diversity
In total, 269 individuals were genotyped. Overall, no linkage disequilibrium was detected among loci, but a few combinations of loci in almost every population showed some degree of linkage disequilibrium. Almost all loci in all populations were in Hardy–Weinberg disequilibrium. Because the level of Hardy–Weinberg disequilibrium decreased when reassessing samples divided by each transect, disequilibrium was partly due to subpopulation structure. Some null alleles were also found (null allele frequency, 0.05–0.66), especially at locus 17–02F (null allele frequency, 0.66). The other six microsatellite loci were highly polymorphic with a range of 12 to 32 (average, 20.5) alleles per locus. At locus 17–02F, only three alleles were found, and most individuals were homozygous. Because of the allelic distribution at locus 17–02F, we assumed that null alleles occurred widely across all populations. We conducted population genetic analysis both including and excluding locus 17–02F and found similar results. Therefore, we reported the results including all loci in the data analysis.
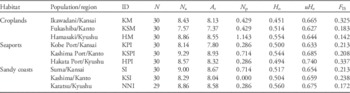
Genetic diversity was consistently high in all populations (Table 1). All populations had high values for expected and observed heterozygosity and for allelic richness. For most statistical evaluations, no consistent tendency was found throughout habitats or regions. F IS values were significantly positive in all populations.
Genetic diversity of three habitat populations of Lolium species.Footnote a

a Abbreviations: N, number of samples; N a, mean number of alleles per locus; A r, mean allelic richness per locus; N p, mean number of private alleles per locus; H o, observed heterozygosity; uH e, unbiased expected heterozygosity; F IS, fixation index.
Population Differentiation
The global genetic differentiation was low, with F ST=0.055. Pairwise F ST values ranged from 0.003 to 0.140 (Table S2). Significant differentiations were detected among all pairwise populations between cropland and other habitat populations and among some other populations (Table S2). AMOVA indicated that 5.0% of the genetic variation could be attributed to differences between habitats, which was slightly greater than that among populations within habitats (4.0%; Table 2). The majority of genetic variation was found within populations (90%). Within each habitat, variation between populations was greatest in seaports (9.0%) and lowest in sandy coasts (1.0%).
Results of hierarchical analysis of molecular variance (AMOVA) partitioning variance among habitats, populations in each habitat, and within a population

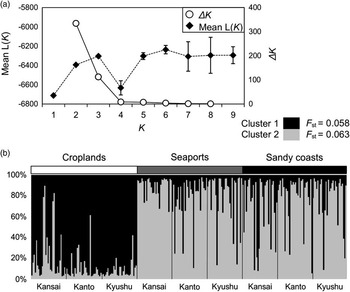
In the Bayesian clustering analysis, the ΔK value was highest when K=2 (ΔK=334.26) (Figure 3a). When K=2, cluster 1 was dominant in cropland populations, whereas cluster 2 was dominant in port and coastal populations regardless of their geographic ranges (Figure 3b). In both seaport and sandy coastal populations, some high-proportion mixes were present. The average percentage of cluster 1 in each population was lower in seaport (10.5% to 22.6%) than in sandy coastal populations (21.1% to 30.0%), although both were much lower than in cropland populations (77.1% to 91.7%).
The result of Bayesian clustering analysis using Structure v. 2.3.4. (a) The logarithm of the probability of the data, mean L(K) (mean likelihood [filled diamond] ± SD) and the second-order rate of change in the probability between successive runs, ΔK (open circle), as a function of K, the number of clusters. (b) The results from Lolium samples used in this study, assuming two population clusters (K=2). Each vertical line represents an individual, and each color represents a cluster. Individuals are grouped by populations of each habitat.

CpDNA Haplotype Diversity and Distributions
The total length of the aligned sequence of the two cpDNA regions was 1,653 bp. This included seven polymorphic sites comprising four substitutions, one indel, and two mononucleotide repeat variations. Excluding mononucleotide repeat variations, only 3 haplotypes were detected among 68 individuals (H1–H3; Table 3).
Polymorphisms in the two cpDNA regions of Lolium species.

The geographic distribution of these three haplotypes is shown in Figure 1. Overall, the composition of haplotypes was similar throughout the regions. The H1 and H2 haplotypes were present in almost all populations, while H3 was detected only in the sandy coastal population (NNI) of the Kyushu region.
Discussion
Defining the Route of Expansion into Sandy Coasts
Morphological and nuclear microsatellite genetic variations of Lolium species were strongly correlated with the different introduction habitats (i.e., seaports and croplands) throughout all regions (Figures 2 and 3). These results strongly suggest that diverse lineages of Lolium were introduced into distinct habitats through different pathways.
Coastal populations were genetically and morphologically similar to seaport populations in all regions (Figures 2 and 3), suggesting that coastal populations originated from seaport populations derived from contaminants in trading grain. This relationship in genetic structure was maintained throughout the sampled locations, regardless of geographical distance between the sandy coasts and other introduced habitats (Figures 1 and 3b). Therefore, isolation by distance cannot explain relatedness between the seaport and sandy coastal populations.
The level of mixing between two clusters was slightly higher in sandy coastal populations than in seaport populations, indicating a moderate amount of admixture during expansion. However, about 70% of the individuals from coastal populations were strongly associated with cluster 2 (containing >80% of cluster 2). Therefore, we concluded that the genetic admixture of the two introduced lineages was not necessary for the expansion of Lolium species into coastal environments.
In contrast to clear differences in Lolium species’ morphology and nuclear microsatellite DNA, cpDNA sequences showed little differentiation among habitats. The different haplotypes were genetically similar, and most populations shared the same haplotypes (Figure 1; Table 3). Kurokawa et al. (Reference Kurokawa, Kobayashi and Ikeda2010) also reported less divergence in the cpDNA than nSSR of Lolium populations in Japan. Because cpDNA is more conserved than nuclear DNA (Wolfe et al. Reference Wolfe, Li and Sharp1987) and nuclear microsatellites are especially variable (Sunnucks Reference Sunnucks2000), the lack of any association between cpDNA sequences and plant location/habitat may suggest a recent genetic differentiation of nuclear microsatellite loci along the species’ introduction pathways. The history of Lolium species for agriculture may also have affected its genetic composition. Many hybridizations have been performed between cultivars and natural populations to develop new cultivars (Humphreys et al. Reference Humphreys, Feuerstein, Vandewalle and Baert2010; Terrell Reference Terrell1966; Yamada et al. Reference Yamada, Forster, Humphreys and Takamizo2005). As a result, the identification of different Lolium species is difficult (Terrell Reference Terrell1968), and this may be the reason why the lineages cannot be separated by cpDNA sequences.
Considered by region, the proportion of haplotypes varies depending on the populations. At the moment, whether these differences are due to a limited number of samples or potential differences is not clear. Moreover, among all the populations, only the NNI coastal population in the Kyushu region was found to contain a unique haplotype (H3) (Figure 1). Because rare haplotypes may not be detected when the sample size is small (i.e., 8 samples per population), an uncommon haplotype in a seaport population could have become a major haplotype in the NNI coastal population as a result of genetic drift.
Comparison of Genetic Diversity before and after Expansion
In the present study, genetic diversity was high throughout all populations (Table 1). The mean expected heterozygosity of Lolium species in this study was similar to that in a previous study conducted in Japan (0.6015) (Kurokawa et al. Reference Kurokawa, Kobayashi and Ikeda2010) and another outside Japan (0.62 to 0.67) (Peter-Schmid et al. Reference Peter-Schmid, Boller and Kölliker2008) using nuclear microsatellite loci.
No significant loss in genetic diversity was observed in sandy coastal populations compared with seaport populations. The allelic richness (A r) and observed mean heterozygosity (H o) in coastal populations were slightly greater than those in seaport populations, except in the Kanto region (Table 1). In the Kanto region, these diversity indices decreased in the coastal population (KSI) compared with the seaport population (KSPI), although the small size of the KSI population may have influenced this result. While these results indicate that there were no severe bottlenecks during the secondary invasion, the lower variation in coastal than in seaport populations found by AMOVA suggests that some alleles in each seaport population were lost by genetic drift during the expansions into the sandy coasts (Table 2). Studies comparing native and introduced populations have demonstrated that genetic diversity is not always reduced on invasion (Genton et al. Reference Genton, Shykoff and Giraud2005; Lavergne and Molofsky Reference Lavergne and Molofsky2007; Shirk et al. Reference Shirk, Hamrick, Zhang and Qiang2014) and can actually increase when there is a high level of genetic variation in the source populations and several independent transportation and release events (Dlugosch and Parker Reference Dlugosch and Parker2008; Lockwood et al. Reference Lockwood, Hoopes and Marchetti2013). Parallel arguments also apply to secondary invasions (Leger et al. Reference Leger, Espeland, Merrill and Meyer2009). Because the results in Structure showed high dissimilarity of sandy coastal populations from cropland populations (Figure 3), it is unlikely that gene flow from cropland to sandy coast occurs frequently. Therefore, we believe that sequential gene flow from seaport populations may mitigate bottlenecks in sandy coastal populations and assist in the colonization of new habitats.
Implications for the Process of Secondary Invasion
According to Dietz and Edwards (Reference Dietz and Edwards2006), alien plants first colonize habitats where preadaptation or propagule pressure (e.g., anthropogenic transport) act as a prominent factor, and thereafter usually invade habitats where species’ traits (e.g., tolerance to environmental stress) are more important. In the case of Lolium species, croplands or roadsides near seaports would be the habitats initially colonized, and this would be followed by expansion into sandy coasts. Only the seaport lineages were successful invaders of these coastal areas. Documentary evidence shows that the introduction of commercial wheat grain into Japan began in the 1940s and became common in the 1960s (Yokoyama Reference Yokoyama2005), while the intentional introduction of Lolium species into croplands started at the beginning of the Meiji era (1868–1912), with the first specimen being collected in 1880 (Shimizu Reference Shimizu2003). Despite cropland Lolium lineages establishing widely inland after being introduced at least 60 yr earlier than the seaport populations, the cropland genotypes have not invaded the sandy coasts. This suggests that the ecological differences between lineages may have affected their ability to become established in coastal environments.
Selective forces from the past, including domestication and naturalization, might explain differences between the two introduced lineages in their capacity for colonization. Lolium cultivars have been used by humans for a long time (Balfourier et al. Reference Balfourier, Imbert and Charmet2000; Terrell Reference Terrell1968), and particular characteristics relating to their palatability and utility as forage, such as high yield, rich nutritional content, digestible leaves, and resilience to grazing, have been fostered agriculturally (Humphreys et al. Reference Humphreys, Feuerstein, Vandewalle and Baert2010; Sampoux et al. Reference Sampoux, Baudouin, Bayle, Béguier, Bourdon, Chosson, Deneufbourg, Galbrun, Ghesquière, Noël, Pietraszek, Tharel and Viguié2011). Thus, human selection of those desirable characteristics in a fodder crop in cropland Lolium populations could have made them less fit to be potential invaders of the harsh sandy coastal environments.
The seaport lineages originate from naturalized weeds growing in agricultural fields abroad. Japan imports 99% of its wheat from the United States, Canada, and Australia (Ministry of Finance, Japan 2014). According to Shimono et al. (Reference Shimono, Shimono, Oguma, Konuma and Tominaga2015), Australian wheat contains greater than 30-fold the quantity of Lolium seeds compared with the same amount of wheat from other countries. Therefore, more seeds derived from Australian wheat fields will spill out around seaports. In addition, following the taxonomy of Terrell (Reference Terrell1968), the morphology of the seaport lineage is similar to that of L. rigidum var. rigidum, whereas the cropland lineage suggested by PCA is more similar to L. multiflorum, although variations in their morphology are continuous. The morphology of the seaport lineages also resembled the Lolium species grown in Australia (Murrumbidgee Catchment Management Authorities, NSW, Australia 2008). In Australia, these Lolium species are becoming one of the most problematic weeds in wheat-dominated agricultural fields (Owen et al. Reference Owen, Martinez and Powles2014), partly because they can grow in harsh environments characterized by high soil-salt concentration or extreme drought (Chauhan et al. Reference Chauhan, Gill and Preston2006; Rengasamy Reference Rengasamy2006). These environments would foster strong abiotic tolerance in Lolium species, and stress-tolerant traits in the seaport lineage could well assist its expansion into the sandy coasts of Japan.
Finally, although the genetic composition of seaport and sandy coastal populations was almost identical (Figure 3), several morphological traits differed significantly between the populations (Table S1). Because microsatellite loci are selectively neutral, these morphological differences probably suggest a rapid transition in traits during expansion. However, the possibility that the observed morphological differences result from phenotypic plasticity caused by environmental differences between the habitats cannot be excluded. Therefore, whether these characteristics directly reflect their ecological functions is not certain. Further study is necessary to conclude whether rapid evolution has taken place during Lolium species’ expansion into sandy coasts.
In summary, we found that the seaport colonizers, not the cropland lineage, appear to be responsible for invading the sandy coasts. These coastal populations could be derived from preadapted Australian L. rigidum weedy biotypes tolerant of drought, sandy soils, and salinity that were imported accidentally as grain contaminants, suggesting the importance of the preadaptation to the past selective forces on invasion to new habitats.
Acknowledgments
We thank Ayako Shimono for technical advice on our microsatellite genetic analysis, Reiichi Miura and members of the Laboratory of Weed Science, Kyoto University, for useful advice and discussion. This study was partly supported by JSPS KAKENHI grant number 24780011 from the Japan Society for the Promotion of Science awarded to Y Shimono.
Supplementary material
For supplementary material referred to in this article, please visit https://doi.org/10.1017/inp.2017.1