Introduction
Public sector innovation and innovation outcomes are crucial for improving the effectiveness of resource utilisation and public service quality and addressing socio-economic problems like population burden, traffic jams, climate change, and income inequality (Torfing and Ansell Reference Torfing and Ansell2017). Innovation grows from a small incremental development (Bugge and Bloch Reference Bugge and Carter2016; Fuglsang Reference Fuglsang2010) to a transformative pattern to change and supplant the process or services (Osborne and Brown Reference Osborne and Louise2011). It is a novel, improved or transformed product or process (or a combination thereof) made available to potential users (Eurostat Reference Eurostat2018). This transformative innovation in the public sector leads to sustainable development, encompassing the optimal use of resources to meet society’s current needs without compromising futuristic essentials (Güney Reference Güney2019). Even sustainable development goals (SDGs) require a vibrant public service for their (goals) fruitful implementation. Moreover, the 231 indicators of SDGs mandate the provision of public goods and services or the enactment of public sector policies that rely on the capacity of the public sector to manage, facilitate, and directly serve. Therefore, public sector innovation and its future-oriented mindset can improve its outcomes to achieve sustainable development or SDGs (UNDP 2020).
In the global age, the public sector’s most significant innovation is to adopt and exploit information and communication technology (ICT) for delivering faster service and applying the ICT approach to the economic, business, and management sectors. Converging trademark applications with company/business operations has become critical in advancing a country’s governmental innovation pursuits (Seip et al. Reference Seip, Carolina, Meindert and Ard-Pieter2018). Notably, mobile or web-based app development for accelerating business activities is also instrumental in ICT innovation emanating from public policy inventiveness. In this regard, recent scholarly investigations attempt to discover how the public sector utilises ICT innovations to handle the socio-technical hurdles (Goh and Arenas Reference Goh and Alvaro2020). Their findings commonly establish that diverse public sector bodies at the country level adopt state-of-the-art IT innovations to accelerate productivity and cross-sectional cooperation and deliver individualistic e-services for respective organisations and people (Benbunan-Fich et al. Reference Benbunan-Fich, Kevin and Kim2020).
The outcome of public sector innovation depends on the policy decisions of the government’s relevant ministries and agencies they implement for public goods (Hollanders et al. Reference Hollanders, Arundel, Buligescu, Peter, Roman, Simmonds and Es-Sadki2013). In this case, “push, nurture, and facilitate” are the three types of global innovation schemes that come into force within the public policy framework of the government. More specifically, the public sector’s spending on clean or green energy innovation is recently required to protect the natural environment for sustainable development. In this regard, the public sector takes the initiative to widen international cooperation for energy innovation (e.g. renewable energy generation and electrification expansion) in developing renovated and modern energy systems for sustainable development (IRENA 2018).
The public sector innovation strategies, policies, and their implementations largely depend on governance parameters as this issue exerts a significant influence on the operation of innovation outcomes of the public sector. Although the public sector (itself) is the regulatory authority to handle the governance phenomenon, this sector suffers from detrimental effects due to its poor institutional mechanism and quality. Thus, governance issues, including people’s voice, governmental accountability, stable political atmosphere, effective government, the rule of law, regulatory quality, and corruption, constrain the innovation agenda of the public sector (Poniatowicz et al. Reference Poniatowicz, Dziemianowicz and Kargol-Wasilu2020). More importantly, the genesis of the UN’s SDGs is mainly the outcome of the modernisation of innovation governance to handle the intricacy of technology usage concerning its security, integrity, and standards that the current governance systems strive to address (WEF 2019). But sometimes, the stream of modernisation movement renders challenges for contemporary governance, mainly its regulatory functions. Besides, the governance matter also faces difficulty keeping up with the expediting flow of innovations. Overall, public sector regulations often become a hurdle to the commercialisation of positive thinking in supporting the proper application of innovative technologies (Soeteman-Hernández et al. Reference Soeteman-Hernández, Sutcliffe, Sluijters, van Geuns, Noorlander and Sips2021).
As a newly graduated developing country in South Asia, Bangladesh’s public sector is more prone to adopting an innovative approach for its (public sector) internal expedition and external outcome to continue the impressive growth trajectory. As a result, this economy has witnessed a more than 6% growth rate over the previous decade (Islam et al. Reference Islam, Islam, Ahmed and Rumana2021; Islam and Islam Reference Islam and Islam2021b). As part of the public sector innovation outcome, Bangladesh adopted a medium-term budget framework for sustainable resource utilisation and financial accountability, mobile financial services and e-commerce for proper market function, online trademark application mechanisms for magnetising businesses and entrepreneurship and digitisation process in the manufacturing sector for promoting international trade (Abrar, Reference Abrar2020). Thus, these innovation schemes accelerate technology diffusion for easier and faster services. Recently, public sector innovation in this country has strengthened renewable energy use for environmental safety (Alińska et al. Reference Alińska, Beata and Aneta2018). For example, Bangladesh started 42 renewable energy projects under relevant public agencies. Notably, this economy has successfully implemented the solar home system (SHS) approach across its different parts (Hossain Reference Hossain2018). Finally, Bangladesh’s GOV indicators – corruption, the rule of law, bureaucratic quality – depending on the public sector’s performance (Arundel et al. Reference Arundel, Carter and Barry2019; Torfing and Ansell Reference Torfing and Ansell2017) have become instrumental in keeping pace in economic as well as sustainable development.
This research examines how the public sector innovation outcomes, including trademark innovation, ICT development, renewable energy and governance, promote sustainable development in Bangladesh using time series data from 1980 to 2019. To this end, this study uses the dynamic autoregressive distributed lag (DARDL) simulation approach (Jordan and Philips Reference Jordan and Philips2018) to investigate the co-integrating relationship among the variables with the counterfactual shocks to independent variables and their (shocks) impacts on the dependent variable. Besides, this research also attempts to uncover the pointwise marginal effects of the independent variables on the dependent variable using the Kernel-based regularised least square (KRLS) machine learning algorithm approach (Hainmueller and Hazlett Reference Hainmueller and Chad2014) for robust findings in the context of Bangladesh.
The contribution of this study to the existing literature is manifold. First, this study utilises the adjusted net savings as a percentage of gross national income (GNI) as the proxy of sustainable development motivated by Güney (Reference Güney2019), who stated that adjusted net savings are free from inequality deviated from the conventional GDP growth. Furthermore, Stiglitz (Reference Stiglitz2015) developed the rising tide hypothesis that corroborates this inequality phenomenon in traditional income growth. From this point of view, this is the first study that includes the adjusted net savings proxied by sustainable development to explore this development factor’s response to the public sector innovation outcomes in the context of Bangladesh. Moreover, this study highlights economic parameters’ (adjusted net savings) sustainability essence promoted by the public sector’s innovation outcomes, including trademark innovation, renewable energy, ICT, and GOV, which is a fresh insight into the prevailing pieces of the sustainability literature. Second, deviating from the previous studies, this research considers trademark innovation, ICT, renewable energy and GOV factors as the public sector innovation outcomes that have a significant role in fostering sustainable development. Third, this study also regards the GOV phenomenon as the outcome of the public sector that influences sustainable development, which is also scanty in the existing works of literature. Fourth, from the methodological standpoint, this study utilises the DARDL simulation approach to check the short-run and long-run relationships between public sector innovation outcomes and sustainable development. Our analysis also employs the DARDL-based counterfactual shock to the public sector innovation outcomes (independent variables) and their effects on sustainable development (dependent variable). More importantly, this research uses the KRLS machine learning algorithm to detect the pointwise marginal impacts of the public sector innovation outcomes on sustainable development in Bangladesh. Earlier studies hardly utilised these two robust econometric techniques together for the same purpose. Finally, this is the maiden study in the case of Bangladesh to investigate the dynamic association between public sector innovation outcomes and sustainable development using a quantified model approach from 1980 to 2019.
The findings from the up-to-date methodological techniques establish the significantly positive role of the public sector innovation outcomes, including trademark innovation, ICT and renewable energy, in sustainable development. At the same time, GOV encounters a heterogeneous impact on this development phenomenon. Therefore, this study’s findings can shed light on the policymaking domain of Bangladesh concerning the performance of the public sector in the country’s journey to sustainable development. Moreover, these findings can also help Bangladesh’s policymakers to formulate pragmatic policies to materialise the SDGs by 2030 by strengthening the innovation-stimulating dynamism of the public sector.
Review of literature
Public sector innovation is reflected in a country’s development trajectory through its outcomes. As a public sector innovation outcome, trademark innovation promotes economic development by creating a brand value of the commodity that allures consumers to purchase. Usually, consumers’ query about the trademark is closely associated with “who made this product” (Kiser Reference Kiser2017). Trademark-laden goodwill spurs both production growth and environmental sustainability or sustainable development. Chon (Reference Chon and Rimmer2018) argued that trademark goodwill is a key to establishing an interactive public function and plays a crucial role as public goods for cross-border trade of environmentally sustainable goods and services. Moreover, trademarks or brand values determine the distinguished entity of goods and services in the business process (Greer Reference Greer1979).
In the age of digitisation, the trademark has rapidly been an essential element for businesses to determine brand and reputation. It increases the asset value to the customers and tourists, enhancing income, and economic growth (Landes and Posner Reference Landes and Posner1987). Moulin and Boniface (Reference Moulin and Priscilla2001) and Stathopoulou et al. (Reference Stathopoulou, Demetrios and Dimitris2004) found that cultural tourism and the trademark potential for capitalisation stimulate rural innovation development. In the context of Romania, Stefan et al. (Reference Stefan, Vasile, Popa, Cristea, Bunduchi, Sigmirean and Ciucan-Rus2021) found a significant contribution of trademark potential and cultural tourism that accelerate innovative local hub progress. Besides, some researchers, such as Khan et al. (Reference Khan, Sisi and Siqun2019); Dechezleprêtre et al. (Reference Dechezleprêtre, Ralf, Samuela and Fouquet2019); Burchart-Korol et al. (Reference Burchart-Korol, Magdalena and Kruczek2016); Jordaan et al. (Reference Jordaan, Romo-Rabago, McLeary, Reidy, Nazari and Herremans2017), and Lee and Min (Reference Lee and Byung2015), considered trademark as the technology innovation to investigate its role in the sustainable environment or environmental quality in developing countries. These researchers found a negative effect of technology innovation (trademark) on carbon emissions; hence, the trademark helps reduce environmental degradation to keep up environmental sustainability or sustainable development. Khan et al. (Reference Khan, Sisi and Siqun2019) and Islam et al. (Reference Islam and Islam2021a) also explored trademark innovation’s significantly positive influence on sustainable environment or development in Pakistan and Bangladesh, respectively.
The significant innovation outcome of the public sector is highly concerned with the employment of ICT in the social, economic, business, and management sectors. The view of ICT concerning sustainable development has a three-pillar approach, including “ICT impacts; the claim of human, social, and ecological compatibility of ICT and the plain use of ICT for development” (Hilty and Hercheui Reference Hilty, Magda, Berleur, Hercheui and Hilty2010). Suryawanshi and Narkhede (Reference Suryawanshi and Narkhede2015) studied how green ICT use impacts the sustainable education system and found some obstacles to utilising green ICT that require policymakers’ intervention. Utilising the generalised method of moment, Latif et al. (Reference Latif2017) analysed the role of ICT in the sustainable development of South Asian economies during 2005–2015. The study output identified the favourable contribution of ICT to spur environmentally sustainable development in this region.
The study by Kendall & Dearden (Reference Kendall and Dearden2020) adopted an approach to co-design ICT for sustainable development, meaning resilience, adaptability, and autonomy. Then, this study also drew an ongoing participatory project to narrate how co-design projects can be outlined in addition to political preferences to stimulate sustainable development. Paul and Uhomoibhi (Reference Paul and James2012) examined the possible benefits of solar power generation for ICT for attaining sustainable development in emerging countries. The study findings explored a potential challenge in using ICT for solar-based energy generation schemes. This is because of the lack of qualified solar technicians and people’s knowledge about solar power plant implementation in these emerging countries. Kostoska and Kocarev (Reference Kostoska and Ljupco2019) developed a novel ICT framework of three modules, including data, sustainability, and GOV modules, to quest for these modules’ impacts on sustainable development. The study results found that this framework recognises long and short-run SDGs and permits horizontal and vertical connections among stakeholders and their roles in the ruling structures executed at functional, joint, and constitutional levels. Using the dataset of 80 countries and a Seemingly Unrelated Regression Estimation method, Jayaprakash and Pillai (Reference Jayaprakash and Pillai2021) attempted to explore the nexus between ICT and the three dimensions of sustainable development. The mediation analysis-based findings depict that ICT exerts a significantly positive influence on the sustainable development of these countries.
Public sector organisations meet up diverse needs by innovatively providing services. The innovative approach to the public sector harnesses renewable energy resources to provide cleaner, affordable, and more factual technology to the people so that countries can avoid fossil fuels and the energy crisis. Besides, the innovation strategy of a government can ultimately save the country from environmental decay caused by soil and coal depletions (Agolla and Lill Reference Agolla and Van Lill2013; Juma and Yee-Cheong Reference Juma and Lee2005). So, renewable energy for ecological sustainability – a significant criterion of sustainable development – has become a powerful instrument of the public sector innovation agenda.
Some qualitative studies, including Bugaje (Reference Bugaje2006) on Africa, Comakli et al. (Reference Comakli, Mehmet and Bayram2008) on Turkey, Sathaye et al. (Reference Sathaye, Lucon, Rahman, Christensen, Denton, Fujino, Heath, Mirza, Rudnick, Schlaepfer and Shmakin2011) and Mondol and Koumpetsos (Reference Mondol and Nikos2013) on Greece, Ahmed et al. (Reference Ahmed, Tasbirul, Karim and Karim2014) on Bangladesh, Buonocore et al. (Reference Buonocore, Choma, Villavicencio, Spengler, Koehler, Evans, Lelieveld, Klop and Sanchez-Pina2019), Lee (Reference Lee and Leal Filho2019), and Østergaard et al. (Reference Østergaard, Duic, Noorollahi, Mikulcic and Kalogirou2020) on different developing and developed countries, investigated the influence of renewable energy sources on sustainable development. The most recent study by Gunnarsdóttir et al. (Reference Gunnarsdóttir, Brynhildur, Worrell and Sigurbjörg2020) explored 57 indicators of sustainable energy development for different economies. From the quantitative perspective, Güney (Reference Güney2019) aggregately employed renewable energy, nonrenewable energy and sustainable development variables to investigate the effects of renewable and nonrenewable energies on sustainable development in the context of 73 developing and 40 advanced countries from 1990 to 2014. This study found a significantly positive influence of renewable and nonrenewable energies on sustainable development in developing and developed economies.
Generally, GOV seems to be an outer phenomenon deviating from the spectrum of the public sector. However, in another way, this is the capacity of the public sector (government) to frame and implement rules and provide delivery services, whether the government is democratic or not (Fukuyama, Reference Fukuyama2013; Islam, Reference Islam2019). Even the GOV mechanism of the public sector plays a pivotal role in resource mobilisation and utilisation, the critical prerequisites of sustainable development. It also underscores that the resource management process depends on the performance of authorised public institutions charged with implementing policies under their jurisdictional and cultural structures (Canh et al., Reference Canh, Christophe and Su2019). Hostile administrators or weak institutional frameworks are often responsible for shifting from productive to unproductive resources through rent-seeking practices (Iqbal and Daly, Reference Iqbal and Vince2014).
The role of GOV in the sustainable development of diverse economies is investigated by many researchers from theoretical perspectives (Jordan, Reference Jordan2008; Kemp et al., Reference Kemp, Parto and Gibson2005; Mc Lennan and Ngoma, Reference Mc Lennan and Wendy2004; Meadowcroft, Reference Meadowcroft2007; Monkelbaan, Reference Monkelbaan2019; van Zeijl-Rozema et al., Reference Van Zeijl-Rozema, Cörvers, Kemp and Martens2008). Specifically, Mombeuil (Reference Mombeuil2020) scrutinised the influence of GOV mechanism as institutional quality on UN SDGs in various countries and found its (GOV) mixed effects. Van Zanten and Van Tulder (Reference Van, Jan and Rob2021) performed a systematic review of 876 studies that appeared in different journals from 2005 to 2019 to examine the relationship between individual economic performance, sustainable development, and SDGs. This systematic review mainly depicts that research on industrial, agricultural, and manufacturing activities is found to have adverse effects on environmental sustainability. In contrast, studies on service-related activities underscore social and economic contributions. Most economic functions are assumed to positively affect innovation (SDG 9), infrastructure, and industrialisation. Abhayawansa et al. (Reference Abhayawansa, Carol and Cristina2021) aimed to construct a theory concerning the national government’s role in creating value for society and the economy by adopting the approach to the UN’s SDGs in the context of Australia. The study findings divulged the significance of openness and the participation of stakeholders in the public sector’s accountability mechanism. They emphasised involving all segments of society, including civil society, businesses, and investors, in developing critical coordination with the office of the Prime Minister and Cabinet.
The literature above underscores that public sector innovation outcomes, such as trademark innovation, ICT, renewable energy, and GOV, significantly influence sustainable development. However, previous researchers separately utilised all these outcomes of public sector innovation in their studies and hardly considered these phenomena as the outcome of the public sector. In addition, no previous research considered the GOV phenomenon as a public sector innovation. Thus, our study deviates from the earlier studies in adding value to the existing works of the policy-relevant literature.
Theoretical and empirical methods
Theoretical underpinning
The theoretical background of this study encompasses the public sector innovation process and the hypothesised association between public sector innovation outcomes, i.e. trademark innovation, renewable energy consumption, ICT and GOV, and sustainable development.
Public sector innovation process
Innovation is generally an assumption of a novel idea and product associated with the outcome of an organisation or entity. Innovation shows a better circumstance than an organisation’s previous processes or products. Besides, it also means a substantial change in the activities and outputs of an institution compared to earlier arrangements. Moreover, the Oslo Manual’s conceptualisation of public sector innovation includes the whole array of innovations covering a wide-ranging scenario of outcomes (Arundel et al. Reference Arundel, Carter and Barry2019).
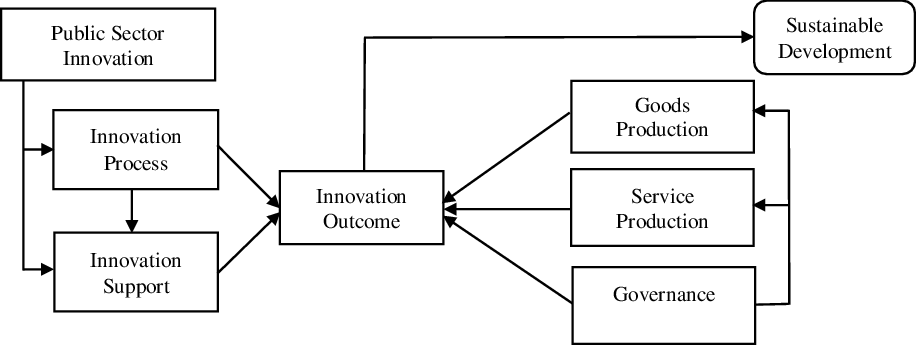
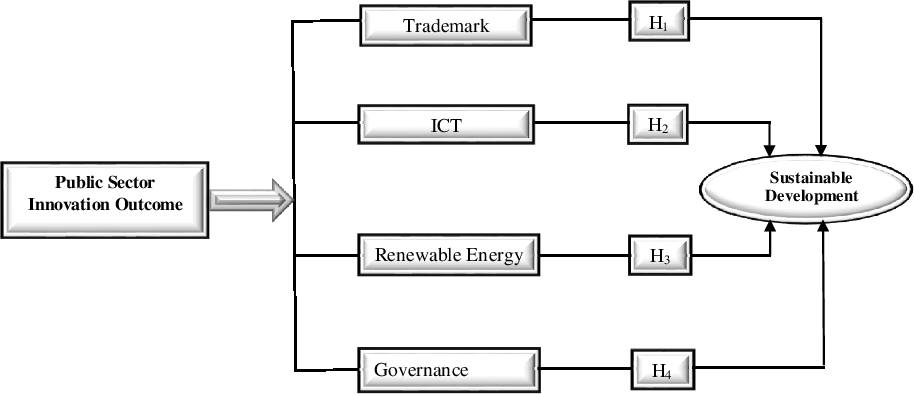
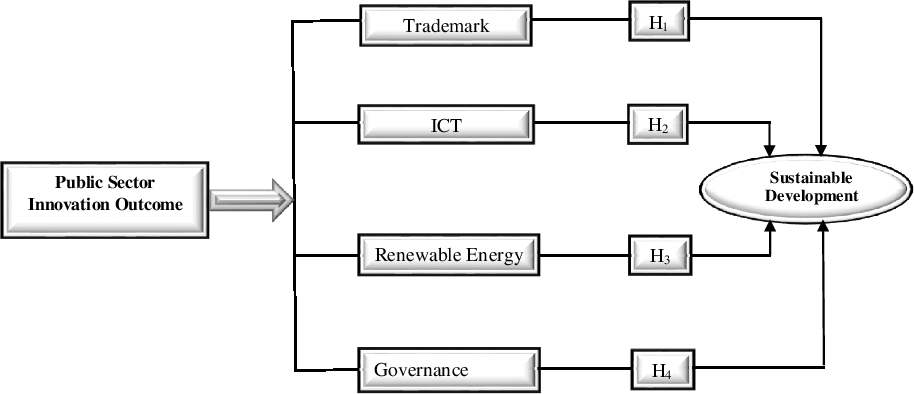
Public sector innovation is of three principles: process, support, and outcome. An innovation process is an approach to innovation in development; innovation support is the measures taken by an organisation to sustain its innovativeness or produce effects; and innovation outcome is an actual attempt to provide the goods and service productions (Nählinder and Eriksson Reference Nählinder and Anna2019). In terms of the innovation process, support, and outcome, GOV becomes a catalyst for succeeding public sector’s goals. However, on the other hand, GOV is also the outcome of public sector innovation. In this regard, Briggs (Reference Briggs2007) opined that GOV in the public sector means “the set of responsibilities, practices, policies, and procedures, exercised by an agency’s executive, to provide strategic direction, ensure objectives achieved, manage risks, and use resources responsibly and with accountability.” Moreover, public sector innovation is a developmental spectrum of goods and services delivery, considering GOV issues in its (public sector) entire innovation process, support, and outcome that promotes sustainable development. Hence, the public sector innovation-led sustainable development (Figure 1) sketched out is as follows:
Public sector innovation-driven sustainable development.
Sources: Author’s modified framework emanated from the ideas of Briggs (Reference Briggs2007); Nählinder and Eriksson (Reference Nählinder and Anna2019) and Arundel et al. (Reference Arundel, Carter and Barry2019).
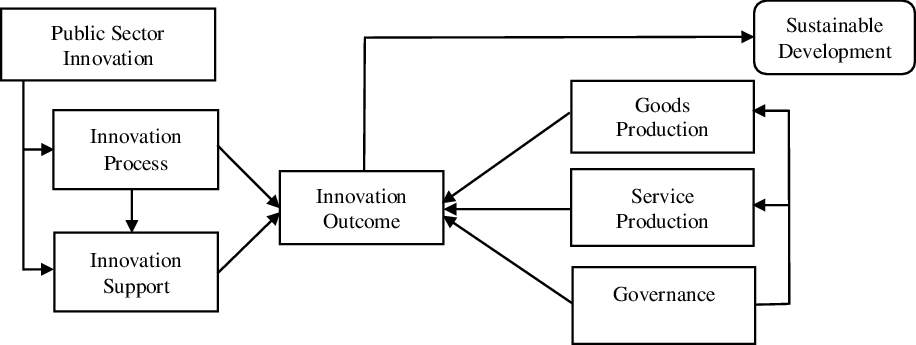
Public sector innovation’s value addition or omission relates to this sector’s outcome metrics. More specifically, the value added is determined by changes in the production process or the potential (subjective and objective) of services provided by this sector in its intervention area. Moreover, users consider the public sector innovation outcome vibrant while observing “simpler administrative processes, faster delivery of services, improved user experience or access to information and products, and improvements to service quality” (Arundeld et al. Reference Arundel, Carter and Barry2019).
Hypothesised relationship between public sector innovation outcomes and sustainable development
The public sector innovation-driven sustainable development is an outcome of the bundle of phenomenal interaction. This interface mainly depends on the public sector’s pushing capacity to deal with the country’s business model, making them service-oriented to serve the people’s interests. Specifically, the public policy mechanism helps develop a commercial practice in which entrepreneurs provide people with quality products, thereby creating brand value or trademarks of the respective business firms. In this aspect, Kiser (Reference Kiser2017) opined that trademark innovation elevates economic expansion by creating a brand value for the goods, influencing consumers’ buying intentions. Besides, the firms that produce organic or ecologically sustainable goods help achieve their brand image to the customers. Conscious consumers’ inclination to purchase environment-friendly goods is the product of the public sector’s interaction process with the public through propagation and regulations. This public policy procedure promotes cross-border trade of environmentally sustainable goods and services. The entity of goods and services and their proliferation mostly rely on the trademark they achieve in their business operation (Chon Reference Chon and Rimmer2018; Greer Reference Greer1979). Thus, we formulate our hypothesis as follows:
H1: Trademark innovation promotes sustainable development.
In recent years, ICT has heightened human development in all spheres of life. The three-pillar approach to ICT concerning development includes human, social, and ecological compatibility of ICT that comprehensively accelerates the way to sustainable development (Hilty and Hercheui Reference Hilty, Magda, Berleur, Hercheui and Hilty2010). The central ICT management process for societal development is public policy-oriented, which helps facilitate private entrepreneurs and other ICT users from the centre to grassroots levels. Private firms and other enterprises enjoy the fruits of ICT due to public policy decision-related results. However, even green ICT adoption for native and foreign companies depends on the respective governments’ policies (Suryawanshi and Narkhede Reference Suryawanshi and Narkhede2015). Besides, governmental ICT usage makes the sustainable development process resilient, adaptive and autonomous within a state’s co-benefitting framework where government and the public are the key participants in the developmental process (Kendall and Dearden, Reference Kendall and Dearden2020). Therefore, we develop the following hypothesis:
H2: ICT innovation promotes sustainable development.
Recently, the sustainability paradigm-laden economic development banks on the renewables or renewable energy usage and proliferation in an economy. The innovative governmental method harnesses renewable energy resources to provide people with cleaner, more accessible, and more authentic technology, avoiding the need for fossil fuels and the energy crisis. Renewable energy-centred technology deployment in the country’s production method spurs sustainable economic development by reducing emissions and climate vulnerability (Islam et al. Reference Islam, Ali, Ceh, Singh, Khan and Dagar2022). Besides, the public sector’s budgeting for renewable technology purchases and project instalments can ease environmental hazards caused mainly by soil and coal depletion (Agolla and Lill Reference Agolla and Van Lill2013; Juma and Yee-Cheong Reference Juma and Lee2005). As a result, renewable energy employment for environmental and economic sustainability has risen to the top of the government’s innovation agenda. Hence, our hypothesis includes the following:
H3: Renewable energy innovation promotes sustainable development.
In terms of cooperation and connectivity, GOV is of three meanings: a) “international cooperation through nonsovereign bodies outside the state system,” b) “GOV as a synonym for public administration, that is, effective implementation of state policy,” and c) “the regulation of social behaviour through networks and other nonhierarchical mechanisms” (Fukuyama Reference Fukuyama2016). In practice, whether the state is democratic or not depends on the ability of the public sector (government) to enforce regulations for proper service delivery (Fukuyama, Reference Fukuyama2013; Islam, Reference Islam2019). The GOV mechanism of the public sector promotes the resource mobilisation process for sustainable development. The public sector’s regulatory quality helps determine the policies for sustainable resource distribution (Canh et al. Reference Canh, Christophe and Su2019). The potent GOV connectivity addresses inequalities in resource distribution and externalities or transaction costs to promote sustainable growth (Iqbal and Daly Reference Iqbal and Vince2014). Thus, we formulate the following hypothesis:
H4: GOV promotes sustainable development.
Based on our above four hypotheses, we can develop a hypothesised model to be tested under robust econometric methods as follows:
The abovementioned hypothesised paradigm is suitable for the current setting of Bangladesh. Despite geopolitical and environmental concerns, Bangladesh made significant progress towards the MDGs (Datta and Rabbany Reference Datta and Siamul2016). Bangladesh, like other countries, accepted the SDGs. According to the SDG Index, Bangladesh is better positioned than other South Asian nations (Sachs et al. Reference Sachs, Kroll, Lafortune, Fuller and Woelm2021). The lack of transformation and internalisation in business emerges at the implementation level under the SDGs framework. However, in the case of the trademarks of goods and services, this country has brought about significant improvement in the “upstream” than in the “downstream” business cycle (Khatun et al. Reference Khatun, Bhattacharya, Rahman, Moazzem, Khan, Sabbih and Saadat2020). The critical encumbrance for Bangladesh’s public sector is to deal with natural disasters and climate change with supportive and effective GOV. Instead of it, Bangladesh’s performance is satisfactory so that different global forums appreciate Bangladesh’s climate adaptation and resilience approaches (Rahman Reference Rahman2021). The SDG-12 surpasses anticipations in terms of waste and emissions per capita (Sachs et al. Reference Sachs, Kroll, Lafortune, Fuller and Woelm2021). Renewable energy production and consumption rates rise from rural to urban areas. Besides, Bangladesh’s ICT and digitisation processes appear to escalate in many innovative projects undertaken by governments. Few studies identified bureaucratic complexities in attaining the SDGs, including corruption, partisanship, polarisation, inefficiency, and dominant conduct (Khatun et al. Reference Khatun, Bhattacharya, Rahman, Moazzem, Khan, Sabbih and Saadat2020; Sarker et al. Reference Sarker, Yan, Arifin and Prodhan2017). Therefore, resource mobilisation will be affected by weak institutional capacity, inadequate GOV, and policy incoherence (Sabbih Reference Sabbih2018). Overall, empirical evaluation of institutional attempts to achieve SDG targets has become essential.
Data specifications
This study considers adjusted net savings as the % of GNI (World Bank 2022) proxy for sustainable development (dependent variable). According to the rising tide hypothesis, traditional GDP growth creates inequality by favouring wealthy people (Stiglitz Reference Stiglitz2015). In contrast, adjusted net savings are free of inequality, making it a reasonable measure of long-term sustainability. Besides, the World Bank (1998) described adjusted net savings as a “comprehensive measure of a country’s saving rate after accounting for investments in human capital, depreciation of produced assets, and depletion and degradation of the environment.” Significantly, consumption expenditures related to education, research, and health care facilitate human capital development. Therefore, these expenditures can also be called investments (Arrow et al., Reference Arrow, Dasgupta, Goulder, Daily, Ehrlich, Heal, Levin, Mäler, Schneider, Starrett and Walker2004; Bolt et al., Reference Bolt, Mampite and Michael2002; Hamilton and Clemens, Reference Hamilton and Clemens1999). Therefore, their inclusion is essential for a full-fledged composition of adjusted net savings and, thus, sustainable development.
Some other environmental reasons exist behind considering adjusted net savings as the sustainability parameter. The first is to calculate the cost of global warming. Here, supposing that the average social cost of one ton of carbon is USA$30, estimations of the social cost of carbon dioxide emissions are produced and subtracted from national savings. The second is to examine the consequences of the local environmental cataclysm. Third, the World Bank assesses the health losses from urban air pollution (particulate emissions) and deduces these from national savings. Finally, the fourth modification of the adjusted net savings echoes the investment recovery or the investment in the economy’s productive base, which is connected with environmental factors. In this consideration, the energy sources, minerals, and net forest residuals used for production are not part of the net national savings. In this way, the relevant sources’ rents are calculated and subtracted. Therefore, the environmental and social damages of CO2 emissions are also included in the rectified net savings (Güney Reference Güney2019). Therefore, adjusted net savings are a better measure of sustainable development than GDP.
The public sector innovation outcomes are the independent variables, including trademark innovation, ICT, renewable energy consumption, and GOV. Specifically, trademark innovation is the number of patent applications dropped by residential and nonresidential citizens to the national office of Bangladesh. These are also called international patent applications filed by a national patent office or through the Patent Cooperation Treaty method for sole rights to a creation – an outcome or procedure that delivers a new technological resolution to a problem. A patent secures an innovation for the patent proprietor for 20 years (World Bank 2022).
ICT comprises Bangladesh’s Internet, fixed land phone users, and mobile phone subscriptions. Individuals who have utilised the Internet in the last three months (from any location) are considered Internet users. In addition, we regard the % of users who have access to the computer, mobile phones, personal digital assistants, gaming machines, or digital television, among other Internet devices. The fixed land phone/telephone subscriptions refer to the total number of active analogue fixed telephone lines, voice-over-IP subscriptions, fixed wireless local loop subscriptions, integrated services digital networks (ISDN) voice-channel equivalents, and fixed public payphones. Subscriptions to a public mobile telephone service that uses cellular technology to give access to the public switched telephone network (PSTN) are known as mobile cellular telephone subscriptions. The number of postpaid subscriptions and active prepaid accounts are included in this manifestation (i.e. those used during the last three months). This study transforms these ICT components into a single variable using the principal component analysis (PCA) for estimation. In addition, renewable energy consumption denotes the renewable energy share in Bangladesh’s total final energy usage.
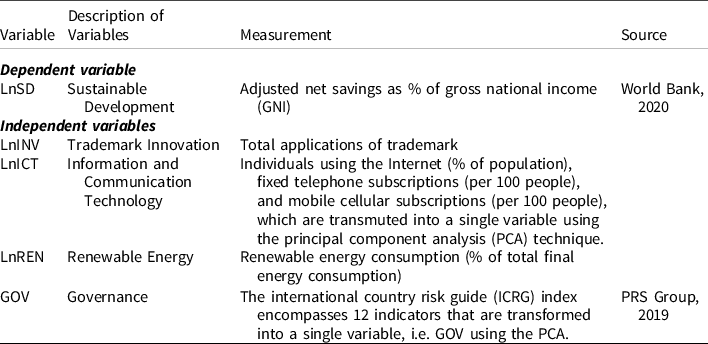
Finally, the governance (GOV) indicator consists of 12 indicators of the international country risk guide, including “government stability (0–12), socio-economic conditions (0–12), investment profile (0–12), internal conflict (0–12), external conflict 0–12), corruption (0–6), military in politics (0–6), religious tensions (0–6), law and order (0–6), ethnic tensions (0–6), democratic accountability (0–6), and Bureaucratic Quality (0–4)” (PRS Group, 2019). This study devises all these indexes as single variables using the PCA technique. The detailed information on variables and their measures is displayed in Table 1.
Descriptions of variables
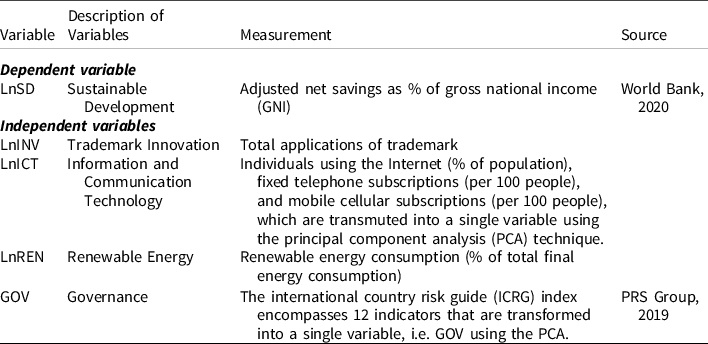
Note: Ln denotes the natural logarithm.
All the data except for GOV are taken in natural logarithmic form for empirical analysis. The more negative PCA computed values of GOV do not require transmuting it into the form of a natural logarithm. The dataset ranges from 1980 to 2018 due to its availability.
Empirical model
Based on empirical evidence and our core hypothesis, this study utilises sustainable development as the dependent variable, and the public sector innovation outcomes are the independent variables. The initial empirical model developed to notice the influence of the public sector innovation outcomes on sustainable development is delineated as follows:
 $${\rm{SD}} = f\left( {{\rm{TDK}},{\rm{ICT}},{\rm{REN}},{\rm{GOV}}} \right)$$
where SD is sustainable development; TDK is trademark innovation; ICT is information and communication technology; REN is renewable energy consumption, and GOV is governance.
Empirical procedure
The empirical procedure of this study includes the details of the pre-estimation technique, the ARDL and DARDL-based co-integration procedures, and the KRLS-based machine learning algorithm approach.
Pre-estimation technique
It is substantial to choose suitable methods for the study’s model and execute several pretests to make estimation consistent and authentic for policy implications. Therefore, as the necessary pretest technique, this study implements two unit root tests – ADF (Augmented Dickey–Fuller) and PP (Phillips–Perron) to check whether the data belongs to the stationarity problem.
ARDL co-integration test using bounds testing procedure
Confirming co-integrating association among the variables requires the ARDL-based bounds test. The measured F-statistic value at the 5% significance level assures the long-term co-integrating association between the variables. On the other hand, the calculated F-statistic value above the critical value of the upper bound ascertains the null hypothesis of no co-integrating linkage among the variables (Pesaran, Shin, and Smith Reference Pesaran, Shin and Smith2001). Now, we can write the following equation:
 $${H_0} = {\varphi _1} = {\varphi _2} = {\varphi _3} = {\varphi _4} = {\varphi _5} = 0$$
 $${H_1} = {\varphi _1} \ne {\varphi _2} \ne {\varphi _3} \ne {\varphi _4} \ne {\varphi _5} \ne 0$$
The bound testing equation for Model 1 and Model 2 can be specified in the following way:
 $$\matrix{
{\Delta LnS{D_t} = {\alpha _0} + {\varphi _1}LnS{D_{t - i}} + {\varphi _2}LnTD{K_{t - i}} + {\varphi _3}LnIC{T_{t - i}} + {\varphi _4}LnRE{N_{t - i}}} \hfill\cr
{ \quad \quad \quad \quad \quad + {\varphi _5}GO{V_{t - i}} + {\varphi _6} + \sum\limits_{i = 1}^r {{\beta _1}} LnIN{V_{t - i}} + \sum\limits_{i = 1}^r {{\beta _2}} LnIC{T_{t - i}}} \hfill\cr
{ \quad \quad \quad \quad \quad + \sum\limits_{i = 1}^r {{\beta _3}} LnRE{N_{t - i}} + \sum\limits_{i = 1}^r {{\beta _4}} GO{V_{t - i}} + {\varepsilon _t}} \hfill\cr} $$
where
 $\Delta $
marks out the change instrument;
 $t - i$
shows the optimal lag choosing criteria that is Akaike information criterion (AIC) and Schwarz criterion (SIC)-based. The instruments
 ${\varphi _1} - {\varphi _{5\;}}\;$
and
 ${\beta _1} - {\beta _4}$
are computed. The co-integrating connection among the variables is a precondition for performing the ARDL procedure for exploring the variables’ short- and long-run coefficients.
ARDL procedure for co-integrated regression
The ARDL (autoregressive distributed lag) procedure is adopted for co-integrating analysis. In comparison with previous co-integration approaches, such as Engle and Granger (Engle and Granger Reference Engle and Granger1987), Johansen (Johansen Reference Johansen1988), and Johansen and Juselius (Johansen and Juselius, Reference Johansen and Katarina1990), the ARDL co-integration approach has several significant advantages. First, we can utilise the ARDL approach to co-integration whether the regressors’ integrating order is I(0) or I(1), e.g. mixed order (Pesaran et al. Reference Pesaran, Shin and Smith2001). This statement implies that this technique avoids classifying variables into I(0) or I(1) and eliminates the unit root as a pretesting prerequisite. Second, the Johansen co-integration procedure requires large-scale data for estimation validity. At the same time, the ARDL technique provides a more robust and statistically significant output for determining the co-integration relationship in a small sample size. Third, the ARDL approach allows variables’ varied lag lengths for optimality validation, which is barely possible with traditional co-integration methods. Fourth, the ARDL approach requires a single-pared form equation, whereas conventional co-integration procedures estimate long-run relationships using system equations. Finally, this technique shows the dynamic linkage between variables for shorter and longer periods deviated from the previous regression procedures. For long-run estimation, the ARDL bounds test equation is written as follows:
 $$\matrix{
{LnS{D_t} = {\varphi _0} + \sum\limits_{i = 1}^h {{\sigma _1}} LnTD{K_{t - i}} + \sum\limits_{i = 1}^h {{\sigma _2}} LnIC{T_{t - i}} + \sum\limits_{i = 1}^h {{\sigma _3}} LnRE{N_{t - i}}} \hfill\cr
{\quad \quad \quad \quad+ \sum\limits_{i = 1}^h {{\sigma _4}} GO{V_{t - i}} + {\varepsilon _t}\;} \hfill\cr} $$
The long-term connection among the variables is determined by these instruments of
 ${\sigma _1} - {\sigma _6}$
mentioned in the above equation. The following shows the error correction model:
 $$\matrix{
{LnS{D_t} = {\varphi _0} + \sum\limits_{i = 1}^h {{\sigma _1}} LnTD{K_{t - i}} + \sum\limits_{i = 1}^h {{\sigma _2}} LnIC{T_{t - i}} + \sum\limits_{i = 1}^h {{\sigma _3}} LnRE{N_{t - i}}} \hfill\cr
{\quad \quad \quad \quad+ \sum\limits_{i = 1}^h {{\sigma _4}} GO{V_{t - i}} + \gamma EC{T_{t - i}} + {\varepsilon _t}} \hfill\cr} $$
The short-run connection among the variables is denoted by these instruments of
 ${\rm{\;}}{{\rm{\varphi }}_1} - $
 ${{\rm{\varphi }}_4}$
mentioned in above equation. ECT means the error correction term that illustrates adjustment speed from shorter-period disability to longer-term stability.
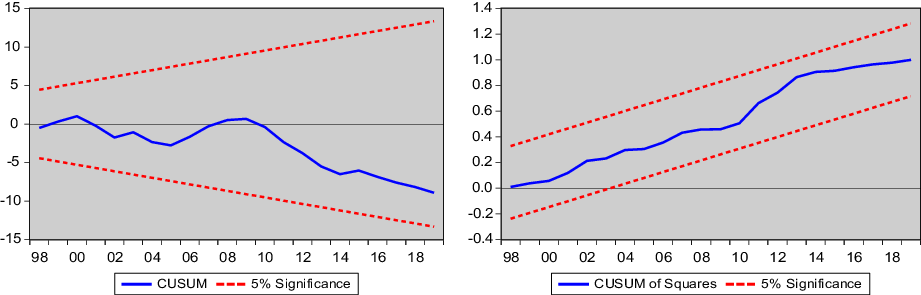
The postestimation tests are the Breusch–Godfrey Lagrange multiplier (LM) test, Breusch–Pagan–Godfrey: ARCH test, and Ramsey RESET test used for checking autocorrelation issue, heteroscedasticity issue and fitted values’ nonlinear combination issue, respectively. In addition, the CUSUM and CUSUM square tests are employed to analyse whether the investigated model is stable.
The DARDL simulation approach
Avoiding some drawbacks of the traditional ARDL procedure, Jordan and Philips (Reference Jordan and Philips2018) coined a novel estimation technique – the DARDL simulation approach. Apart from the existing ARDL model, this technique can be utilised to calculate, simulate, and sketch out graphs and area plots, representing the positive and negative shocks to the regressors that impact the dependent variable if ceteris paribus. The mixed order of integration among the variables is maintained while applying the DARDL simulation procedure. The error correction terms (ECT) for the DARDL bounds test can be specified as follows:
 $$\matrix{
{\Delta {{(LnSD)}_t} = {\varphi _0} + {\theta _0}LnS{D_{t - 1}} + {\beta _1}\Delta LnTD{K_t} + {\theta _1}LnTD{K_{t - 1}} + {\beta _2}\Delta LnIC{T_t}} \hfill\cr
{\quad \quad \quad \quad \quad \quad + {\theta _2}LnIC{T_{t - 1}} + {\beta _3}\Delta LnRE{N_t} + {\theta _3}LnRE{N_{t - 1}} + {\beta _4}\Delta GO{V_t}} \hfill\cr
{\quad \quad \quad \quad \quad \quad + {\theta _4}GO{V_{t - 1}} + \gamma EC{T_{t - i}} + {\varepsilon _t}} \hfill\cr} $$
In estimating the error correction mechanism in the DARDL model, the 5,000 vectors for simulations are applied for checking multivariate normal distributions among the variables.
KRLS machine learning algorithm approach
This research executes the Kernel-based ordinary least squares (KRLS) machine learning algorithm technique to graphically represent the marginal effect of the predictors at each data point on the dependent variable (Hainmueller and Hazlett, Reference Hainmueller and Chad2014). It exhibits closed-form measures for the pointwise partial derivatives in covariate space. The KRLS method serves to confirm the robust findings. This method contains a mixture of models through which we can determine the marginal effects of the independent variables. It also allows for statistical inference with closed-form expressions and has favourable statistical features under weak assumptions. Using this method, we can directly interpret the model, likewise linear regression, while allowing for more complex interpretations (Sarkodie and Owusu Reference Sarkodie and Phebe2020). Finally, this estimator can produce the pointwise partial derivative estimates for each data point in the covariate space, describing the marginal effects of the independent variables, including the trademark, ICT, renewable energy and GOV on the dependent variable, the sustainable development. Therefore, we utilise this machine learning algorithm to check the robustness of the findings obtained from the DARDL simulation approach.
Empirical findings and discussions
Table 1 shows the summary statistics of the data properties. Sustainable development has a mean value of 2.8378 and a standard deviation of 0.7243, delineating a more elevated efficiency level with less fluctuation over time. The average value and standard deviation of trademark innovation and renewable energy consumption (REN) are 8.4758, 4.0284 and 0.7657, 0.3189, respectively, indicating that the efficiency of these variables is higher with slight changeability over the time horizons. The standard deviation of renewable energy consumption (REN) is 0.0563, meaning renewable energy use is more invariant throughout the sample countries. Furthermore, the average values of ICT and GOV are 0.6784 and −0.4403, respectively, indicating that these factors have a higher efficacy level than TDK and REN. However, the standard deviations of ICT and GOV are 2.6295 and 1.9869, respectively, indicating less fluctuation during the study period. Overall, standard deviations appear to be marginal for all the variables, showing the normal distribution of the dataset in Table 2.
Summary statistics of dataset

Note: SD = Sustainable development; TDK = Trademark innovation; ICT = Information and communication technology; REN = Renewable energy; and GOV = Governance.
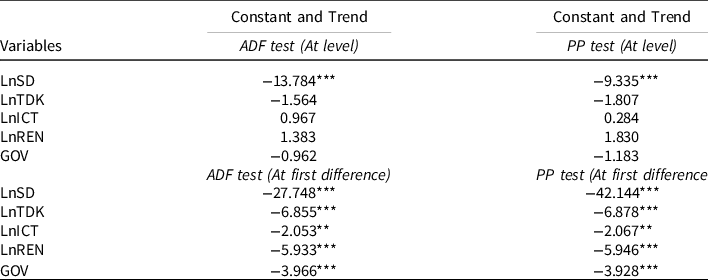
After confirming the normal distribution of the dataset, unit root tests using ADF and PP are applied to know the integrating order of the variables (Table 3). The examined outcomes establish a mixed order of integration among the variables, indicating that variables are stationary at both the level and the first difference. These findings underscore the point of orientation that variables used in both models have a co-integrating relationship. In addition, mixed integrating order among the variables leads to utilising the ARDL bounds testing approach to co-integration.
Unit-root analysis
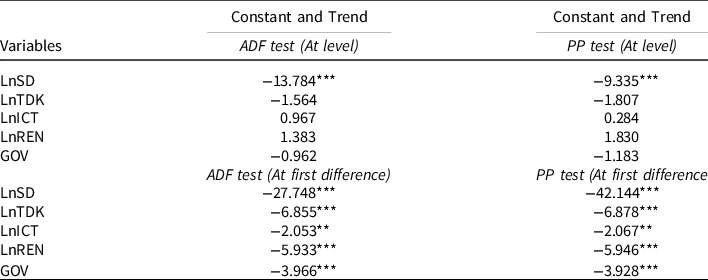
Note: *** and ** indicate 1% and 5% level of significance; Ln indicates natural logarithm.
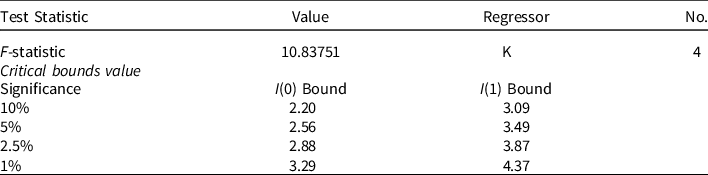
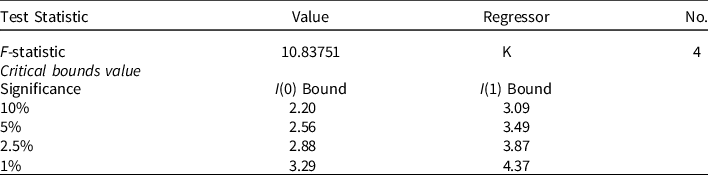
Before implementing the ARDL-based simulations model, it is required to check the ARDL bounds testing approach to co-integration. The bound testing outcome depends on the computed F-statistic value. Table 4 indicates that the calculated F-statistic value lies above the critical value of the upper bound, which demonstrates the state of the null hypothesis of no co-integrating relationship among the variables. Therefore, it implies that study variables are co-integrated, allowing the DARDL simulations model to estimate short and long-run connections among them.
ARDL bounds test with F-statistic
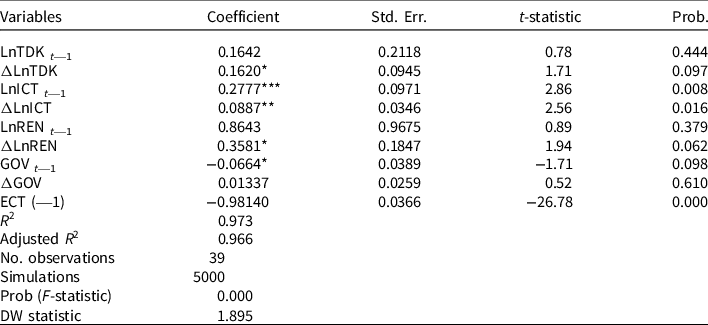
The empirical findings obtained from the DARDL simulation approach depict that a 1% change in trademark innovation contributes to augmenting sustainable development by 16%, as there is a positive influence of trademark innovation on sustainable development in the long run and a significantly positive impact in the short run (Table 5). Recently, consumers are aware of environmental concerns, and many are willing to purchase environmentally friendly products. The public sector’s initiative of integrating the trademark phenomenon has been instrumental in developing buyers’ faith in their consumed goods with definite standards. Trademark-induced logos mainly inform buyers of the certification of the products as provided by the authorised organisation, which is primarily acquainted with “certification marks, collective marks, or guarantee marks” (WIPO 2020). These certification symbols are closely associated with the issue of sustainability in production. Thus, public sector innovation has become an ever more focal issue for maintaining the trademark of firms and international economies (Mendonça et al. Reference Mendonça, Tiago and Manuel2004).
The dynamic ARDL simulations analysis
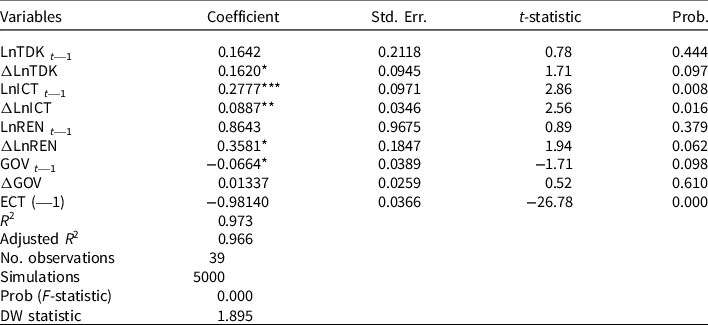
Note: ***, ** and *denote the 1%, 5% and 10% significance levels. The dependent variable is sustainable development (LnSD) and the regressors are trademark innovation (LnTDK), information and communication technology (LnICT), renewable energy (LnREN) and Governance (GOV).
Bangladesh, a country of 165 million people (Islam and Islam, Reference Islam and Islam2021a), has a substantial market for business. This market mechanism has become more operational when the functionality of the market has come under the framework of intellectual property rights (IPR). The common notion is that the IPR instruments, especially trademarks, have significantly changed the Bangladesh market in producing and selling sustainable and environmentally friendly commodities. The public agency, the Department of Patents, Designs and Trademarks (DPDT), provides trademark registration for seven years from the date of application (Somrat, Reference Somrat and Farazmand2018). As one of the public sector’s technological innovations, trademarks help people consume sustainable products and save money by purchasing commodities at affordable prices. The study findings are more or less consistent with the earlier studies by Mensah et al. (Reference Mensah, Long, Dauda, Boamah and Salman2019); Sagar and Holdren (Reference Sagar and Holdren2002); Sun et al. (Reference Sun, Lu, Wang, Ma and He2008); Chuzhi and Xianjin (Reference Chuzhi and Huang2008); Fisher-Vanden et al. (Reference Fisher-Vanden, Gary, Ma and Xu2006); Xu et al. (Reference Xu, Liu and Jiang2006) and Islam et al. (Reference Islam, Islam, Ahmed and Rumana2021). These authors highlighted the role of technology innovation (e.g. trademark), which is instrumental to curbing emissions and hence environmental sustainability – the part of sustainable development. Besides, Opoku & Boachie (Reference Opoku, Evans and Micheal2020) opined that trademark innovation is the precondition for the sustainable development of any economy. Despite earlier major studies’ findings on behalf of this study, a single research done by Wu et al. (Reference Wu, Kaneko and Matsuoka2005) found an adverse impact of trademark innovation on environmental sustainability or sustainable development.
The results in Table 5 also show that a 1% change in ICT helps augment sustainable development by 27% and 8% in the long and short run, respectively. Generally, ICT, as a significant innovation outcome of the public sector, is utilised for development in all spheres of the state. It can contribute to innovating business activities and incorporating innovative machinery into business processes. Furthermore, considering sustainability issues, the ICT-based innovation outcome of the public sector helps deal with climatic hazards, environmental decay, cyber-security threats, and other global risks that accelerate prosperity and economic growth on a sustainable basis (Marolla Reference Marolla2018).
The recent aspiration of the Bangladesh government to be an advanced economy by 2041 has emphasised the development of technological and digital sectors. Attaching people with developmental works through technical apparatus is reflected in the public sector’s innovation agenda (Islam and Islam, 2021). The country’s government intends to bring public sector bodies, organisations, and policy frameworks towards ICT-enabled renovation. They have also incorporated ICT’s transformative potentials into “payments, tax collections, procurement, training, human resources, programme design, public deliberation, information management, analytics, legislative drafting, even voting.” Besides, the ICT Division has been providing broadband connectivity, ICT training for all pertinent government professionals and service providers, ICT-based healthcare, educational, and infrastructural delivery service, and the Internet of Things (remote sensing and control of connected devices) for the government establishment and environmental management, Public-Private Partnerships (PPPs) for ICT-enabled systems and arrangement of an ICT-based SDG info system (Kalam Reference Kalam2018). These ICT-related innovation outcomes in Bangladesh are conducive to accelerating sustainable development. ICT innovation’s significantly positive contribution to the sustainable development of Bangladesh depicted in the study findings is in line with Paul and Uhomoibhi (Reference Paul and James2012); Latif et al. (Reference Latif2017); Kendall and Dearden (Reference Kendall and Dearden2020); Kostoska and Kocarev (Reference Kostoska and Ljupco2019) and Jayaprakash and Pillai (Reference Jayaprakash and Pillai2021). These studies explored a substantial nexus between ICT and sustainable development in different countries. Deviated slightly from these studies, Rothe (Reference Rothe2020) found both the positive and negative impacts of ICT on sustainable development’s social, economic and environmental dimensions.
This study’s outcome also illustrates that renewable energy consumption positively impacts the sustainable development of Bangladesh in the long term and the short term. Specifically, a 1% change in renewable energy consumption raises sustainable development by 86% and 35% in the long and short runs, respectively (Table 5). The public policy agenda of different developing countries’ governments smoothens the investment employment for local private enterprises and MNCs financing mainly for renewable energy generation. As a result, SHS, biogas, and small hydropower systems have risen in these economies to provide electricity services for rural households at lower costs. Efforts to exploit renewable energy potentials in agriculture, small and medium enterprises (SMEs) and social services are also increasing. However, handling renewable technologies requires experts, new business models, credit facilities for rural enterprises and households, finance for privately owned energy producers, market facilitation to extend sustainable markets and special subsidies to ensure socio-economic benefits (Martinot et al. Reference Martinot, Chaurey, Lew, Moreira and Wamukonya2002).
Public policy-relevant decisions are more prone to ensure sustainable energy production and supply for every people in Bangladesh (Karim et al. Reference Karim, Karim, Islam, Muhammad-Sukki, Bani and Muhtazaruddin2019). The power and energy sector of the country adopted substantial programmes to fulfil the 10% energy demand of the people by generating REs by 2020 (Hasan et al. Reference Hasan, Aman, Shahnewaz and Ahmed2015). This agendum of the public sector has become a reality as the country has contributed 10% of renewable energy to power generation (Islam et al. Reference Islam, Islam, Ahmed and Rumana2021; Islam and Islam Reference Islam and Islam2021a). Moreover, energy diversification has been an exceptional dimension of Bangladesh’s public policy innovation in supplying sufficient electricity and sustaining economic growth. The government has completed the recent fuel diversification process by enlarging its renewable energy industry and satisfying increasing electricity demand. The concerned Ministry’s decision in 2008 is welcoming as it took a significant initiative of encouraging public-private investment as part of renewable energy policy. Now, the RE enterprises have replaced fossil fuel-based energy production with renewables-laden energy generation, contributing to the national grid (Khan and Halder Reference Khan and Halder2016). Apart from this, the government of Bangladesh has started a new solar-based energy generation project, the “500 MW Solar Power Mission” to mitigate the augmented demand for energy (Sharif et al. Reference Sharif, Anik, Al-Amin and Bakr2018). Thus, renewable energies in Bangladesh have become instrumental in promoting sustainable development, as per our study result. This study’s finding is consistent with previous studies by Comakli et al. (Reference Comakli, Mehmet and Bayram2008), Güney (Reference Güney2019), Klepacka (Reference Klepacka2019), Lee (Reference Lee and Leal Filho2019) and Ahmed and Shimada (Reference Ahmed and Koji2019). They established renewable energy resources as a potential element to achieve sustainable development and meet societies’ current needs while avoiding heavy dependence on fossil fuels and the depletion of resources for future generations. However, our results contradict Bozkurt and Destek (Reference Bozkurt and Akif2015) and Gyamfi et al. (Reference Gyamfi, Nana, Derkyi, Asuamah, Israel, Aduako, Kabo-Bah and Diji2018). They emphasised the cost of renewables as a significant barrier to achieving the desired level of operation and success of RE technologies for ensuring sustainable development.
The investigated results in Table 5 illustrate that a 1% change in the GOV of Bangladesh helps reduce sustainable development by 6% in the long run and accelerate by 13% in the short run. This finding entails that the long-run effect of GOV is not favourable for Bangladesh’s sustainable development, but the GOV stimulates sustainable development for a shorter time. Bangladesh’s GOV practice reproduces a changing association among contending interest groups, mainly the controllers of the country’s political, economic, administrative, legislative, and regulatory power. These five pillars of public GOV have severely constrained developing and restructuring key institutions, processes and management strategies to direct the country towards a sustainable development path. This incapacity of Bangladesh’s public sector leads to hampering the rule of law, property rights and open and accountable provision of public goods, increasing rent-seeking, corruption and risk appropriations (Alam and Teicher Reference Alam and Teicher2012).
Also, the precondition for sustainable development is associated with environmental conservation. Bangladesh intends to ensure sustainable development by adopting appropriate policies, systematic procedures, and environmental GOV processes. However, the challenges emanate from public institutions, including “the weak enforcement of rules and regulations, the lack of organisational coordination, responsiveness and responsibility, and the shortfalls in the mobilisation of required resources” (Ahmed Reference Ahmed2019), and these kinds of roadblocks cause the adverse effect of GOV mechanism on Bangladesh’s sustainable development. The study findings align with Gani (Reference Gani2011) and Stojanović et al. (Reference Stojanović, Jovo and Stevan2016), who established an adverse consequence of the public sector’s GOV mechanism on sustainable development. However, the study result is inconsistent with Güney (Reference Güney2019), Boţa-Avram et al. (Reference Boţa-Avram, Adrian, Paula-Ramona and Marius2018) and Omri and Mabrouk (Reference Omri and Mabrouk2020), who explored a favourable impact of GOV in stimulating sustainable development. Many other studies (Ali et al. Reference Ali, Zeqiraj, Lin, Law, Yusop, Bare and Chin2019; Farhani and Ozturk Reference Farhani and Ozturk2015; Hunjra et al. Reference Hunjra, Tayachi, Chani, Verhoeven and Mehmood2020; Ibrahim and Law Reference Ibrahim and Siong2016; Lau et al. Reference Lau, Choong and Yoke-Kee2014; Wawrzyniak and Doryń Reference Wawrzyniak and Doryń2020) considered the performance of GOV as the public sector’s institutional quality that hampers environmental sustainability – the dimension of sustainable development. This finding is coherent with our study’s findings and incoherent with Salman et al. (Reference Salman, Xingle, Lamini and Claudia2019) and Godil et al. (Reference Godil, Arshian, Hina and Kittisak2020).
The examined results in Table 5 also illustrate that the coefficients of ECT exhibit negative at a 1% significance level as anticipated. The calculated ECT values imply the adjustment speed from short-term uncertainty to long-term stability, 98% in a year. Besides, the calculated R 2 and Adjusted R 2 values express that the study’s predictors can interpret the variation of the predicted variable by 99% for this study model. The computed p-values assure the model’s goodness of fit as the F-statistic value lies at a 1% significance level. Furthermore, the Durbin Watson statistic values include 1.89, i.e. closer to 2, indicating that the study model is autocorrelation-free (Table 5).
The diagnostic tests’ outputs are put in Table 6. The Jarque–Bera test checks residuals’ normal distribution, demonstrated accordingly in the finding. The LM test shows an expected outcome of the model’s autocorrelation-free status. Breusch–Pegan Godfrey: the ARCH test ensures homoscedastic residuals. The DARDL model is rightly identified and confirmed using the Ramsey reset test results. The CUSUM and CUSUM square tests make the stability of the model. The results in Figure 2 confirm the study model’s stability as the blue lines denoted by residuals’ values and the red lines meant by confidence levels stay within the confidence area at a 5% level of significance (Appendix 1). This circumstance also indicates the ARDL model’s stability.
Model diagnostic statistics

Hypothesised empirical framework for public sector innovation-driven sustainable development.
The DARDL simulation plots
The DARDL simulation area plots depict the exact shock of predictors influencing the predicted variables. This study checks 10% positive and negative shocks to regressors (trademark innovation, ICT, renewable energy and GOV) and their influences on the dependent variable, the sustainable development in Bangladesh. The simulation graphs represent the 75%, 90%, and 95% confidence intervals to measure the magnitudes of shocks emanating from the independent variables to the dependent variables at different time horizons. The shocks to public sector innovation outcomes are shown through the DARDL simulations area graphs below:
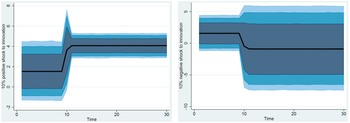
Figure 3 shows that due to a 10% positive shock to trademark innovation (LnTDK) over the 10 years, sustainable development (LnSD) decreases. Still, it increases over the remaining 20 years, resulting in the positive influence of trademark innovation from 10 to 30 years. On the other hand, the 10% negative shock to trademark innovation (LnTDK) causes to decrease the sustainable development (LnSD) throughout the 30 years in Bangladesh.
10% (±) shock to trademark innovation (LnTDK) on sustainable development (LnSD) produced using the dynamic ARDL simulations area plot. The black line indicates the average predicted value and the blue area from darkest to lightest depicts the 75%, 90%, and 95% confidence intervals.
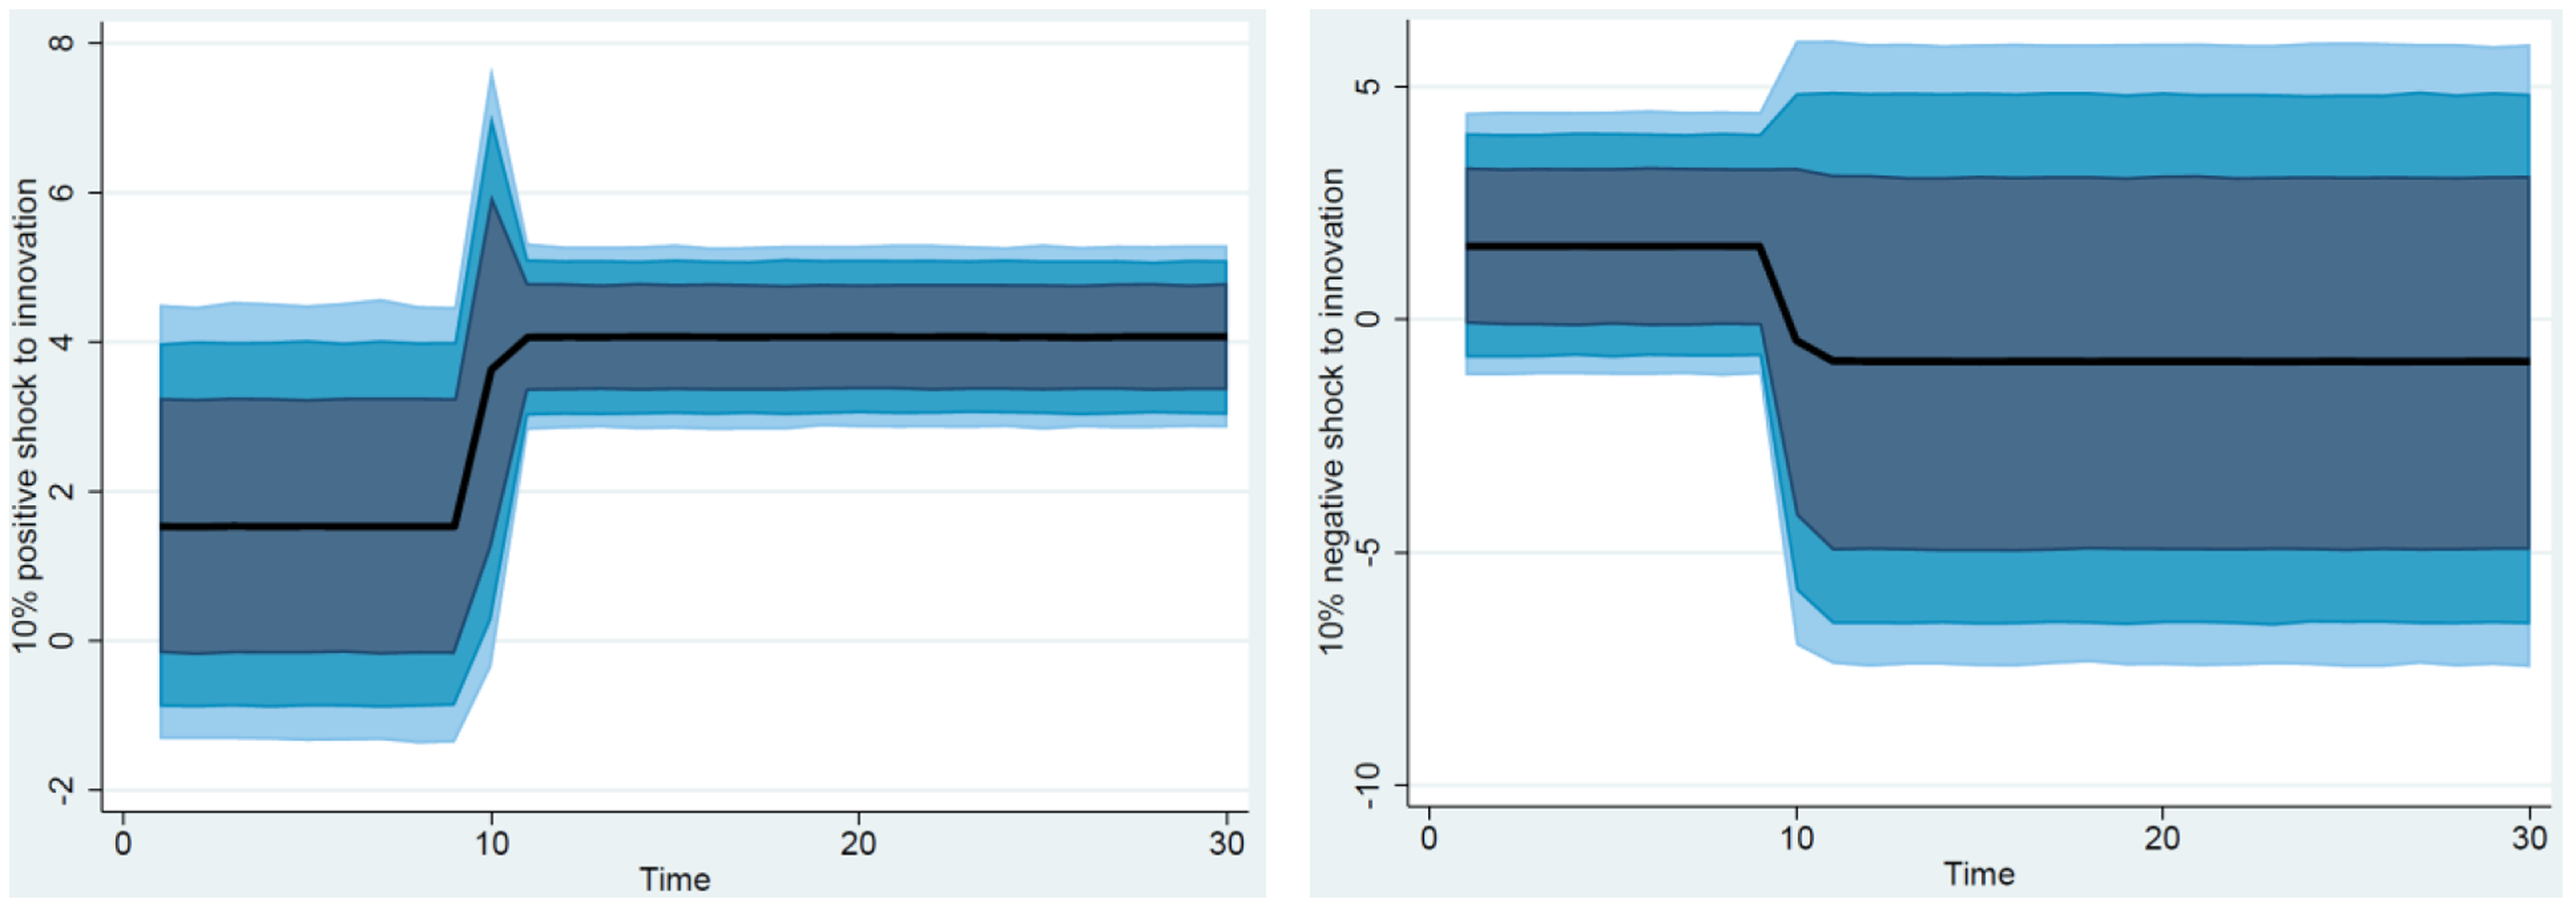
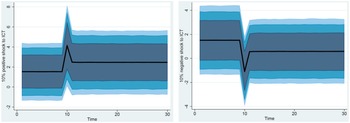
Figure 4 depicts that in the initial 10-year period, a 10% positive shock to ICT (LnICT) decreases sustainable development (LnSD). This trend continues but remains reduced and goes towards positive over the rest of the 20 years. On the other hand, a 10% negative ICT shock decreases sustainable development during 30 years, but the decreasing level increases after the 10th-year period.
10% (±) shock to information and communication technology (LnICT) on sustainable development (LnSD) produced using the dynamic ARDL simulations area plot. The black line indicates the average predicted value and the blue area from darkest to lightest depicts the 75%, 90%, and 95% confidence intervals.
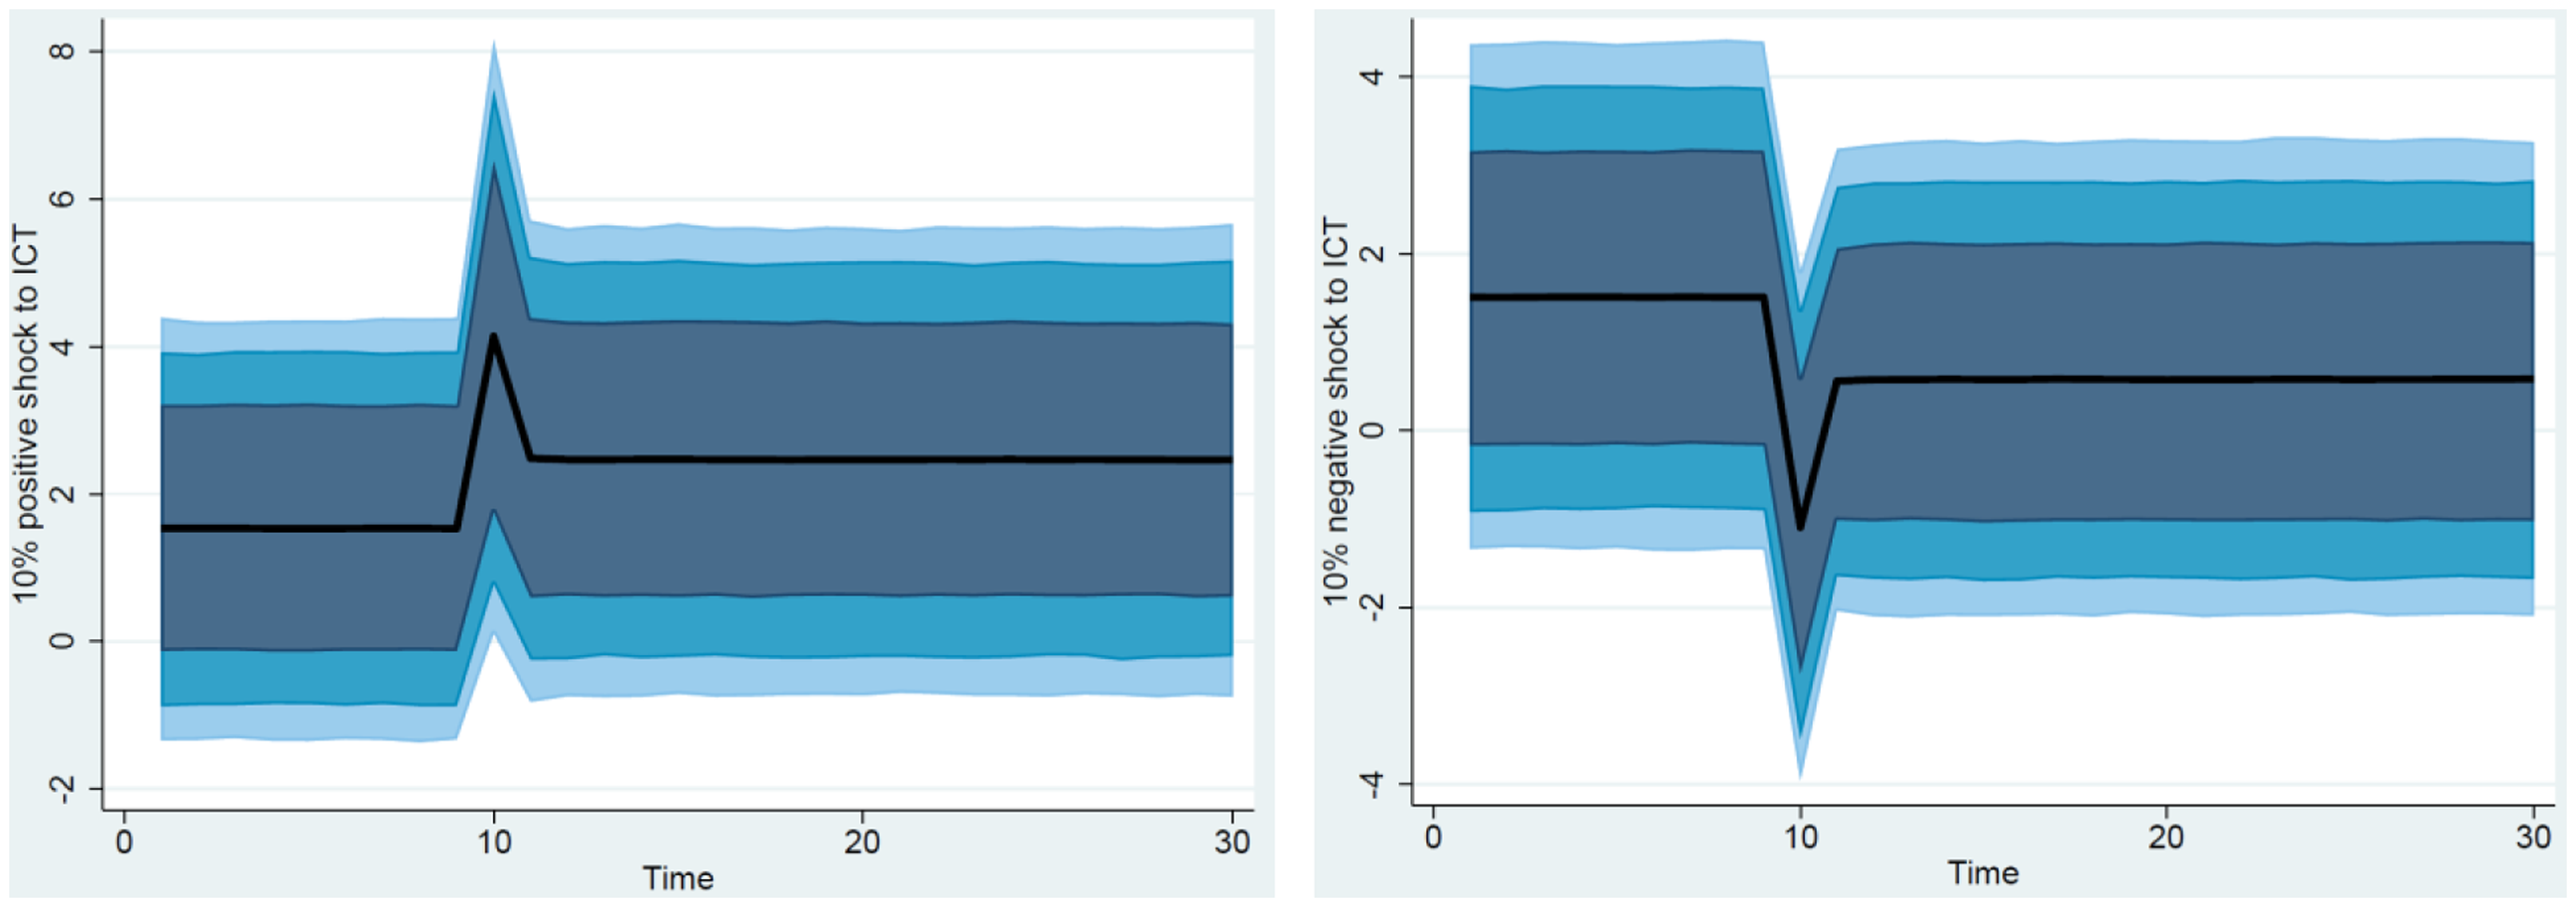
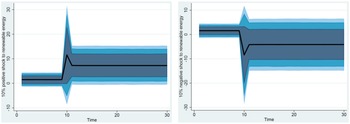
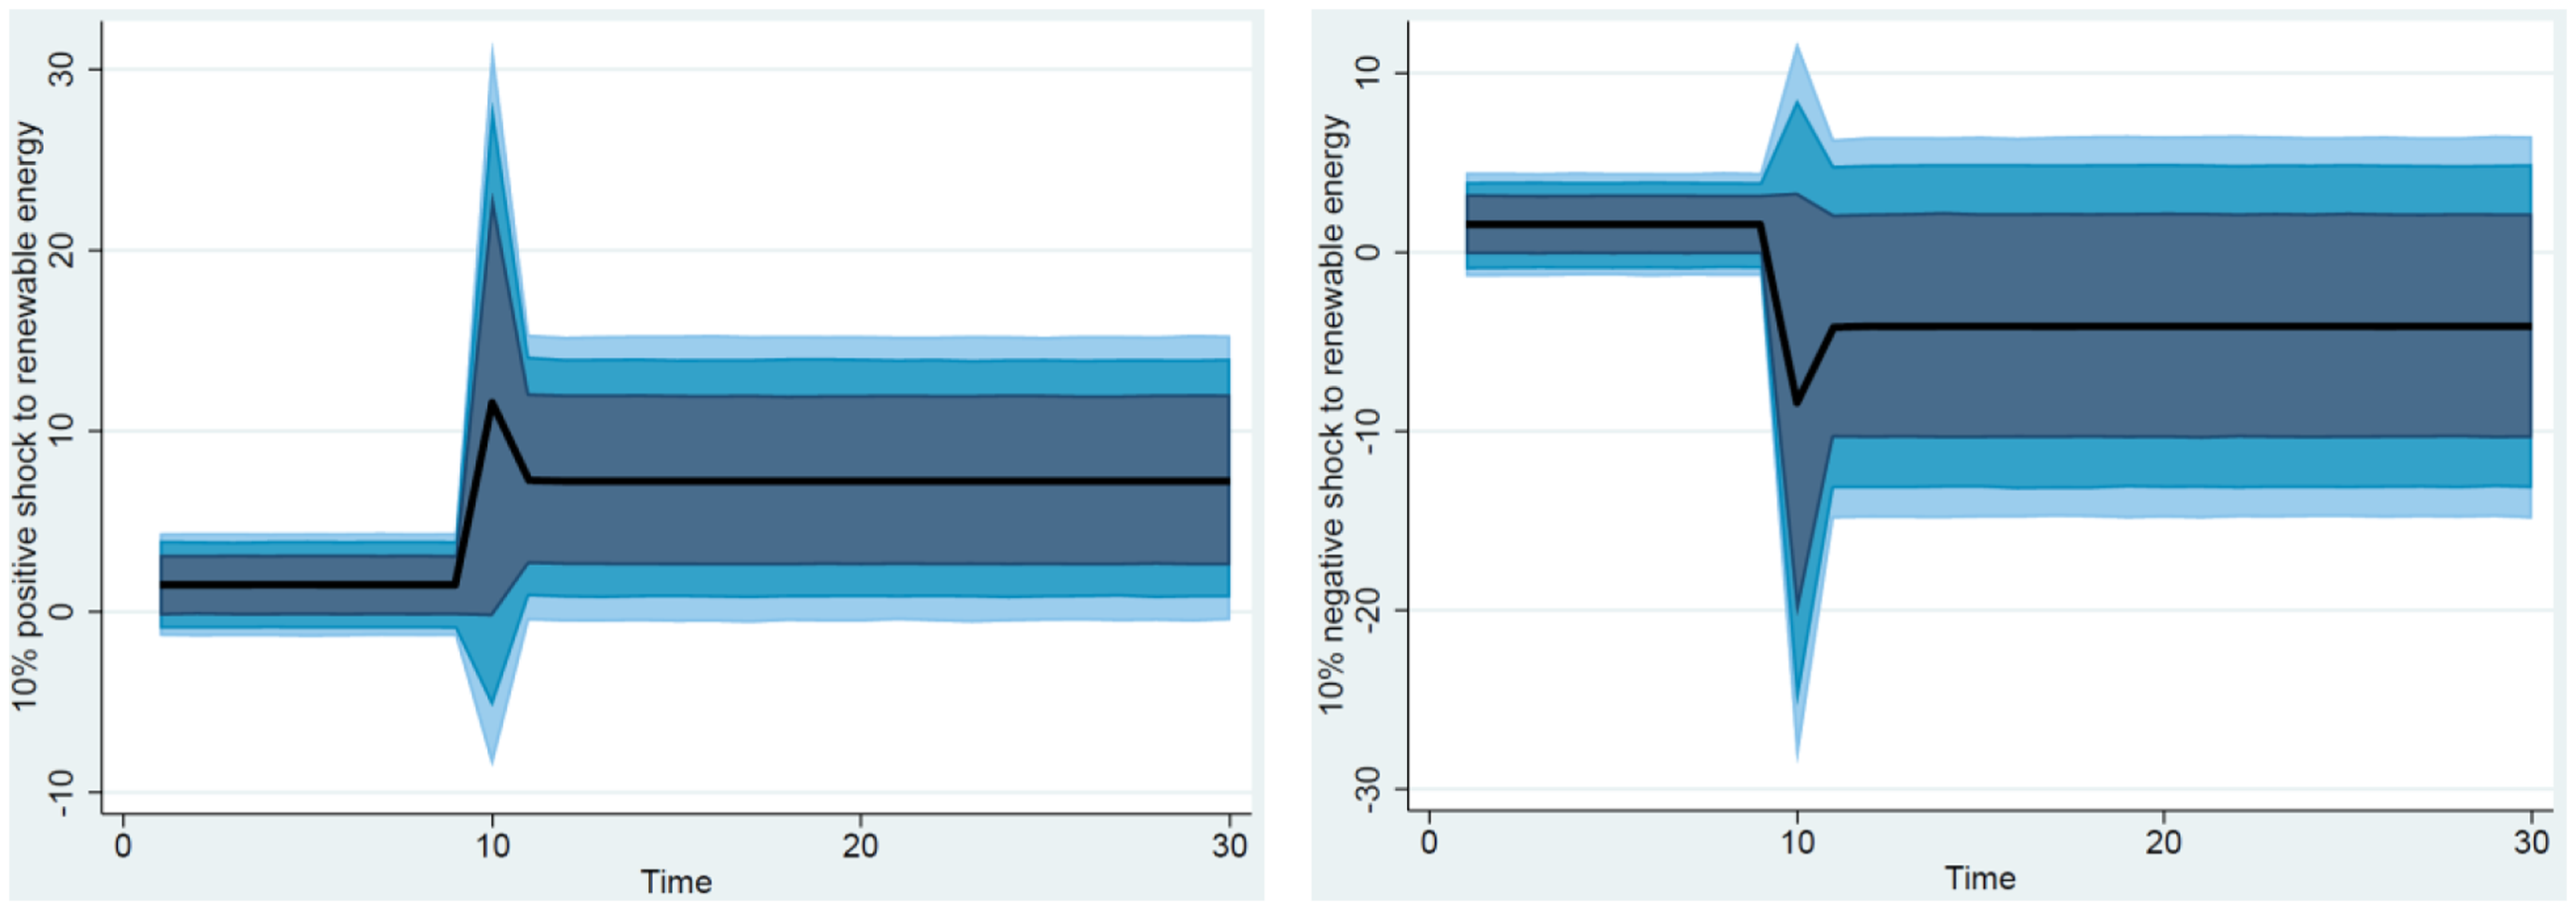
Figure 5 illuminates that renewable energy (LnREN) with a 10% positive shock almost positively influences sustainable development (LnSD). Contrarily, sustainable development is negatively impacted due to a 10% negative shock to renewable energy, though it remains nearly in the positive zone up to the 10th-year period.
10% (±) shock to renewable energy (LnREN) on sustainable development (LnSD) produced using the dynamic ARDL simulations area plot. The black line indicates the average predicted value, and the blue area from darkest to lightest depicts the 75%, 90%, and 95% confidence intervals.
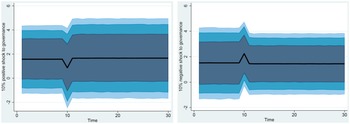
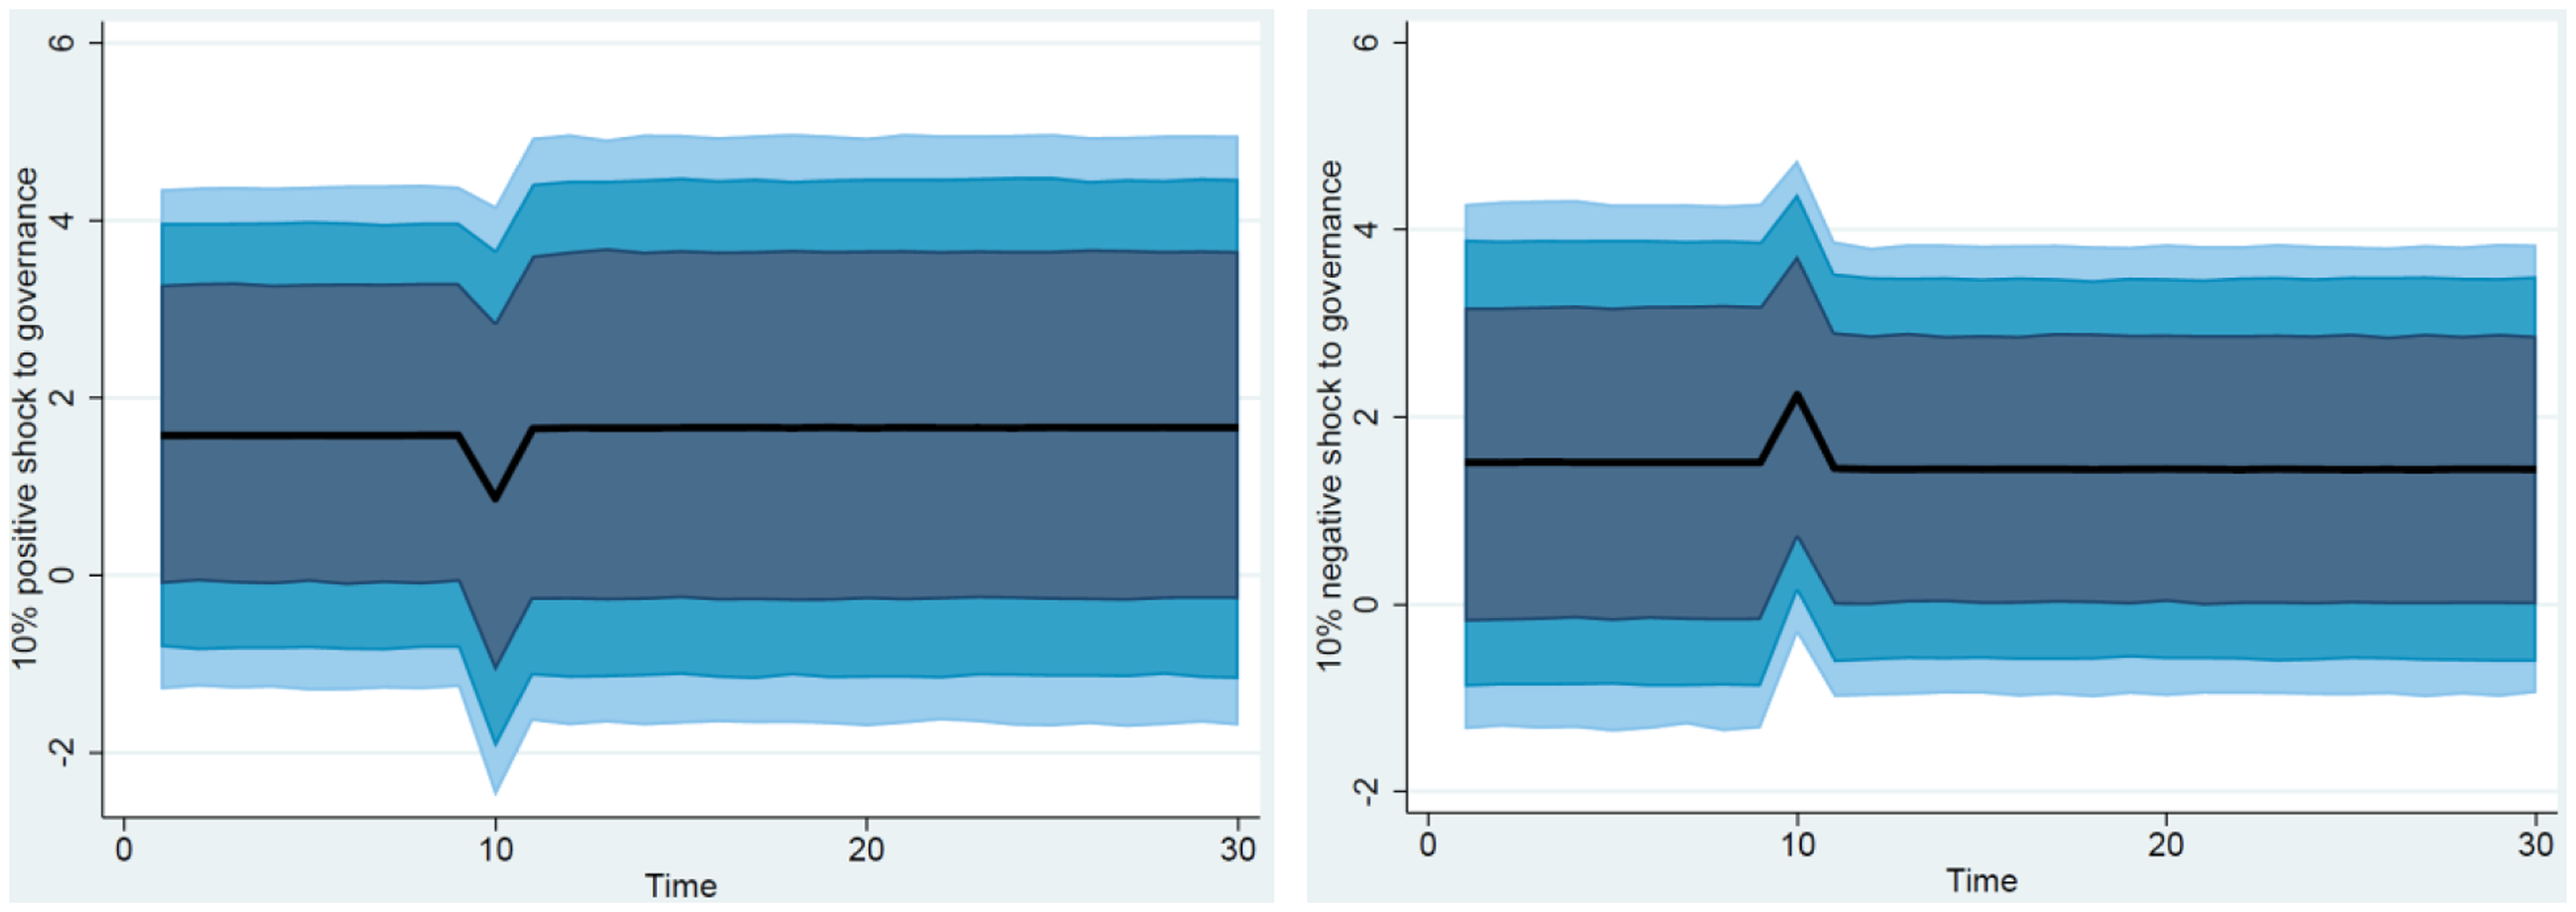
The produced area plot (Figure 6) discloses that 10% of positive and negative shocks to GOV adversely impact sustainable development (LnSD) during the whole forecasted period (30 years) in Bangladesh.
10% (±) shock to governance (GOV) on sustainable development (LnSD) produced using the dynamic ARDL simulations area plot. The black line indicates the average predicted value, and the blue area from darkest to lightest depicts the 75%, 90%, and 95% confidence intervals.
Results of KRLS machine learning algorithm approach
Having documented the results of the DARDL simulation approach, we then analyse the marginal effect of individual regressors (trademark innovation, ICT, renewable energy and GOV) on the predicted indicator, namely sustainable development. This is done by utilising the Kernel-based regularised ordinary least squares (KRLS) machine learning algorithm (Hainmueller and Hazlett Reference Hainmueller and Chad2014; Sarkodie and Owusu Reference Sarkodie and Phebe2020). KRLS performs the pointwise derivatives to investigate the causal-effect association between the variables.
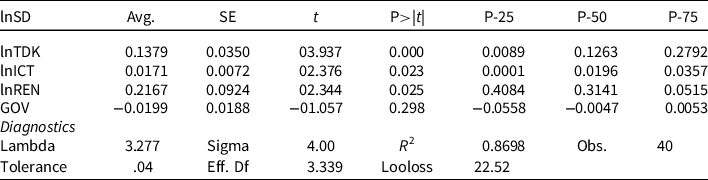
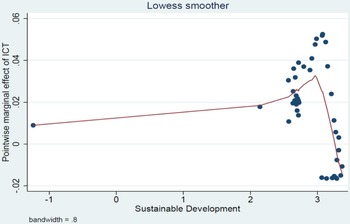
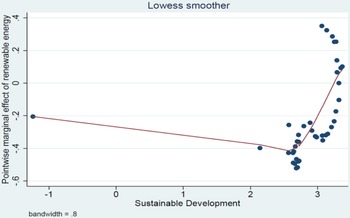
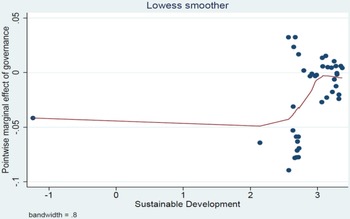
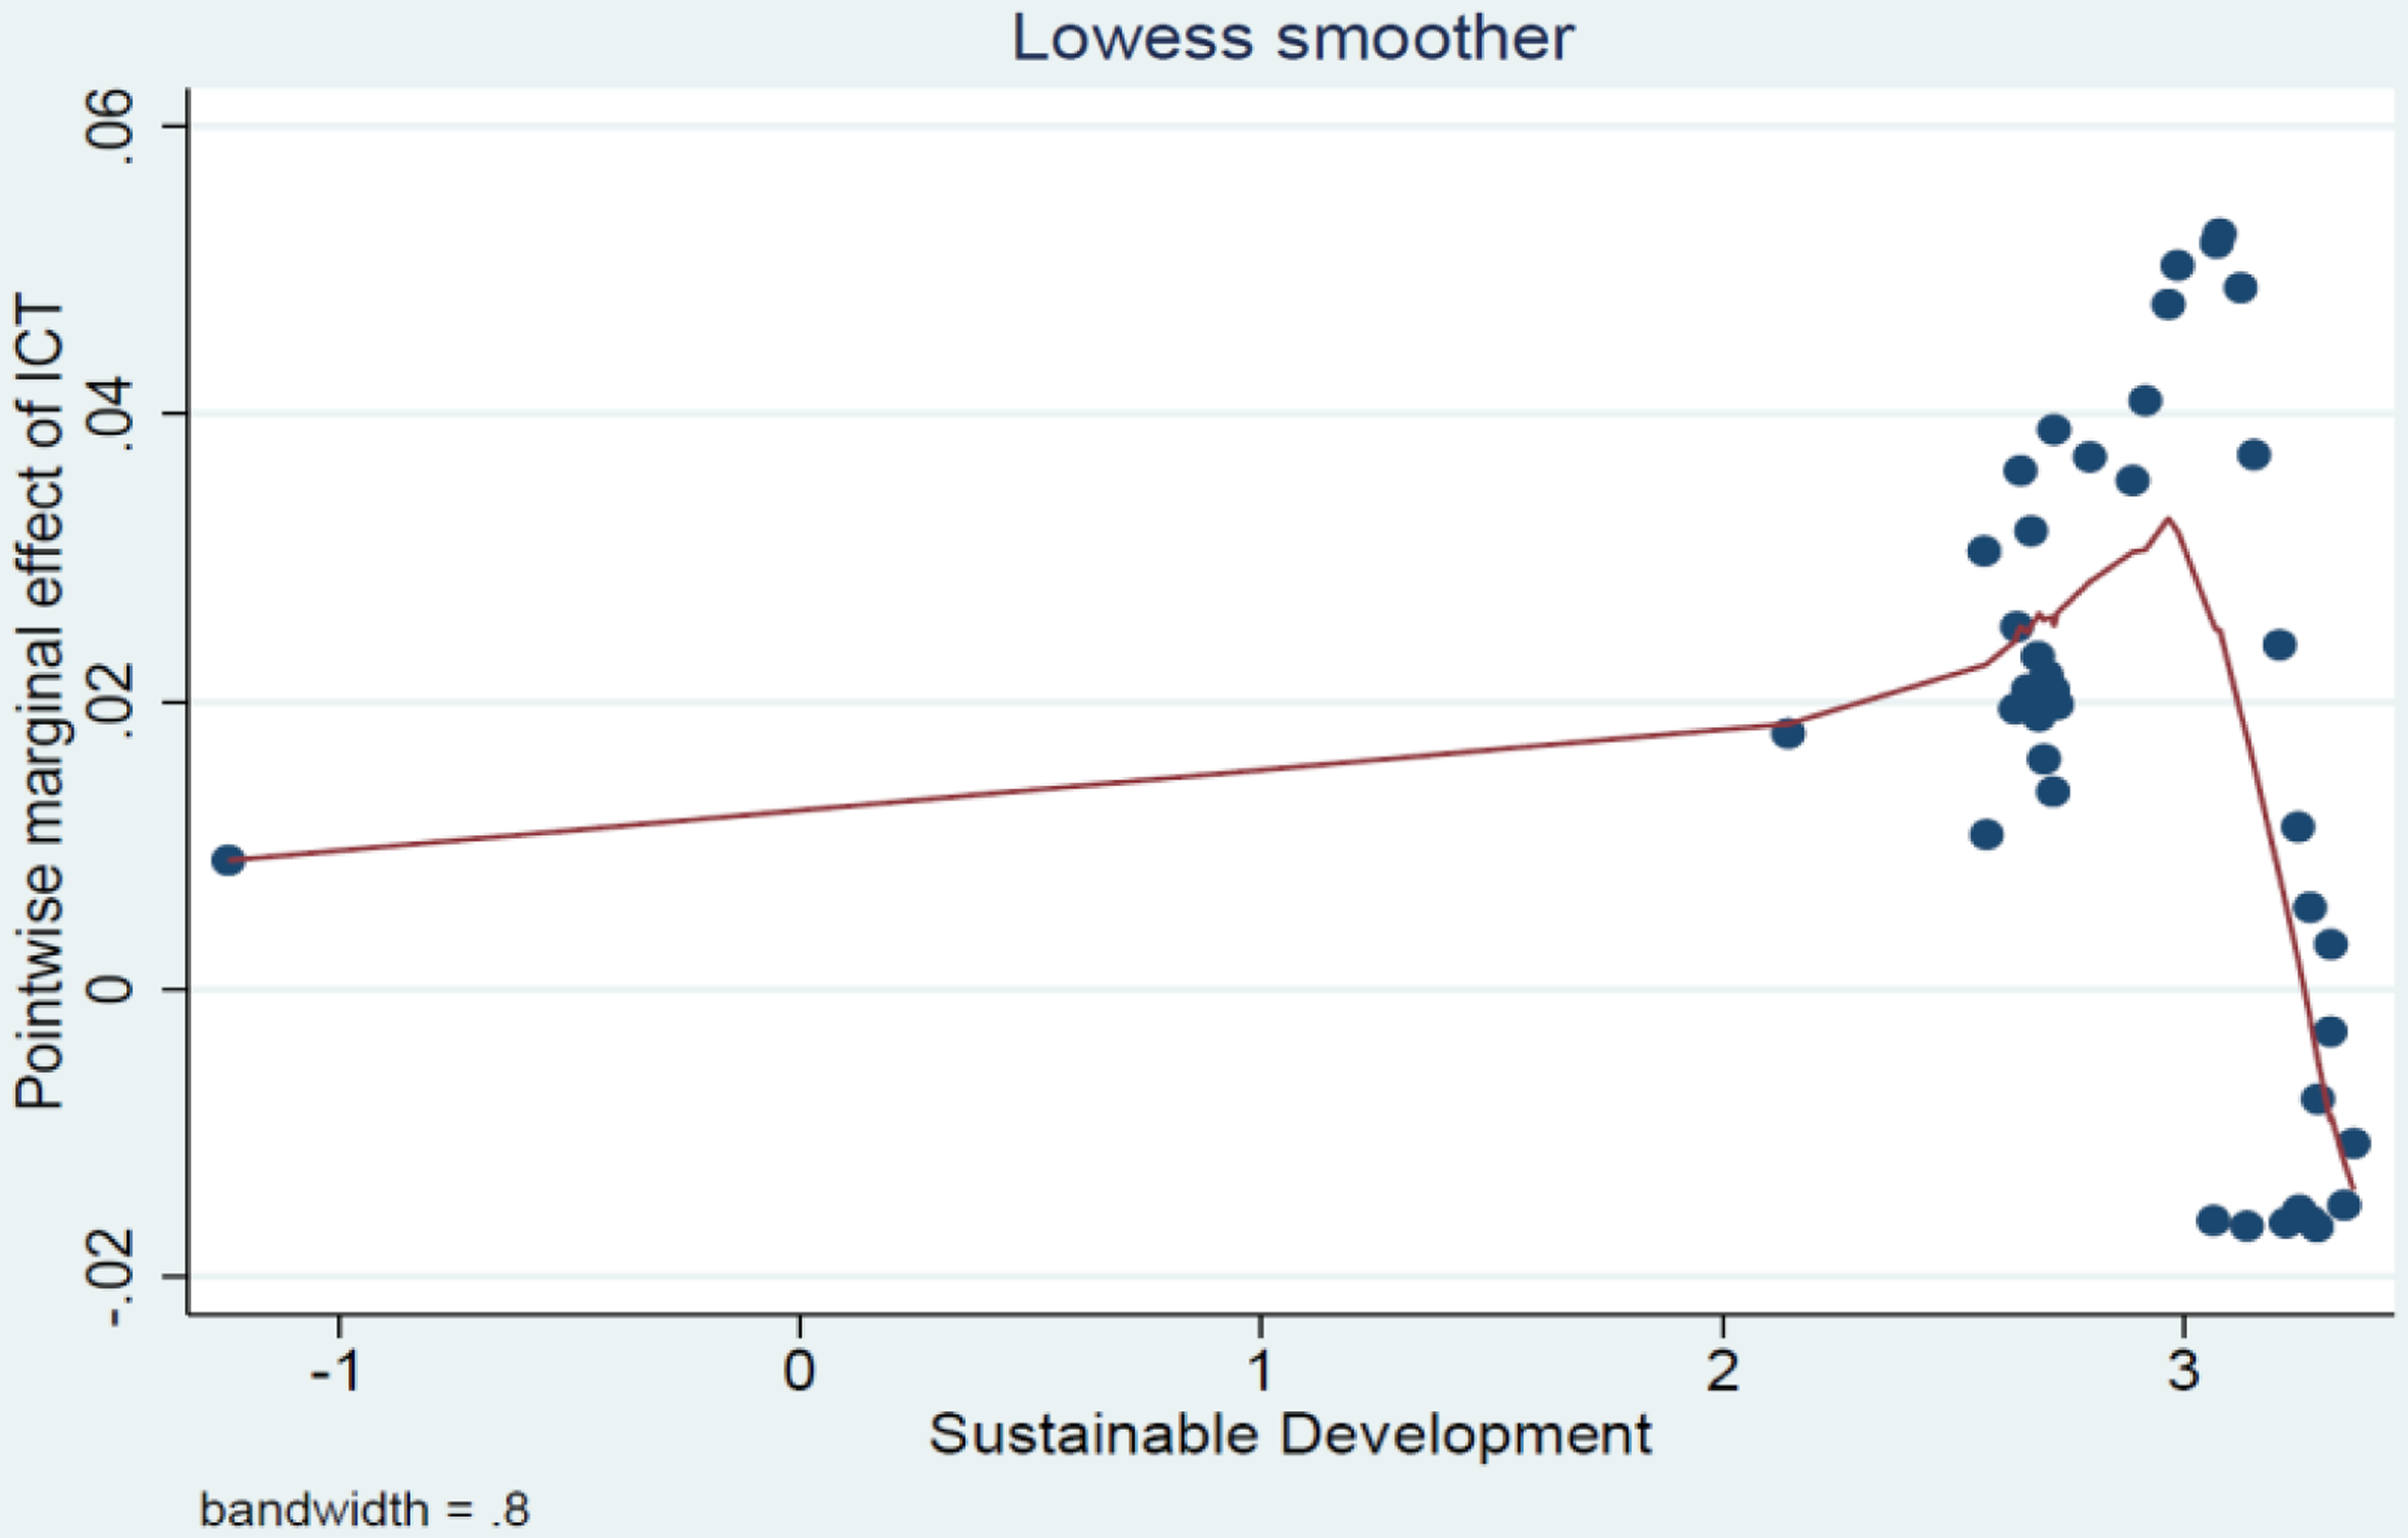
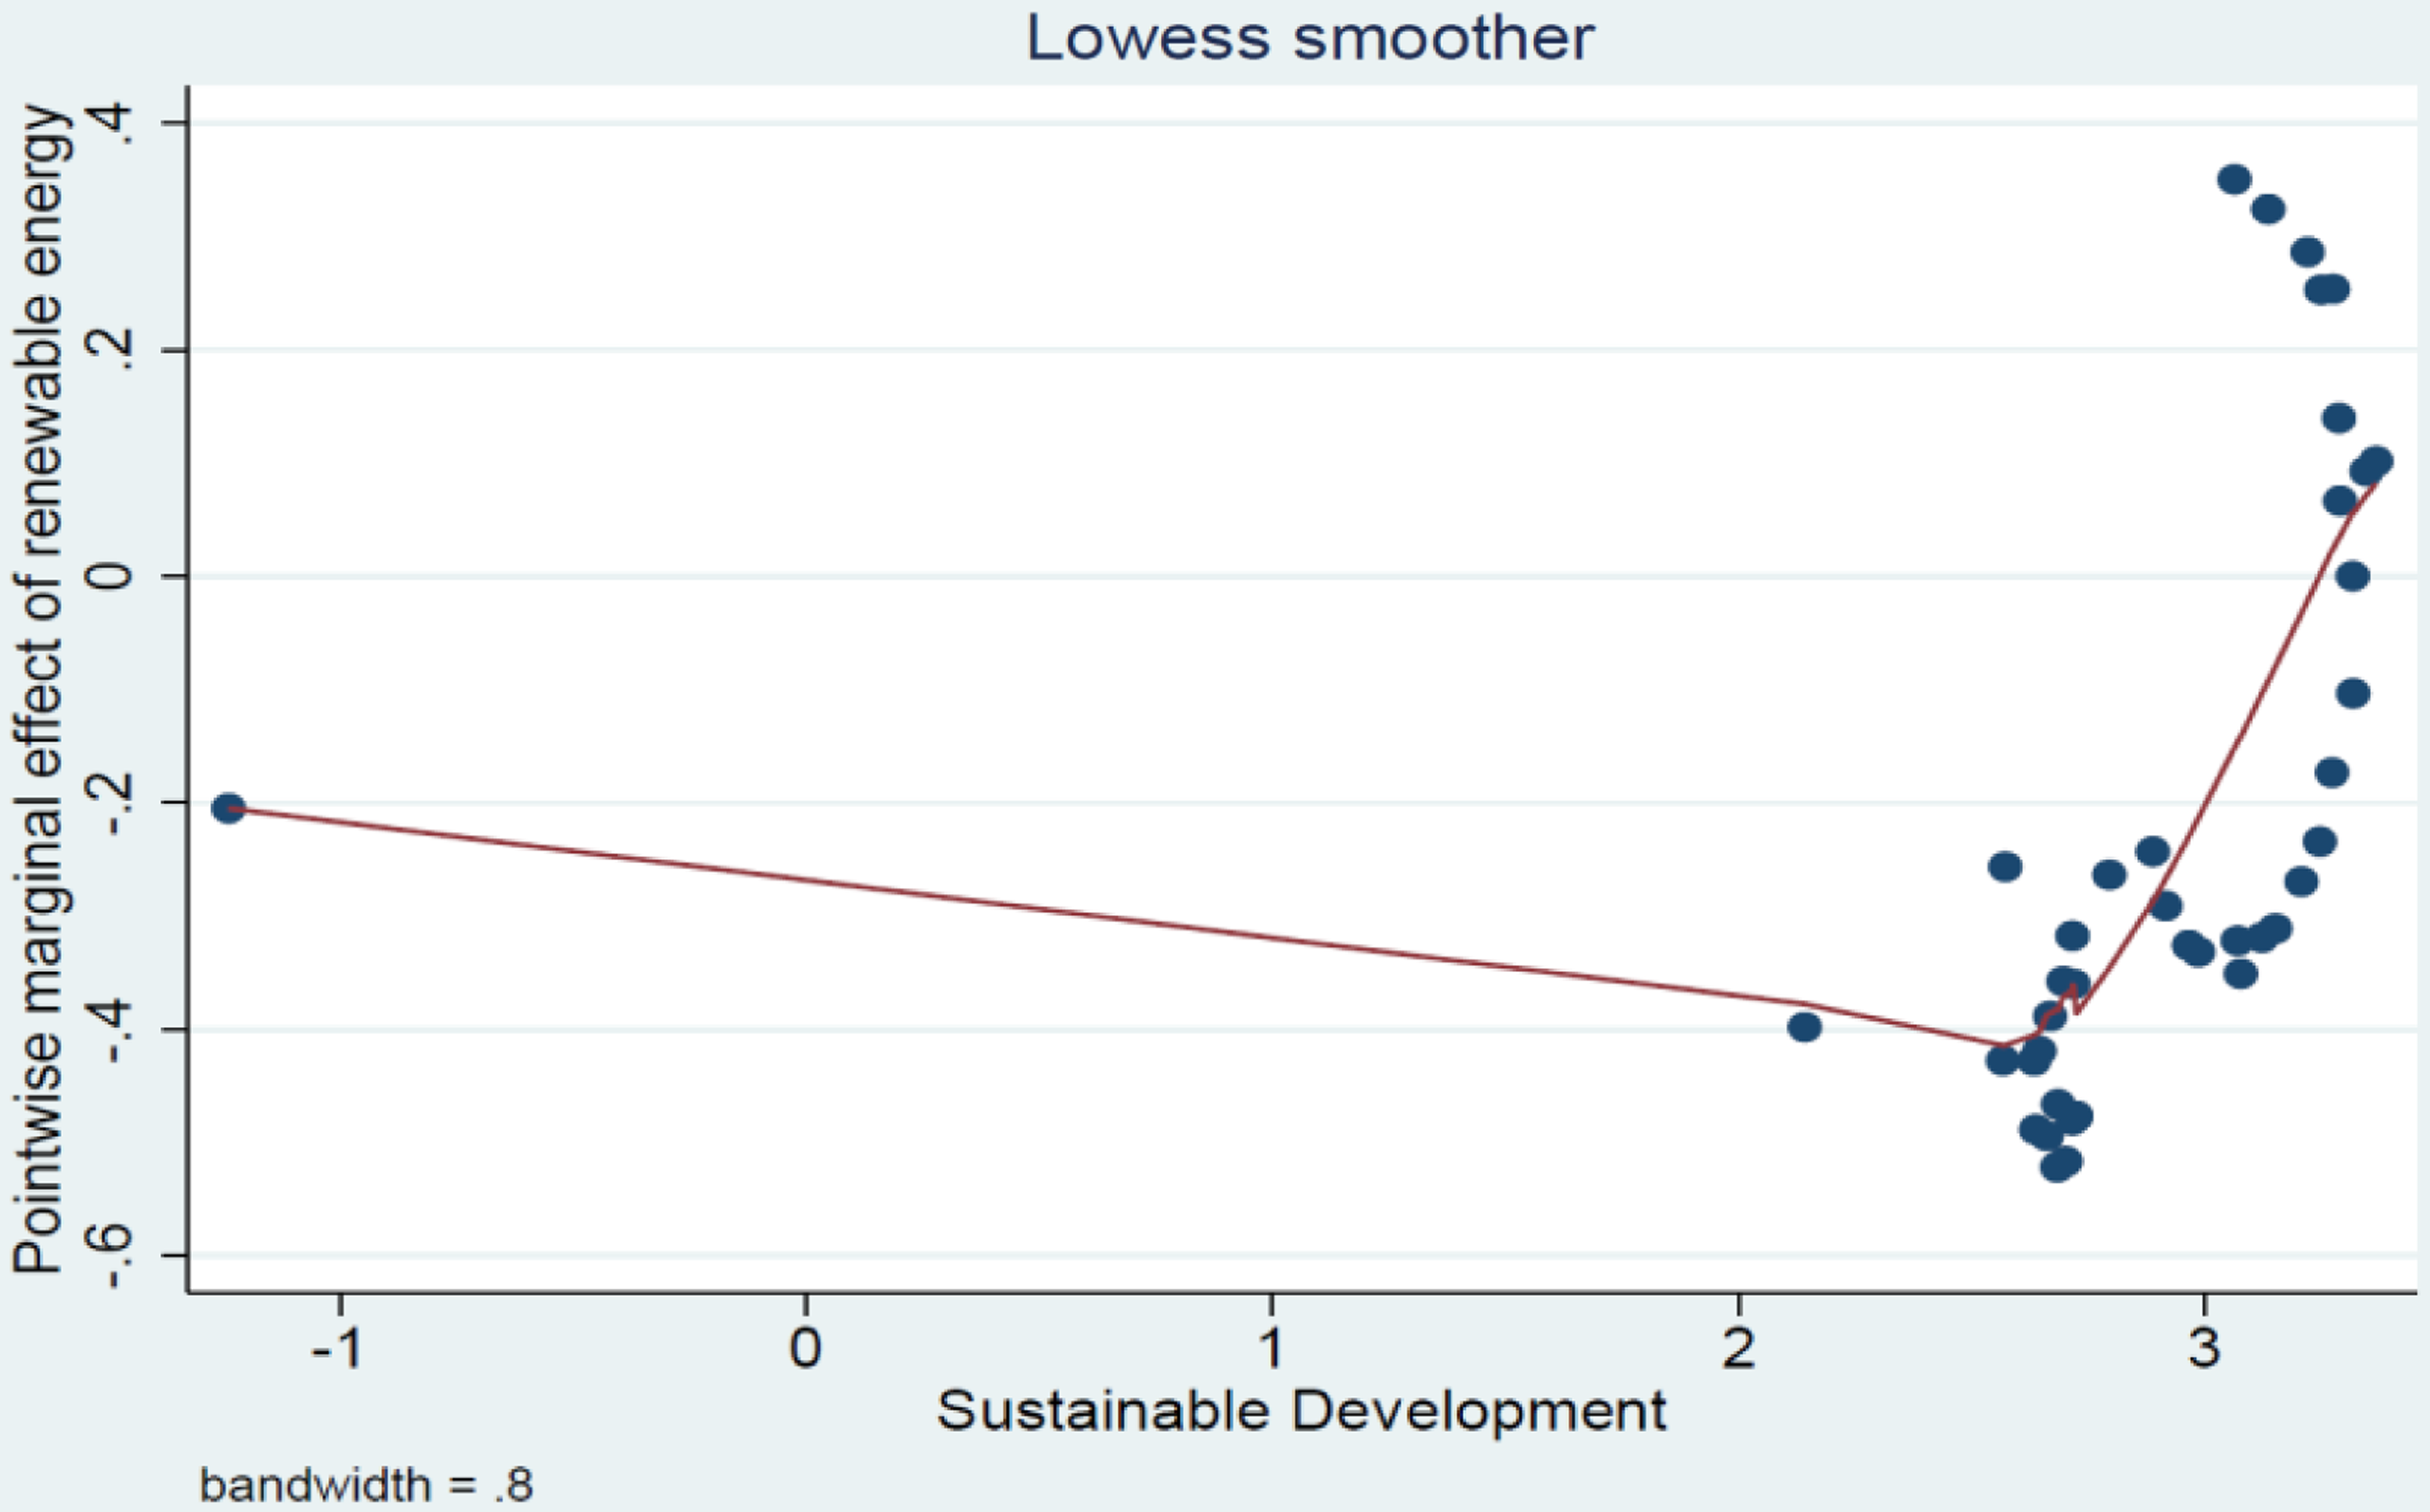
Table 7 shows the pointwise derivatives found from the KRLS technique. In this model, public sector innovation outcomes, such as trademark innovation, ICT and renewable energy, positively impact sustainable development at the 1% and 5% levels of significance, respectively. Still, the effect of GOV on sustainable development is insignificant but negative. These findings are similar to the results obtained from the DARDL simulation approach. The model’s predictive power value implies that the regressors can explain 86.98% of the variation. The 25th, 50th, and 75th percentiles are noted in the findings to assess the pointwise marginal effects of the regressors on sustainable development utilising derivatives. The marginal effects of trademark innovation, ICT, and renewable energy are 13%, 1.7%, and 21%, respectively, and GOV has an insignificant and negative marginal effect (−1.9%), as per the outcomes found in KRLS (Table 7). The long-term marginal effects of independent variables and how these influence the dependent variable are depicted in Figures 7–10.
KRLS using pointwise derivatives
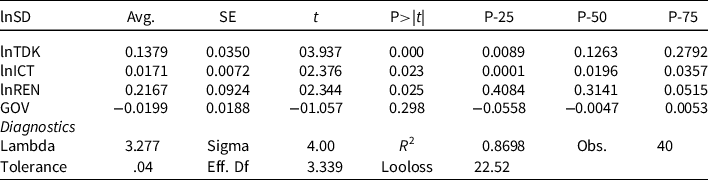
Note: Avg. denotes the average marginal effect; SE outlines standard error; while P-25 shows the first quartile, P-50 denotes the second quartile, and P-75 expresses the third quartile.
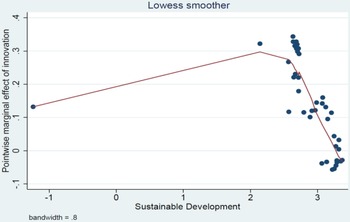
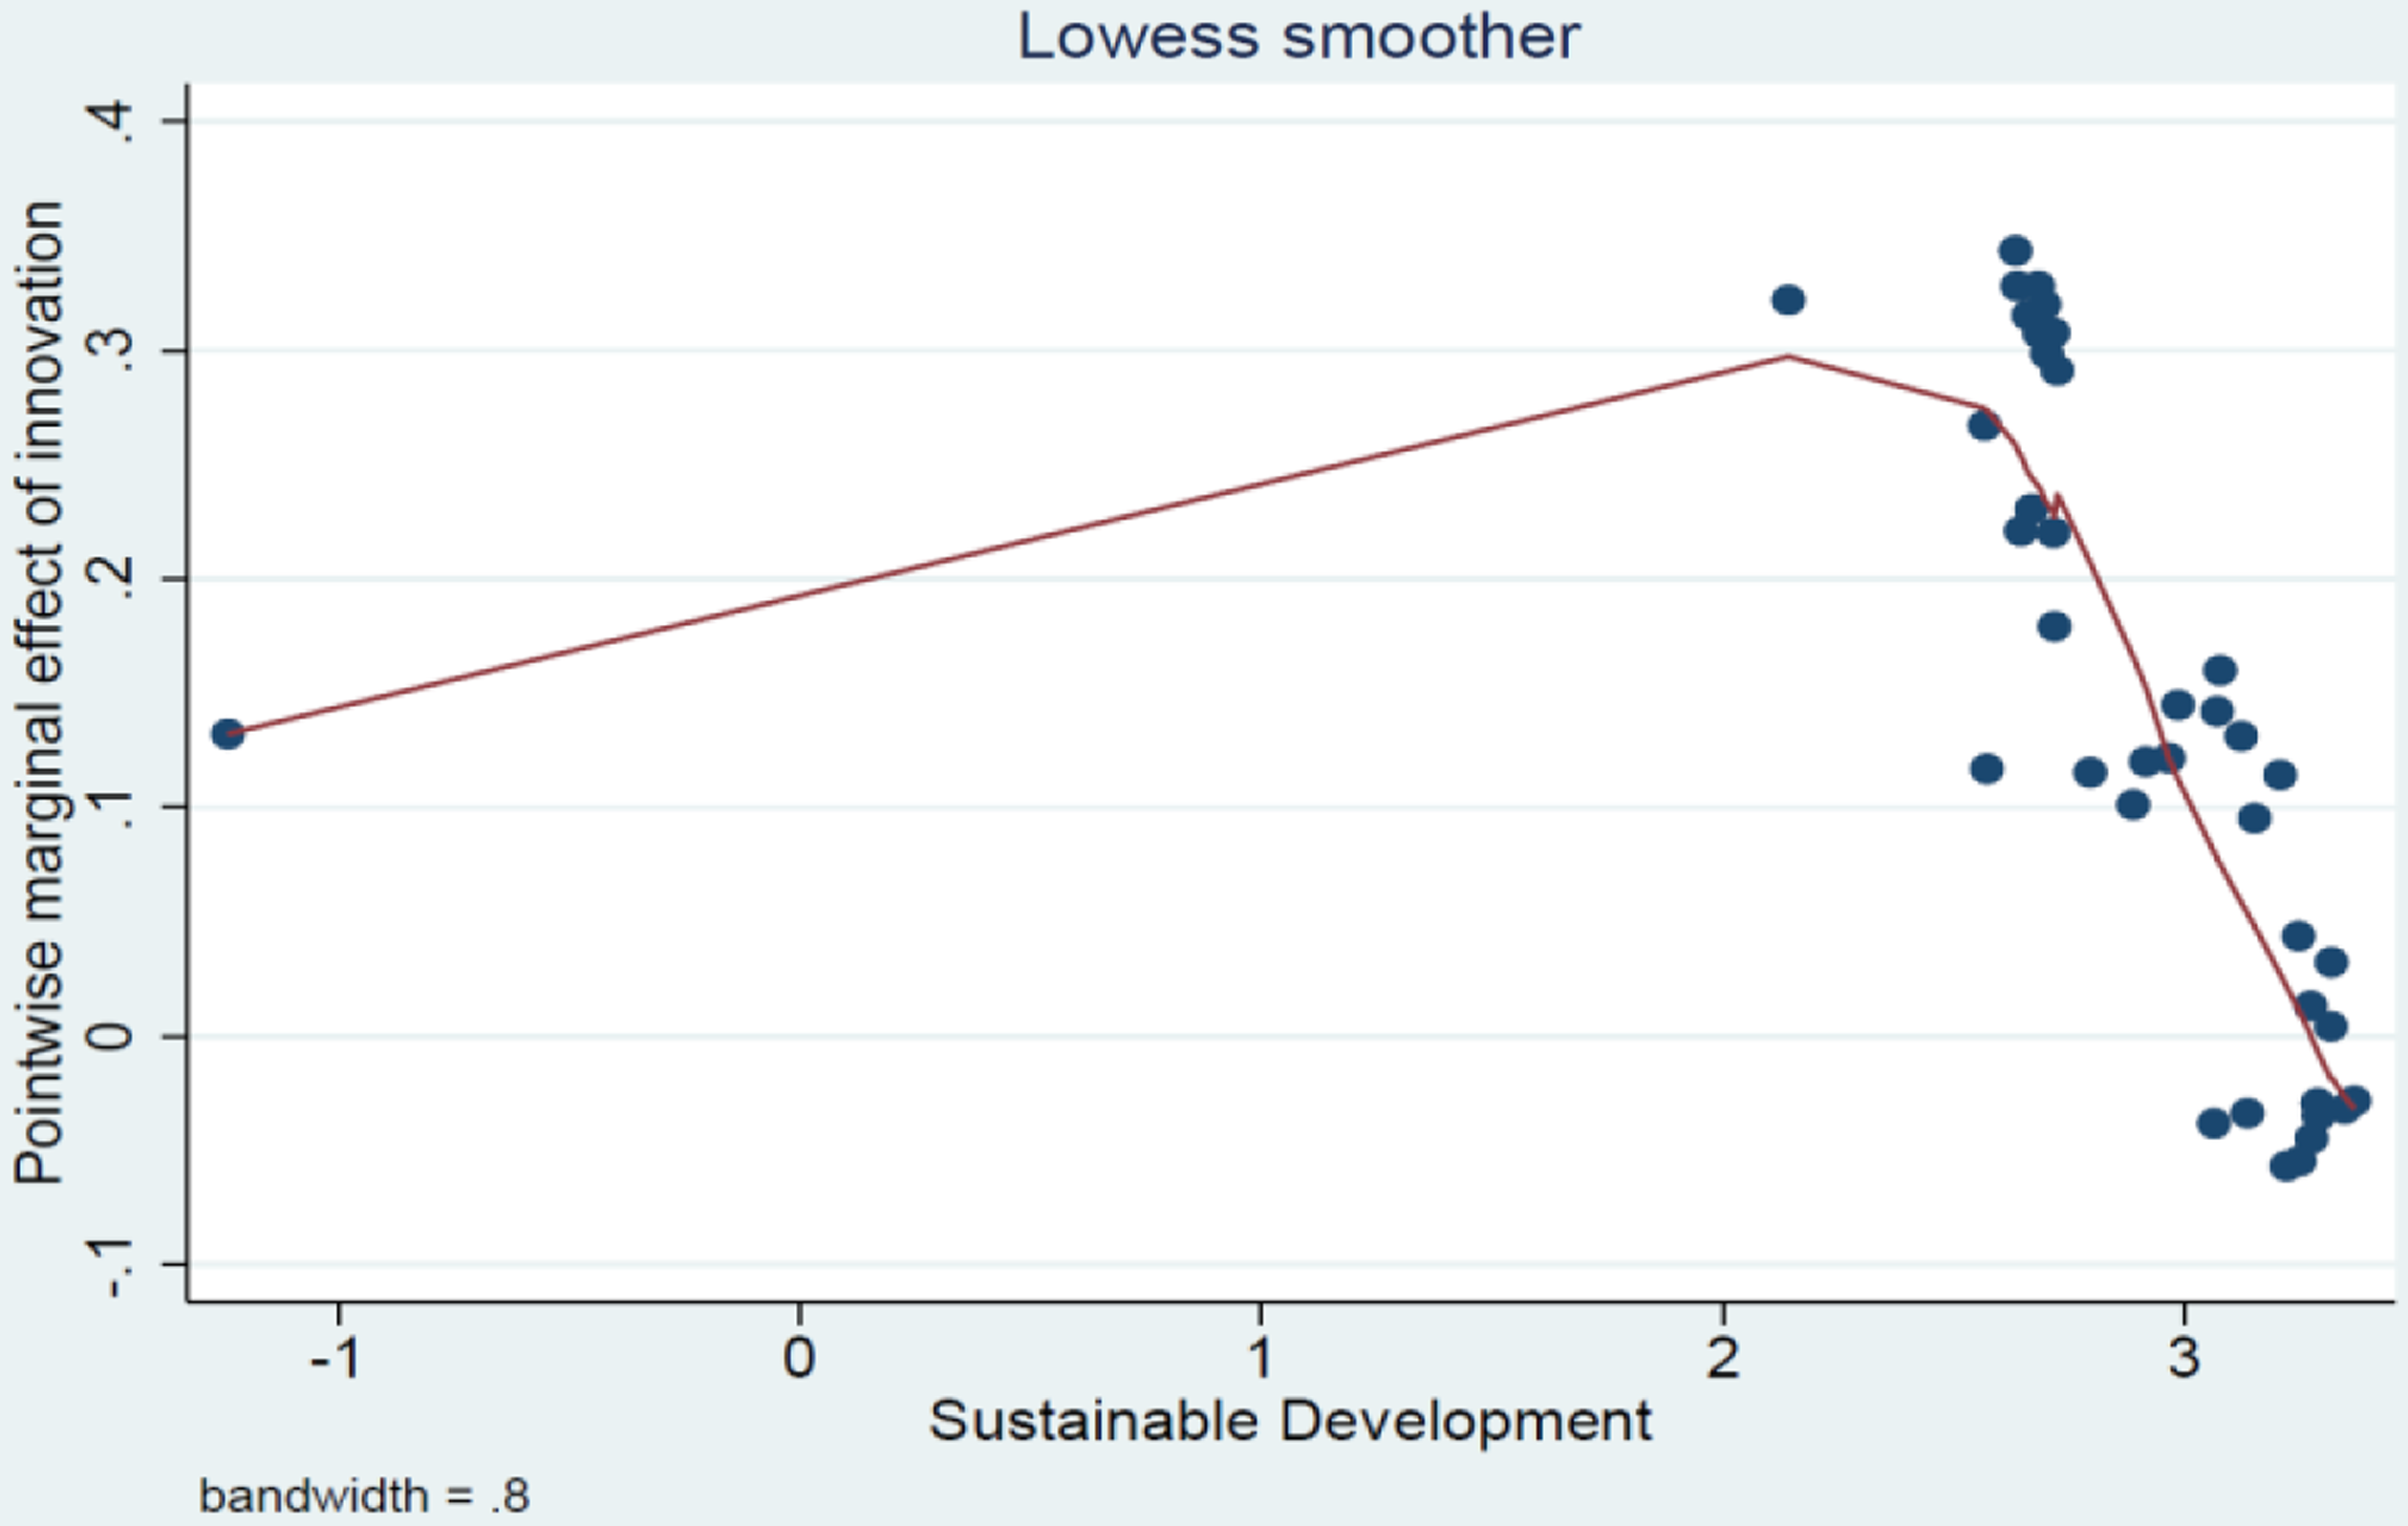
Pointwise marginal effect of trademark innovation.
Pointwise marginal effect of ICT.
Pointwise marginal effect of renewable energy.
Pointwise marginal effect of governance.

Figure 7 depicts that the positive marginal effect of trademark innovation on sustainable development is initially negative. Still, later on, both the positive and negative marginal effects of trademark innovation positively affect sustainable development in Bangladesh.
Figure 8 delineates that ICT’s positive marginal effect is shown to be primarily negative on sustainable development. Subsequently, both positive and negative impacts of ICT promote sustainable development in Bangladesh.
Figure 9 shows that renewable energy’s negative marginal effect causes sustainable development negatively. However, after the primary level, the sustainable development of Bangladesh is positively impacted by both the negative and positive marginal effects of renewable energy.
Figure 10 illustrates that the negative marginal effect of GOV is primarily negative on sustainable development. However, the GOV parameter does not hamper Bangladesh’s sustainable development over all time horizons based on its positive marginal effect after a certain period.
Conclusion and policy implications
Public sector innovation is of no importance if it is not outcome-based in tackling socio-economic problems concerning public health, education, transportation, consumption, and so on (Pratama Reference Pratama2019). Moreover, citizen-friendly public sector policy formulation and implementation ensure sustainability in all spheres of society. Given this, our research scrutinises the role of public sector innovation outcomes, such as trademark innovation, ICT, renewable energy and GOV in the sustainable development of Bangladesh from 1980 to 2019. This research utilises the DARDL simulations, and the KRLS machine learning algorithm approaches to analyse the influencing profiles of public sector innovation outcomes on sustainable development. The findings from the DARDL simulation approach divulge a favourable role of the public sector innovation outcomes except for the GOV phenomenon that adversely affects sustainable development. For robust findings, this study utilises the DARDL simulations area plots and KRLS machine learning technique that establish similar results as found from the DARDL simulations method.
The favourable influencing profiles of public sector innovation outcomes on sustainable development of Bangladesh are primarily associated with the public sector’s different development-oriented policy innovations. The 8th Five Year Plan of the Bangladesh government emphasised supporting public institutions and GOV to satisfy the target of SDGs. Besides, the public sector’s initiative of “Digital Bangladesh” in 2009 has strengthened the digital transformation of public services. In addition, introducing a “national portal” has been significant innovation in Bangladesh’s public sector, whereas e-Service centres have been installed at the District level (WGI 2020). Furthermore, for environmental sustainability, the public sector’s renewable energy project output, especially SHS, has been widespread all over the country. Low-income people even consume renewable energy projects’ fruits (Karim et al. Reference Karim, Karim, Islam, Muhammad-Sukki, Bani and Muhtazaruddin2019). Besides, since 2016, Prime Minister’s Office adopted a2i Project, including the social innovation cluster, which is still working in its “i-lab” on 250 ideas on innovation technology. Among these 250 innovation ideas, 27 have successfully been executed commercially (Islam et al. Reference Islam, Islam, Ahmed and Rumana2021).
Although there is a positive role of public sector innovation outcomes in the sustainable development of Bangladesh, strengthening the quality delivery of service based on the strong cooperation between public agencies and stakeholders is required. Besides, it is necessary to transform the monolithic and hierarchical structure of the public sector into a managerially autonomous unit to bring innovation outcomes to the public’s doors properly. Thus, public sector innovations might be the catalyst to expedite sustainable development in Bangladesh.
The critical innovation criteria of Bangladesh’s public sector include GOV performance. However, unfortunately, Bangladesh’s comparative rank in GOV has only moderately improved in three indicators (e.g. control of corruption, the rule of law and political stability and absence of violence/terrorism) – whereas remaining less than par in other focal indicators (e.g. voice and accountability, government effectiveness and regulatory quality) (WGI 2020). Therefore, it is imperative to tackle the GOV issue to place the fruits of the public sector’s innovation outcomes to the people’s occupation. In this regard, the public sector of Bangladesh needs to develop a strong base of quality institutions that will help strengthen the public sector’s inner incremental development and outcome-based service delivery for the people’s sake. Overall, the public sector’s prudent adoption and implementation of the innovation agenda and cautious dealing with GOV issues under quality institutions are vital to achieving sustainable development in Bangladesh.
Data availability statement
Replication materials are available in the Journal of Public Policy Dataverse at https://doi.org/10.7910/DVN/KNM2GB
Acknowledgements
The authors acknowledge the Bangladesh Institute of Governance and Management (BIGM), Bangladesh, for its support in doing this research work.
Conflict of interest
The authors confirm that the article involves no conflict of interest.
Appendix 1
CUSUM and CUSUM squares tests.