





Introduction
Vegetable production in the United States and Canada is a high-value, intensively managed agricultural sector that is critically dependent on effective weed management (Coleman et al. Reference Coleman, Kristiansen, Sindel and Fyfe2024; Singh et al. Reference Singh, Kaul, Pandey and Bimbraw2019). Many vegetable crops are characterized by slow early-season growth, short stature, wide row spacing, and limited canopy closure, making them particularly vulnerable to weed interference (Bhullar et al. Reference Bhullar, Kaur, Kaur and Yadav2015; Chacko et al. Reference Chacko, Raj and Krishnasree2021; Mennan et al. Reference Mennan, Jabran, Zandstra and Pala2020). Even low weed densities or brief periods of uncontrolled weed growth can lead to substantial yield reductions, reduced product quality, and increased harvesting and grading costs (Chacko et al. Reference Chacko, Raj and Krishnasree2021; Mennan et al. Reference Mennan, Jabran, Zandstra and Pala2020). When weeds are not controlled, their interference in vegetable crops can cause up to 100% yield loss (Roberts Reference Roberts1976; Williams and Masiunas Reference Williams and Masiunas2006). Season-long infestation of velvetleaf (Abutilon theophrasti Medic) at 4 plants m−2 reduced cabbage yield by 92% (Miller and Hopen Reference Miller and Hopen1991). Consequently, weed management remains one of the most critical and costly inputs in commercial vegetable production (Chacko et al. Reference Chacko, Raj and Krishnasree2021; Mennan et al. Reference Mennan, Jabran, Zandstra and Pala2020; Tei and Pannacci Reference Tei and Pannacci2017).
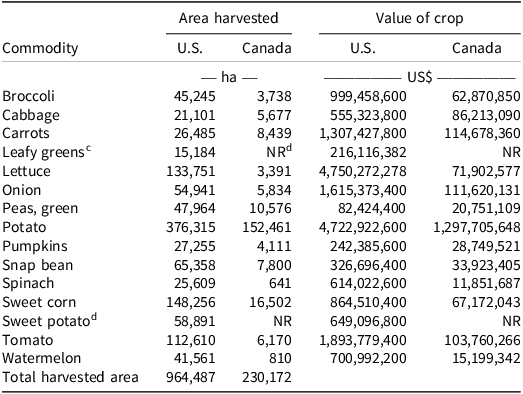
Based on the average harvested hectarage from 2020 to 2024, potato, sweet corn, lettuce, snap bean, tomato, onion, green peas, and broccoli rank among the top 10 vegetable commodities (Table 1) in both the United States (USDA-NASS 2025a, 2026a, 2026b) and Canada (Statistics Canada 2025, 2026). In the United States, potato is the leading vegetable crop, with 376,315 ha harvested and a total economic value of US$4.7 billion. Sweet corn ranks second in area (148,256 ha) with an annual value of US$865 million, followed by tomato, which despite a smaller production area (112,610 ha), generates a higher economic return at US$1.9 billion. Other major vegetable crops include lettuce (133,751 ha, US$4.7 billion), snap bean (65,358 ha, US$327 million), onion (54,941 ha, US$1.6 billion), broccoli (45,245 ha, US$1.0 billion), carrot (26,485 ha, US$1.3 billion), pumpkin (27,255 ha, US$242 million), and cabbage (21,101 ha, US$555 million). In Canada, potato also led in both harvested area (152,461 ha) and economic value (US$1.3 billion). Sweet corn ranked second (16,502 ha, US$67 million), followed by tomato (6,170 ha, US$103 million) and snap bean (7,800 ha, US$34 million). Other significant vegetable crops grown in Canada include cabbage (5,677 ha, US$86 million), carrot (8,439 ha, US$114 million), onion (5,834 ha, US$112 million), broccoli (3,738 ha, US$63 million), and pumpkin (4,111 ha, US$29 million).
The top 10 vegetable crops in Canada and the United States and their economic (farm-gate) value.a,b

Table 1. Long description
The table presents data on the area harvested and the value of various vegetable commodities in the United States and Canada. It includes eight rows and four columns. The columns are labeled ‘Commodity’, ‘Area harvested’, and ‘Value of crop’. The ‘Area harvested’ column is further divided into ‘U.S.’ and ‘Canada’, both measured in hectares. The ‘Value of crop’ column is also divided into ‘U.S.’ and ‘Canada’, both measured in US dollars. The commodities listed include broccoli, cabbage, carrots, leafy greens, lettuce, onion, peas (green), potato, pumpkins, snap bean, spinach, sweet corn, sweet potato, and tomato. Notable trends include potato having the largest harvested area and value in both countries, followed by sweet corn and tomato. Specific values for each commodity in both countries are provided, highlighting the economic significance of these crops.
The geographic concentration of production varies among these commodities, driven by regional climatic and agronomic conditions. For example, tomato and spinach production in the United States is highly concentrated in California, which accounts for 77% and 72% of U.S. acreage, respectively (Figure 1; USDA-NASS 2025b). In contrast, other vegetable crops are more geographically diverse; for example, although California leads in cabbage production (28%), with substantial hectarage in Florida (11%) and New York (11%). Additional examples include snap bean production, which is concentrated in Wisconsin (27%), followed by Florida (17%) and New York (12%); and sweet corn production, which is more broadly distributed across Minnesota (21%), Washington (15%), Florida (12%), and Wisconsin (12%) (USDA-NASS 2025b).
Maps of the United States that represent where seven vegetable crops are grown.

Vegetable production in Canada is concentrated in the provinces of Ontario and Quebec, with the degree of concentration varying among crops (Figure 2; Statistics Canada 2025). Quebec produces the most lettuce (88%), spinach (67%), fresh cabbage (52%), and onion (45%), whereas Ontario accounts for at least 30% of these crops. Ontario leads Canadian production of tomato (92%), watermelon (91%), fresh peas (54%) green and wax bean (49%), sweet corn (49%), and carrot (44%), with Quebec accounting for at least 30% of the production hectarage.
Maps of Canada that represent where six vegetable crops are grown.

Most previous weed loss assessments by the Weed Science Society of America (WSSA) Yield Loss Committee have focused on agronomic field crops, including canola (Brassica napus L.), corn (Zea mays L.), dry bean (Phaseolus lunatus L.), grain sorghum [Sorghum bicolor (L.) Moench], soybean [Glycine max (L.) Merr.], and wheat (Triticum aestivum L.) (Dille et al. Reference Dille, Stahlman, Thompson, Bean, Soltani and Sikkema2020; Flessner et al. Reference Flessner, Burke, Dille, Everman, VanGessel, Tidemann, Manuchehri, Soltani and Sikkema2021; Geddes et al. Reference Geddes, Tidemann, Ikley, Dille, Soltani and Sikkema2022; Oerke Reference Oerke2006; Oerke et al. Reference Oerke, Dehne, Schonbeck and Weber2012; Singh et al. Reference Singh, Kukal, Irmak and Jhala2022; Soltani et al. Reference Soltani, Dille, Burke, Everman, VanGessel, Davis and Sikkema2016, Reference Soltani, Dille, Burke, Everman, VanGessel, Davis and Sikkema2017, Reference Soltani, Dille, Gulden, Sprague, Zollinger, Morishita, Lawrence, Sbatella, Kniss, Jha and Sikkema2018a). Despite the well-recognized importance of weeds as a major cause of crop loss in vegetable production, comprehensive, quantitative estimates of yield and economic losses attributable to weed interference at regional and national scales remain limited. One notable exception is potato, for which Ganie et al. (Reference Ganie, Soltani, McKenzie-Gopsill, Felix, Hutchinson, Dille and Sikkema2023) reported yield losses ranging from 12% to 61% due to weed interference. The lack of quantitative assessments for other vegetable crops represents a significant knowledge gap, given their high economic value, importance to human nutrition, and sensitivity to early-season weed interference.
Vegetable yield loss due to weed interference is influenced by complex interactions among crop competitiveness, weed species composition, the relative timing of weed and crop emergence, production system (e.g., plasticulture vs. bare-ground; fresh market vs. processing), and environmental conditions (Bhullar et al. Reference Bhullar, Kaur, Kaur and Yadav2015; Chacko et al. Reference Chacko, Raj and Krishnasree2021; Mennan et al. Reference Mennan, Jabran, Zandstra and Pala2020; Sankula et al. Reference Sankula, Everts, Whalen and VanGessel2024). Experimental studies consistently identify early-season weed interference as the primary driver of yield loss in vegetable crops, with uncontrolled infestations reducing yields by 20% to 100% depending on the crop and production system (Mennan et al. Reference Mennan, Jabran, Zandstra and Pala2020; Roberts Reference Roberts1976; Williams and Masiunas Reference Williams and Masiunas2006). However, these estimates are largely derived from individual field trials and are seldom extrapolated to regional or national scales. Robust, quantitative assessments of the biological and economic impacts of weed interference at broader spatial scales are needed to make informed decisions on food policy, resource allocations for research, management and control of weeds, and providing a basis for the importance of weeds in relation to agriculture production (Walker Reference Walker1983).
The objective of this study, conducted by the WSSA Weed Loss Committee, was to quantify potential yield and economic losses from uncontrolled weeds in major vegetable crops across Canada and the United States. Using multiyear production data (2020 to 2024 averages) and yield loss derived from weed management trials, this study estimates annual production losses and associated economic impacts for representative crops, including cabbage, snap bean, sweet corn, tomato, watermelon, leafy greens, and spinach. Previous efforts to document yield loss across Canada and the United States has not relied upon quantitative data (Bridges Reference Bridges1992; Chandler et al. Reference Chandler, Hamill and Thomas1984; Swanton et al. Reference Swanton, Harker and Anderson1993).
Materials and Methods
Seven vegetable crops were selected to represent a range of botanical families, growth habits, and anticipated availability of weed-related yield loss data. The crops were cabbage, snap bean, sweet corn, tomato, watermelon, leafy greens, and spinach. Collectively, these crops represented more than 50% of the total harvested vegetable hectarage in Canada and the United States in 2020 to 2024. The leafy greens category included kale (Brassica oleracea L.), collards (B. oleracea L.), turnip greens (B. rapa L.), and mustard greens (B. juncea L.).
Requests for data were sent to weed science researchers and extension specialists across Canada and the United States. Contributors provided data from a range of weed control studies conducted on the selected vegetable crops. Most of these studies were herbicide efficacy trials but also included weed interference trials and organic weed control trials. Additional data were obtained from the IR-4 Project Food Crops Database (IR-4 Project 2026), weed control research reports, and peer-reviewed scientific publications. Data for tomato and watermelon were identified as either bare-ground or plastic-mulch systems due to differences in weed control practices. All weed loss estimates were compiled into a single data set covering studies conducted from 2000 through 2024.
For each study, weedy yield was defined as the average yield from nontreated plots, while weed-free yield was defined as the average yield from plots maintained under best management practices with excellent weed control (greater than 95% weed control). Yield loss (%) was calculated for each trial using the following formula:
 ${Yield\ loss\ (\%)} = {{{weed \ free\ yield}} - {weedy\ yield} \over {weed\ free\ yield}}\times 100$
Yield loss values were averaged by crop for each country, then by year, and finally across years, this process has been used for other commodities and pests (e.g., Dille et al. Reference Dille, Stahlman, Thompson, Bean, Soltani and Sikkema2020; Ganie et al. Reference Ganie, Soltani, McKenzie-Gopsill, Felix, Hutchinson, Dille and Sikkema2023; Soltani et al. Reference Soltani, Dille, Burke, Everman, VanGessel, Davis and Sikkema2016; Walker Reference Walker1983).
Total harvested area (hectares), yield (kilograms per hectare), total production (kilograms), and average commodity price (US$ kg⁻1) were obtained from the U.S. Department of Agriculture–National Agricultural Statistics Service (USDA-NASS 2025a) or Agriculture and Agri-Food Canada (2025). National averages were used due to the limited availability of state- or province-level data. Monetary losses were calculated as the product of estimated yield loss and the average commodity price for 2020 to 2024 (Statistics Canada 2025; USDA-NASS 2025a), except for leafy greens, for which we used data from 2000 and 2001 (the last year data were collected for these crops) with economic values adjusted for inflation (US Department of Labor, 2026). USDA–NASS reports production and commodity price by fresh market or processing, whereas Agriculture and Agri-Food Canada do not provide this information.
The estimated price of a weed control program was calculated based on treatments provided in the IR-4 Food Use database, published crop profiles, and state and regional extension recommendation guides. This included herbicide cost, cost of application, cost of incorporation (if required), and cost of cultivation. Cost of plastic mulch for tomato and watermelon production was not included since this practice has many benefits beyond weed control (soil warming, cleaner fruit, facilitating drip irrigation, disease management, etc.). Shielded sprayers for plastic mulch systems allow for an additional herbicide application often not used for bare-ground production. Interrow cultivation is not used with plastic mulch systems but is a practice often used with bare-ground production.
Results and Discussion
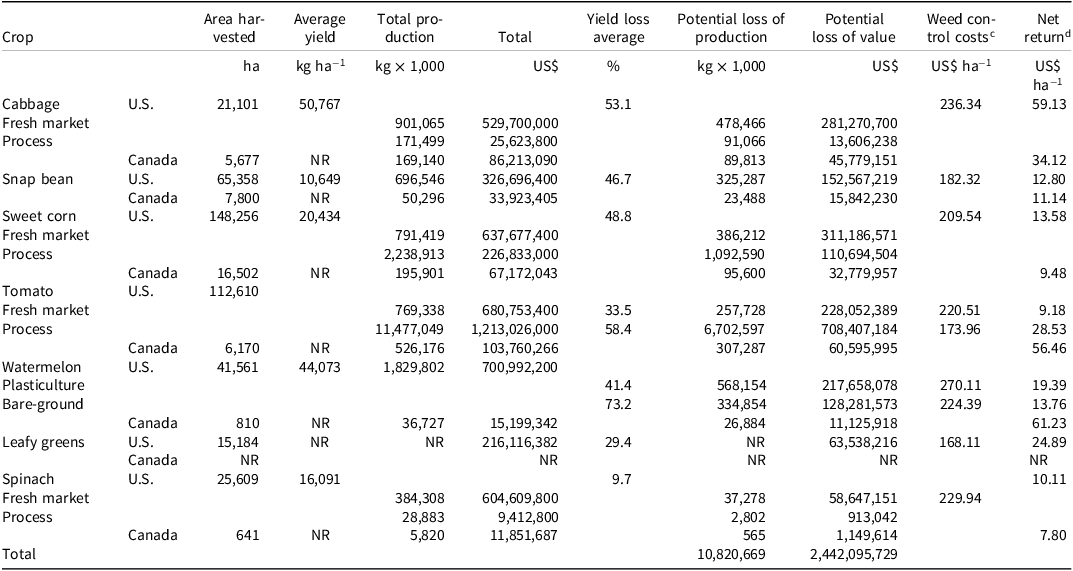
Weed interference resulted in substantial yield and monetary losses across all seven vegetable crops evaluated in Canada and the United States. Average yield loss ranged from 10% to 73% (Table 2). Estimated potential annual production losses attributable to weeds for the seven vegetables crops were 10,820,669,000 kg, corresponding to a potential monetary loss of approximately US$2.4 billion.

Table 2. Long description
The table presents data on vegetable crop yield losses due to weeds in Canada and the U.S. It includes columns for crop, area harvested, average yield, total production, yield loss average, potential loss of production, potential loss of value, weed control costs, and net return. The table has 11 rows and 9 columns. Row 1: Crop, Area harvested, Average yield, Total production, Yield loss average, Potential loss of production, Potential loss of value, Weed control costs, Net return. Row 2: Cabbage U.S., 21,101, 50,767, 901,065, 529,700,000, 53.1, 478,466, 281,270,700, 236.34, 59.13. Row 3: Fresh market Process Canada, 5,677, NR, 171,499, 25,623,800, 91,066, 13,606,238, 89,813, 45,779,151, 34.12. Row 4: Snap bean U.S., 65,358, 10,649, 696,546, 326,696,400, 46.7, 325,287, 152,567,219, 182.32, 12.80. Row 5: Snap bean Canada, 7,800, NR, 50,296, 33,923,405, 23,488, 15,842,230, 182.32, 11.14. Row 6: Sweet corn U.S., 148,256, 20,434, 791,419, 637,677,400, 48.8, 386,212, 311,186,571, 209.54, 13.58. Row 7: Fresh market Process Canada, 16,502, NR, 2,238,913, 226,833,000, 1,092,590, 110,694,504, 95,600, 32,779,957, 9.48. Row 8: Tomato U.S., 112,610, NR, 769,338, 680,753,400, 33.5, 257,728, 228,052,389, 220.51, 9.18. Row 9: Process Canada, 6,170, NR, 11,477,049, 1,213,026,000, 58.4, 6,702,597, 708,407,184, 173.96, 28.53. Row 10: Watermelon U.S., 41,561, 44,073, 1,829,802, 700,992,200, 41.4, 568,154, 217,658,078, 270.11, 19.39. Row 11: Plasticulture Bare-ground Canada, 810, NR, 36,727, 15,199,342, 73.2, 334,854, 128,281,573, 224.39, 13.76. Row 12: Leafy greens U.S., 15,184, NR, NR, 216,116,382, 29.4, NR, 63,538,216, 168.11, 24.89. Row 13: Spinach U.S., 25,609, 16,091, 384,308, 604,609,800, 9.7, 37,278, 58,647,151, 229.94, 10.11. Row 14: Fresh market Process Canada, 641, NR, 28,883, 9,412,800, 565, 913,042, 1,149,614, 7.80. Row 15: Total, 327,000, NR, 3,800,000, 10,820,669,000, NR, 10,820,669, 2,442,095,729, NR, NR.
a Abbreviation: NR, not reported.
b Data are averages from 2020 to 2024, unless otherwise noted. Data sources: USDA-NASS (2025, 2026a); AAFC (2025).
c Weed control costs are an estimated price of a basic weed control program that includes the cost of herbicides, application, soil incorporation (if required), and cultivation. Weed control practices and costs are assumed to be similar in both Canada and the United States. Production practices are also assumed to be similar for processing and fresh market production systems in both countries.
d The net return for each $US1 invested in weed management.
The largest U.S. production losses were associated with tomato (processing and fresh market combined) and sweet corn, reflecting both their large, planted areas and high total production (Table 2). Yield losses were greater in processing tomato (58%) than in fresh market tomato production (34%), suggesting the need for unique weed management strategies across these production systems. Notably, processing tomatoes are grown on bare ground without plant support, whereas fresh market production relies on transplants established in plasticulture systems with plants maintained upright using wooden stakes and twine (Wyenandt and van Vuuren Reference Wyenandt and van Vurren2026). Hillger et al. (Reference Hillger, Weller, Maynard and Gibson2006) previously reported that different tomato production systems can influence the persistence and dominance of specific weed species, some of which may have a greater potential to reduce crop yield than others. Processing tomatoes alone accounted for an estimated 6.7 billion kg of lost production, valued at US$708 million, while fresh-market tomato losses were estimated at 258 million kg with a value of US$228 million. In Canada, tomatoes incurred the greatest monetary losses due to weeds, totaling approximately US$61 million. Published research results highlight the variability in yield loss across both production systems. Studies from California have reported 9% to 20% yield reduction for processing tomatoes under season-long pressure from annual weeds (Shrestha et al. Reference Shrestha, Mitchell and Lanini2007; Sutton et al. Reference Sutton, Lanini, Mitchell and Miyao2006). Sosnoskie and Hanson (Reference Sosnoskie and Hanson2016) showed that ineffective control of field bindweed (Convolvulus arvensis L.) reduced yields by 49%. Similarly, Mohseni-Moghadam and Doohan (Reference Mohseni-Moghadam and Doohan2017) reported up to 49% yield losses of processing tomato due to annual broadleaf weed interference in Ohio.
Weeds reduced sweet corn yield by 49%, similar to yield reductions reported for field corn (Soltani et al. Reference Soltani, Dille, Burke, Everman, VanGessel, Davis and Sikkema2016). Estimated yield losses reached 1.1 billion kg and 386 million kg for processing and fresh market sweet corn, respectively, corresponding to monetary losses of US$111 million and US$311 million, respectively. Survey data from 175 processing sweet corn fields in the North Central United States indicated that weed interference was widespread, with 57% of fields exhibiting some level of yield loss even though weed control was used in these fields (Williams et al. Reference Williams, Rabaey and Boerboom2008). Yield loss due to uncontrolled weeds in sweet corn in Canada accounted for 96 million kg and US$33 million.
Cabbage was severely affected by weed interference, with yield losses averaging 53% (Table 2). Total U.S. cabbage production averaged approximately 1.1 billion kg, with estimated losses of 570 million kg valued at US$295 million, while in Canada, losses were estimated at 90 million kg, corresponding to US$46 million. Cabbage is highly susceptible to weed interference; even low weed densities, such as velvetleaf at 1 plant m⁻2, can reduce yield by 52% to 76% (Miller and Hopen Reference Miller and Hopen1991). When compared to insect and disease pests, weeds were identified as the most significant constraint to achieving high cabbage yields (Tolman et al. Reference Tolman, McLeod and Harris2004). Across three studies, Brainard et al. (Reference Brainard, Bellinder and Miller2004) reported cabbage yield losses in the weedy check relative to the weed-free control ranging from 19% to 65%, depending on year and experimental conditions. Pineda-Bermudez et al. (Reference Pineda-Bermudez, Besançon and Sosnoskie2023) reported cabbage yield loss of 54% to 73% in response to season-long weed interference in New Jersey when compared to effective herbicide programs.
Snap bean yield losses due to weed interference (47%) were similar to those reported for sweet corn and cabbage (Table 2). This level of weed interference resulted in estimated production losses of 325 million kg in the United States (US$153 million) and 24 million kg in Canada (US$16 million). Weeds present at harvest have been documented in snap bean production despite the implementation of best management practices (Pavlovic et al. Reference Pavlovic, Colquhoun, Korres, Landau, Liu, Lowry, Martin, Peachey, Scott, Sosnoskie, VanGessel and Williams2025), underscoring the need to further optimize weed management strategies, particularly given the high economic value of snap bean in the United States and Canada.
Like tomato, watermelon yield losses in the United States varied markedly by production system, with greater losses in bare-ground production (73%) than under plasticulture (41%), resulting in a combined production and value loss of 903 million kg and US$346 million, respectively. In Canada, watermelon losses were estimated at 27 million kg (US$11 million). Watermelon is particularly susceptible to weed interference due to low planting density, wide row spacing, slow initial growth, and prostrate growth habit (Larson et al. Reference Larson, Mossler and Nesheim2004). Vine growth habit further complicates weed control by hindering mechanical weed control and herbicide application between the rows. Based on input from U.S. extension specialists, approximately 75% of the U.S. production uses polyethylene mulch. Growers commonly use polyethylene-covered beds that can suppress within-row weed growth, thereby reducing overall weed interference and associated yield losses (Lament Reference Lament1993). However, weeds can still emerge through the planting holes or damaged areas in the plastic mulch (Webster Reference Webster2005).
Spinach losses in the United States due to weed interference was the lowest of the crops in our study (10%) but still resulted in a reduction of 40 million kg production, valued at approximately US$60 million in lost value (Table 2). In Canada, spinach losses were estimated at 565,000 kg valued at US$1.1 million. The modest yield losses in spinach likely reflect its rapid growth cycle as well as narrow row spacing combined with high planting density, which limits crop exposure to weed interference (Fennimore et al. Reference Fennimore, Smith and McGiffen2001). Because of low tolerance for weed contamination in harvested spinach and the limited availability of effective herbicides, growers rely on proactive weed management strategies that include selecting fields with low weed pressure, cultivation, and hand weeding (Fennimore et al. Reference Fennimore, Smith and McGiffen2001; Smith et al. Reference Smith, LeStrange and Fennimore2001).
The leafy greens category (kale, collards, turnip greens, and mustard greens) was represented only by hectarage data; however, using historical crop values adjusted to 2024 dollars, the estimated monetary loss reached US$64 million. Slow emergence and early growth, combined with their short stature and a thin canopy, make leafy green crops highly susceptible to weed interference. Consequently, growers typically rely on cultivation and hand-weeding because few effective herbicide options are available (Fennimore and Doohan Reference Fennimore and Doohan2008).
This study demonstrates that in the absence of effective weed management, yield losses ranged from 10% for spinach to 73% for bare-ground watermelon (Table 2). Average yield losses due to weeds reported in the present study are greater than those documented in earlier qualitative surveys in the United States and Canada (Chandler et al. Reference Chandler, Hamill and Thomas1984; Swanton et al. Reference Swanton, Harker and Anderson1993), except for spinach. In those earlier studies, average yield losses were based on expert opinion of weed scientists asked to estimate losses under typical weed management practices. Estimated yield losses for cabbage, snap bean, sweet corn, tomato, and watermelon were all 10% or less. In contrast, the estimated yield loss for spinach in the present study (10%) was lower than the 18% reported by Chandler et al. (Reference Chandler, Hamill and Thomas1984). Similarly, Swanton et al. (Reference Swanton, Harker and Anderson1993) reported 11%, 11%, 6%, and 2% average yield losses due to weeds in cabbage, sweet corn, tomato, and spinach, respectively, in eastern Canada.
Estimated crop yield losses in the present study correspond to an estimated annual production loss of approximately 10.8 billion kg and an associated economic loss of about US$2.4 billion across the seven crops in the United States and Canada. These losses can be avoided by investing an additional US$168 to US$270 ha−1 in weed control strategies (Table 2). This corresponds to a net return of US$59, $13, $14, $48, $31, $24, and $10 for every US$1 invested in weed management for cabbage, snap bean, sweet corn, tomato, watermelon, leafy greens, and spinach, respectively, in the United States. In Canada, every US$1 spent on weed control in cabbage, snap bean, sweet corn, tomato, and watermelon can provide a net return of US$33, $11, $10, $50, and $51, respectively. Net return for every US$1 invested for weed control in sugar beet was US$23 (Soltani et al. Reference Soltani, Dille, Robinson, Sprague, Morishita, Lawrence, Kniss, Jha, Felix, Nurse and Sikkema2018b). These findings emphasize the critical importance of effective weed management in vegetable production and highlight the need for continued research to develop long-term, sustainable integrated weed management (IWM) systems tailored to the diverse producing regions of North America. By integrating experimental and national-scale data sets, this study provides the first comprehensive assessments of the impacts of weed interference in Canadian and U.S. vegetable production systems.
Practical Implications
The magnitude of yield and economic losses observed across seven major vegetable crops in the United States and Canada underscores that weed management is a critical component of profitable vegetable crop production. Individual trials documenting yield loss are very useful, but analyzing data on a national scale provides a broader perspective on the impact weeds have on yield and economics of vegetable production. With potential annual yield reductions ranging from 10% to 73% and an estimated 10.8 billion kg of lost production valued at approximately US$2.4 billion, these results suggest that even modest improvements in weed control efficiency could generate substantial economic returns for the vegetable industry.
Inadequate weed control can lead to vegetable fields being unharvested because of reduced harvest efficiency (Roberts Reference Roberts1976; M.J. VanGessel, personal observation). Many of the studies included in the data set were hand-harvested; however, in commercial systems, fields with poor weed control are often left unharvested or experience reduced crop recovery. Thus, the yield losses reported here may underestimate actual yield and economic losses.
For large-hectare, high-value crops such as tomato and sweet corn, these results highlight the need to prioritize early-season weed control and maintain weed-free conditions during crop establishment. Tomato alone accounted for nearly US$1 billion in potential losses, while sweet corn losses were US$455 million under unmanaged conditions. These findings underscore the importance of timely preemergence and postemergence weed control and the adoption of improved technologies to protect yield and crop value.
Substantial losses in cabbage, snap bean, and watermelon further underscore the importance of crop and system-specific weed management programs. In watermelon, greater losses under bare-ground production than under plasticulture highlight the value of mulches and intensified row-middle management as part of IWM programs. Cabbage and snap bean are very sensitive to early-season weed interference, so effective weed control during the first few weeks after planting is essential to prevent irreversible yield losses. The limited availability of effective options to control established weeds in these and many other vegetable crops further reinforces this reliance on early-season weed management.
Although leafy vegetables represent a smaller share of overall production, their high market value means that even modest yield reductions can result in substantial economic losses. The present study did not include lettuce, another crop with high farm-gate value. Even a modest yield loss of 3% would result in US$145 million annual loss (Swanton et al. Reference Swanton, Harker and Anderson1993).
The estimated US$2.4 billion in losses across these seven vegetable crops exceeds the estimated losses for potato, wheat, sorghum, sugar beet, or dry bean, despite those crops occupying much larger harvested area (Dille et al. Reference Dille, Stahlman, Thompson, Bean, Soltani and Sikkema2020; Flessner et al. Reference Flessner, Burke, Dille, Everman, VanGessel, Tidemann, Manuchehri, Soltani and Sikkema2021; Ganie et al. Reference Ganie, Soltani, McKenzie-Gopsill, Felix, Hutchinson, Dille and Sikkema2023; Soltani et al. Reference Soltani, Dille, Gulden, Sprague, Zollinger, Morishita, Lawrence, Sbatella, Kniss, Jha and Sikkema2018a, Reference Soltani, Dille, Robinson, Sprague, Morishita, Lawrence, Kniss, Jha, Felix, Nurse and Sikkema2018b). This illustrates the high economic significance of vegetable crops within the agricultural farm economy.
Collectively, these findings support the continued development and adoption of IWM practices that combine cultural, mechanical, biological, and chemical weed control tactics. They also reinforce the need for sustained investment in weed science research, extension, and technology transfer to ensure long-term productivity, profitability, and sustainability of vegetable production systems across Canada and the United States.
Acknowledgments
We thank the members of the WSSA Weed Loss Committee for their valuable input in this report and the IR-4 Project for providing access to the Food Crops Database.
Funding
This research received no specific grant from any funding agency, commercial or not-for-profit sectors. The Weed Science Society of America covered publication costs of this manuscript.
Competing Interests
The authors have no competing interests.



 Open access

