1 Introduction
Geodesic acoustic modes (GAMs) (Winsor, Johnson & Dawson Reference Winsor, Johnson and Dawson1968) are linear ideal MHD modes driven by anisotropic pressure perturbation of ions. They are characterized by toroidal mode number $N=0$ and poloidal mode number $M=0$
 combined with $M= \pm 1 , \pm 2$
 side-bands. Eigenmodes in the geodesic frequency range have been theoretically analysed and experimentally observed during tokamak ohmic discharges (Melnikov et al. Reference Melnikov, Eliseev, Perfilov, Lysenko, Shurygin, Zenin, Grashin, Krupnik, Kozachek and Solomatin2015; Askinazi et al. Reference Askinazi, Belokurov, Bulanin, Gurchenko, Gusakov, Kiviniemi, Lebedev, Kornev, Korpilo and Krikunov2017), ion cyclotron resonance (ICRH) (Berk et al. Reference Berk, Boswell, Borba, Figueiredo, Johnson, Nave, Pinches and Sharapov2006) and neutral beam (NB) heating discharges, when driven by the anisotropic pressure of energetic ions (Fu Reference Fu2008; Nazikian et al. Reference Nazikian, Fu, Austin, Berk, Budny, Gorelenkov, Heidbrink, Holcomb, Kramer and McKee2008), or for a pre-existent GAM during ohmic discharge modified by the presence of energetic ions (de Souza et al. Reference de Souza, Elfimov, Galvão, Krbec, Seidl, Stockel, Hron, Havlicek and Mitosinkova2017).
GAMs are important in the tokamak dynamics because they may drive anomalous plasma transport and energetic ions loss, as has been theoretically established (Hallatschek & Biskamp Reference Hallatschek and Biskamp2001; Diamond et al. Reference Diamond, Itoh, Itoh and Hahm2005) and experimentally observed (Berk et al. Reference Berk, Boswell, Borba, Figueiredo, Johnson, Nave, Pinches and Sharapov2006; Conway Reference Conway2008; Nazikian et al. Reference Nazikian, Fu, Austin, Berk, Budny, Gorelenkov, Heidbrink, Holcomb, Kramer and McKee2008; Conway et al. Reference Conway, Angioni, Ryter, Sauter and Vicente2011). Furthermore, they may be useful as a diagnostic tool to indicate the low-to-high (L–H) confinement transition (Conway Reference Conway2008; Conway et al. Reference Conway, Angioni, Ryter, Sauter and Vicente2011) in tokamaks.
According to the early theoretical models, in discharges with NB injection, the GAM instability can be driven due to an inhomogeneous dependence on the pitch angle distribution in velocity space (Fu Reference Fu2008; Qiu, Zonca & Chen Reference Qiu, Zonca and Chen2010; Zarzoso et al. Reference Zarzoso, Garbet, Sarazin, Dumont and Grandgirard2012). The energetic ion model was used in the form of a slowing down (Stix Reference Stix1972) distribution. Two kinds of geodesic modes were found, namely, the standard GAM and the energetic-particle-induced geodesic acoustic mode (EGAM), which may appear above some critical energetic ion density with frequency close to half of the thermal GAM solution. The new EGAM dispersion relation and the eigenmode for a slowing down distribution function are found numerically (Fu Reference Fu2008) and analytically (Qiu et al. Reference Qiu, Zonca and Chen2010), however, without a detailed analysis of the radial behaviour of the dispersion relation.
A wide range of eigenmodes species is observed in the local maximum or minimum of the dispersion relation for Alfvénic (Cheng, Chen & Chance Reference Cheng, Chen and Chance1985; Cheng & Chance Reference Cheng and Chance1986; Sharapov et al. Reference Sharapov, Alper, Berk, Borba, Breizman, Challis, Fasoli, Hawkes, Hender and Mailloux2002; Heidbrink Reference Heidbrink2008) or geodesic modes (Berk et al. Reference Berk, Boswell, Borba, Figueiredo, Johnson, Nave, Pinches and Sharapov2006; Lakhin & Sorokina Reference Lakhin and Sorokina2014). In recent studies, it was proposed that the EGAM can also lie on the extrema of the dispersion relation in early beam discharges (Qu, Hole & Fitzgerald Reference Qu, Hole and Fitzgerald2017), before energetic particles are completely slowed down. EGAM is important since it can degrade energetic particle confinement as shown in the DIII-D experiments (Nazikian et al. Reference Nazikian, Fu, Austin, Berk, Budny, Gorelenkov, Heidbrink, Holcomb, Kramer and McKee2008) and may also affect the thermal plasma confinement through the zonal flow effect. Finally, EGAM is excited in burning plasmas since auxiliary heatings such as neutral beam heating can produce highly anisotropic energetic particle distribution.
In this work, we analyse the conditions for the formation of the EGAM eigenmode at the maximum of the dispersion relation. The thermal plasma particles are treated using a kinetic formulation, with the formal addition of side-band corrections calculated by the MHD code NOVA (Cheng & Chance Reference Cheng and Chance1987), to provide an accurate thermal GAM frequency. The effect of a minor concentration of energetic ions in the dispersion relation is included using a kinetic description, for single pitch angle with slowing down distribution function, reproducing conditions of NB injection discharges.
In comparison to previous investigations (Fu Reference Fu2008; Qiu et al. Reference Qiu, Zonca and Chen2010; Qu et al. Reference Qu, Hole and Fitzgerald2017), our model considers the situation in which the thermal GAM frequency for thermal particles is close to the energetic-ion toroidal transit frequency, creating the condition when the EGAM frequency is located slightly below it. Although the model of (Qiu et al. Reference Qiu, Zonca and Chen2010) involves the EGAM source employing a sharp distribution and the model of (Qu et al. Reference Qu, Hole and Fitzgerald2017) is restricted to the early beam scenario before the slowing down time, the new feature of our model is that the eigenmode is expected to be present after the slowing down time, in cases with reverse safety factor $q$ profile, where a small concentration of energetic ions can produce an off-axis maximum in the GAM dispersion relation, which is required for its appearance.
The model is applied to a DIII-D plasma, where we have the necessary conditions to observe the global EGAM. An accurate calculation of the dispersion relation is performed to match the experimental measurements.
2 GAM dispersion relation for thermal particles
The ideal MHD model predicts that the GAM dispersion relation is given by (Winsor et al. Reference Winsor, Johnson and Dawson1968)

where $p$ is the plasma pressure, $\varrho$
 is the density, $R_0$
 the major radius, $q$
 the safety factor and $\gamma$
 is the adiabatic index.
The fully MHD code NOVA (Cheng & Chance Reference Cheng and Chance1987) was used to correct the GAM dispersion relation for accurate description, based on the MHD equations:

where $\psi$ is the poloidal magnetic flux, $\xi _S \equiv \boldsymbol {\xi } \boldsymbol {\cdot } | \boldsymbol {B} \times \boldsymbol{\nabla} \psi | /|\boldsymbol{\nabla} \psi |^{2}$
 ,$\boldsymbol {\xi }$
 is the plasma displacement, $k_S \equiv 2 \boldsymbol {k} \boldsymbol {\cdot } | \boldsymbol {B} \times \boldsymbol{\nabla} \psi | / |\boldsymbol{\nabla} \psi |^{2}$
 , and $\boldsymbol {k}$
 and $\boldsymbol {B}$
 are the vector of magnetic curvature and field.
The frequencies computed by NOVA are similar to those predicted by (2.1), but modified by sideband corrections. No further corrections are included such as due to different electron and ion temperatures, plasma rotation or the effect of impurities. The adiabatic index $\gamma$ in MHD equals $5/3$
 , but it is a free parameter inside NOVA and can be modified as needed to accommodate other corrections. The NOVA code (Cheng et al. Reference Cheng, Chen and Chance1985; Cheng & Chance Reference Cheng and Chance1986), together with its kinetic extension NOVA-K (Gorelenkov et al. Reference Gorelenkov, Cheng and Fu1999), is largely used to study Alfvénic, low frequency acoustic Alfvén-acoustic branches (Gorelenkov et al. Reference Gorelenkov, Berk, Fredrickson and Sharapov2007) as well other types of modes (Cheng & Chance Reference Cheng and Chance1987).
However, in the kinetic formulation, the GAM dispersion relation is given by (Lebedev et al. Reference Lebedev, Yushmanov, Diamond, Novakovskii and Smolyakov1996)

where $\tau _e = T_e/T_i$ is the ratio between the electron and ion temperatures and $v_{Ti} = \sqrt {2 T_i/ m_i}$
 is the thermal ion velocity.
To calculate the dispersion relation, we introduce an effective kinetic-adiabatic-index $\gamma _k$ , intended to match the result from MHD in (2.1) to the kinetic result in (2.3), defined as

This $\gamma _k$ will replace the the ideal MHD value of $5/3$
 . In fact, the corrections are normally not too large for simulations with just thermal particles, but can be as small as 0.8 in the case where the pressure $p$
 in (2.1) contains energetic ions pressure, as used in EGAM (Nazikian et al. Reference Nazikian, Fu, Austin, Berk, Budny, Gorelenkov, Heidbrink, Holcomb, Kramer and McKee2008).
3 Kinetic calculations for the local dispersion relation and eigenmode
Using quasitoroidal coordinates, $(r,\vartheta, \zeta )$ , with high aspect ratio $(R \gg r)$
 , for small Larmor radius, the drift kinetic equation (Hazeltine Reference Hazeltine1973) for $N=0$
 , can be written as

where $f_\alpha = f_\alpha (r,\vartheta, v_{\parallel, \perp }, t)$ and $F_\alpha = F_\alpha (r,\vartheta, v_{\parallel, \perp })$
 is the perturbed and equilibrium distribution function for each particle species $\alpha$
 , $v_{\parallel, \perp }$
 is the velocity parallel and perpendicular to the magnetic field, $E$
 is the particle energy, $\phi = \phi (r,\vartheta, t)$
 is the perturbed electrostatic potential, and $R$
 is the major radius and the radial magnetic drift velocity is given by $v_{dr \alpha } =-{ \sin \vartheta ( v_\parallel ^{2}+v_\perp ^{2}/2 )}/{\omega _{c \alpha } R}$
 , where $\omega _{c \alpha }$
 is the cyclotron frequency.
Taking into account the poloidal oscillations $M=0,\pm 1, \pm 2$ , and assuming the radial variation of the radial wave vector to be small, the perturbed functions can be expanded as

The Maxwellian distribution for thermal ions and electrons is

where $n_{0 i,e}$ is the equilibrium density for ions and electrons, $v_{T i,e}=\sqrt {2 T_{i,e} / m_{i,e}}$
 is the thermal velocity, and $T_{i,e}$
 and $m_{i,e}$
 are the particle temperature and mass.
For the energetic particles (EP, beam ions in this case), the approximate slowing-down (Stix Reference Stix1972) function, valid for the injection beam velocity much larger than the critical velocity $(V_b \gg V_c)$ and the angular parameter $\lambda =v_\perp ^{2}/v^{2}$
 with Gaussian distribution $\Delta \lambda _0 \ll 1$
 , is

To obtain the dispersion relation and calculate the eigenmode radial structure for $\phi _0$ (details in Appendix A), (3.1) is solved for electron, thermal and energetic ions. The density is calculated integrating $f_{s,c,2s,2c}$
 over the velocity space to calculate $\phi _{s,c,2s,2c}$
 via quasineutrality condition. The $\vartheta$
 -averaged radial current $\langle j_\alpha \rangle$
 is calculated. From the neutrality condition for the radial current, we have $\sum _\alpha \langle j_\alpha \rangle + j_p = 0$
 , where the thermal ion polarization current is $j_p= -\textrm {i}\omega (1 - 3 \rho _{\textrm {th}}^{2} k_r^{2} /8 ) [ e_i^{2} n_{0i} / m_i \omega _{ci} ] d \phi _0/dr$
 . From the resonance condition, in the limit $\rho _\alpha ^{2}k_r^{2} \ll 1$
 , keeping terms up to $\rho _\alpha ^{2} k_r^{2}$
 , we obtain the dispersion relation (details in Appendix A):

where $\rho _{\textrm {th}}=v_{Ti}/\omega _{ci}$ and $\rho _{\textrm {ep}}=q V_b/\omega _{ci}$
 are the Larmor radius for thermal and energetic ions, respectively, and the terms $D_{\textrm {th},\textrm {ep}}$
 and $L_{\textrm {th},\textrm {ep}}$
 correspond to the contributions to the dispersion relation and to FLR effects from thermal (th) and energetic particles (ep), given by (3.6)–(3.9) in the following.
The contribution to the dispersion relation due to the thermal particles is

where $\sigma _s \equiv \omega _{N} / \omega _{\textrm {Gkin}}$ is formally included, making the dispersion relation consistent with the one calculated by NOVA, $\omega _{N}$
 , which includes the sideband corrections, similar to a previous publication (Nazikian et al. Reference Nazikian, Fu, Austin, Berk, Budny, Gorelenkov, Heidbrink, Holcomb, Kramer and McKee2008), in the limit $v_{Ti} \ll \omega R_0 q \ll v_{\textrm {Te}}$
 .
The finite Larmor radius effect for thermal particles $L_{\textrm {th}}$ is given by

In the limit $\Delta \lambda _0 \ll 1$ , the influence of EP in the local dispersion relation is given by

where $C_D= {n_{0\textrm {ep}} }/n_{0i} {16 (1-\lambda _0)^{2} \log [ V_b/V_c ]}$ and $\omega _{\textrm {tr}} = V_b \sqrt {1-\lambda _0}/q R_0$
 is the transit frequency for EP injection velocity.
The EP FLR effect contribution is given by

with $C_L = (({(2- \lambda _0)^{3}})/({16 (1-\lambda _0)})) C_D$ .
For only the thermal GAM dispersion relation, $D_{\textrm {th}}=0$ . Disregarding NOVA side-band corrections and Landau damping from the imaginary part, its solution recovers the frequency given by (2.3). The EGAM dispersion relation is found for $D_{\textrm {th}} +D_{\textrm {ep}} =0$
 . It follows from (3.8) that the contribution from EP to the dispersion relation rises as $\omega _{\textrm {tr}}$
 approaches $\omega$
 , and the instability is found only for the solution with ${\omega _{\textrm {tr}}}>{\omega }$
 . This result is similar to that obtained previously (Qiu et al. Reference Qiu, Zonca and Chen2010), with additional terms giving a small contribution from the Gaussian angular parameter $\Delta \lambda _0$
 .
From the imaginary part of the dispersion relation, the linear growth rate $\gamma _G$ can be calculated as $\omega = \omega _G+\textrm {i} \gamma _G$
 , with $\gamma _G \ll \omega _G$
 , leading to

where the first term represents the drive given by the EP, which decreases with larger $\Delta \lambda _0$ , similar to numerical calculation (Chen et al. Reference Chen, Zhang, Bao, Lin, Dong, Cao and Li2020) for $\Delta \lambda _0 < 0.2$
 , while the second term represents the thermal ion Landau damping. It follows from (3.10) that a necessary condition for instability ($\gamma _G >0$
 ) is $\lambda _0 > 0.4$
 for $\Delta \lambda _0=0$
 and it increases up to $\lambda _0 > 0.43$
 for $\Delta \lambda _0=0.2$
 , where the additional contribution from the energetic particles easily overcome the Landal damping from thermal ions.
Finally, we can obtain the eigenmode equation, using the approximation $\partial /\partial r \sim \textrm {i} k_r$ , going back to the derivative form, we can rewrite (3.5) as a differential equation for the radial electric field $E_r(r,\omega ) = -({\partial \phi _0}/{\partial r})$
 as

where $Q(r,\omega )={ (D_{\textrm {th}} +D_{\textrm {ep}} )}/{(L_{\textrm {th}} \rho _{\textrm {th}}^{2}+L_{\textrm {ep}} \rho _{\textrm {ep}}^{2})}$ .
In the complete differential equation, the FLR effect will ‘decouple’ the eigenmode from the dispersion relation; in this case, the radial distribution for the electrostatic potential $\phi _0$ can be found.
The solution for the eigenmode is obtained integrating numerically (3.11), setting $\omega$ very close to the maximum of dispersion relation, in the vicinity of the turning points ($r \sim 0$
 ) and around $Q \sim 0$
 . Far from this point, the numerical solution is matched with the WKB approximation:

It is important to point out that, in some cases, numerical physical solutions will appear only for rather specific initial conditions, i.e. those that will be matched by the WKB approximation with $C_2 = 0$ , to avoid the exponential growth due to $\mathrm {Im} (\sqrt {Q})$
 in the second term of the right-hand side of (3.12). However, to proceed with the numerical calculation of the eigenfunction, as each step will introduce errors by numerical truncation, it is necessary to disregard the imaginary part of the FLR effect, $\mathrm {Im} (L_{\textrm {th},\textrm {ep}})$
 , to avoid runaway problems in the numerical convergence due to the stiffness of the eigenvalue equation (LeVeque Reference LeVeque2007).
A physical solution is found by solving (3.11) for $\omega$ for a value very close to the maximum of dispersion relation, where $Q \sim 0$
 . When that maximum is located at the axis, the radial distribution is strongly oscillatory, due to monotonic increase of $Q$
 . However, when the EP contribution in the dispersion relation is strong enough to produce a off-axis maximum, as predicted in previous works on global EGAM (Qu et al. Reference Qu, Hole and Fitzgerald2017), we will see the eigenmode located around the maximum of the dispersion relation, and due to the model used here, an outgoing wave (Qiu et al. Reference Qiu, Zonca and Chen2010) given by $C_1 \exp ({\textrm {i} \int \sqrt {Q} \,\textrm {d}r})/Q^{1/4}$
 .
4 Comparison to experimental DIII-D $N=0$ oscillation

The results of this work are applied to model EGAM oscillations in DIII-D during discharge ramp-up. The discharge #159243 (Collins et al. Reference Collins, Heidbrink, Austin, Kramer, Pace, Petty, Stagner, Van Zeeland, White and Zhu2016; Heidbrink et al. Reference Heidbrink, Collins, Podesta, Kramer, Pace, Petty, Stagner, Van Zeeland, White and Zhu2017; Gorelenkov et al. Reference Gorelenkov, Duarte, Podesta and Berk2018) was chosen due to the presence of sweeping up RSAE, where their frequency lies in between the GAM and TAE frequencies, and also indicates the evolution of the reverse $q$ profile.
In the simulations, we use the profiles of $q$ and temperature presented in figure 1(a) and of density, given by TRANSP, and calculated effective $\gamma _k$
 , given by (2.4), presented in figure 1(b).
(a) Profiles of $q$ , ion (black) and electron (red) temperature, at 500 ms (solid) and 900 ms (dashed). (b) Profiles of thermal ion densities (deuterium and carbon), EP (deuterium) and the effective $\gamma _k$
 .

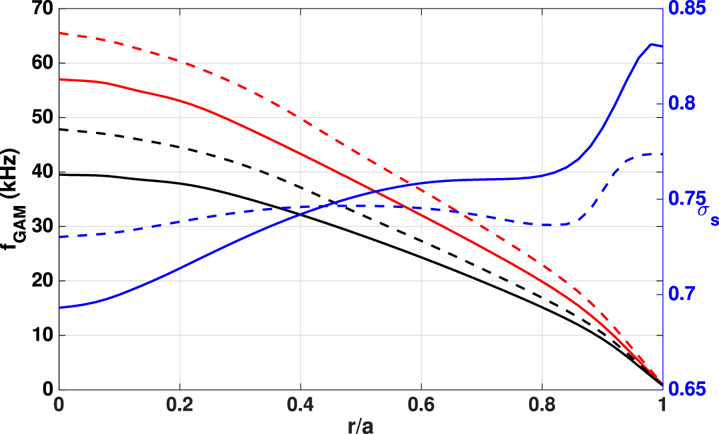
The dispersion relation is accurately calculated using NOVA and presented in figure 2, showing the side-band corrections $\sigma _s \approx 0.68\unicode{x2013}0.75$ in the region where the EP transit frequency is close to the thermal GAM frequency.
Dispersion relation calculated purely kinetically ($\omega _{\textrm {Gkin}}$ , red) and corrected by NOVA (black), with respective $\sigma _s$
 in blue, for 500 ms (solid) and 900 ms (dashed).

The discharge #159243 (Collins et al. Reference Collins, Heidbrink, Austin, Kramer, Pace, Petty, Stagner, Van Zeeland, White and Zhu2016; Heidbrink et al. Reference Heidbrink, Collins, Podesta, Kramer, Pace, Petty, Stagner, Van Zeeland, White and Zhu2017; Gorelenkov et al. Reference Gorelenkov, Duarte, Podesta and Berk2018) has multiple beam injections, mostly from co-tangential sources, with the main injection energy from 70 to 80 keV, and a minor density with half of the injected particles with injection with energy lower than 40 keV; however, only the higher energies are included in the simulations. There is also a minor density from the counter-tangential source not modelled. Furthermore, the injection angle $\lambda _0$ changes for different energies of the particles, as can be seen in figure 4 of Gorelenkov et al. (Reference Gorelenkov, Duarte, Podesta and Berk2018), where around the injection energy (70–80 keV), it is found that $\lambda _0 \sim 0.6$
 is decreasing for smaller energies, towards parallel motion.
In the theoretical model, there is a single $\lambda _0$ and single injection energy. In the simulations, while small variations in the injection energy in the range of 70–80 keV have a minor impact on the final result, the $\lambda _0$
 value substantially influences the dispersion relation. To account for this variability in the simplified theoretical model, the calculations are carried out at a range of $\lambda _0$
 values, and the results are represented as ‘error bars’ in the calculated spectrum of oscillations; this is shown in figure 4 for $0.5<\lambda _0<0.6$
 . A single injection energy of 75 keV is used.
The respective dispersion relation is presented in figure 3(a) before (500 ms) and in figure 3(b) after (900 ms) the marginal stability point. In the calculations, the ratio between the electron and ion temperatures is taken as $\tau _e \sim 0.86$ .
Dispersion relation for 500 and 900 ms, the thermal GAM simulated by NOVA (blue), the EP transit frequency (green), local dispersion relation (red) and maximum of local dispersion relation (black), the maxima are found at $r/a=0.3$ , $f=28$
 kHz in panel (a) and $r/a=0$
 , $f=39$
 kHz in panel (b). (a) 500 ms. (b) 900 ms.

In simulations leading to the results shown in figure 4, we use $n_{0\textrm {ep}} \sim 0.04 n_{0i}$ in the time interval from 500 ms–700 ms, as the effect is dominated by $\lambda _0$
 and $q$
 . In the time interval from 700 ms to 900 ms, i.e. around the marginal stability point, a small radial variation of $n_{0\textrm {ep}}$
 may be useful to find the exact marginal stability point. We use $n_{0\textrm {ep}} \sim 0.04\unicode{x2013}0.08 n_{0i}$
 as in figure 1(b), calculated by the kick model profile (Podesta, Gorelenkova & White Reference Podesta, Gorelenkova and White2014; Podesta et al. Reference Podesta, Gorelenkova, Gorelenkov and White2017), which has good agreement with FIDA measurements of co-passing EP (Collins et al. Reference Collins, Heidbrink, Austin, Kramer, Pace, Petty, Stagner, Van Zeeland, White and Zhu2016; Heidbrink et al. Reference Heidbrink, Collins, Podesta, Kramer, Pace, Petty, Stagner, Van Zeeland, White and Zhu2017).
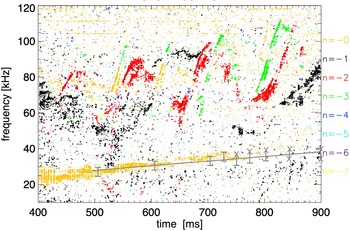
Mirnov coils oscillations from shot #159243 showing RSAE between $40\textrm { and }100$ kHz and $N=0$
 mode (yellow) starting from $25\unicode{x2013}30$
 kHz at 500 ms and disappearing at approximately $35\unicode{x2013}40$
 kHz close to 800 ms. The grey line represents the time evolution of the calculated frequency for the maximum of the dispersion relation. The error bars are due to simulation for $0.5 < \lambda _0 < 0.6$
 , and the X means that the maximum is found on axis.

An $N=0$ oscillation with growing frequency starting from $25\unicode{x2013}30$
 kHz at 500 ms and disappearing at approximately $35\unicode{x2013}40$
 kHz around 800 ms, captured by Mirnov coils as magnetic oscillation at the edge of plasma column, are presented in yellow in figure 4, below the sweeping up RSAE, $40\unicode{x2013}100$
 kHz and $N > 1$
 . The grey line shows the result of the simulated frequency of the maximum of the dispersion relation, matching the observed $N=0$
 oscillation inside the error bars. The error bars represent two extremes of the frequency calculated using injection angle as $\lambda _0=0.5$
 for the higher limit, and $\lambda _0=0.6$
 for the lower one. The X means that the maximum of the dispersion relation is found on axis, as in figure 3(b) for 900 ms, indicating that no eigenmode should be found, as showed in §§ 5 and 6, and the disappearance of the oscillation at some time between $750\textrm { and }850$
 ms.
It is important to point that the temporal evolution of profiles does not affect the growth rate significantly enough to explain the dissipation of the oscillation close to 800 ms, in terms of the relation between the energetic ion driven oscillation and thermal ion Landau damping, $\gamma _G\sim 4 \unicode{x2013}10\,\%$ for the simulations above, allowing the conclusion that the stabilization is due to differences in the dispersion relation.
5 Maximum off axis – Radial profile for the EGAM oscillation
We choose the following analytic profiles for the thermal and energetic particles consistent with TRANSP profiles reconstruction. The profiles listed in this section were chosen based on the parameters for the DIII-D discharge at 500 ms, with deuterium and carbon as thermal ions, the $q$ profile as $q=4.7-10(r/a)^{2}+14.8(r/a)^{3}-2(r/a)^{4}$
 for $q=4.7$
 in the centre, $\textrm {d}q/\textrm {d}r|_{r=0} \sim 0$
 , $q_{\textrm {min}}=3.9$
 at $r_{q\textrm {min}}=0.5$
 and 7.4 at $r=a$
 , and the temperature of thermal ions as $T_i=[1.8(1-(r/a)^{2})^{2.5}+0.1]\,\textrm {keV}$
 . For the energetic ions profile, just calculating for the passing particles, the ratio of density between energetic ions and thermal ions is taken equal to $4\,\%$
 for $0 < r/a < 0.45$
 , decreasing to 0 for $r/a > 0.45$
 . This new restriction is necessary to avoid including energetic ions near the edge, where the approximation $\rho _{\textrm {ep}}^{2} k_r^{2} <1$
 may not be valid and the effects of trapped particles should be included in the theoretical formulation as they may not be negligible for $r/a > 0.45$
 . The injection energy is 70 keV and injection angle is $\lambda _0 = 0.5$
 , with angular distribution $\Delta \lambda _0=0.2$
 . Using the critical velocity as $V_c \sim 5.5 A_b^{1/3} \sqrt {T_e/ m_b}$
 (Stix Reference Stix1972) and the MHD correction $\sigma _s \sim 0.7$
 given by NOVA simulations, the maximum off axis appears clearly.
The dispersion relation is represented in figure 5, where $f=\omega /2 {\rm \pi}$ .
Dispersion relation for thermal particles in blue, EP transit frequency in green and the local dispersion relation in red. The maximum of the dispersion relation is found at $f_{\textrm {G-EGAM}}=28.1$ kHz at $r/a=0.32$
 and the respective growth rate ${\gamma _G}/{\omega _G}=5.8\,\%$
 .

We can see that the coupling is stronger in the central plasma region, because of the reverse $q$ profile, which produces a maximum at approximately $r/a=0.27$
 for $f=28.1$
 kHz. The associated growth rate is 9.3 % of the mode frequency. The frequency calculated from the dispersion relation starts to drop significantly for $r/a>0.5$
 . To determine the eigenfunction, it is necessary to calculate the radial profile of the quantity $Q$
 , in (3.11). This is shown in figure 6(a) for the radial interval $0< r<0.5$
 and for the frequency at the maximum of the dispersion relation. We note that the imaginary part of the FLR effect, $\mathrm {Im}(L_{\textrm {th},\textrm {ep}})$
 , is disregarded in this calculation to avoid runaway numerical solutions, for the reason already mentioned. For $r/a>0.5$
 , both the real and imaginary parts of $Q$
 grow monotonically, with $\mathrm {Im}(Q) \ll \mathrm {Re}(Q)$
 , as $\rho _{\textrm {th}}$
 decreases as the temperature decreases with $r$
 .
(a) $\mathrm {Re}(Q)$ in black and $\mathrm {Im}(Q)$
 in green, on the maximum of the dispersion relation, $f_{\textrm {G-EGAM}}=28.1$
 kHz with the respective growth rate ${\gamma _G}/{\omega _G}=9.3\,\%$
 . (b) Solution for real (black) and imaginary (green) parts of the eigenmode, $\textrm {d}\phi _0 /\textrm {d}r$
 (a.u.), showing the Airy function for $r/a<0.45$
 and oscillatory for $r/a>0.45$
 .

The eigenfunction is numerically calculated in the interval $0< r/a<0.45$ , where the solution for $\textrm {d}\phi _0/\textrm {d}r$
 is given by the Airy function, and matches the respective WKB solution, (3.12), for $r/a>0.45$
 , where the solution becomes strongly oscillatory as $Q \rightarrow \infty$
 , ultimately vanishing at the edge, as shown in figure 6(b), representing how the radial structure of the EGAM eigenmode looks like when a off-axis maximum is present. The eigenmode in figure 6(b) is normalized by its first minimum as we will compare the global behaviour of the first maximum with respect to the pure radially oscillatory solution.
For higher ion temperatures at the edge, only some specific frequencies should result in $\textrm {d}\phi _0/\textrm {d}r=0$ as $r/a \rightarrow 1$
 . In any case, the solution is very similar to figure 6(b), with no substantial changes in the frequency and growth rate.
While the condition $\rho _{\textrm {th}}^{2} k_r^{2} \ll 1$ is always easily satisfied, it is not necessarily true for the energetic ions. The consistency of the approximation for energetic ions is checked and the condition $\rho _{\textrm {ep}}^{2} k_r^{2} \approx 0.6$
 is verified. The result found for the eigenfunction is similar to previous calculations for GAM in MHD, numerically (Berk et al. Reference Berk, Boswell, Borba, Figueiredo, Johnson, Nave, Pinches and Sharapov2006) and analytically (Lakhin & Sorokina Reference Lakhin and Sorokina2014), showing strong coupling to the dispersion relation near its maximum. In our case, instead of a Dirac function for $\textrm {d}\phi _0/\textrm {d}r$
 , the solution is spatially distributed. It is also very similar to kinetic numerical results for EGAM (Fu Reference Fu2008; Qu et al. Reference Qu, Hole and Fitzgerald2017), especially in the region around the centre. The $M=\pm 1,\pm 2$
 poloidal components of perturbed electrostatic potential of the EGAM can be found using a similar method, following (A30)–(A31) in Appendix A.
It is important to note that EGAM branch oscillatory behaviour in the absence of EPs, i.e. when $r/a>0.45$ , is obtained in the approximation $\rho _\alpha ^{2} k_r^{2} \ll 1$
 , leading to the eigenmode differential equation (3.11). Equation (3.11) is similar to equations previously published for EGAM (Qiu et al. Reference Qiu, Zonca and Chen2010) and thermal GAM (Itoh et al. Reference Itoh, Itoh, Sasaki, Fujisawa, Ido and Nagashima2007), when those modes are excited near the plasma edge. It is expected that including ions with the Larmor radius of the same order or larger than the radial wavelength, such as including EP Larmor radius at $r/a>0.45$
 in our case, would average out the radial oscillation and reduce the amplitude of (E)GAMs, and would be closer to numerical calculations (Fu Reference Fu2008).
6 Maximum on axis – Radial profile for the EGAM oscillation
Now we consider the profiles similar to TRANSP reconstruction for t=900 ms, namely, the $q$ profile as $q=3-1.8(r/a) -4(r/a)^{2}+9.6(r/a)^{4}$
 for $q=3$
 in the centre, $\textrm {d}q/\textrm {d}r|_{r=0} \sim 0$
 , $q_{\textrm {min}}=2.65$
 at $r_{q\textrm {min}}=0.5$
 and 6.8 at $r=a$
 , the temperature of thermal ions as $T_i=[2(1-r^{2})^{2.5}+0.1]\,\textrm {keV}$
 , and the same energetic ions profile as used earlier in § 5; for EP, we take $n_{0\textrm {ep}} = 0.04 n_{0i}$
 for $0 < r < 0.4$
 to avoid including energetic ions near the edge, where the approximation $\rho _{\textrm {ep}}^{2} k_r^{2} <1$
 breaks down. The solutions of the dispersion are represented in figure 7.
Dispersion relation for thermal particles in blue, EP transit frequency in green and the local dispersion relation in red. The maximum of the dispersion relation is found at $f_{\textrm {G-EGAM}}=39.2$ kHz at $r/a=0$
 and the respective growth rate ${\gamma _G}/{\omega _G}=7.9\,\%$
 .

We see that the coupling is not strong enough to produce an off-axis maximum, and the local frequency decreases monotonically, making $Q$ monotonically increase. This quantity is calculated as described in § 3.
In this case, the eigenfunction is numerically calculated in the interval $0< r/a<0.3$ and matched to the WKB solution for $r/a>0.3$
 . Using the same criterion from figure 6(b), the eigenmode in figure 8(b) is also normalized by its first minimum. The first maximum is the important part for the total increase of electrostatic potential and is much less pronounced in the on-axis case. It is clear that now the eigenfunction loses somewhat the global behaviour shown in the previous case, becoming radially oscillatory over the entire radial interval, in other terms, the eigenfunction of the on-axis case, for $r/a > 0$
 is equivalent to the eigenfunction of the off-axis case, for $r/a > 0.32$
 . Due to the small variation of the dispersion relation as $r/a \rightarrow 0$
 , in the on-axis case, the eigenfunction presents a vestige of global behaviour as in figure 8(b), but this is negligible near the robust global behaviour of figure 6(b). The approximation of small Larmor radius remained valid in these calculations, i.e. $\rho _{\textrm {ep}}^{2} k_r^{2} \approx 0.6$
 .
(a) $\mathrm {Re}(Q)$ in black and $\mathrm {Im}(Q)$
 in green, on the maximum of the dispersion relation, $f_{\textrm {G-EGAM}}=39.2$
 kHz with the respective growth rate ${\gamma _G}/{\omega _G}=7.9\,\%$
 . (b) Solution for real (black) and imaginary (green) parts of the eigenmode, $\textrm {d}\phi _0 / \textrm {d}r$
 (a.u.) for the on axis maximum case.

The solution is also similar to the kinetic numerical results for EGAM (Qu et al. Reference Qu, Hole and Fitzgerald2017) for the monotonically increasing $q$ , which does not produce an off-axis maximum either.
7 Discussion
We have shown that the eigenfunctions of the EGAMs can be obtained when the maximum of the local frequency occurs both on axis and off axis, with positive growth rate. However, according to figures 6(b) and 8(b), the global behaviour of the eigenfunction is much more pronounced in the off-axis case, and the growth rate is slightly larger as well, similar to previous studies for EGAM (Qu et al. Reference Qu, Hole and Fitzgerald2017) in the maximum of local frequency, for reversed and monotonic $q$ profile. It is clear that the eigenmode in the off axis produces a much stronger growth of the electrostatic potential $\phi _0$
 , indicating that the off-axis maximum is required to produce the observed oscillations, in accordance with the standard theory (Heidbrink Reference Heidbrink2008).
In a real case scenario, the values for the effective injection angle $\lambda _0$ and $q$
 profile are the most important parameters to indicate the existence of the oscillation. An additional minor contribution from the radial distribution of the EP density may also contribute. The profiles calculated by TRANSP simulations using the kick model profile (Podesta et al. Reference Podesta, Gorelenkova and White2014, Reference Podesta, Gorelenkova, Gorelenkov and White2017), that match FIDA measurements of co-passing EP (Collins et al. Reference Collins, Heidbrink, Austin, Kramer, Pace, Petty, Stagner, Van Zeeland, White and Zhu2016; Heidbrink et al. Reference Heidbrink, Collins, Podesta, Kramer, Pace, Petty, Stagner, Van Zeeland, White and Zhu2017), for discharge #159243, were used to find the marginal stability point with better accuracy.
Summarizing, the simulations using the described model produce good quantitative results for discharge #159243, in figure 4, when the model above matches the frequency of the $N=0$ oscillation captured by Mirnov coils, during the specified time window. It also shows that the oscillation disappears as the maximum of the local frequency is located at the centre on axis. The model can represent well the marginal stability point at approximately 800 ms.
The agreement with experimental data is sensitive to the simplifications we made to model the beam ion distribution. These simplifications include a single beam injection energy, i.e. only injections with energy in the range 70–80 keV were considered; injected beams with energy lower than 40 keV were neglected. Although adopting a more realistic model should improve the accuracy with respect to the experimental data, the final result probably would not change much, as the most important unknown injection pitch angle parameter was scanned in the range $0.5 \leq \lambda _0 \leq 0.6$ and resulted in the ‘error bars’ shown in figure 4.
For any beam ratio density $n_{0\textrm {ep}} > 0.04 n_{0i}$ and injection angle $\lambda _0 > 0.5$
 , the off-axis maximum clearly appears for the temperature and $q$
 profiles in 500 ms. The linear growth rate given by (3.10) is also always positive during the discharge time interval $500 < t < 900$
 ms, $\gamma _G > 0.03 \omega _G$
 , allowing the conclusion that the dissipation at approximately 800 ms shall be more related to the behaviour of the local frequency than to the growth rate itself.
Furthermore, disregarding the NOVA corrections for the thermal GAM dispersion relation, i.e. as the red lines in figure 2, the resulting frequency given by (3.6) together with (3.8) for the slowing down EP distribution function for EGAM (Qiu et al. Reference Qiu, Zonca and Chen2010) should be higher than experimental observation, very close to the EP transit frequency, as the thermal GAM frequency would be much higher than the EP transit frequency. The growth rate given by (3.10) would be also higher for the time window and, indeed, there is no indication of dissipation at approximately 800 ms.
If included in the model presented here, in addition to slowing down, a single energy distribution function for EP (Qu et al. Reference Qu, Hole and Fitzgerald2017) could explain chirping oscillations (Nazikian et al. Reference Nazikian, Fu, Austin, Berk, Budny, Gorelenkov, Heidbrink, Holcomb, Kramer and McKee2008) with much lower EP density. In conclusion, the NOVA numerical calculation was fundamental to compare the theoretical calculations with the experiment.
The new feature in the model presented here is to provide a new tool to understand how a global EGAM can be excited in the maximum of the local dispersion relation, in the case where the frequency of the eingenmode is localized close to but smaller than the transit frequency of injected energetic ions, and close to the thermal GAM dispersion relation. We employ a kinetic model within the small, but finite, Larmor radius approximation, with side-band corrections in the GAM dispersion relation for thermal particles, here computed by NOVA and formally included in the equation for the eigenmode by the factor $\sigma _s$ . The resulting thermal GAM frequency is very close to the EP injection transit frequency; in this case, the solution for the dispersion relation presents a off-axis maximum, creating the conditions that enhance the global behaviour of the eigenmode during discharges with reversed $q$
 profile. Specific radial profiles of pitch angle can also produce the eigenmode, whose radial behaviour of the eigenfunction is similar to previous results (Fu Reference Fu2008; Qiu et al. Reference Qiu, Zonca and Chen2010; Qu et al. Reference Qu, Hole and Fitzgerald2017). The possibility to excite EGAM inside the continuum is beyond the scope of this paper and will be considered in a future publication.
Our analysis applied to DIII-D reversed shear experiments provides a further validation to GAM ideal MHD and kinetic theories, where GAMs are strongly modified by energetic particle effects. We have shown that our novel kinetic treatment of the resonant passing ion effects on GAMs leads to very good agreement with DIII-D experimental data. This understanding should be instrumental for future experiments where bifurcation transport phenomena such as ITB are observed.
Finally, this work reinforces the strong relation between the GAM eigenmode and the local frequency (Berk et al. Reference Berk, Boswell, Borba, Figueiredo, Johnson, Nave, Pinches and Sharapov2006; Lakhin & Sorokina Reference Lakhin and Sorokina2014; Qu et al. Reference Qu, Hole and Fitzgerald2017; de Souza, Elfimov & Galvão Reference de Souza, Elfimov and Galvão2018; Elfimov, Galvão & Gorelenkov Reference Elfimov, Galvão and Gorelenkov2019). The method applied to a real case scenario, with simulated profiles explaining the frequency and marginal stability point of $N=0$ oscillation during ramp-up discharges, with quantitative experimental correlation.
Acknowledgements
F. Camilo de Souza and R. Galvão are grateful to the distinguished scientist and colleague Artour Elfimov for the many years of productive and friendly collaboration.
Editor H. Zohm thanks the referees for their advice in evaluating this article.
Funding
This manuscript has been authored in part by Princeton University (N.G., M.P., E.F., contract number DE-AC02-09CH11466); the U.S. Department of Energy, Office of Science, Office of Fusion Energy Sciences, using the DIII-D National Fusion Facility, a DOE Office of Science user facility (C.C., contract number DE-FC02-04ER54698) and the Coordination of Superior Level Staff Improvement, CAPES, Brazil (F.C.S., contracts numbers 88881.190401/2018-01, 88882.332882/2018-01).
Declaration of interests
The authors report no conflict of interest.
Appendix A. Details from (3.1) to (3.5)
Using the eikoidal approximation given by (3.2) in the drift kinetic equation, (3.1), the following set of equations is obtained:


where $\bar {v}_{dr \alpha } \equiv -{ ( v_\parallel ^{2}+v_\perp ^{2}/2 )}/{\omega _{c \alpha } R}$ is the amplitude of radial diamagnetic drift velocity.
The equation system given by (A1)–(A4), solved for $f_l$ , consistent with the approximation for small, but finite Larmor radius, $\rho _\alpha ^{2} k_r^{2} \ll 1 \rightarrow \bar {v}_{dr \alpha }^{2} k_r^{2} \ll 1$
 , keeping terms up to $\rho _\alpha ^{3} k_r^{3}$
 and defining $\varOmega \equiv \omega R_0 q$
 , give us the equations for the perturbed distribution function:


The plasma density can be calculated for the thermal particles, the equilibrium distribution function is given by (3.3). Due to the small relative electron mass compared with ions, the GAM phase velocity found is much smaller than the thermal electron velocity, $\varOmega \ll v_{\textrm {Te}}$ , the proper approximation in the plasma dispersion function for electrons is

where

Integrating (A5)–(A8), in the limit above, the electron perturbed density is found as


where $\tau _e = T_e/T_i$ is the ratio between electron and ion temperature.
However, as the solution is founded where the GAM phase velocity is larger than the thermal ion velocity, $\varOmega \gg v_{Ti}$ , the proper approximation in the plasma dispersion function for thermal ions becomes

The thermal ion oscillation density is found as


where the terms $I_{1,2,3,\ldots }$ , neglecting higher order that will have no impact in the final result, can be written as


While the effect of the energetic ions on the perturbed electric potential is negligible, due to small density ratio between energetic and thermal ions, the components $\phi _{s,c,2s,2c}$ are calculated from quasineutrality, with $\phi _c = \phi _{2s} = 0$
 , and


Equations (A30) and (A31) show that $\phi _{s,2c} < \phi _0$ , and define a simple approximation for these two components for the eigenmode, while these work only when $\phi _0$
 is analysed. Equations (A30) and (A31) also will have a important contribution in the dispersion relation via electron radial current from (A33).
Due to ‘$\sin \vartheta$ ’ inside $v_{dr \alpha }$
 , only the sin-component of the distribution function contributes to the radial current average over $\vartheta$
 :

Where, for an electron, (A33) is found,

Furthermore, for thermal ions,

For energetic particles, the influence of the poloidal components of electrostatic oscillations other than $\phi _0$ in the radial current are negligible, the $\vartheta$
 average of perturbed radial electric current found from (A32) becomes

Modifying to ($v,\lambda$ ) coordinates and applying for EP,

Integrating (A36), with the conditions where $\Delta \lambda _0^{2} \ll 1$ , with injection angle $\lambda _0<1$
 and the solution where it is possible to find instability $\varOmega _{\textrm {tr}} > \varOmega$
 :

with

is the transit frequency for the EP injection velocity.


Using (A33), (A34) and (A37), as well as the polarization current $j_p$ , rewriting the frequency $\varOmega = \omega R_0 q$
 in the resonance condition for the radial current, $\sum _\alpha \langle j_\alpha \rangle + j_p = 0$
 , (3.5) is found.