Introduction
The increased attention of agenda-setting research on partisan politics has often been at odds with the belief that parties drive politics. For example, recent literature finds little evidence of issue ownership (e.g. John et al., Reference John, Bevan and Jennings2014) or a strong election effect (Baumgartner et al., Reference Baumgartner, Brouard and Grossman2009) on the content of political agendas. From this perspective, parties’ largest differences are in how they use the political process (e.g. Bevan et al., Reference Bevan, John and Jennings2011; Jennings et al., Reference Jennings, Bevan and John2011a). Partisan differentiation on issues is at best one source of policy variation (e.g. Baumgartner et al., Reference Baumgartner, Brouard and Grossman2009). These weak findings with respect to the impact of parties in agenda-setting research have been explained through the relatively stable nature of policy attention across issues, despite the multitude of research demonstrating the importance of political parties in politics more broadly.
In contrast to the findings for policy attention, scholars show that political parties play a prominent role in everything from party manifestos and elections (e.g. Adams, Reference Adams1999; Lewis-Beck and Stegmaier, Reference Lewis-Beck and Stegmaier2000; Dalton, Reference Dalton2008; Adams and Somer-Topcu, Reference Adams and Somer-Topcu2009; Somer-Topcu, Reference Somer-Topcu2009; de Vries and Hobolt, Reference De Vries and Hobolt2012), to government formation and termination (e.g. Müller and Strøm, Reference Müller and Strøm2000). Moreover, evidence of their effects on legislative behavior (e.g. Huber, Reference Huber1996; Döring Reference Döring2003), policy outcomes (e.g. Hibbs, Reference Hibbs1977; Alesina and Rosenthal, Reference Alesina and Rosenthal1995; Schmidt Reference Schmidt2006), institutional reform (e.g. Cox, Reference Cox1987), and oversight of policy implementation and the bureaucracy (e.g. Huber and Shipan, Reference Huber and Shipan2002) demonstrates the importance of political parties in policy-making. Nevertheless, research on public policy and budget outcomes indicates only mixed evidence for parties’ relevance (Alt and Lowry, Reference Alt and Lowry2000; McAtee et al., Reference McAtee, Yackee and Lowery2003; Soroka and Wlezien, Reference Soroka and Wlezien2010). When it comes to issue attention,Footnote 1 however, agenda-setting research would argue that parties in government maintain a certain level of attention on issues due to world events, political and economic systems and also respond to opposition critiques (see Green-Pedersen and Mortensen, Reference Green-Pedersen and Mortensen2010; Seeberg, Reference Seeberg2013). Attention to an issue and the location of policy on that issue are clearly two different things that help explain the differences in the findings of these two literatures, but how accurate is this agenda-setting explanation. More importantly, how robust are the non-findings concerning parties in the agenda-setting literature when the analysis takes into account parties’ specific organizational characteristics and dynamics? As complex organizations balancing multiple goals (Strøm, Reference Strøm1990), parties’ influence on the government agendaFootnote 2 likely depends on their decision-making structures and strategic context. We develop a theory of aggregate partisan influence that focuses on the factors determining the impact of parties’ internal decision-making process, contextual demands for policy, and parties’ legislative ability to influence policy.
To examine the extent of party effects on changes in issue attention, we use data from the UK Policy Agendas Project (www.policyagendas.org.uk) on UK Acts of Parliament from 1945 to 2008. In particular, we study differences in the level of attention to issues by party through time series analyses aimed at pinpointing party influence from differences in party organization, elections and institutional control, using a new measure of the parliament’s aggregate level agenda stability introduced by Mortensen et al. (Reference Mortensen, Green-Pedersen, Breeman, Chaqués-Bonafont, Jennings, John, Palau and Timmermans2011). This measure compares the differences in attention, issue by issue, creating an overall index of stability in issue attention from year to year. The results show a clear pattern of revisions to laws by newly elected governments suggesting an aggregate process of policy change following party transitions. This aggregate approach complements the issue-by-issue research that finds only limited partisan influence by placing each issue in the broader context of policy change. It also builds on similar work focused on understanding aggregate patterns of issue attention (e.g. Jennings et al., Reference Jennings, Bevan, Timmermans, Breeman, Brouard, Chaques, Green-Pedersen, John, Palau and Mortensen2011b; Boydstun et al., Reference Boydstun, Bevan and Thomas III2014). Specifically, we find evidence that for incumbent governments a poor economy, a larger legislative majority, and a long tenure in office encourages governments to stick to a consistent legislative program. However, transitions that occur in rough economic times and new governments with large legislative majorities decrease the stability of attention across issues. Decreased agenda stability following a party transition indicates a change in issue attention from the previous government. This change implies a substantive difference in parties’ prescriptions across issues for an ailing economy. However, large party memberships increase stability as more member-dominated parties are less able to institute radical changes in issue attention.
The findings in this paper hold important implications for democratic government and electoral accountability. Given the predominance of parties in advanced democracies, how can voters influence government policies if the government’s agenda does not change following a partisan transition? This means that when the partisan control of the cabinet changes, the new government focuses on different issues than the previous government. Optimistically, our analysis indicates that parties provide voters with meaningful choices across important issues.
The rest of this paper takes the following form. First, we discuss several of the more commonly found (or unfound) party effects seen through policy, issue attention, and policy processes. Second, we consider these observations in light of the agenda-setting literature and offer several expectations for how and when parties will demonstrate an effect in the agenda-setting process. Next, we discuss the data that we use to test our hypotheses and present our analysis that tests each proposed party effect. Finally, we conclude the paper with a brief summary and consider how (or how not) to look for the effect of parties in public policy and policy agendas.
Party effects: policy, attention, or process
Political party influence has been studied in a variety of contexts related to public policy and policy outcomes. Much of this research looks at the effect of party governments on social and economic policies (Schmidt, Reference Schmidt2006). From the perspective of party policy accountability, this literature points out important differences in the types of policies that parties develop in office. Parties’ policies depend on the preferences of their historical constituencies (Hibbs, Reference Hibbs1977; Hicks and Swank, Reference Hicks and Swank1992; Alesina and Rosenthal, Reference Alesina and Rosenthal1995; Tsebelis, Reference Tsebelis2002). However, linking specific political parties to policy outcomes is difficult in many democracies because single party governments are unusual and parties’ preferences are put through complex, multi-layered institutional contexts (Tsebelis, Reference Tsebelis2002; Schmidt, Reference Schmidt2006). Furthermore, changing public opinion and feedback loops between public policy and opinion complicate leaders’ responses to public demands (Soroka and Wlezien, Reference Soroka and Wlezien2010). Even under divided government, parties seek to draw economic policies in their preferred direction (Alesina and Rosenthal, Reference Alesina and Rosenthal1995). Alt and Lowry (Reference Alt and Lowry2000) demonstrate that parties in government allocate budgets according to their policy goals, although others contest their results (McAtee et al., Reference McAtee, Yackee and Lowery2003). Focusing on labour policies, Tsebelis (Reference Tsebelis2002) adds that ideological disagreements between coalition parties and institutional constraints limit the amount of legislation that coalition governments generate. Furthermore, Huber and Shipan (Reference Huber and Shipan2002) illustrate that party strategies influence the length and detail of legislation on health care policy across US States and labour policies cross-nationally. While these studies find some evidence that parties develop public policy in line with their preferences, they generally focus on a specific policy outcome based on Lipset and Rokkan’s (Reference Lipset and Rokkan1967) cleavage theory, such as social or economic policy, budget outcomes, or the total number of bills passed, without taking into consideration the government’s broader attention to issues.
This perspective has been extended to suggest that parties ‘own’ issues related to their historical constituencies, policy preferences, and experiences in government (Budge and Farlie, Reference Budge and Farlie1983; Egan, Reference Egan2013). Issue ownership theory connects parties’ electoral success to the salience of the issues that they own in the electorate. Parties that own an issue benefit by emphasizing that issue in their electoral appeals (Petrocik, Reference Petrocik1996). Parties develop ownership through their emphasis on issues when they come to office (Egan, Reference Egan2013). For example, socialist parties in Europe ‘own’ labour issues because they have historically organized on these issues and focused their resources on them in government. Following from this perspective, socialist parties will benefit when topics related to labour and employment are salient and will presumably focus attention on these issues in office to maintain an image of competence (Carey, Reference Carey2009). Therefore, a socialist party shifts the government’s issue attention to place greater emphasis on labour issues. The traditional issue ownership or cleavage-based approach to party politics largely assumes a mostly fixed type of policy emphasis from a party over time, although empirical evidence suggests that the issues voters attribute to parties’ primary competencies is frequently incomplete or inconsistent and can change over time (Bélanger and Meguid, Reference Bélanger and Meguid2008). Furthermore, parties’ historically ‘owned’ issues provide little guidance for the substance or quality of the policies parties pursue once they enter into office (Egan, Reference Egan2013).
Research from an agenda-setting perspective, however, has found less evidence that parties play an influential role in determining levels of issue attention in various government outputs such as executive speeches, laws, and budgets. This focus on issue attention is not too dissimilar from the expected effects of cleavages or issue ownership on bill productivity (Lipset and Rokkan, Reference Lipset and Rokkan1967; Budge and Farlie, Reference Budge and Farlie1983; Petrocik, Reference Petrocik1996), but the empirical results from the agenda-setting literature are at best mixed (e.g. Baumgartner et al., Reference Baumgartner, Brouard and Grossman2009; Jennings et al., Reference Jennings, Bevan, Timmermans, Breeman, Brouard, Chaques, Green-Pedersen, John, Palau and Mortensen2011b; John et al., Reference John, Bevan and Jennings2014). From the agenda-setting perspective, political and economic conditions limit the government’s ability to focus attention on strictly partisan goals (Green-Pedersen and Mortensen, Reference Green-Pedersen and Mortensen2010). Like research from a party politics perspective, this work emphasizes the role of institutional structures that limit parties’ ability to advance their most preferred policy goals (Bevan et al., Reference Bevan, John and Jennings2011; Jennings et al., Reference Jennings, Bevan and John2011a). For example, in institutional contexts with a large number of parties in parliament and in which minority governments regularly occur, the government often undertakes policy salient to opposition parties (Seeberg, Reference Seeberg2013). Overall, this literature indicates the institutional and contextual reasons why we may expect a lack of partisan effects. We add that a fuller explanation of party influence would consider how internal organizational characteristics may influence the government agenda.
Neither the party politics nor the agenda-setting approaches suggest that parties play an unimportant role in the government process. Parties are the primary organizations controlling governments in advanced industrial democracies. However, studies from these perspectives find contrasting and mixed evidence of their substantive impact. This inconsistency may exist from differences in the operationalization of the dependent variables, but the differences are likely to also reflect fundamental disagreements over the way in which each literature expects parties to matter. Tests of government accountability and cleavage-based accounts often focus on trends linked to parties’ electoral and policy strategies on a subset of issues or on the specific location of parties’ preferences on traditional economic policies without fully considering the role of broader effects on their attention across a range of issues. Agenda-setting explanations regularly focus on broader processes that influence the greater distribution of attention across issues, but avoid directly specifying the issues on which parties most likely differ (e.g. Jennings et al., Reference Jennings, Bevan, Timmermans, Breeman, Brouard, Chaques, Green-Pedersen, John, Palau and Mortensen2011b). To explain these differences, we examine the government’s agenda stability or the change in the distribution of attention across issues from year to year (see Mortensen et al., Reference Mortensen, Green-Pedersen, Breeman, Chaqués-Bonafont, Jennings, John, Palau and Timmermans2011). By studying agenda stability, we seek to isolate the effect of party differences without having to directly specify or impose our assumptions of parties’ priorities on each issue. In particular, we develop a series of hypotheses that link parties’ organization and policy strategies to agenda stability.
Hypotheses: maintaining stability
Studies of policy responsiveness and agenda-setting frequently predict differences in which policies parties pursue in office based on their issue priorities and political context. However, these accounts may miss parties’ influence on the policy agenda if they focus only on the broad differences in party preferences and ignore the organizational and contextual factors that lead to the formation of those preferences. To reconcile these approaches, we add that parties are dynamic and strategic organizations that face competing pressures on their agenda. In addition, differences between parties will lead to the most dramatic changes in agenda stability immediately following changes in control of government. Overall, our approach traces parties’ decision-making processes from intra-party politics, the external demand for policy change, and finally, parties’ parliamentary control.
Research on party behavior and public policy often treats parties as if parties are unified organizations in which internal decision-making processes are unimportant for understanding their behavior. However, as organizations, parties face demands from multiple groups within the party that potentially contain divergent policy goals, such as activists, elected representatives, and organized factions (Harmel and Janda, Reference Harmel and Janda1994; Ceron, Reference Ceron2013; Greene and Haber, Reference Greene and Haberforthcoming). Scholars find that pressures on party leadership stemming from regional party groups, intra-party factions or organizational influences affect numerous outcomes, such as the party’s platform (Harmel and Tan, Reference Harmel and Tan2003) and parliamentary behavior (Huber, Reference Huber1996; Laver, Reference Laver1999; Carey, Reference Carey2009). The preferences of intra-party groups constrain party leaders most as an election nears (Ceron, Reference Ceron2013). Empirically, internal divisions often lead to changes in parties’ election campaigns and parliamentary behavior (Ceron, Reference Ceron2013; Greene and Haber, Reference Greene and Haberforthcoming).
Parties’ organizations are more fluid than much research assumes. For example, party memberships have declined throughout much of Western Europe (Tan, Reference Tan1997), internal candidate selection rules vary within countries over time (Shomer, Reference Shomer2014), members of parliament switch parties with some frequency (O’Brien and Shomer, Reference O’Brien and Shomer2013), and the degree of internal disagreements vary over time based on the electoral context both in parliament and at the parties’ own national meetings (Hug and Shultz, Reference Hug and Schulz2007; Greene and Haber, Reference Greene and Haberforthcoming). More broadly, parties have generally democratized candidate selection rules and increased the party leaders’ selectorate (Kenig, Reference Kenig2009).
Like other organizations in Western Europe, parties in the United Kingdom have also undergone organizational changes. Parties have experienced declining memberships, although this decrease is not monotonic (Tan, Reference Tan1997). For example, Labour reversed the trend in the 1990s (Whiteley and Seyd, Reference Whiteley and Seyd2002). Consequently, activism by individual members declined over the last half century (Seyd and Whiteley, Reference Seyd and Whiteley2004). As a response, both Labour and the Conservatives increased grassroots members’ ability to influence the party’s leadership selection (Cross and Blais, Reference Cross and Blais2012). This trend is essential given that six of the last 10 prime ministers prior to 2008 took office without a general election (Kenig, Reference Kenig2009). Importantly, surveys of party members in the United Kingdom indicate that a primary motivation for membership is personal feelings of efficacy from intra-party influence on the policy priorities of the party leadership (Seyd and Whiteley, Reference Seyd and Whiteley1992; Whiteley et al., Reference Whiteley, Seyd, Richardson and Bissell1994).
Building on this research, we theorize that party organizations hold implications for intra-party politics and consequently the stability of the party’s issue attention in government (see Mortensen et al., Reference Mortensen, Green-Pedersen, Breeman, Chaqués-Bonafont, Jennings, John, Palau and Timmermans2011). Motivated by policy goals, party members tend to hold more extreme preferences than party leaders and the general electorate (Seyd and Whiteley, Reference Seyd and Whiteley1992; Whiteley et al., Reference Whiteley, Seyd, Richardson and Bissell1994; Schofield and Sened, Reference Schofield and Sened2006). Furthermore, in mass parties, such as in the United Kingdom, party leaders are heavily reliant on larger party memberships, but rely on less intensive membership campaign tactics when the number of members declines (Schofield and Sened, Reference Schofield and Sened2006). This leads us to predict that a party’s internal dynamics and the intra-party leader’s selectorate will influence party leaders’ decision-making in office (Harmel and Janda, Reference Harmel and Janda1994). Decreases in the numbers of party members in the United Kingdom have freed party leaders to adapt their electoral appeals to be more responsive to potential voters (Seyd and Whiteley, Reference Seyd and Whiteley2004; Schofield and Sened, Reference Schofield and Sened2006). For example, Seyd and Whiteley (Reference Seyd and Whiteley2004) describe this tradeoff for Labour in 1983 (on to nuclear weapons, public ownership, and public housing) and the Conservatives under John Major (the ‘back to basics’ programme of social and moral conservatism) in which both parties proposed policies, which were much more in line with the preferences of their members than those of their broader potential electoral supporters.
More broadly, we argue that change in intra-party politics, such as the number of party members, influences the ability of the party to maintain a stable platform. Intra-party volatility limits parties’ ability to maintain a stable agenda or a similar focus on issues year after year. Parties that dramatically lose members face the challenge of attracting new groups while appeasing the traditional core groups within the party (Kitschelt, Reference Kitschelt1989). Party leaders depend on intra-party groups’ support to organize election campaigns and manage the party organization and must respond to their members’ goals (Seyd and Whiteley, Reference Seyd and Whiteley1992; Schofield and Sened, Reference Schofield and Sened2006; Cross and Blais, Reference Cross and Blais2012; Schumacher, Reference Schumacher2013; Schumacher et al., Reference Schumacher, de Vries and Vis2013). Party members often hold more extreme preferences than leaders (Seyd and Whiteley, Reference Seyd and Whiteley1992; Whiteley et al., Reference Whiteley, Seyd, Richardson and Bissell1994) and are less willing to compromise their policy goals to win elected office (Schofield and Sened, Reference Schofield and Sened2006). Furthermore, party leaders depend more on the electoral support of the party’s organization when a party holds a larger membership (Seyd and Whiteley, Reference Seyd and Whiteley2004; Schofield and Sened Reference Schofield and Sened2006; Schumacher, Reference Schumacher2013). Based on this research, we assume that when party members have greater influence because of their size party leaders will be less likely to make major changes in issue attention.Footnote 3 Our first hypothesis combines this organizational decision-making logic to the level of agenda stability:
Hypothesis 1: Higher party membership increases agenda stability.
As strategic actors, party leaders act to balance their policy goals with goals for winning elections and controlling office (Strøm, Reference Strøm1990; Adams, Reference Adams1999; Spoon, Reference Spoon2011). For example, parties change their policy preferences or discuss new issues as an electoral strategy (Adams and Somer-Topcu, Reference Adams and Somer-Topcu2009; Somer-Topcu, Reference Somer-Topcu2009; de Vries and Hobolt, Reference De Vries and Hobolt2012). Models of electoral competition assume that parties develop policy in office that is consistent with the goals of their voters to avoid appearing unaccountable (Downs, Reference Downs1957; Adams, Reference Adams1999). Scholars find that this appearance influences much of parties’ behavior in parliament, such as the application of parliamentary procedures (Huber, Reference Huber1992, Reference Huber1996), roll call votes (Carey, Reference Carey2009), and parliamentary questions (Vliegenthart and Walgrave, Reference Vliegenthart and Walgrave2011).
Following from this literature, we add that the factors which influence parties’ electoral calculus, such as the economy, are likely to also impact the parliament’s issue attention in a chamber dominated by a single party. Parties change their electoral strategies based on information they have about their potential electoral success. They use signals such as the state of the economy or public opinion to craft their electoral messages (Adams et al., Reference Adams, Haupt and Stoll2009; Soroka and Wlezien, Reference Soroka and Wlezien2010; Williams et al., Reference Williams, Seki and Whittenforthcoming; redacted). Substantial literature finds that governing parties expect voters to punish them for poor economic performance (Powell and Whitten, Reference Powell and Whitten1993; Whitten and Palmer, Reference Whitten and Palmer1999; Lewis-Beck and Stegmaier, Reference Lewis-Beck and Stegmaier2000). When parties expect to do well, they see little reason to meddle with their electoral strategy, whereas parties that expect to lose or decrease votes alter their strategies more dramatically (e.g. Adams and Somer-Topcu, Reference Adams and Somer-Topcu2009; Somer-Topcu, Reference Somer-Topcu2009). Economic conditions also influence the levels of intra-party disagreement; negative economic conditions increase the range of preferences expressed at party national meetings for incumbents and decrease disagreement for opposition parties (Greene and Haber, Reference Greene and Haberforthcoming). Furthermore, Williams et al. (Reference Williams, Seki and Whittenforthcoming) present compelling evidence that incumbent parties responsible for declining economic performance place greater attention on economic issues in their election campaigns. Governments also show greater attention to economic policy relative to other issues when the economy is salient (Jennings et al., Reference Jennings, Bevan, Timmermans, Breeman, Brouard, Chaques, Green-Pedersen, John, Palau and Mortensen2011b).
The government’s agenda also reflects parties’ electoral goals. Parties may change the focus of their attention when economic signals indicate that voters will hold them responsible. Parties fear punishment for appearing incompetent, inactive or unconcerned when the economy declines. However, a strong economy allows parties to pursue their planned agenda without fear of punishment, as voters consider them more competent on a range of issues (Green and Jennings, Reference Green and Jennings2012a, b). Poor economic conditions, therefore, lead to greater agenda stability across issues as the government limits its attention to economic policies,Footnote 4 but becomes less stable as the government focuses on a broader range of problems when the economy improves. This argument follows from related findings on the effect of the level of the government’s economic focus on the ability to attend to other issues (Jennings et al., Reference Jennings, Bevan, Timmermans, Breeman, Brouard, Chaques, Green-Pedersen, John, Palau and Mortensen2011b) and is consistent with Green-Pederson and Mortensen’s (Reference Green-Pedersen and Mortensen2010) finding that parties respond to economic conditions in office.Footnote 5 Our second hypothesis summarizes this logic:
Hypothesis 2a: A poor economy increases agenda stability.
However, this relationship reverses following a partisan transition. Parties with alternate ideological prescriptions for the economy will see little reason to address the economy in the same way as their fallen competitor. Instead, the new party in power faced with a poor economic situation will substantially shift the agenda towards its set of economic solutions. For example, the Labour Party may choose to focus its attention to issues related to workers’ benefits under a weak economy, whereas the Conservative party would instead choose to address regulations on business groups (Hibbs, Reference Hibbs1977). Therefore, the following hypothesis adds party transitions as a moderating factor for the effect of economic conditions on agenda stability:
Hypothesis 2b: A poor economy decreases agenda stability following a partisan transition.
In addition to intra-party politics and responses to economic conditions, the government’s ability to control parliament also influences agenda stability. Substantial literature finds that parties’ ability to win votes in parliament plays an important role in determining their ability to achieve policy goals. Parties in parliaments with weak party discipline, when members of the same party frequently vote against the party leadership’s proposals, are limited in the range of policies they can pass by differences in the policy preferences of its own members (Carey, Reference Carey2009). Party leaders use various legislative procedures to encourage party members to vote in a certain way, such as attaching votes of confidence to legislation, limiting amendments, or by controlling the voting order in which proposals are presented (Huber, Reference Huber1992, Reference Huber1996; Döring, Reference Döring2001, Reference Döring2003). Parliaments with procedures that provide leaders with substantial legislative control and consequently high levels of discipline should not face as many difficulties initiating their policy goals (Döring, Reference Döring2001, Reference Döring2003; Bevan et al., Reference Bevan, John and Jennings2011). Despite the high levels of discipline in the House of Commons, we argue that British governments are also limited by their ability to pass Acts of Parliament. Since World War II Parliament averaged only 59 Acts per year. From this perspective, governing parties that hold a small majority may face the need for greater intra-party log-rolls or bargains to ensure complete party support for certain Acts. Larger parliamentary majorities allow the government to focus on its legislative agenda while still allowing for a certain degree of intra-party disagreement (Huber, Reference Huber1996) or in the case of the UK backbench rebellions.
This logic fits well with theories of party discipline that indicate that party leaders have more options for obtaining a majority in voting when the party has a large majority (e.g. Cox and McCubbins, Reference Cox and McCubbins1994; Cox, Reference Cox2000). Indeed, the procedures available to the prime minister in the House of Commons give the leadership substantial tools to encourage parliamentary discipline (Cox, Reference Cox1987; Döring, Reference Döring2001, Reference Döring2003), but require majorities within parliament to support the passage of legislation. Despite high levels of parliamentary discipline, the leader of a party with a small legislative majority may be forced to offer policy concessions as inducements to members that might otherwise defect from the party line. Furthermore, in a first-past-the-post electoral system larger majorities include a greater number of actors within the party with a diverse range of electoral constituents. To maintain an appearance of party unity (Ceron, Reference Ceron2013), party leaders may avoid forcing votes on contentious issues (negative agenda control) to protect MPs’ and the party’s future electoral success (Cox, Reference Cox2000; Martin, Reference Martin2004). The recent free vote on the Marriage (Same Sex Couples) Act 2013 where members were not instructed by their parties on how to vote demonstrates the caution that exists in the UK system. In general, the agenda will be more stable from this perspective when the governing party only needs to maintain the support of a fraction of its members, rather than all of them:
Hypothesis 3a: A larger parliamentary majority increases agenda stability.
Like Huber’s (Reference Huber1996) finding on the timing of legislative procedures, new governments prioritize their electoral priorities early in the new legislative cycle (see also Martin, Reference Martin2004). Large majorities in this setting have an upper hand following a partisan transition. Party leaders require fewer procedures and inducements to find a majority on which intra-party consensus exists on an issue when the party holds a larger majority. Instead, parties with a smaller majority require greater intra-party bargaining and require greater time to enact their preferred policies. This perspective connects well to studies of coalition governance and policy change. Like governing coalitions, parties focus first on the easily negotiated policies before moving on to more contentious topics (Martin, Reference Martin2004). Larger majorities, therefore, quickly enact their policy priorities. A large majority, which includes a large number of new MPs, leads to a less stable agenda following a transition because of the contrast between the new government’s and the outgoing party’s agendas. The following hypothesis summarizes our expectation linking the size of the majority in parliament to agenda stability following a transition:
Hypothesis 3b: A larger parliamentary majority decreases agenda stability following a partisan transition.
Although we expect intra-party politics, economic conditions and parties’ ability to control parliament to influence the government’s agenda, we add that elections and the partisan transitions that follow from them provide the greatest opportunity for partisan differences to arise. Elections provide voters with the opportunity to choose between parties with competing electoral platforms and policy proposals (Downs, Reference Downs1957). When a new party comes into power, parties seek to enact their policy proposals both because they sincerely value those goals and because they instrumentally value those goals so that they can win future elections by appearing accountable to voters (Strøm, Reference Strøm1990). Once parties are in office, they may feel little need to change their policy focus. Assuming that parties’ policy priorities remain stable in office, we predict that the agenda should become increasingly stable the longer a party controls the government:
Hypothesis 4: Time controlling government increases agenda stability.
Data and methods
This paper focuses on the UK Policy Agendas Project Acts of the UK Parliament dataset from 1945 to 2008 and covers 19 major topic codes that encompass all the issues the UK Parliament deals with (see www.policyagendas.org.uk for the data and complete details concerning its coding). UK Acts of Parliament are the primary legislation enacted by the UK Parliament, which is headed by the prime minister and supported generally by a single party throughout this time period.Footnote 6
We argue that the United Kingdom is a difficult test of our theory for a number of reasons. In particular, previous literature on the policy agenda has found little support for an effect of parties on policy attention (Bevan et al., Reference Bevan, John and Jennings2011; Jennings et al., Reference Jennings, Bevan and John2011a). Based on this literature, we would expect little or no evidence of party effects on agenda stability in the United Kingdom. High levels of party discipline in parliament and single party majorities mean that small changes in parties’ organizations and parliamentary delegation should be less likely to have much of an impact, unless parliamentary leaders react to intra-party politics (Döring, Reference Döring2001, Reference Döring2003). Given that many of our hypotheses predict an effect from within party differences (Cox, Reference Cox1987, Reference Cox2000), rules favoring high levels of party discipline in parliament and that provide the cabinet with substantial control of the parliamentary voting agenda stack the deck against our theory. Although these same conditions make for a relatively weak test of the broad party matters thesis, we are quite confident that if we find evidence consistent with our hypotheses that we can make valid inferences to other parliamentary democracies with weaker levels of parliamentary discipline.
Using data from the UK Policy Agendas Project, we calculate a measure of agenda stability (see Mortensen et al., Reference Mortensen, Green-Pedersen, Breeman, Chaqués-Bonafont, Jennings, John, Palau and Timmermans2011) as our dependent variable.Footnote 7 Agenda stability captures the degree of similarity in the complete issue attention for Acts of Parliament across all issues from year to year. We calculate agenda stability using the following formula:
 $$AS_{t} =100{\minus}{{\left( {\mathop{\sum}\nolimits_{i=1}^n {\!\mid\!Acts_{{it}} {\minus}Acts_{{it{\minus}1}} \!\!\mid} } \right)} \over 2}$$
where Acts is equal to the percentage of acts in an issue at time t and time t−1 with the absolute value of the difference summed over all possible issues in the agenda (n). This value is divided by 2 as the maximum value is equal to 200 and the minimum value is 0 and is subtracted from 100 so that the agenda stability (AS) is highest at 100 and lowest at 0. Agenda stability therefore measures how consistent attention is across issues from 1 year to the next. If the exact same percentage of acts is devoted to each issue in year t and t−1, agenda stability is equal to 100. If every issue switches from some percentage to 0% and from 0% to some percentage then agenda stability is equal to 0.Footnote 8
Take for example a hypothetical parliament limited to passing only two acts of parliament each year. In this parliament, agenda stability equals 100 every year if both acts address the same issue, such as healthcare. If some shock occurred that caused the party to use one act for environmental policy (instead of healthcare), then agenda stability would drop to 50. Despite the same number of acts each year, this drop in stability indicates that the topics the government addressed changed. Agenda stability allows us to focus on the aggregate level of substantive changes in the issues included in acts over time without having to make strong assumptions about which issues new parties will emphasize.
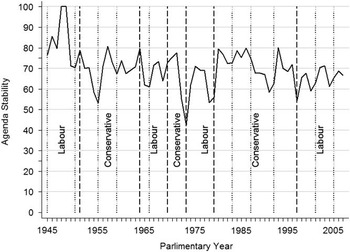
The agenda stability of UK Acts of Parliament from 1945 to 2008 is presented in Figure 1. The x-axis, Parliamentary Year, indicates the year in which parliament opened for a new session with the Speech from the Throne. The start of a new parliamentary session occurs at the end of the calendar year or in May for years with an election (Jennings et al., Reference Jennings, Bevan and John2011a). In this figure, we note the majority party and partisan transitions with vertical dashed lines. Elections not resulting in a transition are noted with vertical dotted lines.
Agenda stability by parliamentary year, 1945–2008.

As Figure 1 shows there are no obvious patterns in agenda stability by party, elections or transitions from a visual inspection of the measure in the figure.Footnote 9 It is, however, noteworthy how stable our measure of agenda stability tends to be. While there are clear cases when a party transition associates with decreased stability, the mean agenda stability of Acts of Parliament is clear and persistent over time. Specification tests of this measure revealed our measure of agenda stability to be white noise with a signal significant spike in both the auto-correlation and partial auto-correlation functions.Footnote 10
To fully test our hypotheses, we make use of an auto-distributed lag model of agenda stability, which includes a series of independent variables and interactions to account for the conditional nature of our hypotheses. The model also includes a lagged dependent variable to account for the time series nature of agenda stability. The first of our independent variables measures the number of registered party members in the electorate of the party in power (see McGuinness, Reference McGuinness2012). This measure provides a crude but reliable measure of the size of the intra-party organizational mechanism and the associated difficulty with maintaining a parsimonious policy program with higher membership numbers. Overall, our first hypothesis predicts that a larger party membership leads to increased agenda instability for both parties.Footnote 11
Our second independent variable captures the overall state of the economy through the UK misery index, a measure created through the addition of the unemployment and inflation rates. We chose this measure of economic circumstances instead of unemployment or inflation to create an ideologically neutral measure of the economy. This approach avoids the potential issues posed by associating specific parties with their assumed historical issue ownership, such as the relationship between the Labour party and unemployment that may make the effect of these individual measures somewhat ambiguous (Hibbs, Reference Hibbs1977; Budge and Farlie, Reference Budge and Farlie1983). Misery on the other hand increases as the general economic condition worsens, which should affect both Conservative and Labour governments in a similar manner.Footnote 12
We also include a measure of the majority size calculated as the percentage seats the government party controls as the total number of seats in parliament varies from a low of 625 to a high of 659 seats making a count of seats inconsistent over time.Footnote 13 Given our interest in the government’s ability to internally negotiate to find a parliamentary majority in the third set of hypotheses, we measure government size as the majority party’s seats divided by the total number of seats in parliament and multiplied by 100 to ease interpretation. Nearly all governments (see footnote 6) throughout the period control a majority of seats in the parliament. In the United Kingdom, a smaller majority size should arguably make for a less stable government, one unable to easily maintain a set policy program as party leaders are forced to induce MPs to support the party’s policy proposals.
To account for partisan transitions in power, we make use of a party transition dummy variable. This measure is coded 1 in the first parliamentary year directly following an election that led to a change in the party majority. Analyses of the effect of both pre- and post-election dummy variables as possible alternative measures led to poorer fitting models and less fruitful results.Footnote 14 However, given our theoretical expectations the real effect of elections on stability should only occur when an election leads to a change in government.
We further include an interaction of our transition dummy variable with our party membership, misery index, and majority size variables. We expect the effects of party membership to be in the same direction regardless of a transition. A higher party membership during a transition will likely produce a less radical shift in policy as a high membership also relates to a more ideologically centrist program and less consensus within the party (see Ceron, Reference Ceron2013; Greene and Haber, Reference Greene and Haberforthcoming). A high value for misery also leads to a unique effect; bad economic circumstances and a party transition will lead to a large and observable shift in policy as governments pursue alternate possible solutions to poor economic circumstance. Finally, government parties with a larger majority are more quickly capable of implementing its policy program and therefore, more dramatically destabilize the agenda in the 1st year following a transition.
Our final independent variable measures the number of years a party has been in power. This government age variable is a count variable from 1 that indicates how many years a party has controlled the prime minister. This measure captures our general belief that parties become better able to maintain a stable agenda over time when accounting for each of the above effects.
Analyses
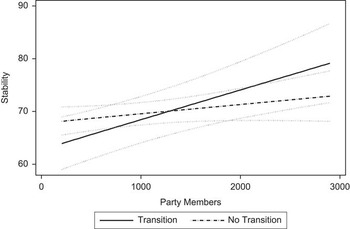
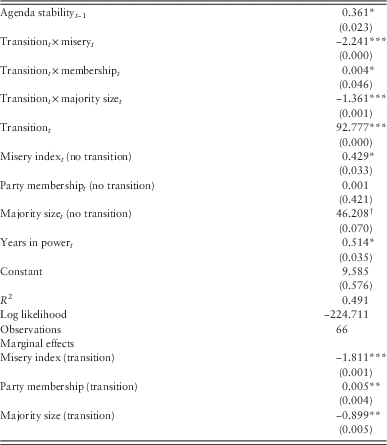
Table 1 presents our auto-distributed lag model of agenda stability from 1945 to 2008. Because of the nature of our variables, particularly the transition variable each of our independent variables is treated as contemporaneous.Footnote 15 Figures 2–4 present the predicted effects of each of our three interactions on agenda stability.
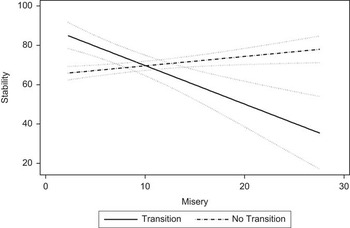
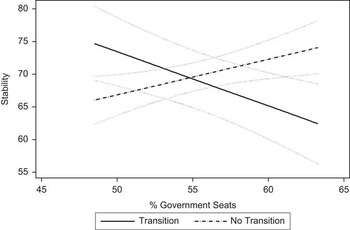
Predicted effect of party membership. The solid black line indicates the predicted change in agenda stability for increasing party membership size holding the independent variables at their mean values for the year following a party transition. The dashed line shows the predicted effect for agenda stability in non-transition years. The dotted lines around the solid line represent 95% confidence intervals based on simulations using 1000 draws from the estimated variance–covariance matrix from the results presented in Table 1. Figures 3 and 4 use the same method for the predicted effects of misery and government seat share, respectively.

Predicted effect of misery.

Predicted effect of government seat share.

Time series analyses of agenda stability (1945–2008)

P-values in parentheses.
† P<0.10, *P<0.05, **P<0.01, ***P<0.001.
The results from the analysis largely support our hypotheses and the logic behind our partisan explanations of agenda stability. As suggested in Hypothesis 1, the coefficient for party membership and its interaction with party transition are both positive. The marginal effect of party membership during a transition (presented at the bottom of Table 1)Footnote 16 is statistically different from zero at the 99% confidence level. The size of this effect is presented in Figure 2. This indicates that parties that have a larger membership in the electorate maintain a more stable agenda immediately following a partisan transition. By employing a bigger winning intra-party coalition, the party cannot as easily break with the issue attention of the past government’s political agenda. Interestingly, the effect is only statistically significant for the interaction with partisan transition. Party members may only dominate the party’s agenda when the membership is paying the closest attention to its behavior in government: immediately following an electoral victory. The party can then more easily change its agenda in the years that follow a transition.
There is also evidence that the economy plays an important role in government agenda stability. As predicted by H2a, the positive and significant coefficient for the misery index indicates that greater economic misery increases the agenda stability. This demonstrates that as the economy performs poorly governments double down on their policies attempting to turn around economic circumstances through their existing policy program. The large, negative and significant marginal effect for misery during a partisan transition provides evidence for H2b. Following a partisan transition, the new party in government shifts the agenda to focus on different priorities than the prior government when faced with negative economic conditions. We present the substantive magnitude of these effects over different values of the misery index in Figure 3.
These results match case-specific evidence of party transitions under a poor economy. For example, when the Conservative party came into power under Thatcher in the 1979, the new government changed the agenda to focus on issues such as deregulation of financial markets, creating flexible labour markets and the privatization of state-owned industries decreasing overall agenda stability. The previous Labour government had dedicated its policy attention primarily to relations with reducing unemployment, reforming Trade Unions and keeping prices and inflation low (BBC News, 1979).Footnote 17
This finding also connects well with studies from an economic voting perspective. Seeking to appear accountable to their primary constituents, parties focus on the economic priorities of these groups when they enter into office (Hibbs, Reference Hibbs1977; Hicks and Swank, Reference Hicks and Swank1992; Petrocik, Reference Petrocik1996). Furthermore, this increased instability indicates real difference between the issues parties use to approach dealing with poor economic conditions. This difference suggests that choice between the government and opposition parties leads to real differences in government outcomes and that at least part of the motivation for economic voting, a desire for a change in policy by the electorate, takes place.
Like economic conditions and intra-party politics, the results support our expectations based on the size of the government’s majority in parliament. In particular, we find evidence for H3a that parties with a larger majority maintain a more stable agenda, although the coefficient is only statistically significant at the 90% confidence level. As we expect from H3b, this effect is reversed for parties following a partisan transition; majority size has a negative effect and is significant at the 99% confident interval during a party transition. Parties with a larger majority are less affected by backbench rebellions and therefore can better focus the agenda on party priorities. Governments with smaller legislative delegations face difficulty with the more controversial elements of their agenda. We demonstrate these effects for different majority sizes in Figure 4.
As the discussion of intra-party politics, the economy, and the party’s parliamentary majority demonstrate, there is a clear effect for parties’ time in office. The time between transitions is noteworthy, not just in how parties react to membership, misery, and majority size, but in their general pattern of increasing stability over time. The years in power variable indicates that the longer a party stays in government the more stable the agenda generally becomes with a positive and significant effect at the 95% level. This matches H4 and indicates that governments professionalize and stabilize over time, increasing their ability to maintain a stable agenda. This likely indicates an effect from parties’ greater expertise at implementing and maintaining their agenda with greater time in office.
Finally, lagged agenda stability is positive and significant at the 95% confidence level, but noticeably smaller than most autoregressive series. Given the inconclusive specification tests concerning the time series properties of our agenda stability variable this is, however, to be expected. Alternative models employing either a moving average or dropping the lagged agenda stability measure of the model produced the same inferences for each of our hypotheses, but were poorer fitting.
Conclusion
Our focus on agenda stability moves away from two of the most traditional methods for assessing partisan influence: attention to single issues and/or preferences over those issues. By focusing on a non-directional and aggregated measure of attention, we can assess the degree of change in party programs based on intra-party and contextual characteristics without the need to measure preferences or make strong assumptions concerning the ownership of specific issues. Through our analyses we find clear evidence of significant and consistent ways through which parties’ capacities and context influence the distribution of issue attention in the government’s policy agenda. The effect for each of our primary explanatory variables is clearest immediately following partisan transitions. Parties with more members in the electorate increase agenda stability following a transition, although the number becomes less important later in the legislative cycle. Likewise, parties respond to economic conditions differently. New governments take a different approach than previous governments under poor economic conditions, yet parties maintain a stable agenda in response to a weak economy once they are in power. Finally, parties with a clearer legislative majority are more capable of dominating the legislative agenda than parties with smaller majorities. This effect is most pronounced following a transition when they can more quickly shift the government’s agenda. This dominance allows governments later in the legislative cycle to maintain more consistent attention to their issue priorities.
The stability of the government’s agenda also exhibits expected patterns over time with generally increasing agenda stability the longer a government is in power. For change to happen within government, the economy must be booming. Parliamentary leaders with small government majorities must bargain for intra-party support, negotiate log rolls, or enforce party discipline across issues to enact their most preferred legislation. Governing parties are unlikely to change their agenda unless a strong economy allows them some additional leeway to expand the scope of their policy priorities. In addition, small majorities may be forced to compromise with minority groups to protect their greater agenda in office.
By focusing on a case with high levels of parliamentary discipline and still finding effect of intra-party variation, the results of our hypotheses on intra-party politics and parliamentary delegations should extend to countries with lower levels of discipline and less hierarchical parties. These results build on recent studies of party organizational change (Schumacher, Reference Schumacher2013; Schumacher et al., Reference Schumacher, de Vries and Vis2013) and parliamentary behavior (Ceron, Reference Ceron2013) that find real evidence of intra-party politics on government behavior. However, future research will have to uncover the extent to which similar dynamics within and between parties occurs in multiparty democracies with regular governing coalitions. Issue-level evidence suggests a prominent role for both government and opposition parties dependent on the coalition bargaining dynamics (e.g. Green-Pederson and Korgstrup, Reference Green-Pedersen and Krogstrup2008; Seeberg, Reference Seeberg2013).
Unlike previous studies from an agenda-setting perspective, these results paint a clear picture of aggregate partisan influence on the government’s agenda based on party memberships, majorities, the economy, and professionalization while in government. Our results help explain the previous lack of evidence of partisan influence. Previous studies searched for a partisan effect based on the issues that they assumed parties had a historical ownership over, largely finding that parties do not hold fixed preferences for policy on certain issues based on their party’s ideological family (e.g. John et al., Reference John, Bevan and Jennings2014). Importantly, by only focusing on a single issue at a time, these previous analyses did not address our fundamental question directly; does the government’s policy agenda change due to party transitions? We add a direct test of this question to the agenda-setting literature by demonstrating that parties are dynamic organizations, which respond to current political contexts. While we have not directly linked parties’ ideological preferences to the distribution of policy, we find straightforward evidence using our more nuanced approach that the political context (economic conditions) and the governing party’s attributes lead to significant differences in agenda stability. Therefore, while previous studies generally suggest that the effect of party transition on the government agenda is minor on an issue by issue basis, we find the effect of transition on the overall agenda is in fact quite noticeable and dependent on the characteristics of parties themselves as well as their environment. Our research should serve as a complement to previous studies from an issue-by-issue basis by showing the aggregate influence of partisan change. Together, the issue-level research and our aggregate results tell a rich story of the extent to which parties influence policy change. Future research would do well to recognize that the attributes of parties and not just their place on a left–right scale affect how they function and how they respond to different contexts such as the economy.
Our results have clear implications for voters and government accountability. Voters are increasingly pessimistic towards parties across the democratic world based at least in part on the belief that there is little difference between what parties do in government (Dalton, Reference Dalton2008). Our findings optimistically suggest that there are real differences in issues attended to in Acts of Parliament following party transitions in government. However, parties see little reason to change their program once they have implemented their agenda in office. This evidence supports a model of accountability similar to the economic voting perspective where voters reward and punish parties based on economic performance. The logic follows that there is little reason to expect parties to change their behavior once they are in government with parties doubling-down on their agendas during hard economic times, when the size of their majority is strong and the longer they are in power.
Our analysis provides clear results consistent with our theory using a difficult case for within party influence. However, the research design limits our ability to make broad generalizations from this analysis. The results may not be fully robust to electoral contexts in which the relative location of parties’ preferences is more important to voters than the issues they discuss (Green and Hobolt, Reference Green and Hobolt2008). Future research would benefit from testing our more nuanced party-based explanations in a broader range of countries that include multiparty governments or weak parliamentary discipline. More broadly, the results of our analysis indicate that scholars would benefit from adopting more discerning measures of party characteristics. Party leaders seeking to win future elections must contend with diverse intra-party groups, changing economic context, and bargain with MPs from within their party to maintain a stable agenda.
Acknowledgments
This work was supported by the Collaborative Research Center 884 Political Economy of Reforms (Projects C1 and C2), funded by the German Research Foundation.