1 Introduction
The behaviour of bubbles or solid particles in a horizontal solid-body rotational flow has recently been the object of study: van Nierop et al. (Reference van Nierop, Luther, Bluemink, Magnaudet, Prosperetti and Lohse2007), Bluemink et al. (Reference Bluemink, Lohse, Prosperetti and Van Wijngaarden2008, Reference Bluemink, Lohse, Prosperetti and Van Wijngaarden2010), Rastello et al. (Reference Rastello, Marié, Grosjean and Lance2009), Rastello, Marié & Lance (Reference Rastello, Marié and Lance2011). This flow situation is doubly interesting. It is representative of regions with local vorticity encountered in many practical applications, such as turbulence or mixing layers. Secondly, buoyancy-driven bubbles or particles in this type of flow reach an equilibrium point, from which it is possible to visualize them steadily and/or measure the coefficients of the drag and lift forces. The determination of such forces is fundamental to achieve a satisfactory description of bubble or particle dispersion in rotational flows and more generally in non-homogeneous flows. In the case of bubbles, the main advantage of the solid-body rotation is that, since the bubble is kept stationary, surface deformation and contamination, which impact these forces, can be more easily investigated. The boundary conditions to which the surrounding liquid is subjected depends on the purity of the bubble surface (Magnaudet & Eames Reference Magnaudet and Eames2000). When the bubble is clean, the liquid is subjected to a shear-free condition and is free to slip along the surface. When the surface is contaminated, its rigidity is increased by Marangoni effects. The shear-free boundary condition is no longer satisfied, so that the slip of the liquid at the bubble surface can be reduced or even suppressed. The forces acting on the bubble in both cases will obviously be different. Deformation also contributes to change the flow characteristics around the bubble and so, modifies the forces (Moore Reference Moore1959). If the surface is stiffened by contaminants, deformation may be delayed and/or reduced.
Some of these issues have been addressed in our two previous papers Rastello et al. (Reference Rastello, Marié, Grosjean and Lance2009, Reference Rastello, Marié and Lance2011). We have measured the drag and lift coefficients on spherical bubbles whose surfaces are successively contaminated (experiments in demineralized water) and clean (experiments in silicon oils). The striking difference between the two situations is that the bubble surface is spinning when contaminated and in doing so, induces an excess lift force on the bubble, similar to the one seen with solid particles (Bluemink et al. Reference Bluemink, Lohse, Prosperetti and Van Wijngaarden2008). The excess lift force due to spinning was found to be well approximated by a Magnus-like lift force calculated on the measured mean spinning rates.
In this investigation, we have completed the data using demineralized water to better characterize the effect of contamination. The spinning motion causing the excess lift has been described in more detail. It is shown that when the bubble is partly contaminated, the spinning rate is faster in the region where the wake separates. On the other hand, when the bubble is fully contaminated, the spinning rate is constant all around the bubble as would be the case for a solid surface. This spinning motion does not take place when the surface is clean, as proved by visualizations in silicon oil. Also, we have quantified how contamination influences the deformation. It is found that the deformation of contaminated bubbles, for a given Weber number, is weaker than for clean bubbles and that it cannot be described by the expressions proposed in Rastello et al. (Reference Rastello, Marié and Lance2011) or in Legendre, Zenit & Velez-Cordero (Reference Legendre, Zenit and Velez-Cordero2012) for bubbles in stagnant pure liquids. Finally, the drag and lift coefficients for deformed contaminated bubbles, which have not yet been measured, are reported and compared to the coefficients previously obtained for deformed clean bubbles (Rastello et al. Reference Rastello, Marié and Lance2011). The results are presented in the form of a synthesis of clean versus contaminated bubbles and organized as follows. Section 2 provides the principle of the forces measurements, the parameter range investigated and the non-dimensional numbers useful for the study. Section 3 deals with the surface behaviour: the flow near the surface, the characterization of the spinning motion and the deformation. Section 4 comes with a presentation and discussion of the influence of the surface behaviour on the drag and lift forces. An expression for the excess lift is proposed in the light of the new data. Experimental bubble trajectories are compared to computed ones using lift and drag forces established in the present paper.
2 Brief description of the experimental procedure
This section summarizes the main features of the experimental procedure used in this study. The reader is addressed to Rastello et al. (Reference Rastello, Marié, Grosjean and Lance2009, Reference Rastello, Marié and Lance2011) for a complete description of the facility, the fluids properties and of the flow field characteristics.
2.1 Principle of the forces’ measurements
The experiment is conducted in a cylindrical tank (Ø = 10 cm,
 $L=10$
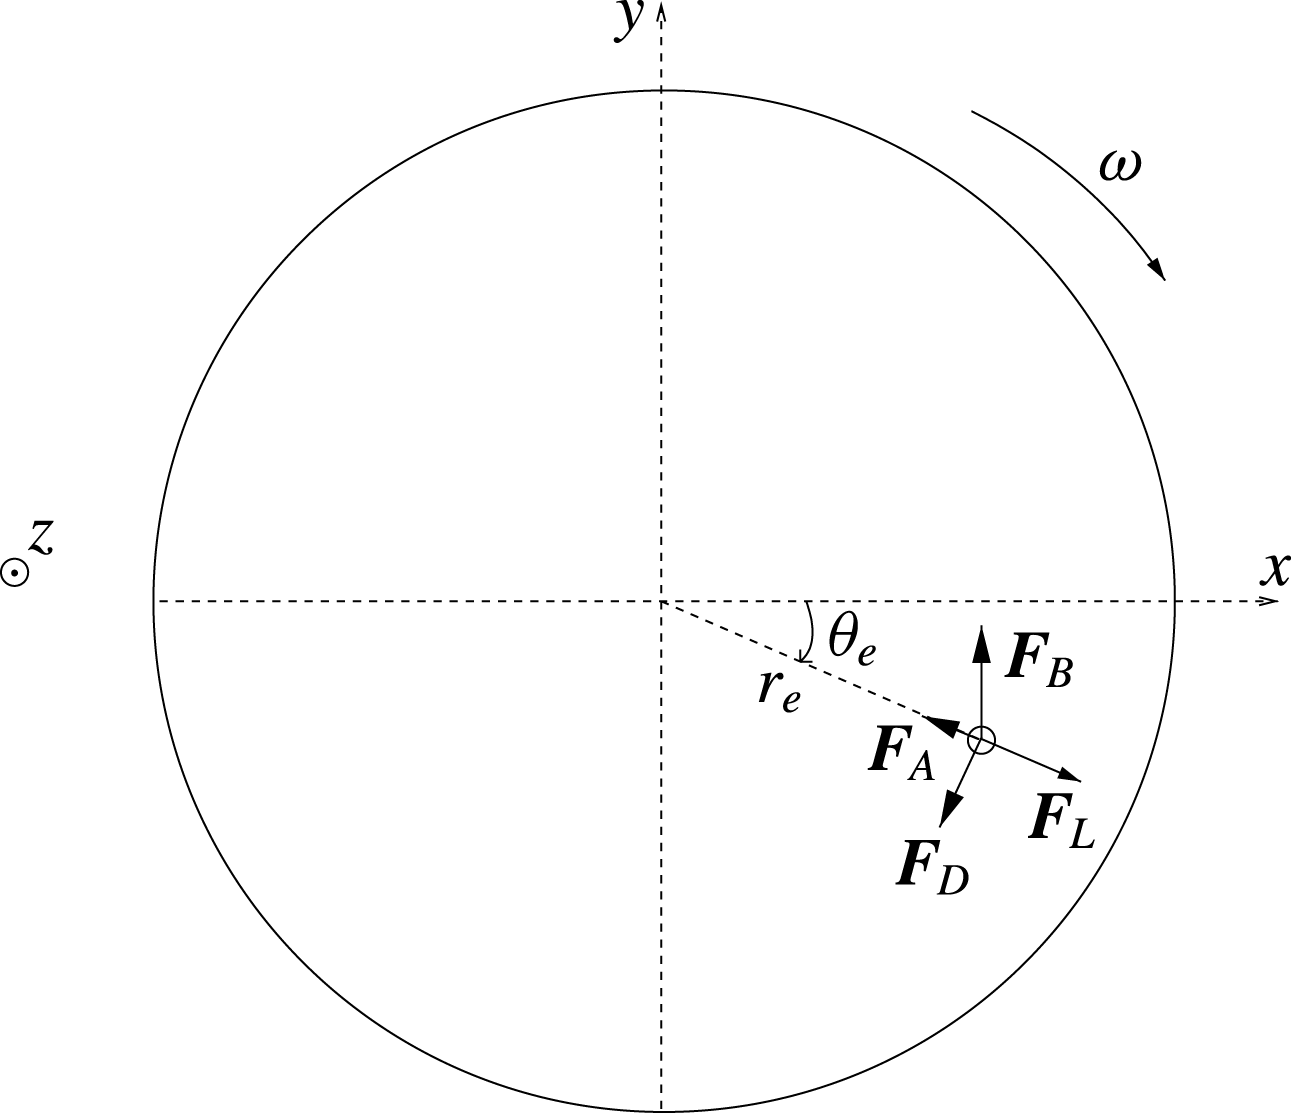
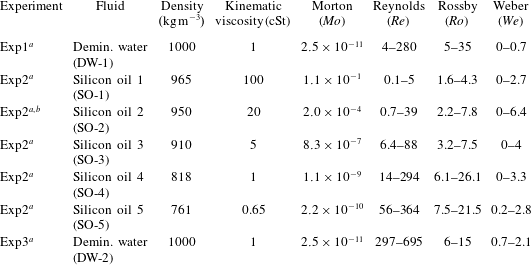
cm) rotating around a horizontal axis. The tank is filled with demineralized water or silicon oils with various viscosities (table 1). When the rotation of the flow is stationary, all the forces acting on the bubble balance and the bubble comes to an equilibrium point (see figure 1). For the bubbles considered in this study which have moderate to large Reynolds numbers, this force balance is given by
 $$\begin{eqnarray}\boldsymbol{F}_{B}+\boldsymbol{F}_{A}+\boldsymbol{F}_{D}+\boldsymbol{F}_{L}=0,\end{eqnarray}$$
where
 $\boldsymbol{F}_{B}$
is the buoyancy.
 $\boldsymbol{F}_{A}$
is the sum of the added mass and the inertial forces. The inertial force corresponds to the pressure gradient in the fluid and is also called the pressure gradient force.
 $\boldsymbol{F}_{D}$
is the drag force and
 $\boldsymbol{F}_{L}$
the lift force.
 $\boldsymbol{F}_{B}$
and
 $\boldsymbol{F}_{A}$
are known analytically, the lift
 $C_{L}$
and drag
 $C_{D}$
coefficients are deduced as
 $$\begin{eqnarray}C_{L}=\frac{1}{2}\left(1+C_{A}-\frac{g\sin \unicode[STIX]{x1D703}_{e}}{r_{e}\unicode[STIX]{x1D714}^{2}}\right)\end{eqnarray}$$
and
 $$\begin{eqnarray}C_{D}=\frac{4}{3}\frac{gd\cos \unicode[STIX]{x1D703}_{e}}{r_{e}^{2}\unicode[STIX]{x1D714}^{2}},\end{eqnarray}$$
where
 $g$
is the gravity acceleration, (
 $r_{e}$
,
 $\unicode[STIX]{x1D703}_{e}$
) are the polar coordinates (
 $r$
,
 $\unicode[STIX]{x1D703}$
) of the centre of the bubble at equilibrium,
 $\unicode[STIX]{x1D714}$
the rotation speed of the tank and
 $d$
the equivalent diameter of the bubble.
 $C_{A}$
is the added mass coefficient. Its value is 0.5 for spherical bubbles (Magnaudet & Eames Reference Magnaudet and Eames2000), while for oblate spheroidal bubbles it depends on the aspect ratio
 $\unicode[STIX]{x1D712}$
(Lamb Reference Lamb1932). Thus, if one measures
 $r_{e}$
and
 $\unicode[STIX]{x1D703}_{e}$
,
 $d$
and
 $\unicode[STIX]{x1D714}$
, the values of
 $C_{L}$
and
 $C_{D}$
can be readily calculated. To make these measurements the bubble at equilibrium is illuminated from behind and imaged with a Phantom V4.3 high speed camera positioned in front of the tank. Its polar coordinates, equivalent diameter and shape are measured from sequences of 2000 images processed using in-house software under Matlab.
The forces applied to a bubble at equilibrium at moderate to high Reynolds numbers (Rastello et al.
Reference Rastello, Marié, Grosjean and Lance2009).
 $\boldsymbol{F}_{B}$
is the buoyancy force,
 $\boldsymbol{F}_{D}$
the drag force,
 $\boldsymbol{F}_{L}$
the lift force.
 $\boldsymbol{F}_{A}$
is the sum of the added mass and inertial forces. In this diagram, the angular velocity
 $\unicode[STIX]{x1D714}$
and equilibrium angle
 $\unicode[STIX]{x1D703}_{e}$
are negative.

Fluid properties – parameter ranges.
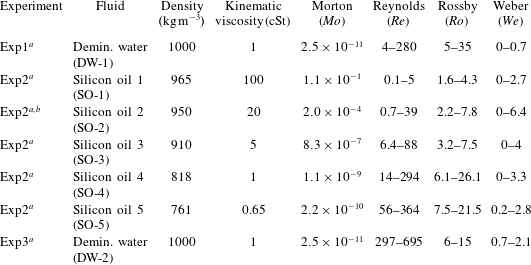
a Exp1: Rastello et al. (Reference Rastello, Marié, Grosjean and Lance2009), Exp2: Rastello et al. (Reference Rastello, Marié and Lance2011), Exp3: present experiments.
b Ten (SO-2) experiments have been performed in the present set of experiments to visualize the wake of the bubbles together with the non-rotation of the bubble’s surface.
2.2 Parameter range – non-dimensional numbers – water quality
The non-dimensional numbers chosen to describe the flow are those already used. These are the Reynolds number
 $Re=|v-U|d/\unicode[STIX]{x1D708}$
and the Rossby number
 $Ro=|v-U|/\unicode[STIX]{x1D714}d$
(equal to the inverse of the local shear rate
 $S$
) for spherical bubbles. When the bubble is deformed, the Morton number
 $Mo=g\unicode[STIX]{x1D708}^{4}\unicode[STIX]{x1D70C}^{3}/\unicode[STIX]{x1D70E}^{3}$
and the Weber number
 $We=\unicode[STIX]{x1D70C}|v-U|^{2}d/\unicode[STIX]{x1D70E}$
are added.
 $\unicode[STIX]{x1D70C}$
stands for the liquid density,
 $\unicode[STIX]{x1D708}$
the kinematic viscosity and
 $\unicode[STIX]{x1D70E}$
the surface tension. When the bubble is at equilibrium, its velocity is
 $v=0$
and the liquid velocity it sees is
 $U=\unicode[STIX]{x1D714}r_{e}$
, so that the non-dimensional numbers simplify to
 $Re=\unicode[STIX]{x1D714}r_{e}d/\unicode[STIX]{x1D708}$
,
 $Ro=r_{e}/d$
,
 $We=\unicode[STIX]{x1D70C}\unicode[STIX]{x1D714}^{2}r_{e}^{2}d/\unicode[STIX]{x1D70E}$
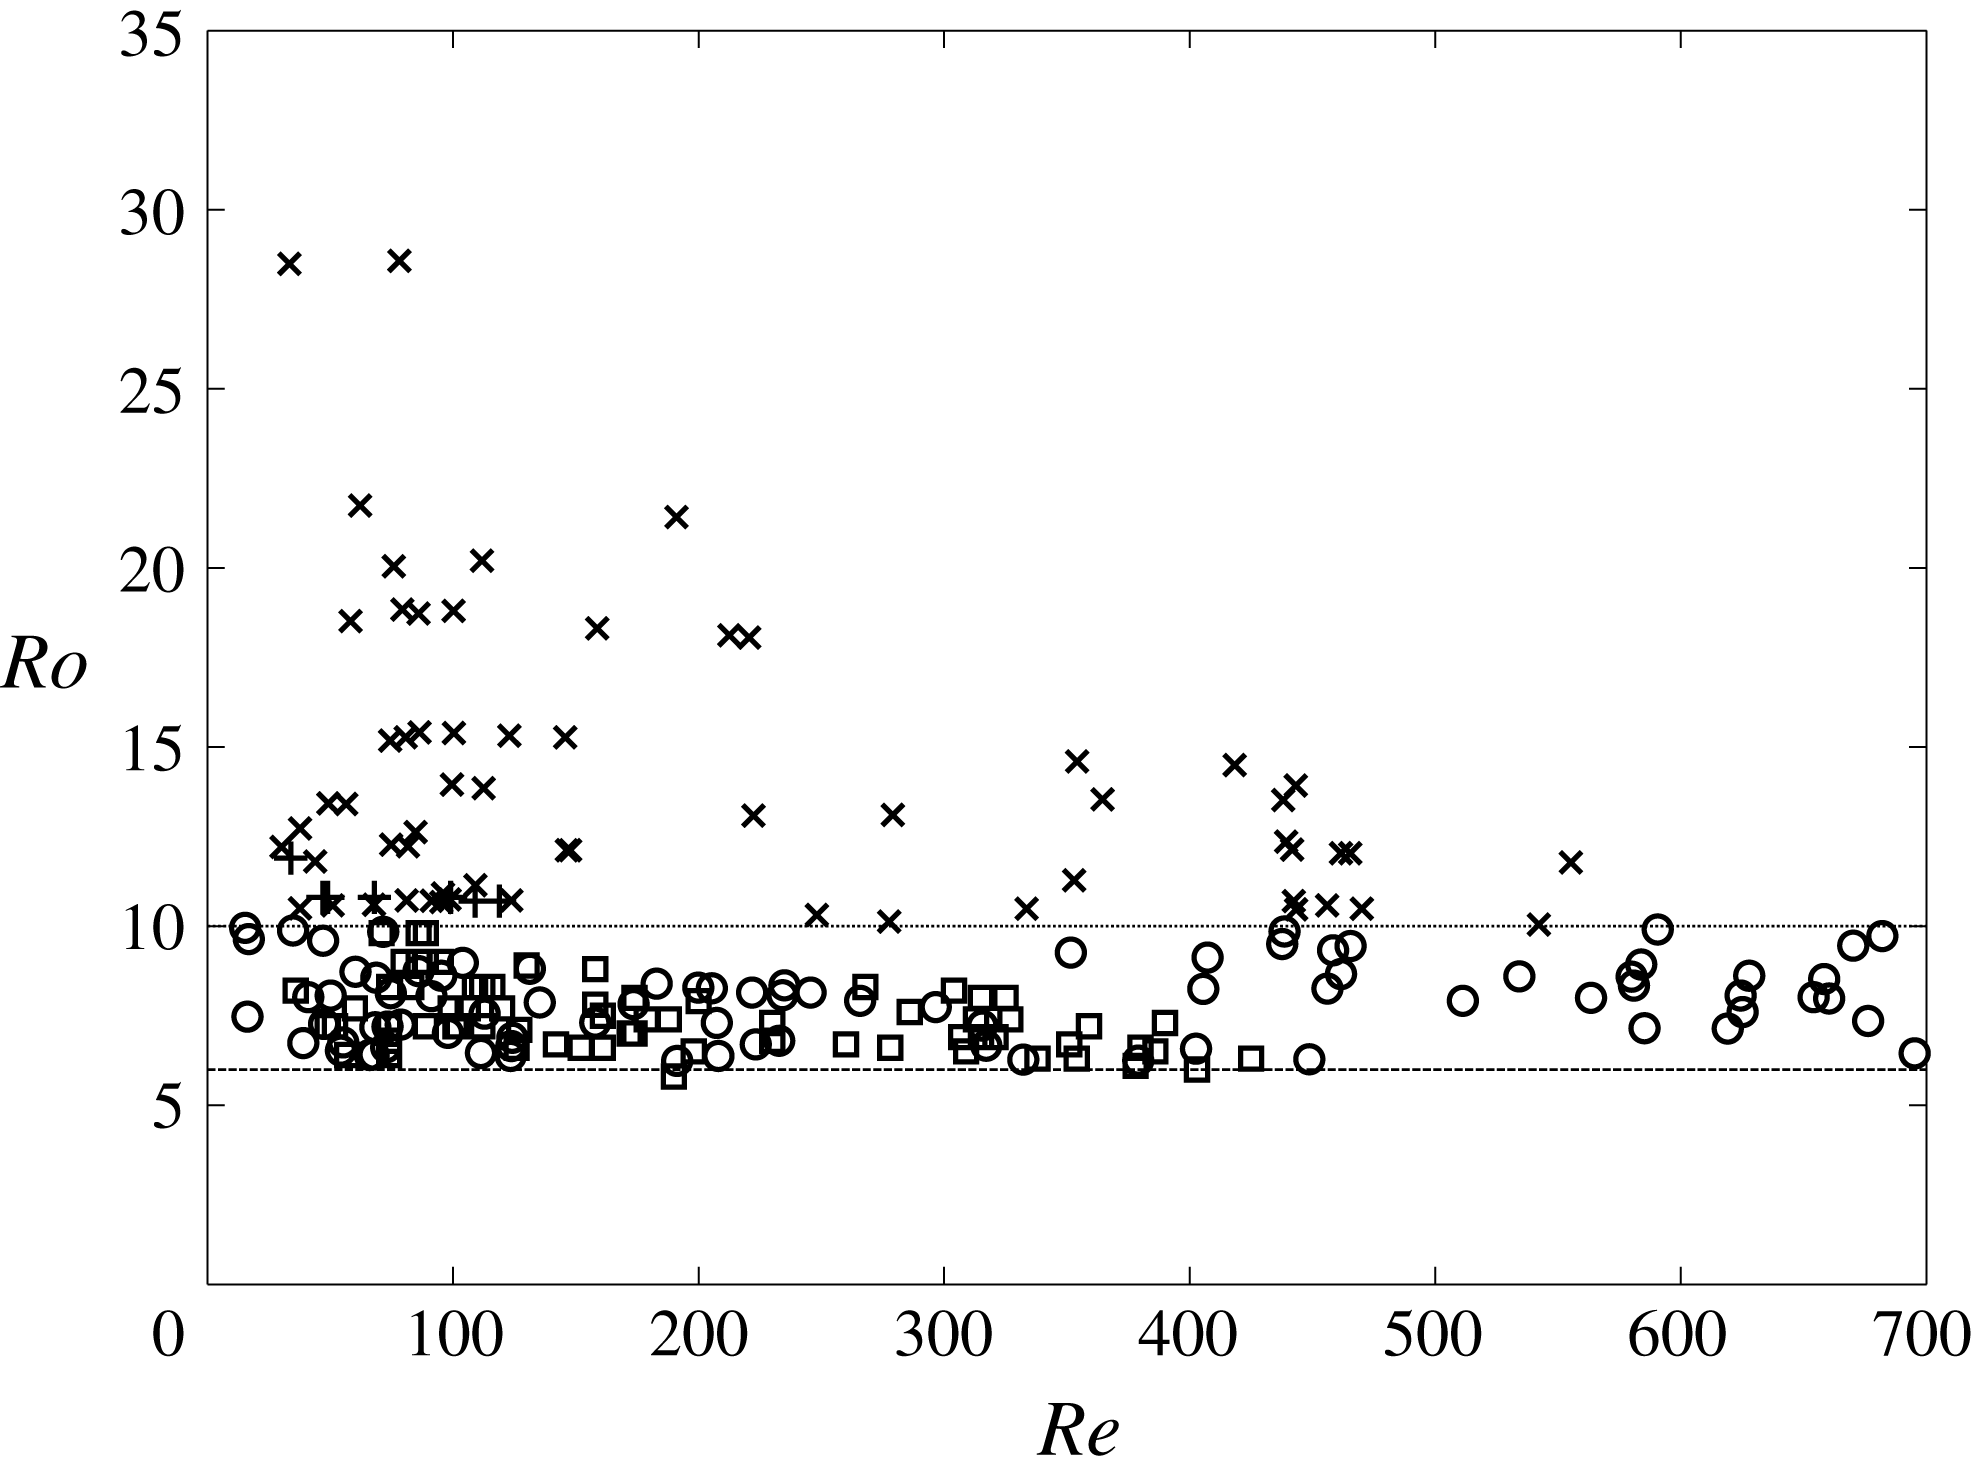
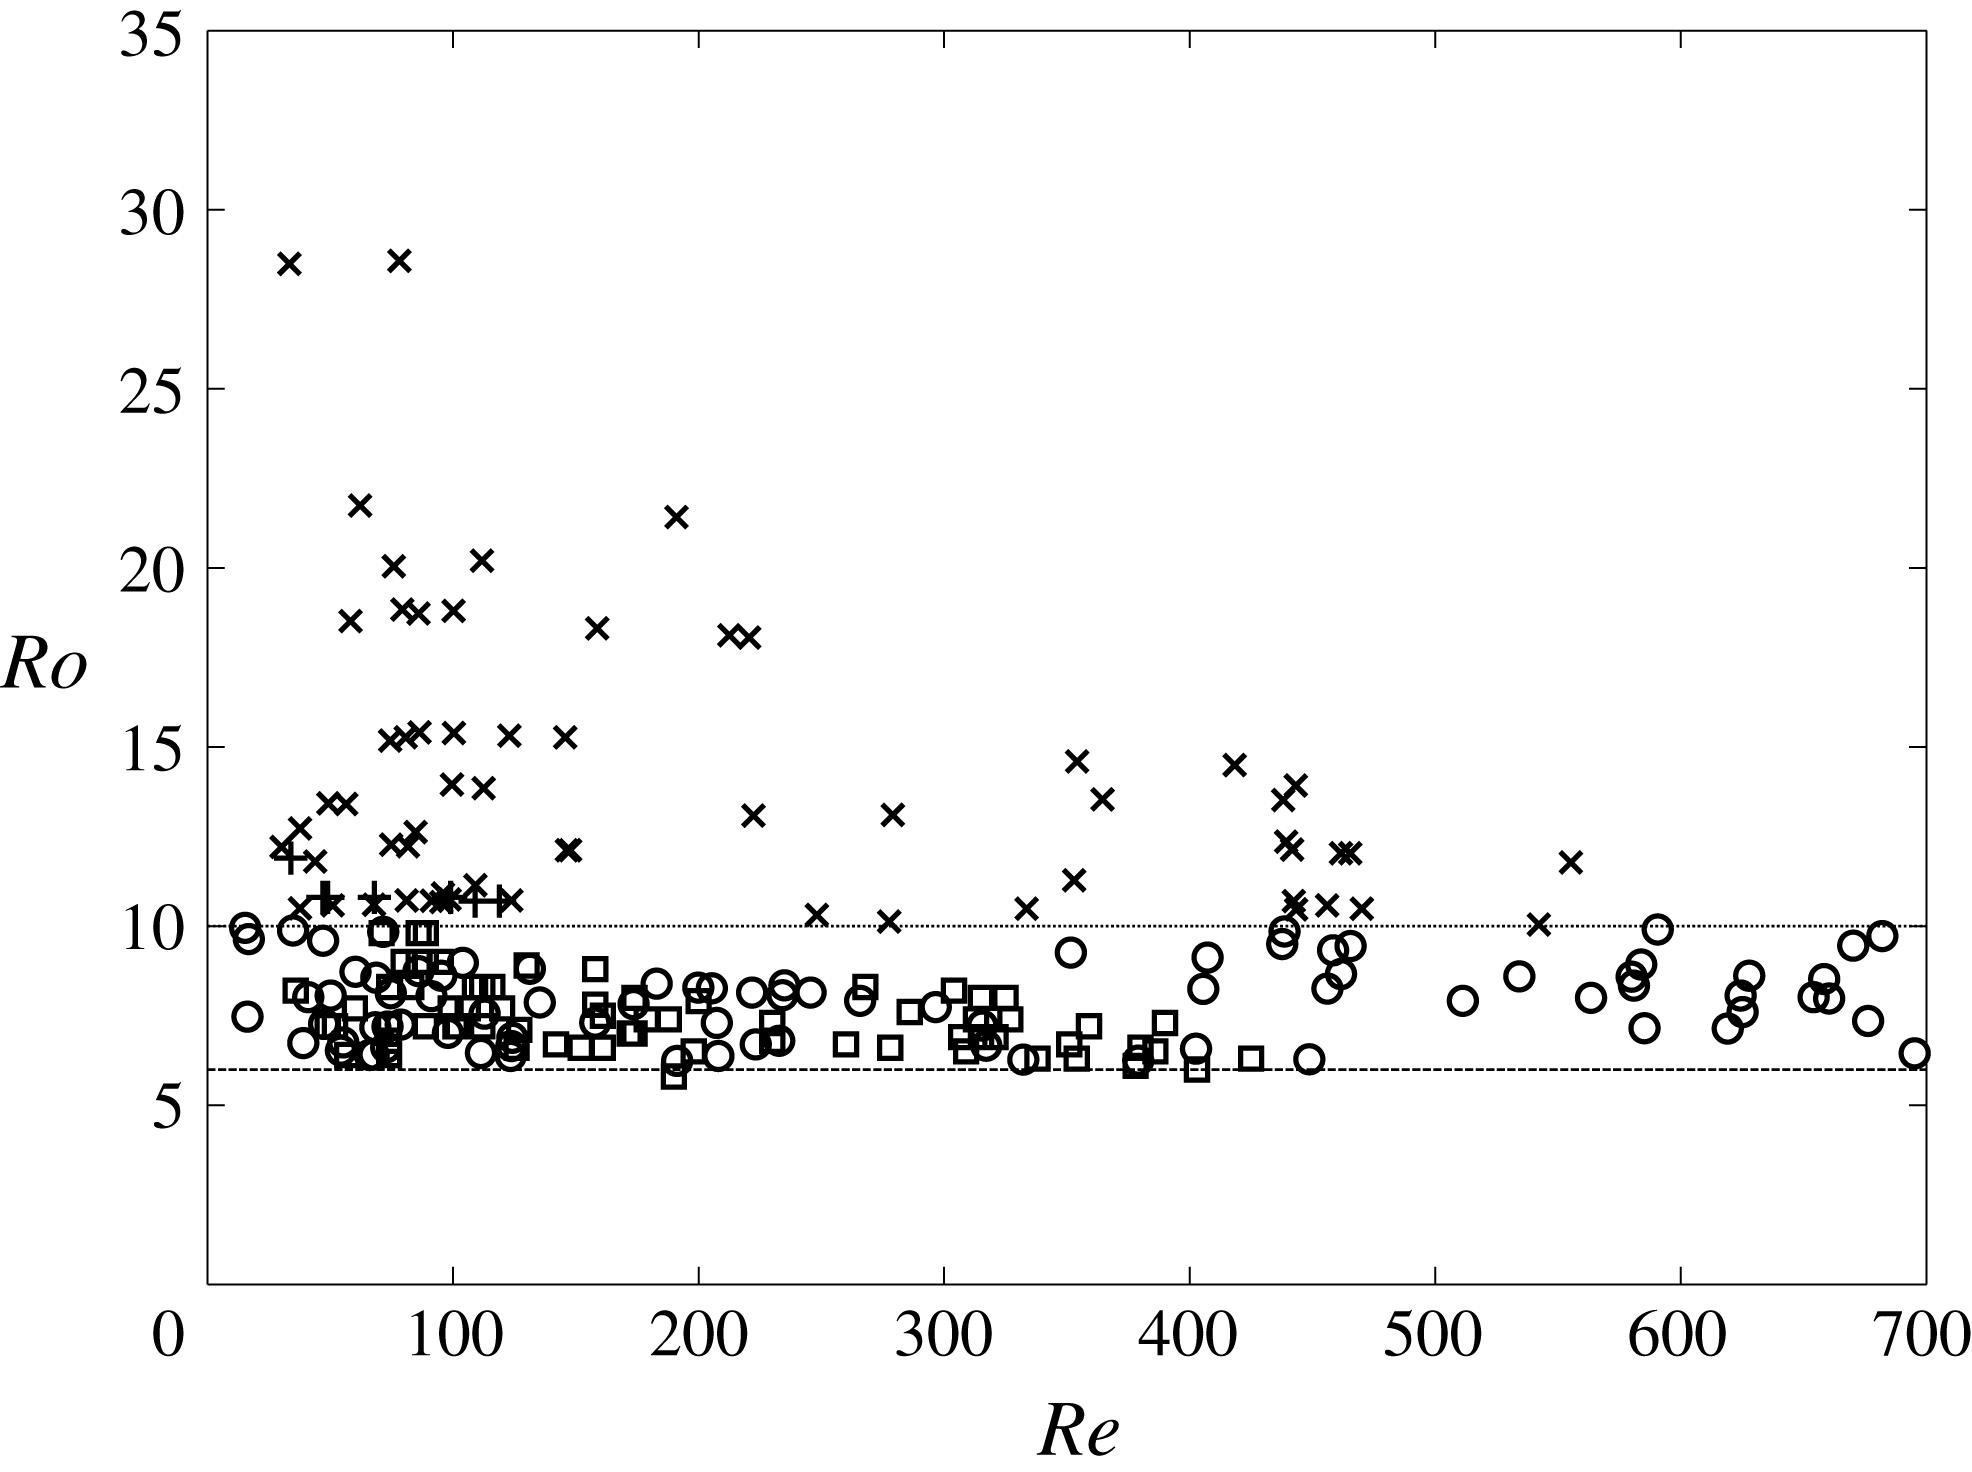
. The ranges of non-dimensional numbers investigated in the new set of experiments are reported in table 1, completed by a phase diagram (
 $Ro,Re$
) for water measurements (see figure 2). The rotation rate for the tank is varied from
 $6~\text{rad}~\text{s}^{-1}$
to
 $16~\text{rad}~\text{s}^{-1}$
, while the equivalent bubble diameter ranges from 1.75 mm to 3.3 mm. The water used for the new set of experiments DW-2 is demineralized water similar to the one previously used in DW-1. It is characterized by a resistivity of
 $0.3~\text{M}\unicode[STIX]{x03A9}~\text{cm}$
. This resistivity is between that of the ultra-purified water of Duineveld (Reference Duineveld1995) (
 $18~\text{M}\unicode[STIX]{x03A9}~\text{cm}$
) and that of tap water (
 $3~\text{k}\unicode[STIX]{x03A9}~\text{cm}$
). Because of practical constraints (bubble injection, temperature measurements), it was extremely difficult to keep this water clean, which means it contains contaminants. These contaminants are mainly solid impurities and/or traces of tensio-actives.
Phase diagram (
 $Re,Ro$
) in experiments DW-1 and DW-2; spinning measurements: ▫:
 $6\leqslant Ro<10$
,
 $+$
:
 $Ro\geqslant 10$
; force measurements: ○:
 $6\leqslant Ro<10$
,
 $\times$
:
 $Ro\geqslant 10$
.
3 Comparison between clean and contaminated bubbles: surface behaviour
3.1 Flow near the surface
To see how contaminants modify the flow near the bubble surface, the visualizations in demineralized water reported in Rastello et al. (Reference Rastello, Marié, Grosjean and Lance2009) have been completed by visualizations in silicon oils. The flow around the bubble has been visualized using the same technique, that is by seeding the fluid with very small fluorescent microspheres (
 $\text{size}=3~\unicode[STIX]{x03BC}\text{m}$
). These microspheres, manufactured by Duke Scientific Corporation, are made of polystyrene which has a density of
 $1.05~\text{g}~\text{cm}^{-3}$
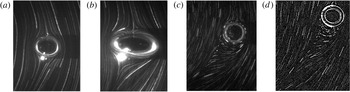
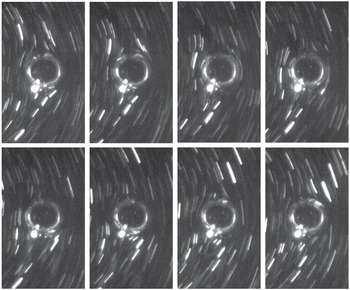
. They are internally dyed, which prevents dye leaching into aqueous media. Particles are illuminated with a laser sheet and imaged with a camera. The best results in terms of uniform seeding have been obtained in SO-2. Two typical examples of bubbles and their wakes in this oil are given in figure 3(a,b). The first is for
 $Re\approx 15$
,
 $\unicode[STIX]{x1D712}\approx 1.2$
, the second for
 $Re\approx 30$
,
 $\unicode[STIX]{x1D712}\approx 2$
. Even in case (b) where
 $\unicode[STIX]{x1D712}$
is high, the streamlines of the rotation flow deform rather symmetrically around the bubble and the wake remains attached. This is what is expected for clean bubbles if we refer to the
 $Re{-}\unicode[STIX]{x1D712}$
phase diagram of Blanco & Magnaudet (Reference Blanco and Magnaudet1995) established for uniform flows. No particle in rotation around the surface is detected in the frames taken at successive instants (figure 4). In contrast, the wake behind the bubble in demineralized water is separated (figure 3
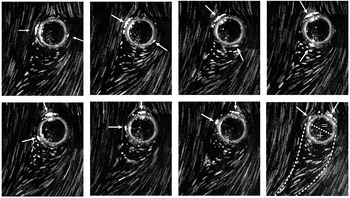
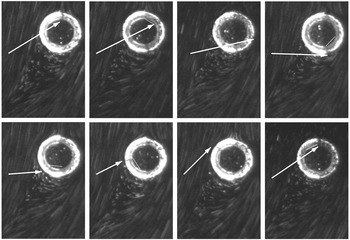
c,d), which attests to the presence of contaminants on the surface (Clift, Grace & Weber Reference Clift, Grace and Weber1978). The fluorescent particles stuck to the surface are spinning (figures 5–6). It is reasonable to assume that they rotate with the same velocity as that of the fluid at the surface, as imposed by the boundary conditions on the contaminated surface of the bubble. We can assimilate their motion to the rotation of the surface and speak of a spinning surface.
Clean surface: (SO-2) present investigation, (a)
 $Re\approx 15$
,
 $\unicode[STIX]{x1D712}\approx 1.2$
; (b)
 $Re\approx 30$
,
 $\unicode[STIX]{x1D712}\approx 2$
. Contaminated surface: (DW-1 and DW-2), (c) surface partly covered by contaminants,
 $Re\approx 120$
; (d) surface saturated by contaminants,
 $Re\approx 118$
.

Clean surface (SO-2) – present investigation: no spinning is detected,
 $Re\approx 10$
. Time between two successive images is 10 ms.

‘Partly contaminated’ surface (DW-1 and DW-2): time interval between two images is 20 ms. The particles stuck on the surface are spinning,
 $Re\approx 50$
. The arrows are included to help follow some of these particles. On the last image, the visually estimated edges of the wake are shown by the dashed lines. Sign
 $+$
designates the rear region of the bubble where particles at the surface have a speed greater than
 $\unicode[STIX]{x1D714}$
, while sign
 $=$
corresponds to the front region where the particles have a constant speed
 $\unicode[STIX]{x1D714}$
.

‘Fully contaminated’ surface (DW-2): the time interval between two images is 20 ms. The particles stuck on the surface are spinning with a constant speed as they would if they were stuck on a solid sphere,
 $\unicode[STIX]{x1D6FA}_{b}=1.4\unicode[STIX]{x1D714}$
,
 $Re\approx 130$
. The arrows are included to help follow a hole in the ‘crust’ of fluorescent particles around the bubble. The same white line running inside the bubble links the position on the previous image to the current one.

3.2 Characterization of the spinning motion
The last set of experiments in water DW-2 show that, in fact, two spinning regimes can be observed. This will depend on the concentration of fluorescent particles introduced in water.
3.2.1 ‘Partly contaminated’ or ‘naturally contaminated’ surface
When only a few fluorescent particles are added, these simply behave as tracers which tag both the fluid motion and surface spinning (figure 3
c). They do not change notably the surface contamination prevailing before their introduction, and hence also the forces acting on the bubbles. The seeding concentrations corresponding to this situation are typically 15–
 $30\times 10^{-6}~\unicode[STIX]{x03BC}\text{g}~\text{l}^{-1}$
. In that case, referred to as a ‘partly contaminated’ or ‘naturally contaminated’ surface, surface spinning is non-uniform, as already outlined in Rastello et al. (Reference Rastello, Marié, Grosjean and Lance2009). This non-uniformity of the spinning can be noticed by looking at the evolution of the angular space between the arrows on the sequence of images in figure 5. In the rear region, where the wake of the bubble is separated, the particles stuck on the surface first accelerate and then decelerate, while in the front region near the incoming flow, they are spinning more slowly and regularly. We deduce from this that these particles are not in solid-body rotation as the surface of a solid sphere would be (Bluemink et al.
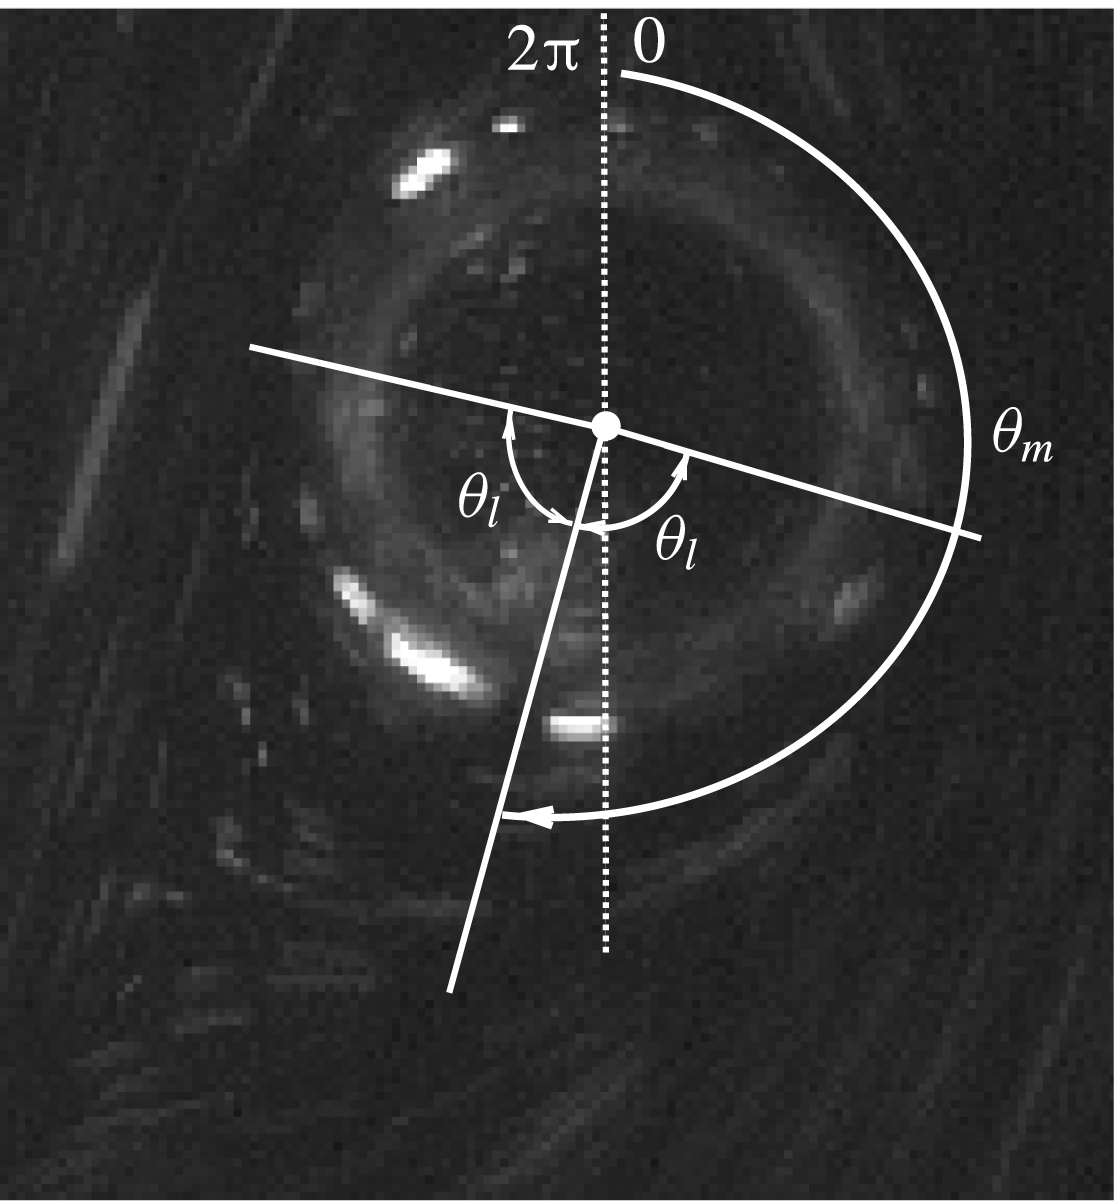
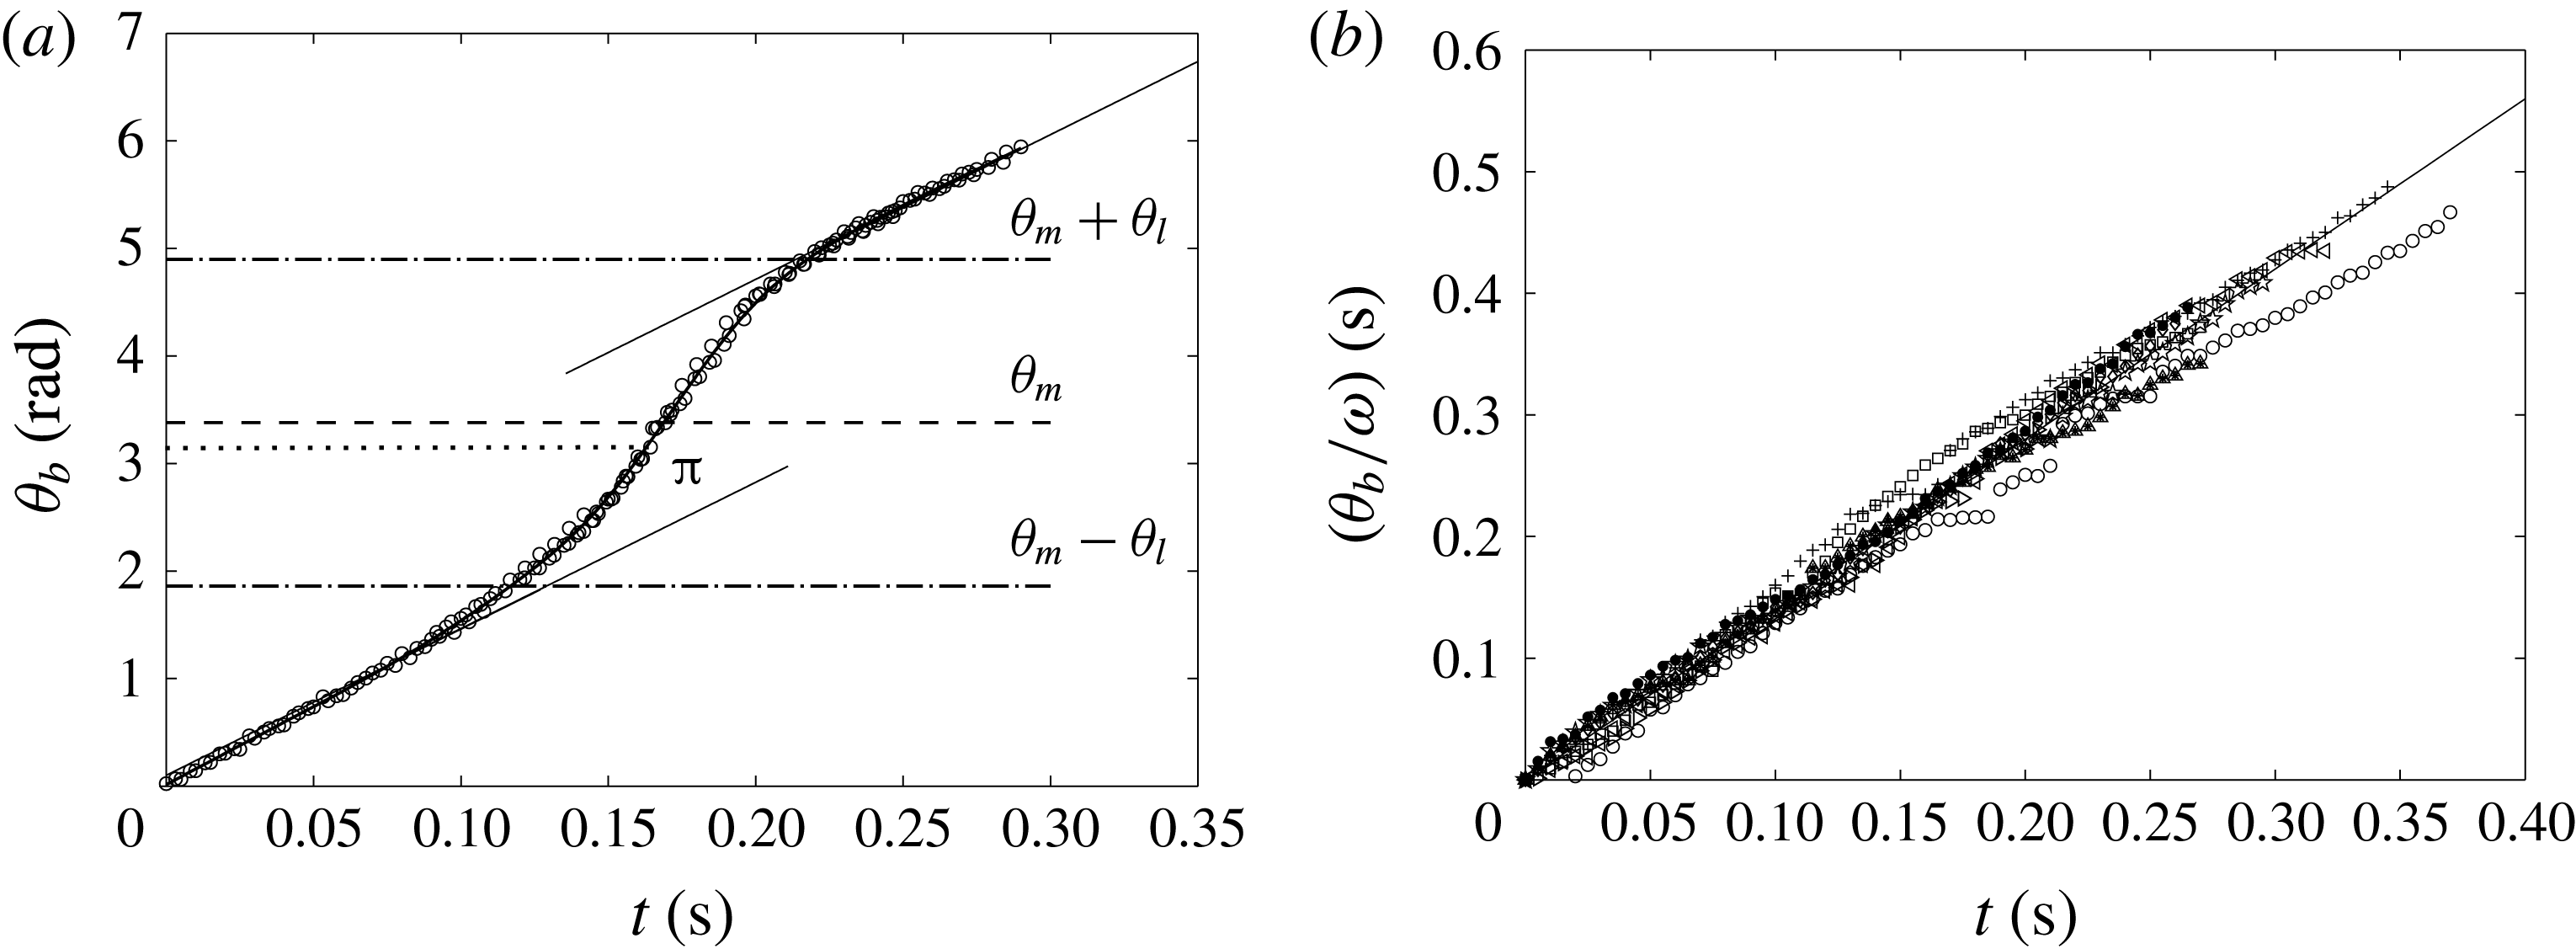
Reference Bluemink, Lohse, Prosperetti and Van Wijngaarden2008). Their behaviour looks like something in between the shear-free and no-slip condition. It suggests, in agreement with Bel-Fdhila & Duineveld (Reference Bel-Fdhila and Duineveld1996), McLaughlin (Reference McLaughlin1996), Cuenot, Magnaudet & Spennato (Reference Cuenot, Magnaudet and Spennato1997), that contaminants accumulate on a spherical cap facing the separated wake, while they are absent from the forehead. The non-uniform surface rotation has been quantified here by tracking individual particles at the surface and by measuring their angular time positions and velocities. The spinning angles are referenced as shown in the sketch in figure 7. Approximately 40 sequences of partly contaminated spinning bubbles (DW-1 and DW-2) have been processed using in-house software for image processing and tracking. All exhibit the same trend illustrated in figure 8(a). On the front part of the bubble (
 $0\geqslant \unicode[STIX]{x1D703}\geqslant \unicode[STIX]{x1D703}_{m}-\unicode[STIX]{x1D703}_{l}$
or
 $\unicode[STIX]{x1D703}_{m}+\unicode[STIX]{x1D703}_{l}\leqslant \unicode[STIX]{x1D703}\leqslant 2\unicode[STIX]{x03C0}$
), the angular velocity
 $\unicode[STIX]{x1D6FA}_{b(\mathit{front})}$
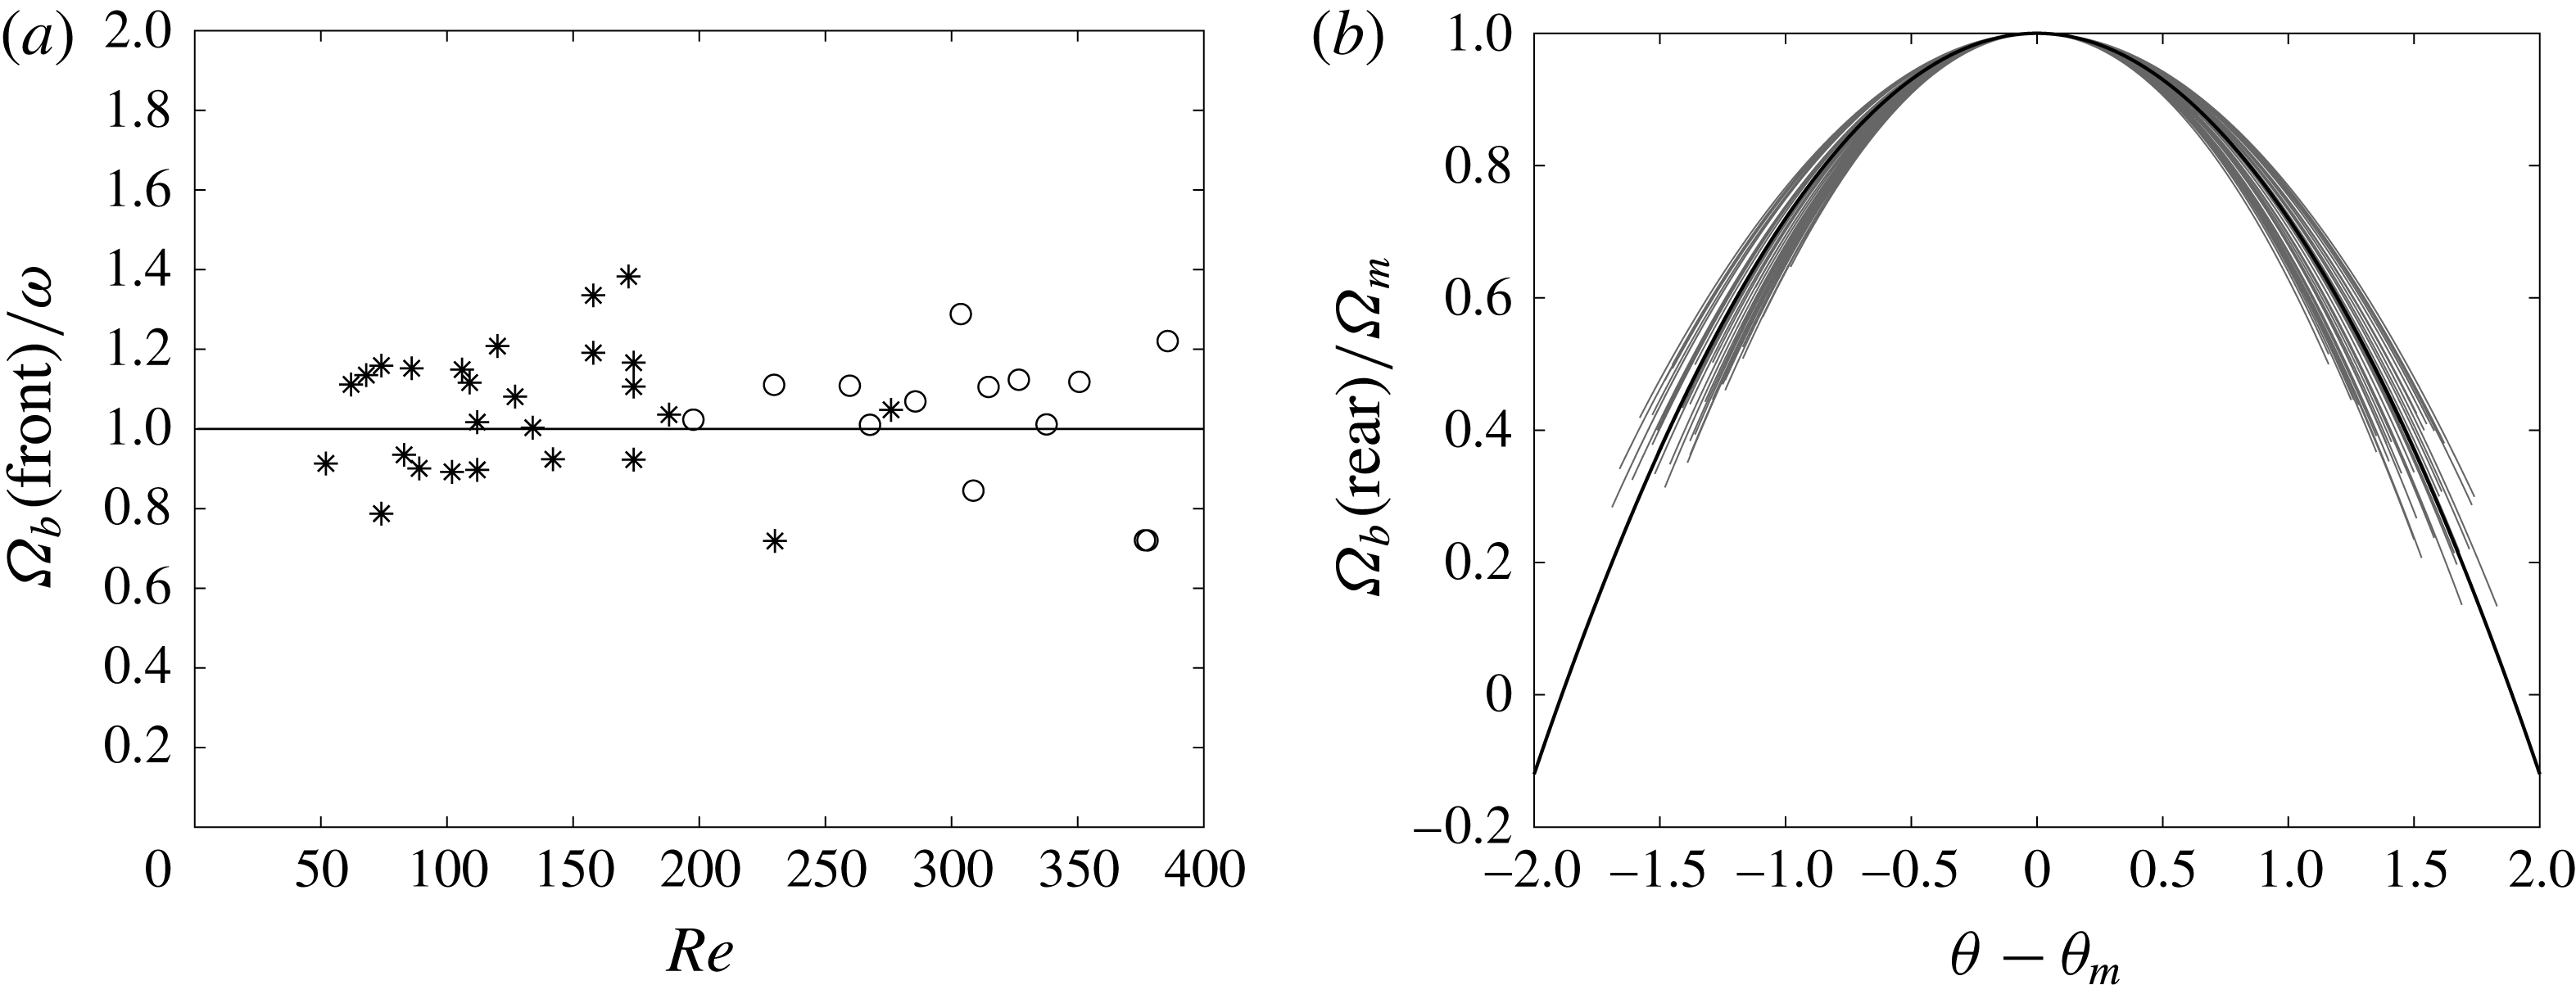
is constant. Its value for the various bubbles is plotted as a function of
 $Re$
in figure 9(a). One can see that no particular
 $Re$
dependency is visible. The angular velocities in this region are close to
 $\unicode[STIX]{x1D714}$
within
 $\pm 15\,\%$
standard deviation, so
 $\unicode[STIX]{x1D6FA}_{b(\mathit{front})}$
can be reasonably approximated to
 $\unicode[STIX]{x1D714}$
. On the rear part (
 $-\unicode[STIX]{x1D703}_{l}\leqslant \unicode[STIX]{x1D703}-\unicode[STIX]{x1D703}_{m}\leqslant \unicode[STIX]{x1D703}_{l}$
),
 $\unicode[STIX]{x1D6FA}_{b}$
increases, passes through a maximum
 $\unicode[STIX]{x1D6FA}_{m}$
for
 $\unicode[STIX]{x1D703}_{m}$
and decreases back to
 $\unicode[STIX]{x1D714}$
(see figure 9
b). The data are all well modelled by an equation of the form:
 $$\begin{eqnarray}\displaystyle & \displaystyle \unicode[STIX]{x1D6FA}_{b}=\unicode[STIX]{x1D6FA}_{b(\mathit{rear})}=\unicode[STIX]{x1D6FA}_{m}\times \left[1-\left(\frac{\unicode[STIX]{x1D703}-\unicode[STIX]{x1D703}_{m}}{1.89}\right)^{2}\right]\quad \text{for}~\unicode[STIX]{x1D703}-\unicode[STIX]{x1D703}_{m}\in [-\unicode[STIX]{x1D703}_{l}\quad \unicode[STIX]{x1D703}_{l}], & \displaystyle\end{eqnarray}$$
 $$\begin{eqnarray}\displaystyle & \unicode[STIX]{x1D6FA}_{b}=\unicode[STIX]{x1D6FA}_{b(\mathit{front})}=\unicode[STIX]{x1D714}\quad \text{for}~0\geqslant \unicode[STIX]{x1D703}\geqslant \unicode[STIX]{x1D703}_{m}-\unicode[STIX]{x1D703}_{l}~\text{or}~\unicode[STIX]{x1D703}_{m}+\unicode[STIX]{x1D703}_{l}\leqslant \unicode[STIX]{x1D703}\leqslant 2\unicode[STIX]{x03C0}, & \displaystyle\end{eqnarray}$$
where
 $\unicode[STIX]{x1D703}_{l}$
is the opening angle such that
 $\unicode[STIX]{x1D6FA}_{b}(\unicode[STIX]{x1D703}_{m}\pm \unicode[STIX]{x1D703}_{l})=\unicode[STIX]{x1D714}$
.
 $\unicode[STIX]{x1D703}_{l}$
is of the same order of magnitude as the separation angle
 $\unicode[STIX]{x1D703}_{s}$
(angle at which the wake detaches from the bubble) that can be visually estimated from the images. This is illustrated in figure 7, where a bubble is shown with the angles
 $\unicode[STIX]{x1D703}_{m}$
and
 $\unicode[STIX]{x1D703}_{l}$
obtained in that case. One can check on this example that
 $\unicode[STIX]{x1D703}_{m}-\unicode[STIX]{x1D703}_{l}$
and
 $\unicode[STIX]{x1D703}_{m}+\unicode[STIX]{x1D703}_{l}$
indeed coincide well with
 $\unicode[STIX]{x1D703}_{s}$
. Unfortunately, we were not able to have this qualitative result turned into a more quantitative one. The reason is that in the range of
 $Re$
investigated (
 $Re\geqslant 50$
),
 $\unicode[STIX]{x1D703}_{s}$
is always greater than
 $75^{\circ }$
, making its accurate estimation rather difficult. These separation angles are much higher than those observed at the same
 $Re$
on solid spheres in uniform flow (Johnson & Patel Reference Johnson and Patel1999). The abrupt peak of vorticity at the edge of the contaminated cap (McLaughlin Reference McLaughlin1996; Cuenot et al.
Reference Cuenot, Magnaudet and Spennato1997), joined to the spinning motion (Giacobello, Ooi & Balanchandar Reference Giacobello, Ooi and Balanchandar2009) may explain these higher angles. The maximum spinning rate takes place for
 $\unicode[STIX]{x1D703}_{m}$
on average of the order of
 $202^{\circ }$
with a standard deviation of
 $13^{\circ }$
. No clear dependence on
 $Re$
or
 $Ro$
is exhibited.
Definition of
 $\unicode[STIX]{x1D703}$
,
 $\unicode[STIX]{x1D703}_{l}$
and
 $\unicode[STIX]{x1D703}_{m}$
.
 $\unicode[STIX]{x1D703}_{m}$
is the angle at which the angular velocity of the spinning surface is maximum in the case of partly contaminated bubbles.
 $\unicode[STIX]{x1D703}_{l}$
is defined such that
 $\unicode[STIX]{x1D6FA}_{b}(\unicode[STIX]{x1D703}_{m}\pm \unicode[STIX]{x1D703}_{l})=\unicode[STIX]{x1D714}$
. Dotted line: vertical axis.

(a) Typical time evolution of the angular position of particles stuck on the ‘partly contaminated’ bubble surface (
 $\unicode[STIX]{x1D714}=13.6~\text{rad}~\text{s}^{-1}$
,
 $Re\approx 112$
,
 $Ro\approx 9.3$
);
 $\unicode[STIX]{x1D703}_{m}$
is the angle where the angular velocity is maximum,
 $\unicode[STIX]{x1D703}_{m}\pm \unicode[STIX]{x1D703}_{l}$
the limit angles where
 $\unicode[STIX]{x1D6FA}_{b}$
goes from
 $\unicode[STIX]{x1D714}$
to
 $\neq \unicode[STIX]{x1D714}$
or vice versa; solid lines have a slope equal to
 $\unicode[STIX]{x1D714}$
. (b) Time evolution of the angular position (
 $\unicode[STIX]{x1D703}_{b}$
) divided by the angular velocity of the tank (
 $\unicode[STIX]{x1D714}$
) for particles stuck on the bubble for a ‘fully contaminated’ surface for ten different experiments (
 $100\leqslant Re\leqslant 250$
,
 $10~\text{rad}~\text{s}^{-1}\leqslant \unicode[STIX]{x1D714}\leqslant 17~\text{rad}~\text{s}^{-1}$
,
 $6\leqslant Ro\leqslant 11$
). Solid line has a slope 1.4.

(a) Spinning rate of the surface in the front region (outside the wake) divided by the rotation rate of the tank versus
 $Re$
number. *: Spherical bubbles (
 $\unicode[STIX]{x1D712}\leqslant 1.1$
), ○: deformed bubbles (
 $\unicode[STIX]{x1D712}>1.1$
). Average value: 1 is represented by a solid line. (b) Spinning rate of the surface in the rear region (inside the wake) divided by the maximum spinning rate of the surface
 $\unicode[STIX]{x1D6FA}_{m}$
versus
 $\unicode[STIX]{x1D703}-\unicode[STIX]{x1D703}_{m}$
. One curve stands for one bubble. The longest one is the mean curve given by (3.1).

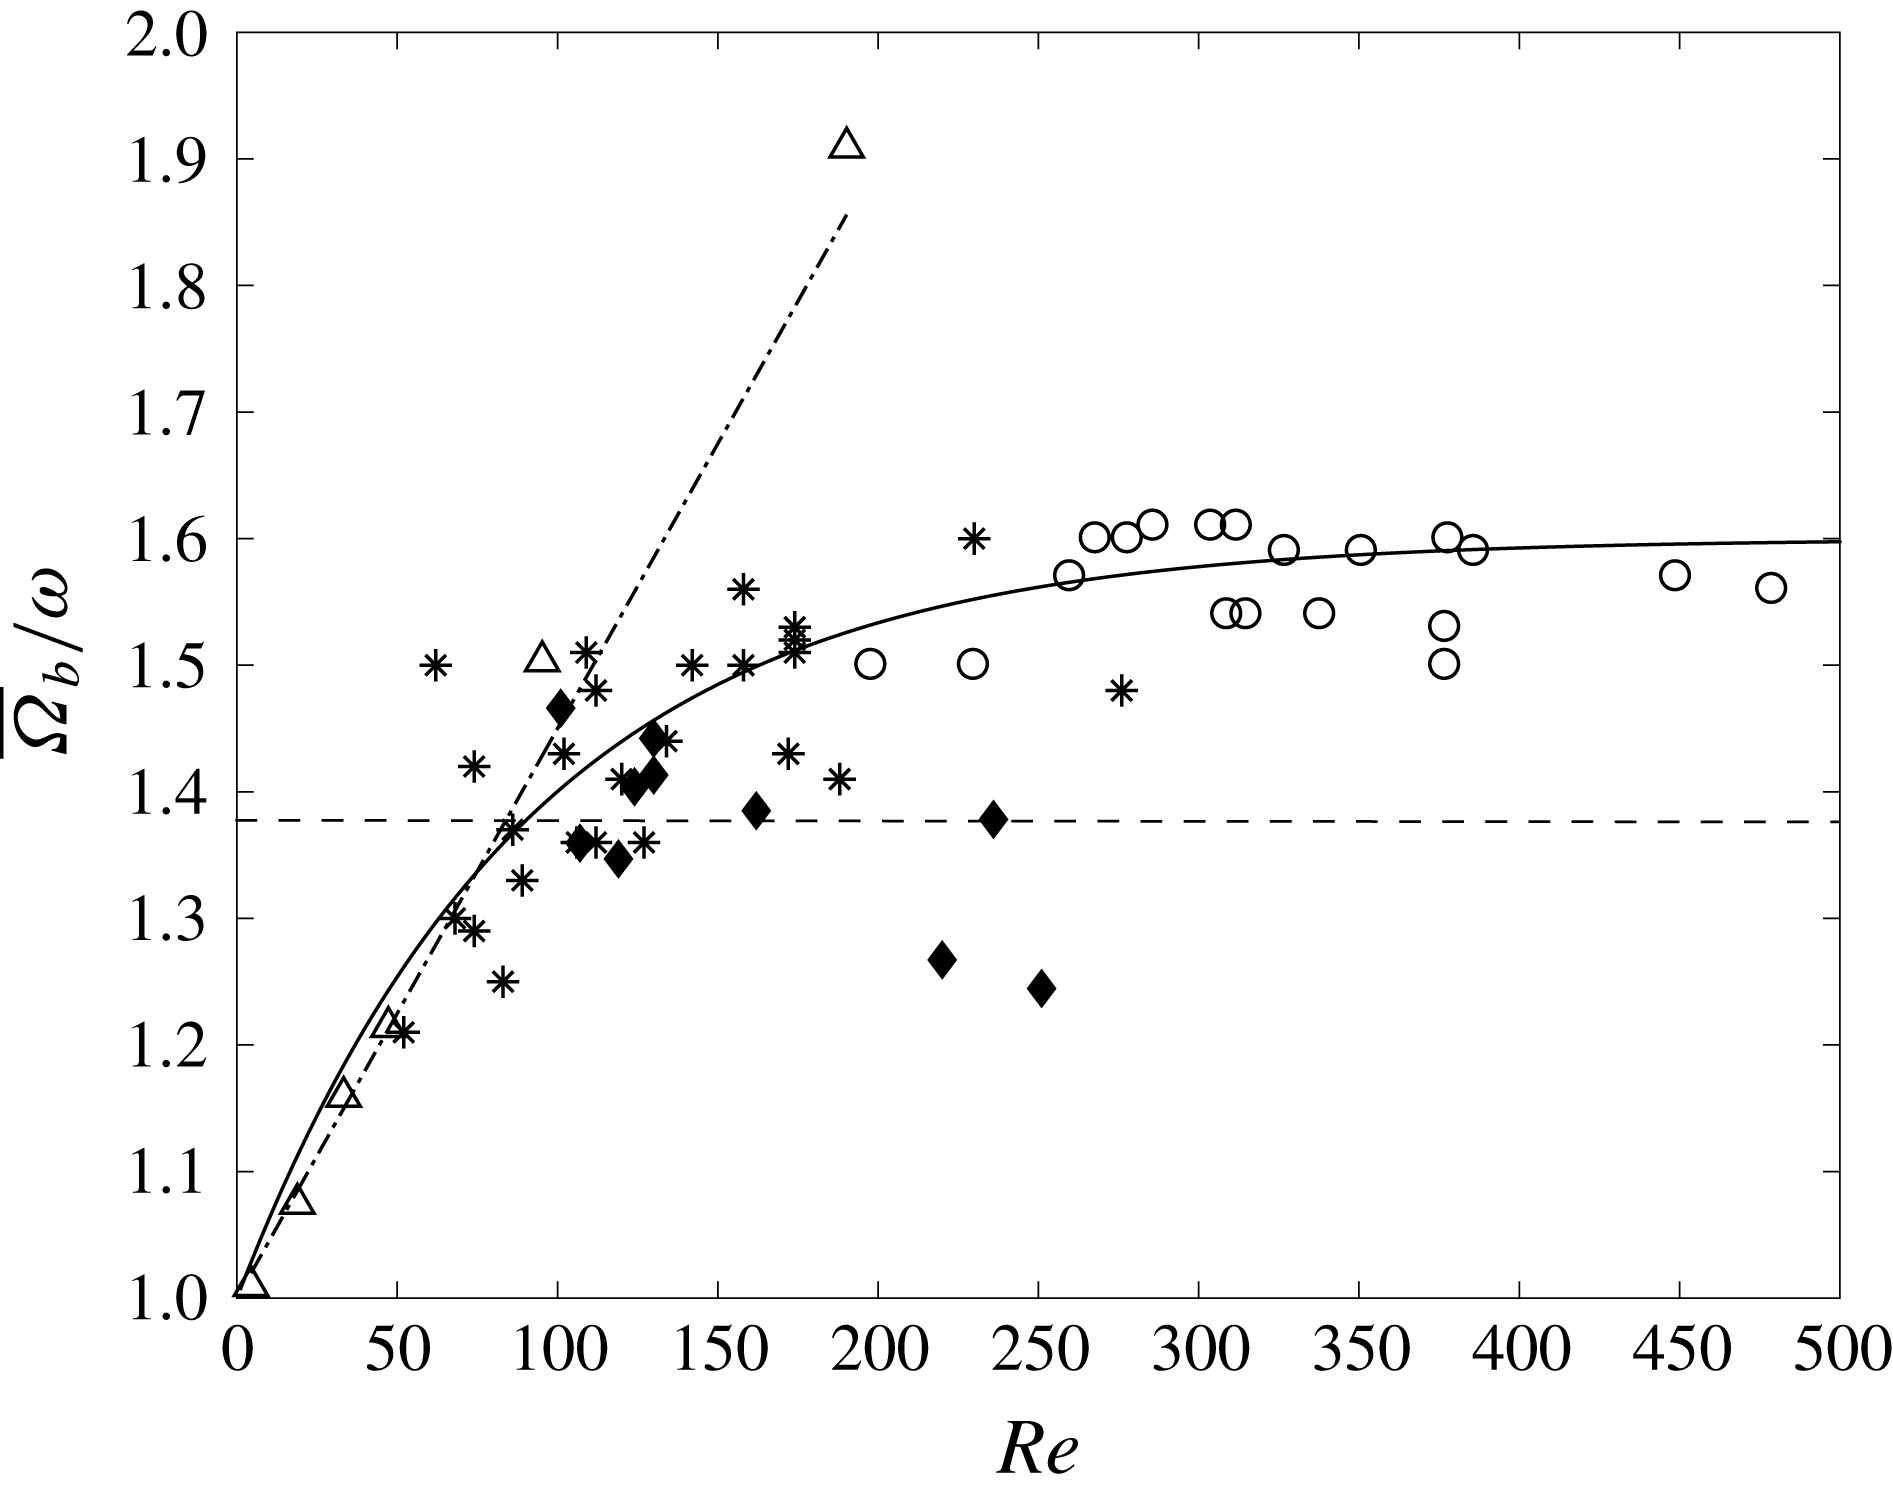
Mean spinning rate divided by tank velocity versus
 $Re$
number. ‘Partly contaminated’ surface: *, spherical bubbles (
 $\unicode[STIX]{x1D712}\leqslant 1.1$
,
 $7\leqslant Ro\leqslant 13$
); ○, deformed bubbles (
 $\unicode[STIX]{x1D712}>1.1$
,
 $6\leqslant Ro\leqslant 8$
) (DW-1 and DW-2). ‘Fully contaminated’ surface: ♦, dye-saturated bubbles (DW-2). Dashed line: mean value of the spinning rate for the dye-saturated bubbles. Spinning sphere: ▵, numerical results (Bluemink et al. (Reference Bluemink, Lohse, Prosperetti and Van Wijngaarden2008),
 $Ro=10$
) and dotted-dashed line, their fit:
 $1+0.0045\,Re$
(Bluemink et al.
Reference Bluemink, Lohse, Prosperetti and Van Wijngaarden2010).

From (3.1) and the definition of
 $\unicode[STIX]{x1D703}_{l}$
it follows that:
 $$\begin{eqnarray}\unicode[STIX]{x1D714}=\unicode[STIX]{x1D6FA}_{m}\times \left[1-\left(\frac{\unicode[STIX]{x1D703}_{l}}{1.89}\right)^{2}\right]\end{eqnarray}$$
meaning that the maximum spin rate depends both on
 $\unicode[STIX]{x1D714}$
and
 $\unicode[STIX]{x1D703}_{l}$
. The evidence for this is given in figure 9(b) where the spin rates measured for the various bubbles are plotted in non-dimensional form. All of the data collapse onto a single curve, in agreement with (3.1). The mean spin rate
 $\overline{\unicode[STIX]{x1D6FA}}_{b}$
over a revolution is therefore higher than the rotation rate
 $\unicode[STIX]{x1D714}$
and according to (3.1) and (3.3) the ratio can be expressed by:
 $$\begin{eqnarray}\frac{\overline{\unicode[STIX]{x1D6FA}}_{b}}{\unicode[STIX]{x1D714}}=1+\frac{2{\unicode[STIX]{x1D703}_{l}}^{3}}{3\unicode[STIX]{x03C0}(1.89^{2}-\unicode[STIX]{x1D703}_{l}^{2})}.\end{eqnarray}$$
The ratio measured for each bubble in the two series of experiments DW-1 and DW-2 are plotted versus
 $Re$
in figure 10. Below 100, it increases significantly with
 $Re$
, in a way rather comparable to the one computed by Bluemink et al. (Reference Bluemink, Lohse, Prosperetti and Van Wijngaarden2008) for a torque-free solid sphere in solid-body rotation. The numerical results are for constant
 $Ro$
equal to 10 (
 $S=0.1$
), a value close to our experimental
 $Ro$
in that range of
 $Re$
: (
 $7\leqslant Ro\leqslant 13$
,
 $\overline{Ro}=8.5$
). The similarity of behaviour was used to reformulate the lift coefficient for these contaminated bubbles (appendix B). Above 100 the increase slows down, and the data DW-2 clearly show that the ratio asymptotically tends to a constant value of approximately 1.6 for high Reynolds numbers.
 $Ro$
is then slightly lower: (
 $6\leqslant Ro\leqslant 8$
,
 $\overline{Ro}=7$
). Low Reynolds numbers exhibit a spinning rate tending towards
 $\unicode[STIX]{x1D714}$
, which is the limit expected for a solid sphere in Stokes flow. The behaviour of the mean spinning rate with
 $Re$
is well approximated by:
 $$\begin{eqnarray}\frac{\overline{\unicode[STIX]{x1D6FA}}_{b}}{\unicode[STIX]{x1D714}}=1.6-0.6\exp (-0.011\,Re).\end{eqnarray}$$
The increase in
 $\overline{\unicode[STIX]{x1D6FA}}_{b}/\unicode[STIX]{x1D714}$
is related to the enlargement of the separated wake with
 $Re$
and the spinning acceleration linked to it. As a consequence, the maximum spinning rate increases as
 $Re$
increases (see figure 11
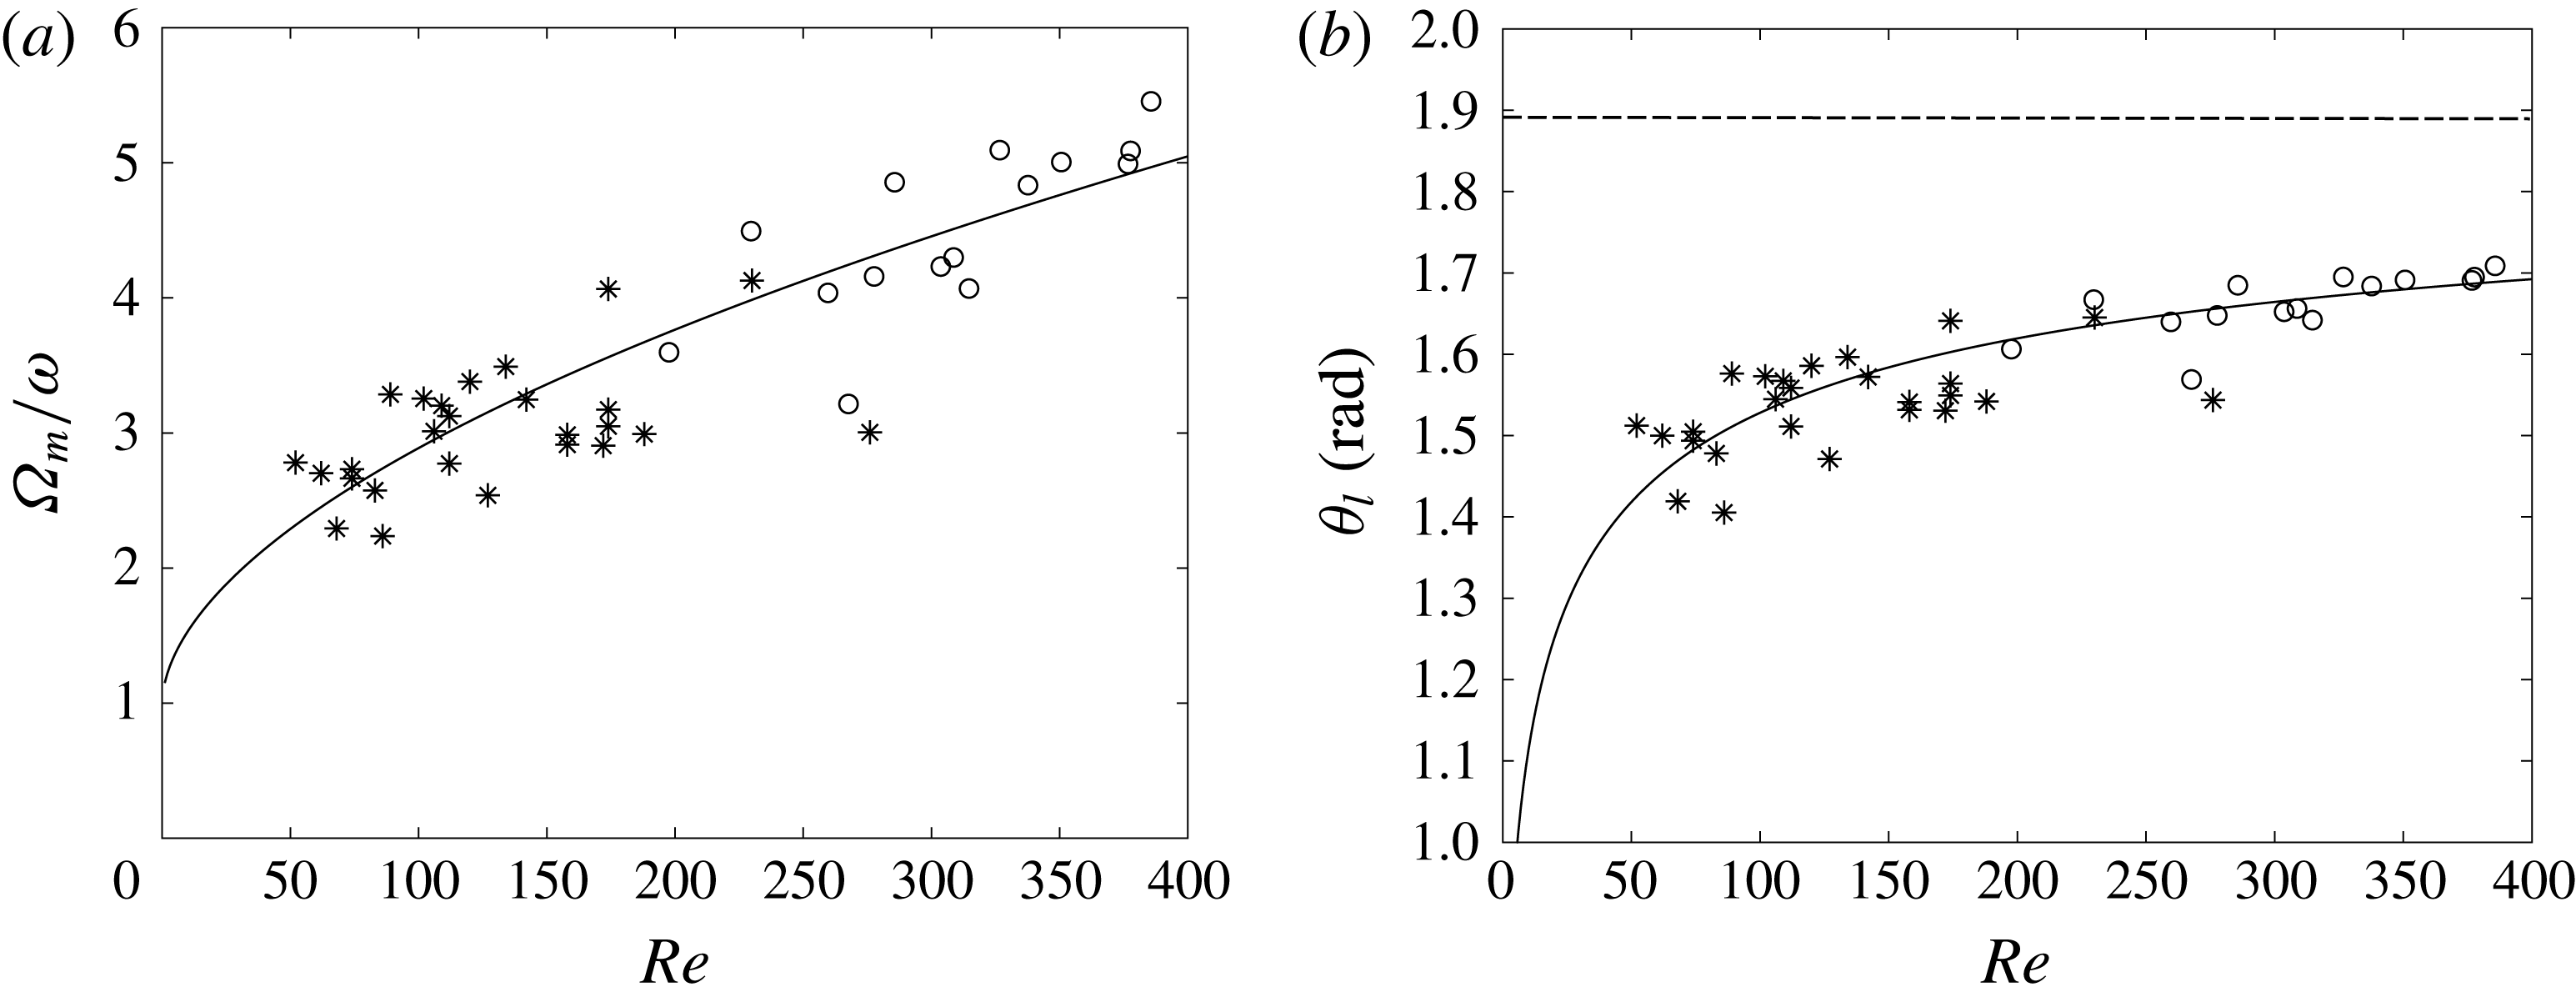
a). A good fit to the data is achieved with:
 $$\begin{eqnarray}\frac{\unicode[STIX]{x1D6FA}_{m}}{\unicode[STIX]{x1D714}}=1+0.15\,Re^{0.55}.\end{eqnarray}$$
(a) Maximum spinning rate divided by the rotation rate of the tank versus
 $Re$
number. *: Spherical bubbles (
 $\unicode[STIX]{x1D712}\leqslant 1.1$
,
 $7\leqslant Ro\leqslant 13$
), ○: deformed bubbles (
 $\unicode[STIX]{x1D712}>1.1$
,
 $6\leqslant Ro\leqslant 8$
). Solid line is given by (3.6). (b) Opening angle
 $\unicode[STIX]{x1D703}_{l}$
versus
 $Re$
number. *: Spherical bubbles (
 $\unicode[STIX]{x1D712}\leqslant 1.1$
,
 $7\leqslant Ro\leqslant 13$
), ○: deformed bubbles (
 $\unicode[STIX]{x1D712}>1.1$
,
 $6\leqslant Ro\leqslant 8$
). Dashed line is given by 1.89. Solid line is (3.7).

This fit is consistent with the fact that for
 $Re\rightarrow 0$
, the wake is non-existent and the contamination uniform, and that a constant spinning rate, equal to the Stokes limit, is therefore expected. However it is not clear whether
 $\unicode[STIX]{x1D6FA}_{m}$
will increase further much for
 $Re\geqslant 400$
. There is a strong probability that the spinning behaviour will be modified at very high
 $Re$
, as the bubble would be highly deformed. Some saturation and even a decrease might then take place. Combining (3.3) and (3.6) we get:
 $$\begin{eqnarray}\unicode[STIX]{x1D703}_{l}=1.89\left[\frac{0.15\,Re^{0.55}}{1+0.15\,Re^{0.55}}\right]^{1/2},\end{eqnarray}$$
which fits quite well with the
 $\unicode[STIX]{x1D703}_{l}$
values obtained from our measurements (see figure 11
b). This shows that the modelling of the spinning rate based on the above observations is overall consistent. For the aforementioned reasons, it is obvious that the limit
 $\unicode[STIX]{x1D703}_{l}=108^{\circ }$
(1.89 rad) for
 $Re$
infinite is purely theoretical. Nothing indicates that it can be reached as
 $Re\rightarrow \infty$
and the bubbles highly deform.
3.2.2 Fully contaminated surface
Forcing contamination of water by increasing substantially the number of fluorescent particles changes the interface conditions. In this case, the particles still tag the flow motion but also act as additional contaminants which saturate the surface (figure 3
d). This results directly from their hydrophobic character. They thus diffuse on the overall surface, making a kind of crust around it and solidifying it completely, as a solid sphere’s surface would be. Practically this occurs for seeding concentrations above 60–
 $75\times 10^{-6}~\unicode[STIX]{x03BC}\text{g}~\text{l}^{-1}$
. We have therefore investigated this situation to see the consequences for the spinning motion. Figures 6 and 8(b) show that the surface behaviour is completely different. Whatever the
 $Re$
or
 $Ro$
number (
 $100<Re<250$
,
 $6<Ro<11$
) no acceleration of the surface is observed and surface spinning is thus constant with a velocity 1.4 times the tank’s rotation rate. No obvious
 $Re$
or
 $Ro$
dependencies have been observed so far. This value of 1.4 agrees with the experimental spinning rates obtained by Bluemink et al. (Reference Bluemink, Lohse, Prosperetti and Van Wijngaarden2010) in this range of
 $Re$
and at low shear (
 $S<0.15$
) for solid spheres (see figure 19e of this reference). These spinning rates are almost constant with
 $Re$
, on average lower than 1.5, as is the case for our fully contaminated bubbles.
It is worth noting that all the deformation and forces measurements in water (DW-1 and DW-2) which are reported and discussed hereafter, have been performed without adding any fluorescent dye. The surface is therefore ‘partly’ contaminated, but for simplicity we then will speak of the contaminated surface (bubble) in comparison with a clean surface (bubble).
3.3 Deformation
In silicon oils (clean surface), the Reynolds numbers of deformed bubbles are well correlated in terms of
 $We$
,
 $Mo$
by the relationship (Rastello et al.
Reference Rastello, Marié and Lance2011)
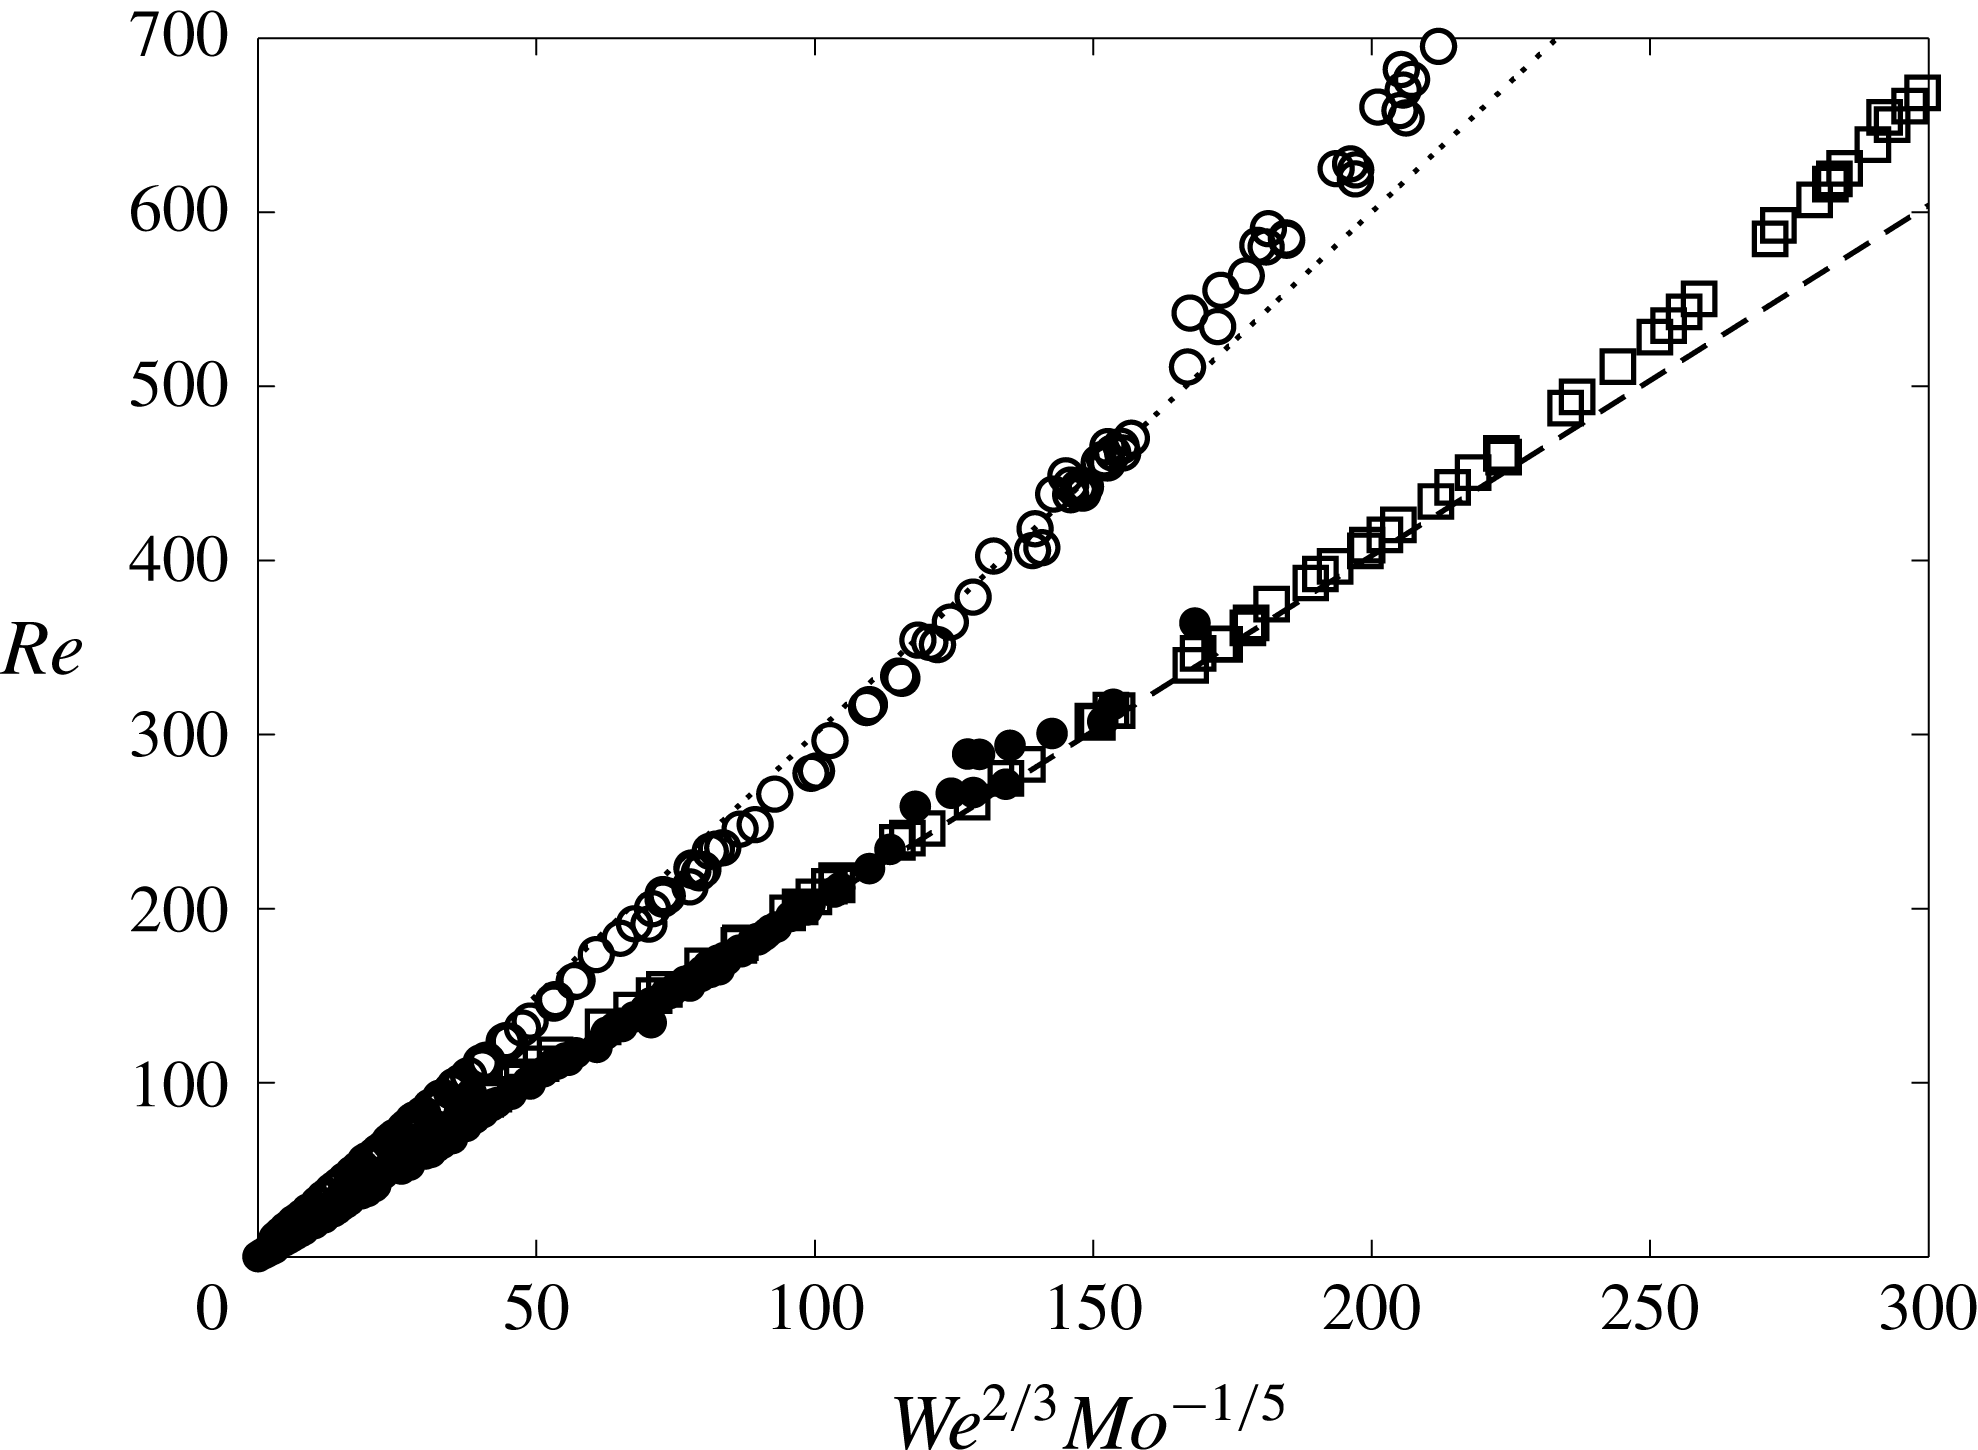
 $$\begin{eqnarray}Re=2.05\,We^{2/3}Mo^{-1/5}\end{eqnarray}$$
Legendre et al. (Reference Legendre, Zenit and Velez-Cordero2012) recently showed that this relation also works satisfactorily for deformed bubbles freely rising in pure stagnant liquids. Their data base, taken from the literature and their own experiments, shows that (3.8) is valid over a wide range of
 $Mo$
(
 $[2.5\times 10^{-11}-1.7\times 10^{0}]$
), including the case of pure water. This is illustrated in figure 12 where the reference measurements of Duineveld (Reference Duineveld1995) in ultra-purified water are plotted against (3.8), together with our data in silicon oils. In contrast, the data in the contaminated environment (DW-2) plotted on the same figure exhibit a different trend. They can be fit by the same correlation in
 $We^{2/3}Mo^{-1/5}$
but with a proportionality factor of 3
 $$\begin{eqnarray}Re=3\,We^{2/3}Mo^{-1/5}.\end{eqnarray}$$
Correlation between
 $Re$
,
 $We$
,
 $Mo$
; ●: silicon oils (SO-1 to SO-5); ▫: ultra-purified water (Duineveld Reference Duineveld1995); ○: demineralized water (DW-2); dashed line: (3.8); dotted line: (3.9).

The change in prefactor is consistent with the drag differences existing between the pure and contaminated situations (§ 4.1). Indeed, this kind of correlation is closely linked to the drag law (Moore Reference Moore1965, p. 762), hence to the range of
 $Re$
number considered and to interface conditions. This is why the data somewhat deviate from (3.8) and (3.9) at high
 $Re$
(
 $Re\geqslant 500$
). The variations of the aspect ratio as a function of
 $We$
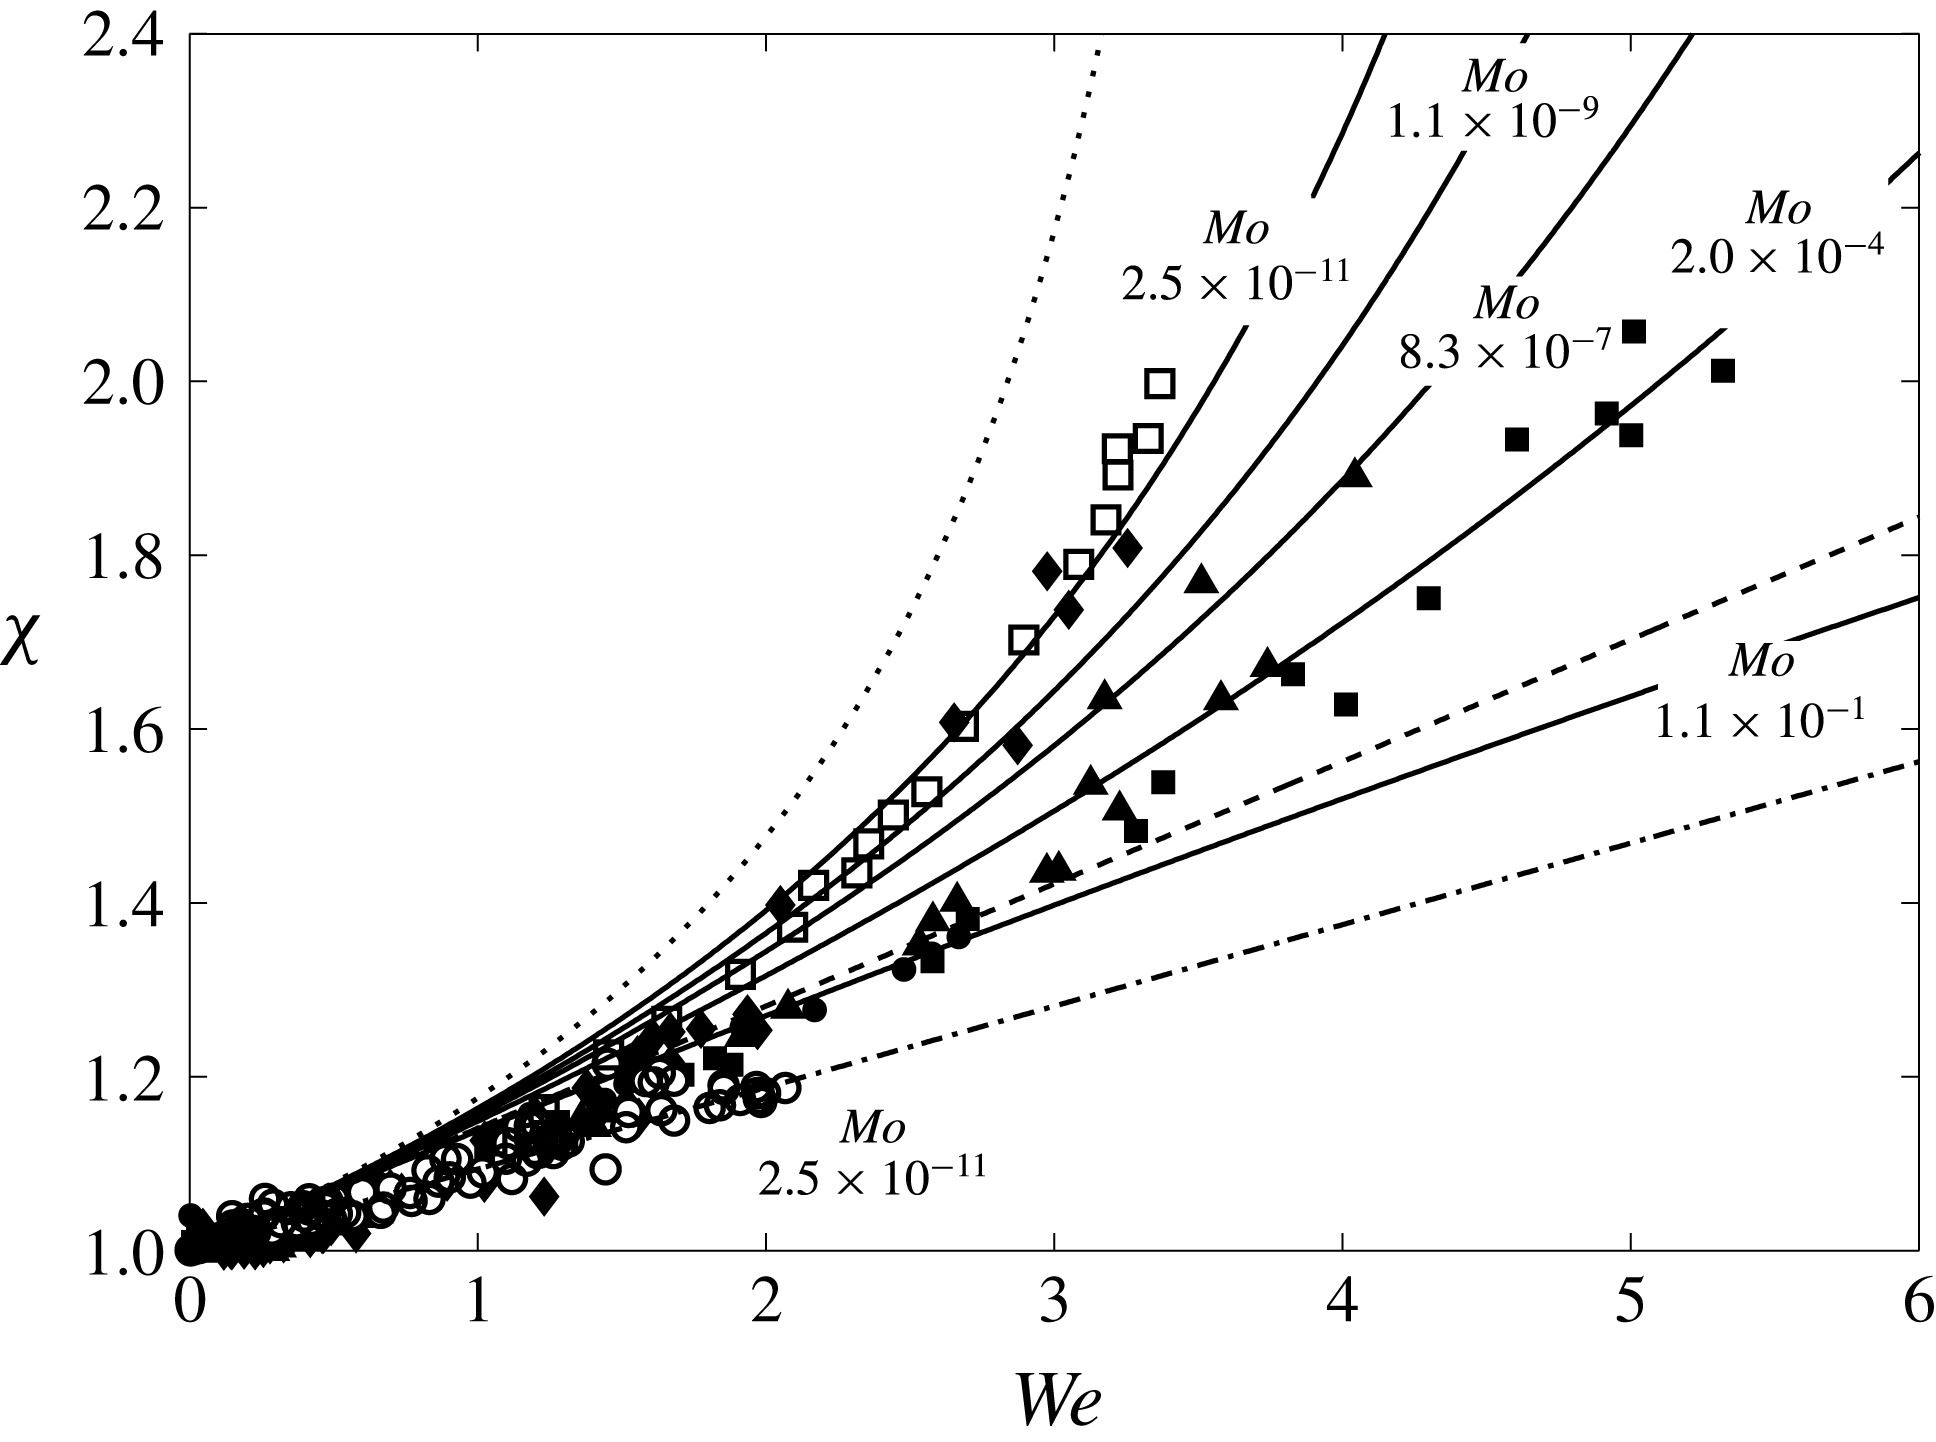
are plotted in figure 13 for sets SO-1 to SO-4 and DW-2. SO-5, whose behaviour is close to SO-4, was not shown for clarity. Data are compared to the expression derived from potential flow theory by Moore (Reference Moore1965) for
 $We$
numbers of the order of unity and its expansion at small
 $We$
(
 $We\ll 1$
), respectively:
 $$\begin{eqnarray}\displaystyle & We(\unicode[STIX]{x1D712})=4\unicode[STIX]{x1D712}^{-4/3}(\unicode[STIX]{x1D712}^{3}+\unicode[STIX]{x1D712}-2)[\unicode[STIX]{x1D712}^{2}\sec ^{-1}(\unicode[STIX]{x1D712})-(\unicode[STIX]{x1D712}^{2}-1)^{1/2}]^{2}(\unicode[STIX]{x1D712}^{2}-1)^{-3}, & \displaystyle\end{eqnarray}$$
 $$\begin{eqnarray}\displaystyle & \unicode[STIX]{x1D712}=1+{\textstyle \frac{9}{64}}We+O(We^{2}). & \displaystyle\end{eqnarray}$$
As noted in Rastello et al. (Reference Rastello, Marié and Lance2011), data in silicon oils are in between these two expressions for
 $\unicode[STIX]{x1D712}$
in the range 1.25–2.4, the discrepancy with these expressions increasing with
 $We$
. A better fit of the measured aspect ratios over the range
 $\unicode[STIX]{x1D712}\in [1;2.4]$
,
 $We\in [0;6]$
is obtained when correcting (3.11) as
 $$\begin{eqnarray}\unicode[STIX]{x1D712}=1+{\textstyle \frac{9}{64}}We+{\textstyle \frac{3}{250}}We^{2}+O(We^{3}).\end{eqnarray}$$
One reason advanced to explain this discrepancy, was the loss of the fore–aft symmetry of the bubble as
 $\unicode[STIX]{x1D712}$
increases and its consequence for the wake. However, the recent observations of Legendre et al. (Reference Legendre, Zenit and Velez-Cordero2012) suggest that this behaviour arises from viscosity effects, which explain that the deformation decreases monotonically when the Morton number
 $Mo$
increases. The expression they propose to describe this effect is written as
 $$\begin{eqnarray}\unicode[STIX]{x1D712}=\frac{1}{1-{\textstyle \frac{9}{64}}We(1+0.2\,Mo^{1/10}We)^{-1}}.\end{eqnarray}$$
Aspect ratio versus
 $We$
number. Silicon oils: ♦: (SO-4); ▴: (SO-3); ▪: (SO-2); ●: (SO-1). Water: ○: contaminated water (DW-2); ▫: ultra-purified water (Duineveld Reference Duineveld1995); dotted line: (3.10); dashed line: (3.11); solid line: (3.13) for the various
 $Mo$
; dashed dotted line: (3.14).

For
 $\unicode[STIX]{x1D712}$
in the range 1.25–2.4, deformations in SO-1 to SO-4 follow the Morton dependency within measurement uncertainty, thus validating this argument. As
 $Mo$
decreases, deformation increases for a given value of
 $We$
and tends to the behaviour characterizing deformation in water (
 $Mo\rightarrow 0$
in (3.13)). This is the case for SO-4 (
 $Mo=1.1\times 10^{-9}$
) which lies close to the measurements in ultra-purified water by Duineveld (Reference Duineveld1995) (
 $Mo=2.5\times 10^{-11}$
). It is to be noted that below
 $1.2$
, deformations are systematically lower than the various models, even in water. Referring to the results of Legendre et al. (Reference Legendre, Zenit and Velez-Cordero2012), the behaviour characterizing deformation in water describes a number of water data in the literature covering different types of bubble trajectories and where the degree of surface cleanness is not always controlled. This led the authors to conclude that surface contamination and the bubble trajectory have little influence on deformation compared to viscosity. Our measurements in demineralized water (DW-2) somewhat contradict this result since they stand below the measurements in the silicon oil with the highest viscosity (SO-4,
 $Mo=1.1\times 10^{-4}$
). However this behaviour is not unexpected. The spin measurements (§ 3.2.1) seem to indicate that contaminants collect at the back of the bubble which contribute to immobilize and rigidify this part of the surface. Many studies (Bel-Fdhila & Duineveld Reference Bel-Fdhila and Duineveld1996; Cuenot et al.
Reference Cuenot, Magnaudet and Spennato1997; Magnaudet & Eames Reference Magnaudet and Eames2000) show in that case that the pressure about the bubble equator steeply increases close to that on a solid sphere. The pressure difference with the front stagnation is therefore reduced compared with a clean bubble, thus reducing deformation. In addition, since drag increases (§ 4.1) the relative velocity, hence the front pressure at equilibrium position, decreases compared to that of a clean bubble. The rotation of the surface in DW-2 (§ 3.2) may also be suspected to have an influence, but insofar as the drag is very close to that of non-rotating contaminated bubbles, we are not convinced that the influence is significant. The shape factor of these bubbles remain
 ${\leqslant}1.2$
and over that range evolves as
 $$\begin{eqnarray}\unicode[STIX]{x1D712}=1+{\textstyle \frac{3}{32}}We+O(We^{2}).\end{eqnarray}$$
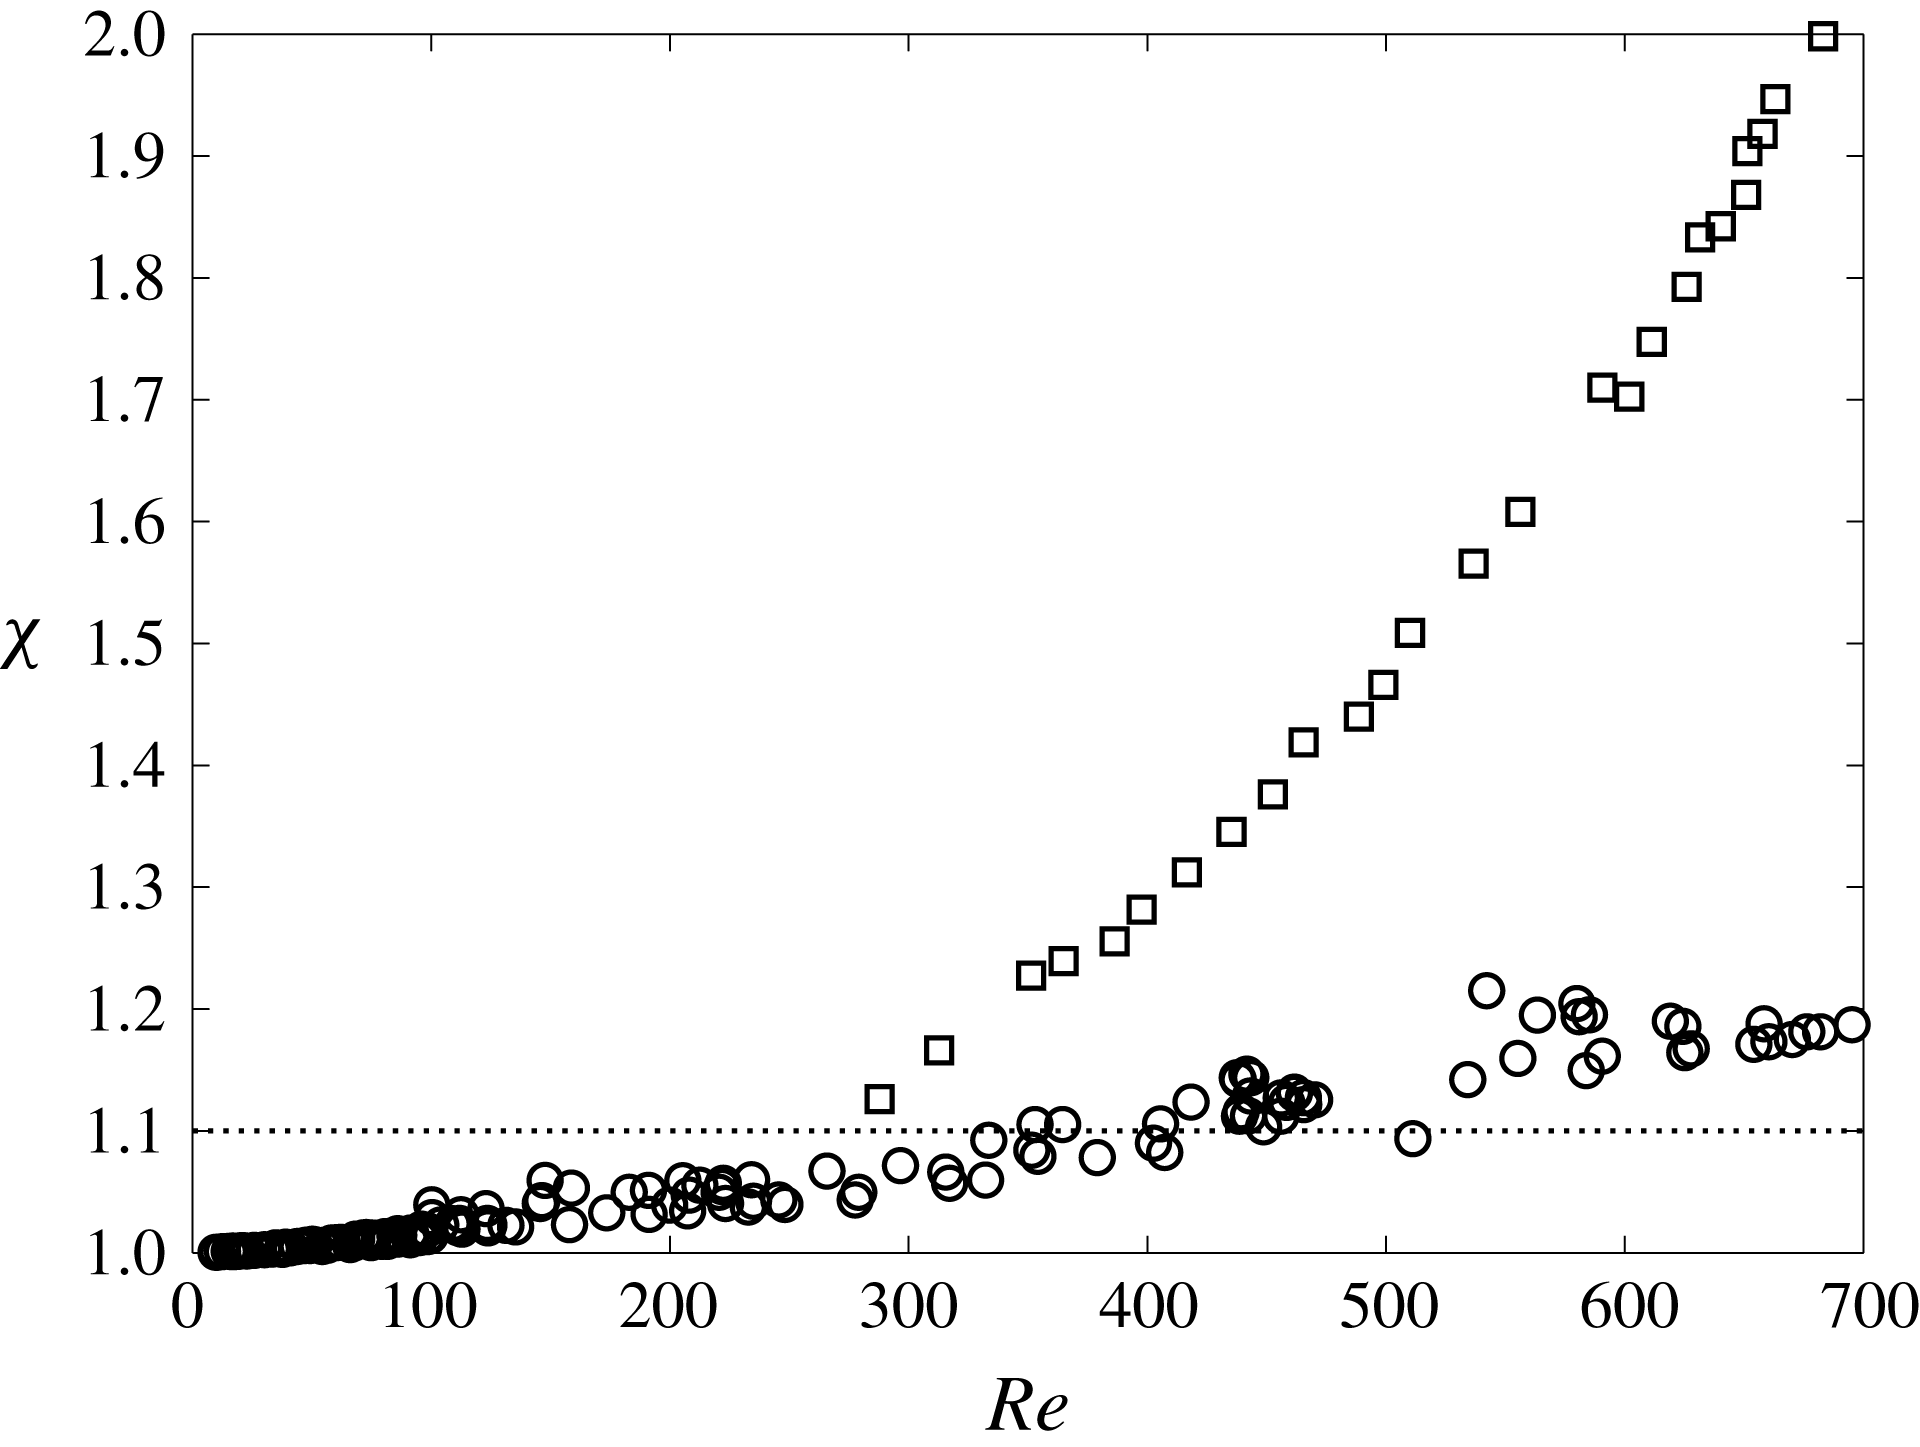
Besides lower deformation, departure from the spherical shape is delayed compared to Duineveld (Reference Duineveld1995). This appears clearly in figure 14 where
 $\unicode[STIX]{x1D712}$
is plotted as a function of
 $Re$
. Taking
 $\unicode[STIX]{x1D712}\geqslant 1.1$
, the onset of deformation starts around
 $Re=370$
for contaminated bubbles against
 $Re=250$
in pure water. This corresponds to
 $We$
numbers of the order of 1.1 in both cases. To complete this investigation, a few measurements have been performed when surface is saturated with fluorescent dye (figure 3
d). No obvious difference with the ‘partly contaminated’ situation was exhibited. This is not surprising since bubbles are in the range of
 $Re$
(
 ${\leqslant}700$
) where deformation remains moderate. The difference between a fully or partly rigid surface is more likely to play a role for much bigger bubbles. These bubbles are difficult to study in this kind of flow because they are less stable, due to important oscillations around their equilibrium position coupled to shape oscillations.
Aspect ratio (
 $\unicode[STIX]{x1D712}$
) versus
 $Re$
. ○: demineralized water (DW-2); ▫: ultra-purified water (Duineveld Reference Duineveld1995); dotted line: onset of deformation
 $\unicode[STIX]{x1D712}=1.1$
.

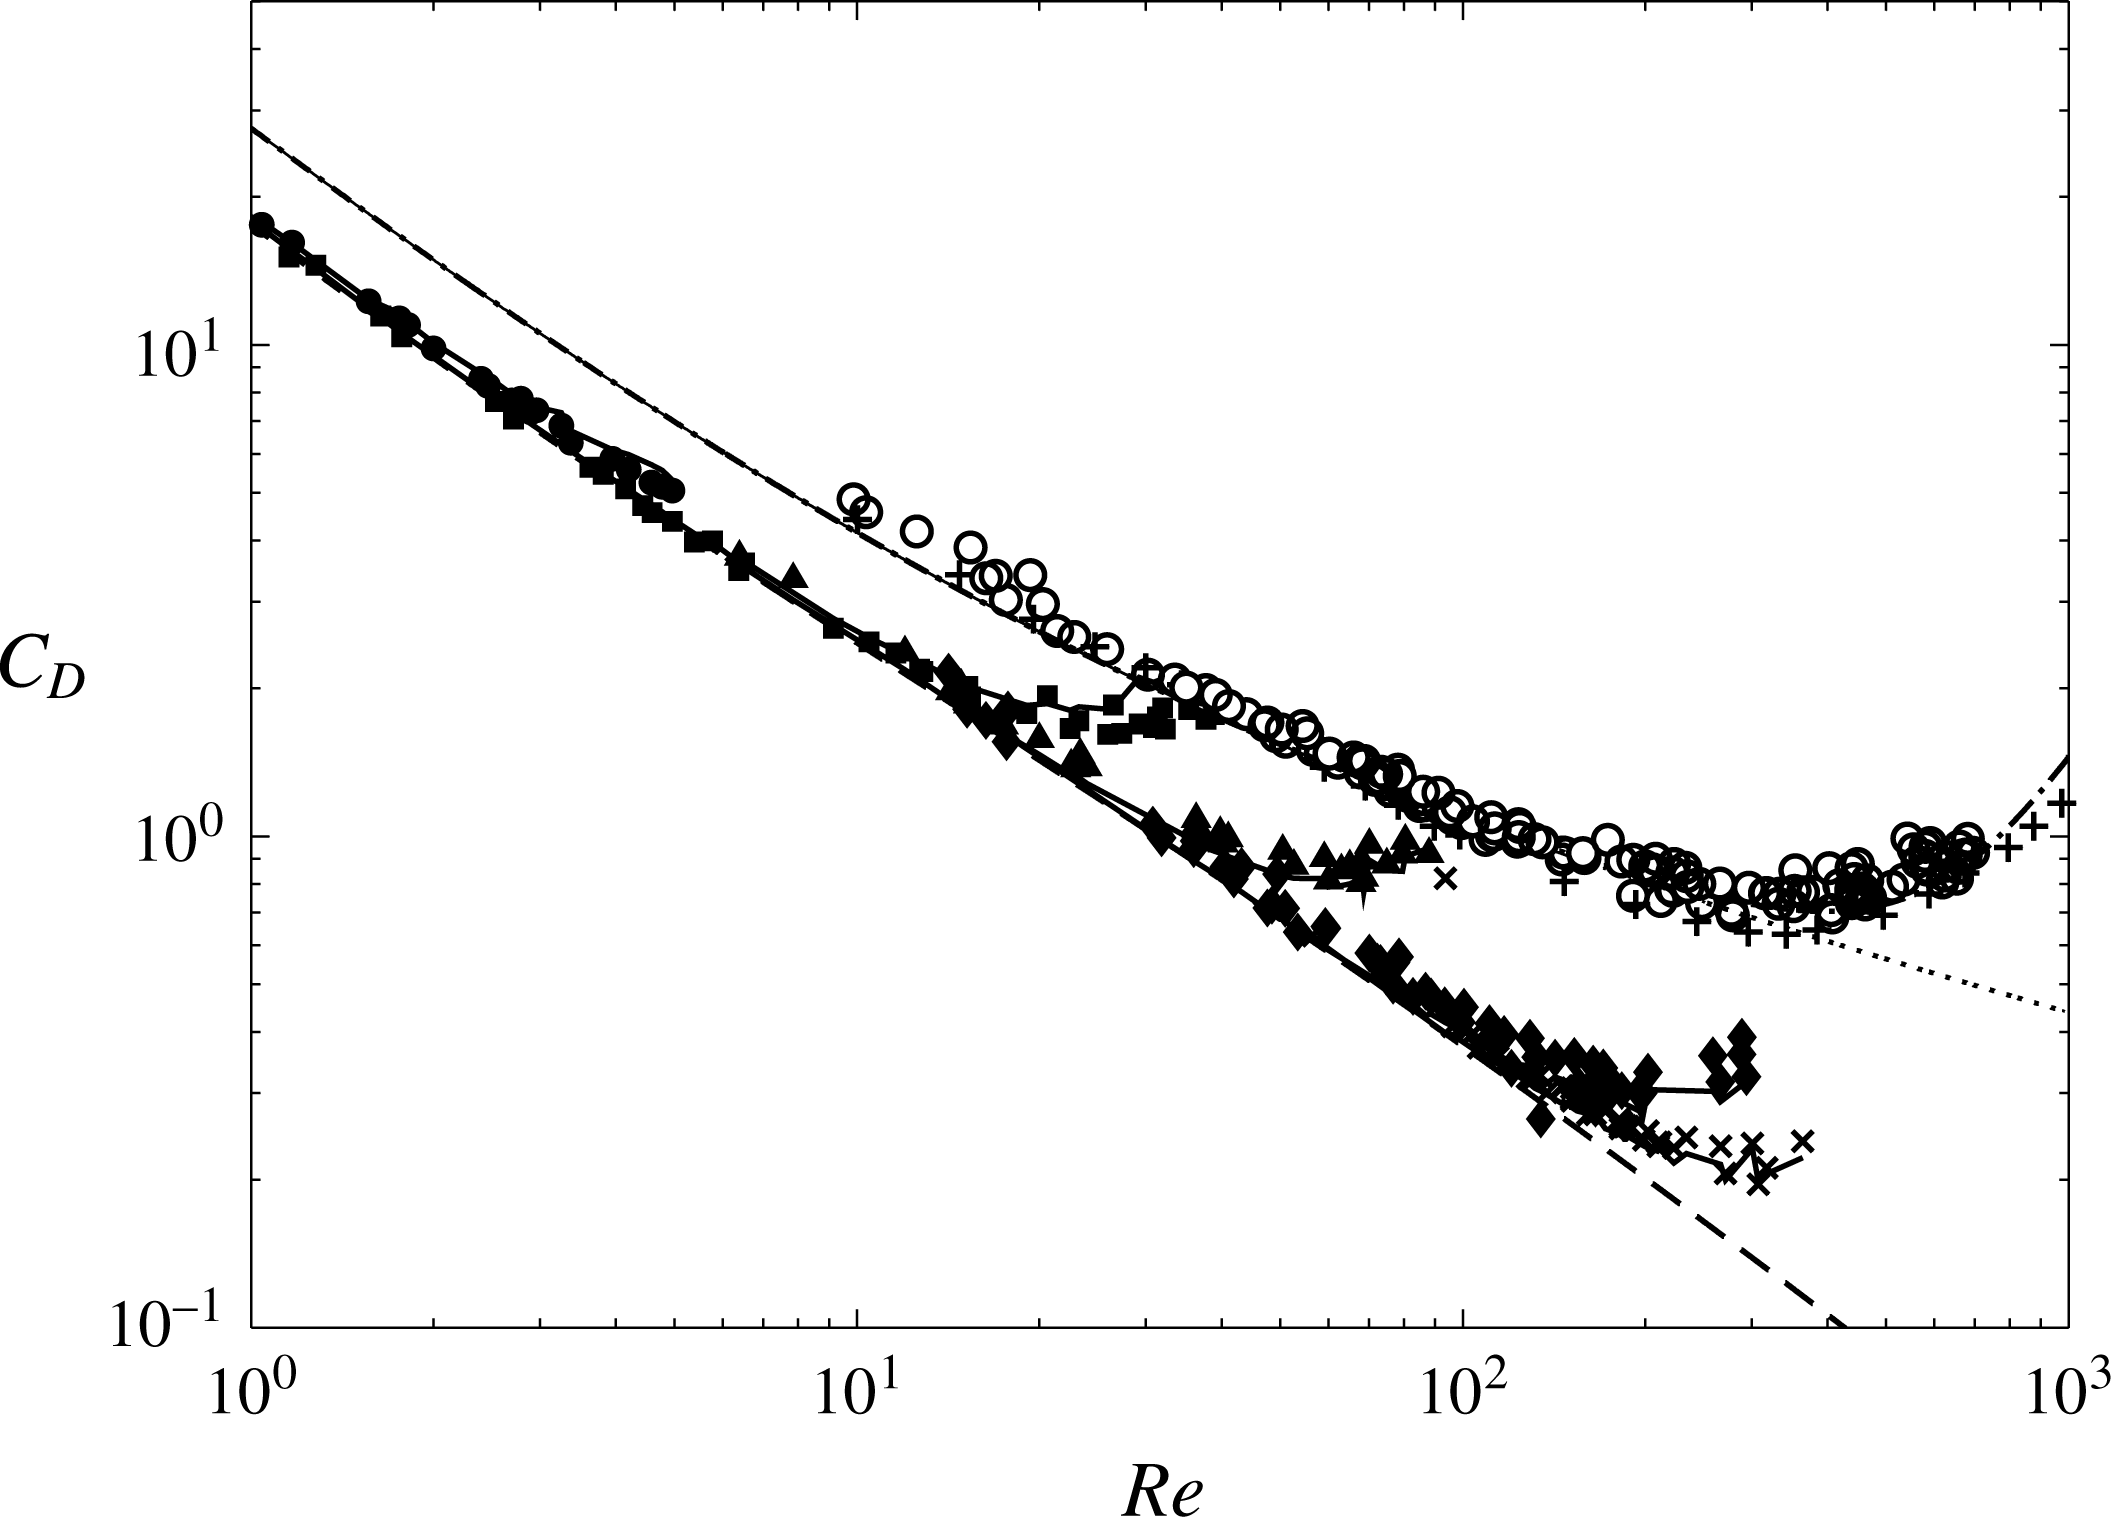
Normalized drag coefficients
 $C_{D}$
versus
 $Re^{-1}$
. Silicon oils: ●: (SO-1); ▪: (SO-2); ▴: (SO-3); ♦: (SO-4);
 $\times$
: (SO-5); dashed line: (4.1), solid line: (4.4). Contaminated water: ○: (DW-1 and DW-2);
 $+$
: Haberman & Morton (Reference Haberman and Morton1953)’s drag results; dotted line: (4.2); dashed-dotted line: (A 1) and (A 3).

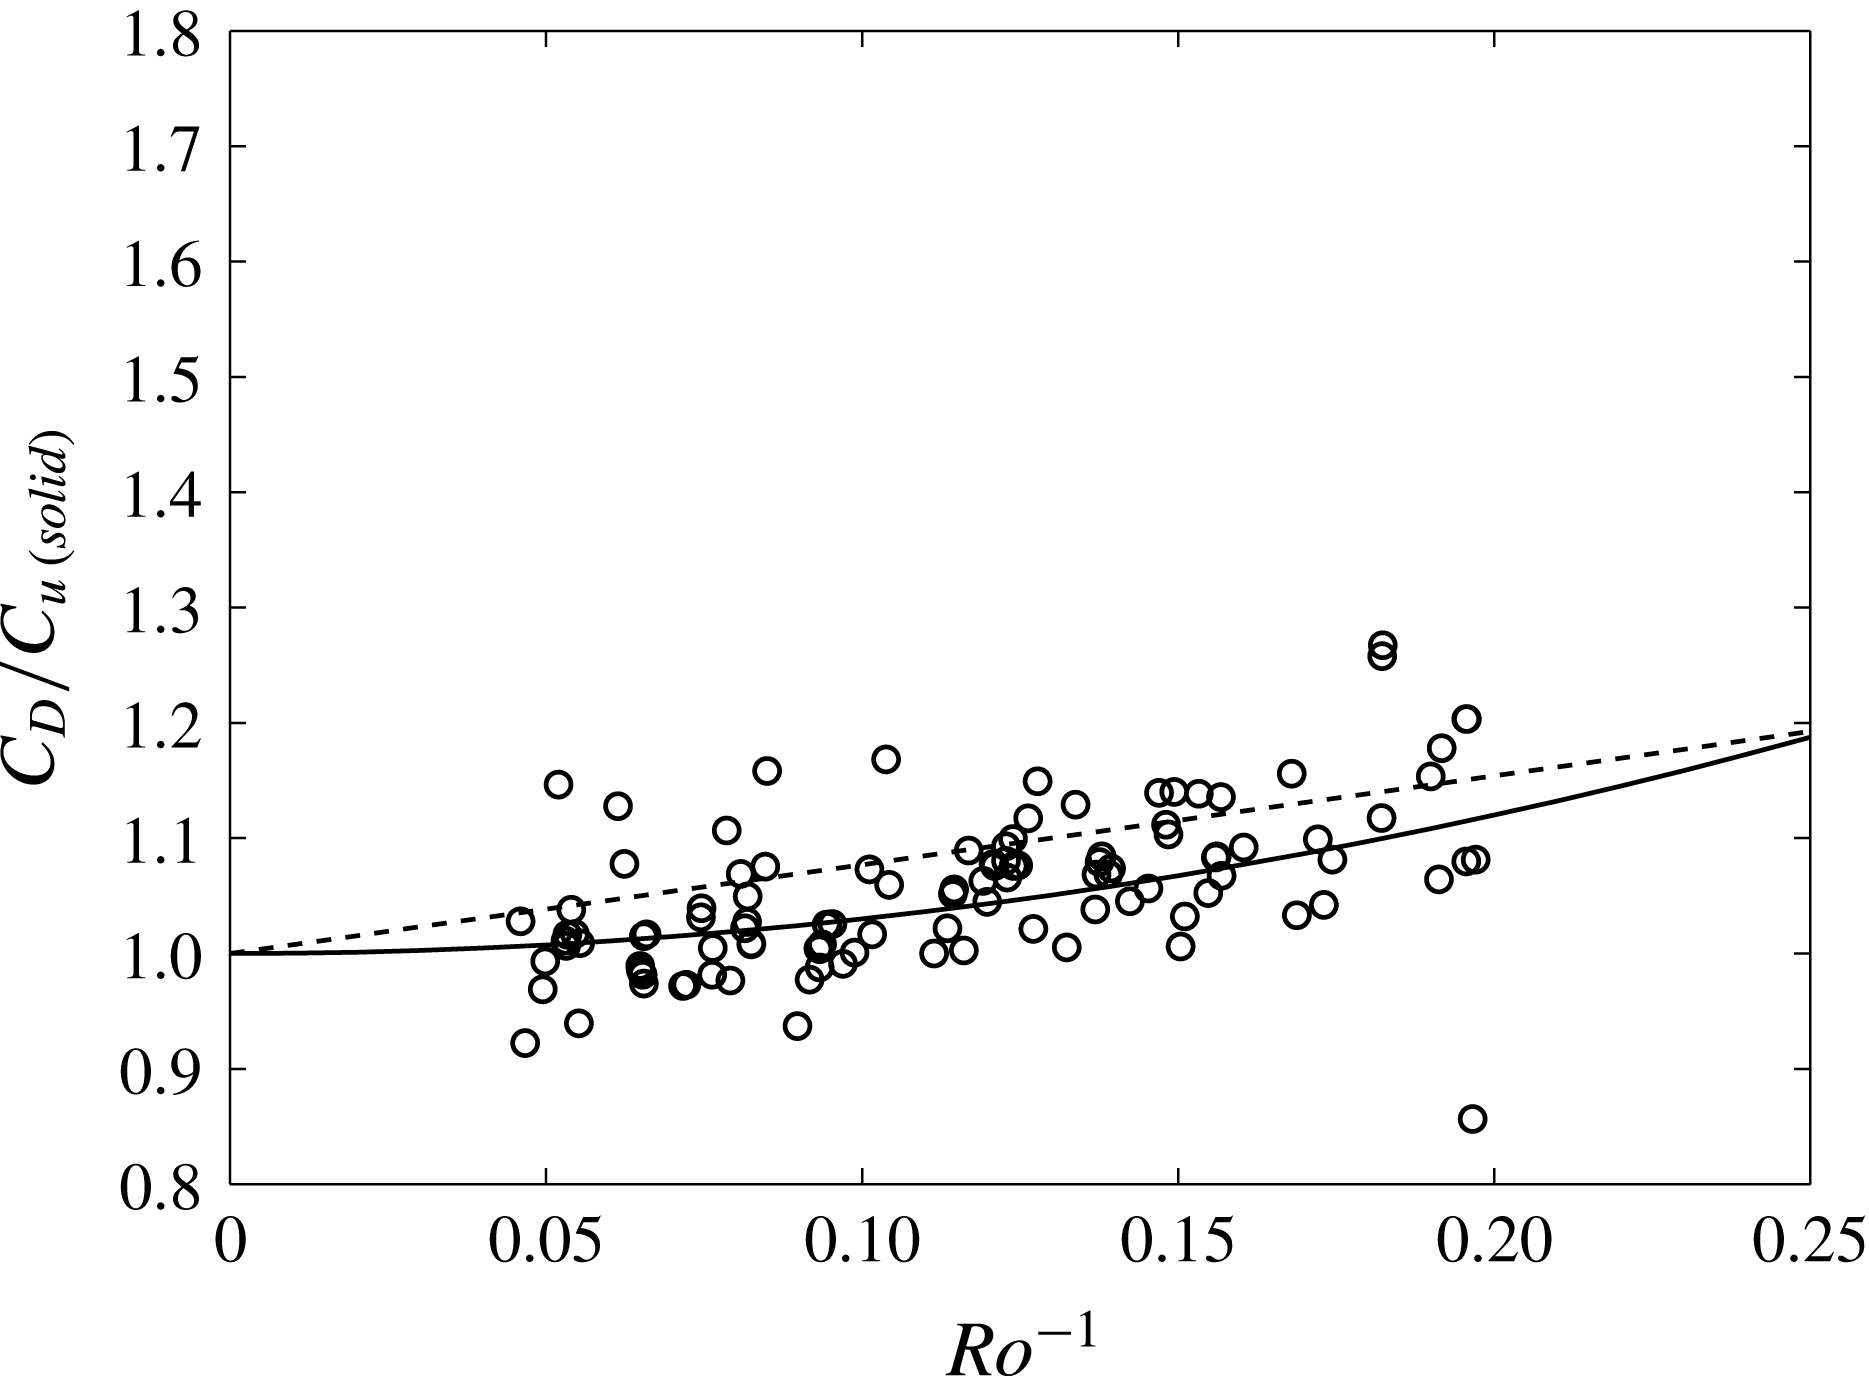
Drag coefficients versus
 $Ro$
. ○: (DW-1); solid line:
 $C_{D}/C_{Du(\mathit{solid})}=1+3/Ro^{2}$
; dashed line:
 $C_{D}/C_{Du(\mathit{solid})}=1+0.77\,Ro^{-1}$
(Bluemink et al.
Reference Bluemink, Lohse, Prosperetti and Van Wijngaarden2010).

4 Comparison between clean and contaminated bubbles: forces
4.1 Drag forces
The drag coefficients
 $C_{D}$
of spherical and deformed bubbles in the various fluids are plotted as a function of
 $Re$
in figure 15. Clearly, the measurements for spherical bubbles in silicon oils (SO-1 to SO-5) are well described by the empirical drag law proposed by Mei, Klausner & Lawrence (Reference Mei, Klausner and Lawrence1994) for clean bubbles in uniform flows
 $$\begin{eqnarray}C_{Du(\mathit{clean})}=\frac{16}{Re}\left[1+\left[\frac{8}{Re}+\frac{1}{2}\left(1+\frac{3.315}{Re^{1/2}}\right)\right]^{-1}\right]\end{eqnarray}$$
and those in demineralized water (DW-1) by the drag law of Schiller & Naumann (Reference Schiller and Naumann1933) for solid spheres.
 $$\begin{eqnarray}C_{Du(\mathit{solid})}=\frac{24}{Re}[1+0.15\,Re^{0.687}].\end{eqnarray}$$
Subscript
 $u$
stands for uniform flow. Since the data DW-1 fall on the curve that describes solid spheres, bubbles are typically in the regime where their surfaces are highly contaminated and the terminal velocity is independent of the contaminants concentration (Clift et al.
Reference Clift, Grace and Weber1978). For bubbles freely rising in stagnant liquids, this occurs when nearly the rear half of the bubble surface is covered by surfactants, and the shear stress and the pressure are dramatically increased at the leading edge of the spherical cap angle thus formed (Bel-Fdhila & Duineveld Reference Bel-Fdhila and Duineveld1996; Cuenot et al.
Reference Cuenot, Magnaudet and Spennato1997). The numerical studies of theses last authors are for
 $Re=100$
. They clearly show (p. 49) that
 $C_{D}$
reaches the sphere value for
 $\unicode[STIX]{x1D703}_{cap}$
around
 $60^{\circ }$
–
 $70^{\circ }$
. Referring to § 3.2, this is also what likely happens here. The important result is that the spinning and the flow rotation have a very limited impact on the drag prevailing in the uniform flow situation. This behaviour is in agreement with the simulations of freely rotating spheres in uniform (Bagchi & Balachandar Reference Bagchi and Balachandar2002) and rotating flow (Bluemink et al.
Reference Bluemink, Lohse, Prosperetti and Van Wijngaarden2010). The influence of the flow rotation alone can be estimated only in silicon oils where no spinning takes place. However, a precise estimation is difficult because, whatever the fluids,
 $Re$
and
 $Ro$
cannot be varied independently in the experiment (Rastello et al.
Reference Rastello, Marié and Lance2011). Low
 $Ro$
(high shear rates
 $S$
) corresponds to low or moderate Reynolds numbers, while high
 $Ro$
is associated with moderate and high Reynolds numbers. Given this difficulty, it was shown that, for silicon oils, drag measurements vary as
 $$\begin{eqnarray}C_{D}=C_{Du(\mathit{clean})}\left(1+\frac{0.3}{Ro^{5/2}}\right)\end{eqnarray}$$
in the range
 $2\leqslant Ro\leqslant 22$
, confirming that the effect of the flow rotation remains weak, of the order of 5 % for
 $Ro=2$
(
 $S=0.5$
). This
 $Ro=S^{-1}$
dependence is weaker than that in
 $0.55S^{2}$
found by Legendre & Magnaudet (Reference Legendre and Magnaudet1998) for linear shear flows. A similar estimation for water (DW-1) yields a dependence roughly in
 $3/Ro^{2}$
up to
 $Ro=5$
, comparable to
 $0.77\,Ro^{-1}$
found for spinning spheres by Bluemink et al. (Reference Bluemink, Lohse, Prosperetti and Van Wijngaarden2010) (figure 16). This means that the effect is once again limited, less than 10 % for
 $Ro=6$
. But, as mentioned above, it does not have the same meaning since it includes also spinning. In addition, the range
 $Ro<6$
, which corresponds to a bubble equilibrium position close to the centre of the tank, cannot be investigated unlike in silicon oils. The reason is that the wake is separated and its asymmetry is much larger for rotating bubbles (figure 3
a,c). Hence, it disturbs the rotating flow incoming on the bubble (Rastello et al.
Reference Rastello, Marié, Grosjean and Lance2009) and measurements in such a situation are rejected. The range of
 $Ro$
is thus too restricted to estimate the dependence properly. The criteria used to reject biased measurements have been extensively discussed in the above reference. This was established from particle image velocimetry (PIV) measurements, flow visualizations and the power spectrum of the bubble displacements. It was checked that for
 $Ro\geqslant 6{-}7$
, the wake becomes extinct in approximately one half of a full cylinder revolution and thus does not impinge on the bubble. In the range of
 $Re$
investigated, the criteria proposed by Bluemink et al. (Reference Bluemink, Lohse, Prosperetti and Van Wijngaarden2010) to estimate the wake extinction (equation (3.12), p. 15) are satisfied. For
 $Ro$
below 6, the wake is generally deflected toward the cylinder axis by the pressure gradient and strongly disturbs the rotational flow. The signature is a
 $2\unicode[STIX]{x1D714}$
peak on the power spectrum and measurements are then rejected.
Concerning the deformed bubbles, the results indicate that the drag on clean bubbles increases as the surface departs from a spherical shape, and that the
 $Re$
value of the departure onset and the magnitude of the increase depends on
 $Mo$
. This
 $Re$
value, for a given
 $Mo$
, can be calculated by (3.8) and (3.12) or (3.13). The origins of the drag increase were discussed in Rastello et al. (Reference Rastello, Marié and Lance2011). The analytic drag law that predicts well the experimental trends in the range
 $\unicode[STIX]{x1D712}<2$
was shown to be
 $$\begin{eqnarray}\displaystyle C_{D(\mathit{clean})}(\unicode[STIX]{x1D712}) & = & \displaystyle \frac{16}{Re}\left[\frac{1+{\textstyle \frac{8}{15}}(\unicode[STIX]{x1D712}-1)+0.015(3G(\unicode[STIX]{x1D712})-2)Re}{1+0.015\,Re}\right.\nonumber\\ \displaystyle & & \displaystyle +\left.\left[\frac{8}{Re}+\frac{1}{2}\left(1+\frac{3.315H(\unicode[STIX]{x1D712})G(\unicode[STIX]{x1D712})}{Re^{1/2}}\right)\right]^{-1}\right],\end{eqnarray}$$
where
 $G$
and
 $H$
are geometrical factors calculated by Moore (Reference Moore1965). This law, represented in figure 15, is a modification of (4.1) to account for the deformation and which retrieves Moore’s drag law at large Reynolds numbers and the asymptotic drag law of Taylor & Acrivos (Reference Taylor and Acrivos1964) when
 $Re$
and
 $\unicode[STIX]{x1D712}$
are small. Aoyama et al. (Reference Aoyama, Hayashi, Hosokawa and Tomiyama2016, Reference Aoyama, Hayashi, Hosokawa, Lucas and Tomiyama2017) recently showed that it provides good predictions of the terminal velocitiy for clean ellipsoidal bubbles in infinite stagnant liquids. In contaminated water, the drag also increases as the bubbles start to deform and it is worth noting that the measurements are close to the terminal drag coefficients measured by Haberman & Morton (Reference Haberman and Morton1953) for freely rising bubbles in contaminated water. As for spherical bubbles, this shows that the flow rotation and the bubble spinning do not much influence drag coefficients. Contrary to clean bubbles, the wakes for contaminated bubbles separate at low
 $Re$
and no theoretical solutions are available for the drag. An alternative for engineering applications is to use the correlation proposed by Loth (Reference Loth2008) for freely rising bubbles in contaminated water (appendix A), and plotted in figure 15.
4.2 Lift forces


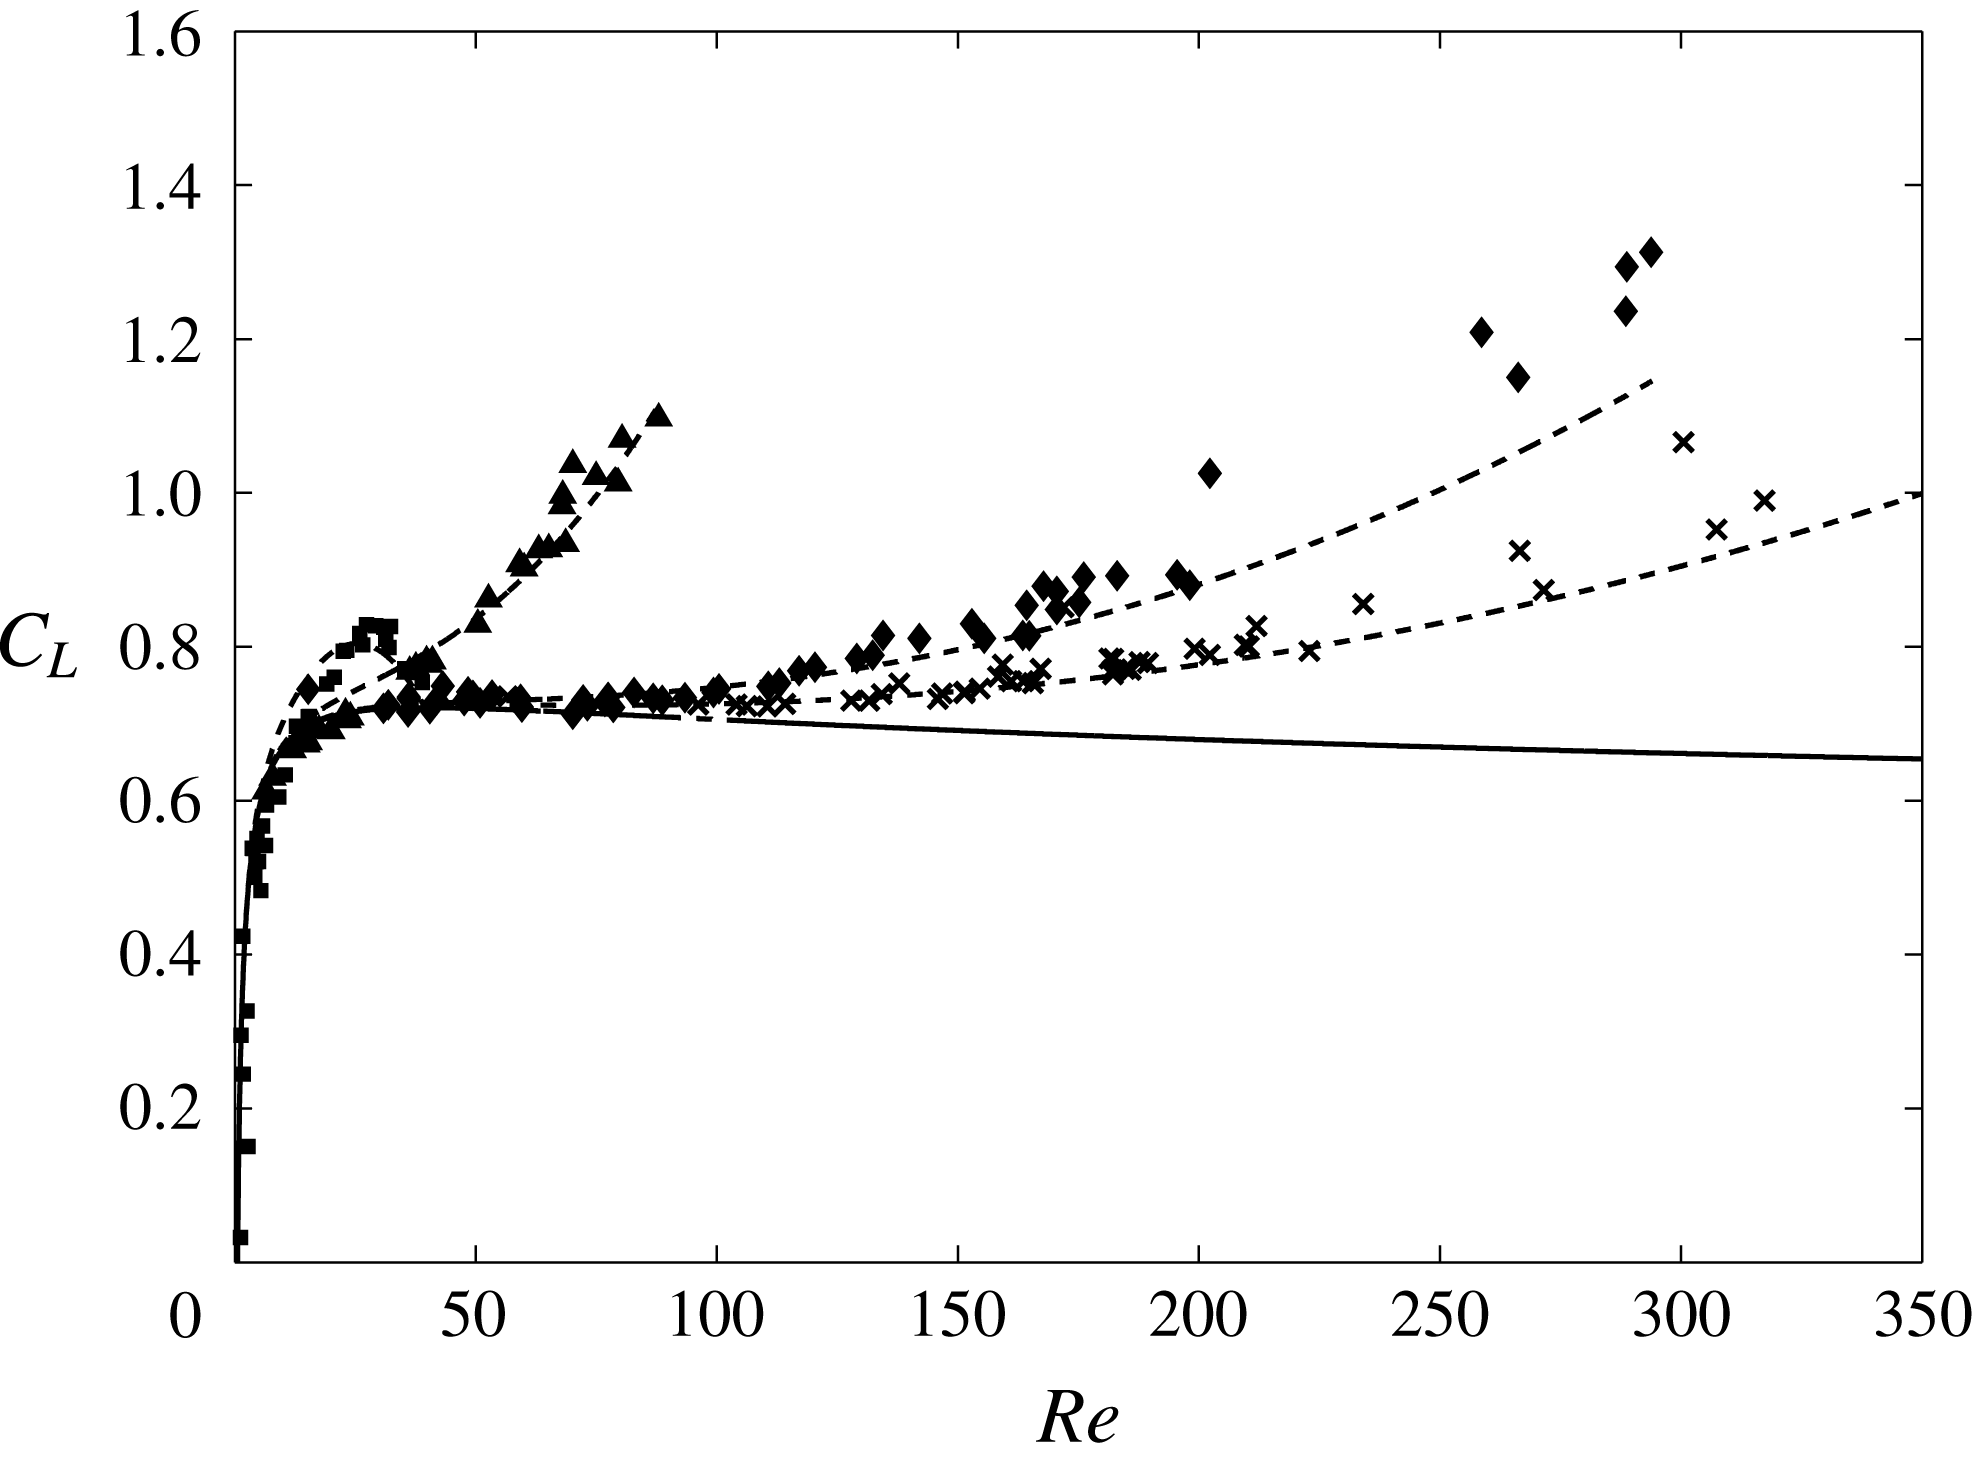
Figure 17 shows the lift coefficients measured in (SO2–SO5) as a function of the
 $Re$
number. The most viscous (SO1-
 $Re\leqslant 5$
) was not plotted for clarity. The solid line represents the correlation that we proposed to fit the lift coefficients of spherical clean bubbles calculated by Magnaudet & Legendre (Reference Magnaudet and Legendre1998) in the range
 $5\leqslant Re\leqslant 1000$
. Its expression is given by
 $$\begin{eqnarray}C_{L(\mathit{clean})}=0.5+4\left(1-\frac{6}{5\,Re^{1/6}}\right)\exp (-Re^{1/6}).\end{eqnarray}$$
Whatever the
 $Mo$
, the measurements fall onto (4.5) as long as the bubbles remain spherical and deviate more or less as deformation starts. As for drag, the
 $Re$
value of the deviation onset and the magnitude of the increase depends on
 $Mo$
. This
 $Re$
value can be calculated from the same equations. As seen in figure 17, the relationship (Rastello et al.
Reference Rastello, Marié and Lance2011)
 $$\begin{eqnarray}C_{L(\mathit{clean})}(\unicode[STIX]{x1D712})=C_{L(\mathit{clean})}(\unicode[STIX]{x1D712}=1)+0.8(\unicode[STIX]{x1D712}-1)-1.3\frac{(\unicode[STIX]{x1D712}-1)^{3/2}}{1+0.004\,Re^{3/2}}\end{eqnarray}$$
well reproduces the lift increases for SO-3 to SO-5. The second term in (4.6) expresses the increase of
 $C_{L}$
with the aspect ratio when
 $Re$
tends to infinite. It is close to the theoretical solution obtained for ellipsoidal bubbles in a weak inviscid shear flow by Naciri (Reference Naciri1992), who showed that this solution closely follows the evolution of the added mass coefficient. The last term is an
 $Re$
-dependent viscous pressure correction which is suggested by the simulations by Adoua (Reference Adoua2007), Adoua, Legendre & Magnaudet (Reference Adoua, Legendre and Magnaudet2009) for oblate bubbles in a weakly viscous linear shear flow, and whose numerator was modified to provide the best fit for our data. Referring to these authors, this correction is linked to the asymmetric distribution of pressure at the surface of the bubble which results from the top–bottom asymmetry of the boundary layer generated at the bubble surface by the inhomogeneity of the base flow. For higher viscosity (SO-2), the increase followed by the decrease is also predicted by (4.6) but with a very slight shift with the experimental results. No
 $Ro$
dependence for the lift coefficient was noted, in agreement with the simulations of Magnaudet & Legendre (Reference Magnaudet and Legendre1998).


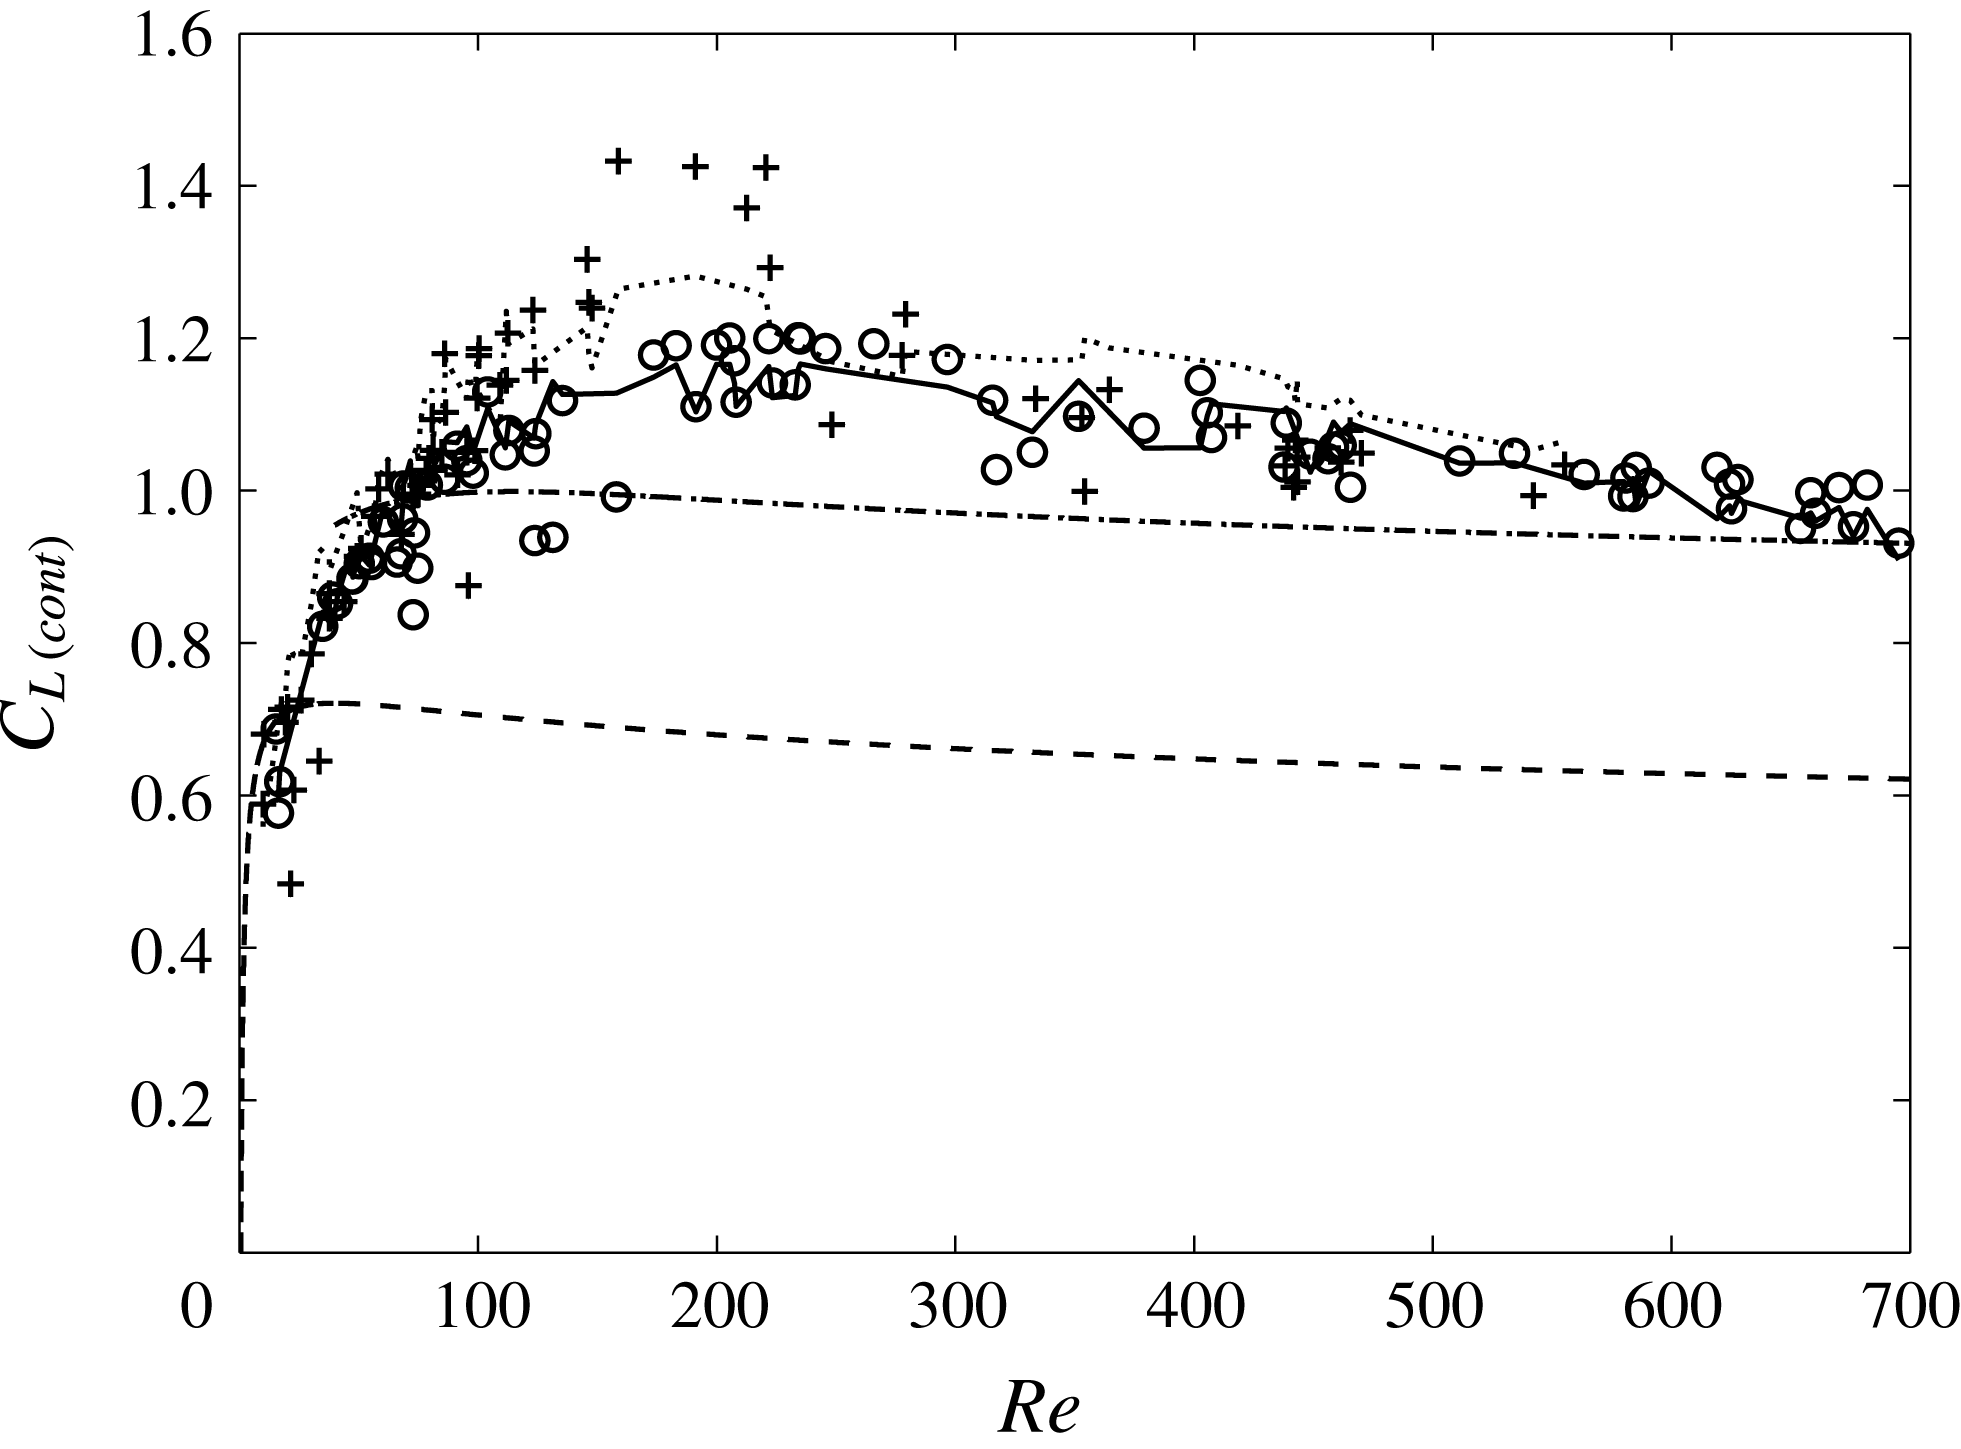
This is not the case for lift coefficients in contaminated water (DW-1 and DW-2) plotted in figure 18. In these experiments, bubbles can be considered as spherical up to
 $Re\approx 400$
(figure 14) and deformation remains small even at
 $Re=700$
(
 $\unicode[STIX]{x1D712}\leqslant 1.2$
). In the range
 $80\leqslant Re\leqslant 250$
and
 $6\leqslant Ro$
, we observe that lift coefficients at high
 $Ro$
are significantly higher than those at low
 $Ro$
, suggesting that they vary inversely to the shear
 $S$
. Moreover, they are much higher than the lift coefficients measured when the surface is clean, for a given value of
 $Re$
. This was attributed to the fact that surface is spinning and in doing so, induces an additional lift on the contaminated bubbles, similar to a Magnus force (Rastello et al.
Reference Rastello, Marié, Grosjean and Lance2009). Referring to the work of Bagchi & Balachandar (Reference Bagchi and Balachandar2002), we made the assumption that the effects of rotation and of spin for the lift, could be linearly superimposed for intermediate
 $Re$
and that the total lift coefficient for a spinning bubble could be expressed as
 $$\begin{eqnarray}C_{L}(Re,Ro,\unicode[STIX]{x1D6FA}_{b})=C_{L}(Re,Ro,\unicode[STIX]{x1D6FA}_{b}=0)+C_{L}(Re,Ro=0,\unicode[STIX]{x1D6FA}_{b}),\end{eqnarray}$$
where
 $C_{L}(Re,Ro,\unicode[STIX]{x1D6FA}_{b}=0)$
is the lift coefficient induced by the flow rotation for a non-spinning bubble, and
 $C_{L}(Re,Ro=0,\unicode[STIX]{x1D6FA}_{b})$
the Magnus-like lift coefficient for a spinning bubble in a non-rotating flow. As simulations on contaminated bubbles in rotating flow were missing, the first coefficient was determined by using Magnaudet & Legendre’s (Reference Magnaudet and Legendre1998) expression for a clean bubble in a rotating flow (
 $50<Re\leqslant 1000$
), while the second coefficient was estimated from our experimental average spinning rates
 $\overline{\unicode[STIX]{x1D6FA}}_{b}$
by using the expression found by Bagchi & Balachandar (Reference Bagchi and Balachandar2002) for a spinning sphere in a linear shear flow. Summing the two yielded an equation of the form
 $$\begin{eqnarray}C_{L}=\frac{1}{2}(1+C_{A})-0.25+1.2\,Re^{-1/3}-6.5\,Re^{-1}+0.55\times \frac{3\overline{\unicode[STIX]{x1D6FA}}_{b}}{8\unicode[STIX]{x1D714}}\end{eqnarray}$$
in reasonably good agreement with the data (dashed-dotted line in figure 18). However, this modelling is to be reconsidered in the light of our additional data in water and the simulations and experiments of Bluemink et al. (Reference Bluemink, Lohse, Prosperetti and Van Wijngaarden2008, Reference Bluemink, Lohse, Prosperetti and Van Wijngaarden2010) available for spinning and non-spinning spheres in a rotational flow. The details of this revision are given in appendix B. By their simulations, these authors showed that the addition of the effects pointed out by Bagchi & Balachandar (Reference Bagchi and Balachandar2002) in shear flow still works in rotating flow. They deduced from their results (numerical and experimental) the expressions at low and high
 $Re$
of the lift coefficient induced by the rotational flow (equations (B 2), (B 3)) on non-spinning spheres. We found that our lift data minus the Magnus-like contribution calculated from our new mean spinning rate measurements follow these expressions satisfactorily and increase with
 $Ro$
(decrease with
 $S$
) with the same dependency of
 $1{-}1.45Ro^{-1}$
(B 6). We therefore replaced the first coefficient in (4.7) by a single expression that agrees with (B 2) and (B 3). The total lift coefficient for contaminated bubbles thus obtained now reads:
 $$\begin{eqnarray}C_{L(\text{cont.})}=[-0.26(1.45-Re^{1/2})\exp (-0.08\,Re^{1/2})](1-1.45\,Ro^{-1})+\frac{3}{16}\frac{\overline{\unicode[STIX]{x1D6FA}}_{b}}{\unicode[STIX]{x1D714}}.\end{eqnarray}$$
As attested to in figure 18, equation (4.9) provides a good prediction of the data for
 $5\leqslant Re\leqslant 700$
and
 $Ro\geqslant 6$
. It is to be noted that the value 0.55 of Bagchi & Balachandar (Reference Bagchi and Balachandar2002) for the Magnus-like lift term in (4.8) was changed into 0.5, to be consistent with Bluemink et al. (Reference Bluemink, Lohse, Prosperetti and Van Wijngaarden2008, Reference Bluemink, Lohse, Prosperetti and Van Wijngaarden2010). All these results tend to prove that lift for spinning bubbles and for spinning spheres behave rather similarly. They also indicate that the small deformations of bubbles at high
 $Re$
do not have a substantial effect on the behaviour of the lift coefficient in comparison to spheres.
4.3 Effect of the ‘spin’ induced lift on bubble trajectory
A few experiments were performed in releasing one bubble far from the centre of the tank. This was achieved by detaching a bubble initially stuck on the wall cylinder in stationary rotation by a small impact on the wall. In this case the bubble follows a spiralling trajectory up to its final equilibrium position (
 $r_{e},\unicode[STIX]{x1D703}_{e}$
), where all the forces acting on it balance. Given our range of
 $Re$
, the equation that is well suited to describe this motion is (Magnaudet & Eames Reference Magnaudet and Eames2000)
 $$\begin{eqnarray}\displaystyle \unicode[STIX]{x1D70C}V_{b}C_{A}\frac{\text{d}\boldsymbol{v}}{\text{d}t} & = & \displaystyle -\unicode[STIX]{x1D70C}V_{b}\boldsymbol{g}+\unicode[STIX]{x1D70C}V_{b}(C_{A}+1)\frac{\text{D}\boldsymbol{U}}{\text{D}t}\nonumber\\ \displaystyle & & \displaystyle +\,\unicode[STIX]{x1D70C}V_{b}C_{L}(\boldsymbol{U}-\boldsymbol{v})\times (\unicode[STIX]{x1D735}\times \boldsymbol{U})+\frac{1}{2}\unicode[STIX]{x1D70C}C_{D}A_{b}|\boldsymbol{U}-\boldsymbol{v}|(\boldsymbol{U}-\boldsymbol{v}).\end{eqnarray}$$
The notations are those already in use, with in addition,
 $V_{b}$
the volume of the bubble and
 $A_{b}$
its projected area. The various forces on the right-hand side of (4.10) are the buoyancy:
 $\boldsymbol{F}_{B}$
, the sum of the added mass and inertia:
 $\boldsymbol{F}_{A}$
, the lift:
 $\boldsymbol{F}_{L}$
and the drag:
 $\boldsymbol{F}_{D}$
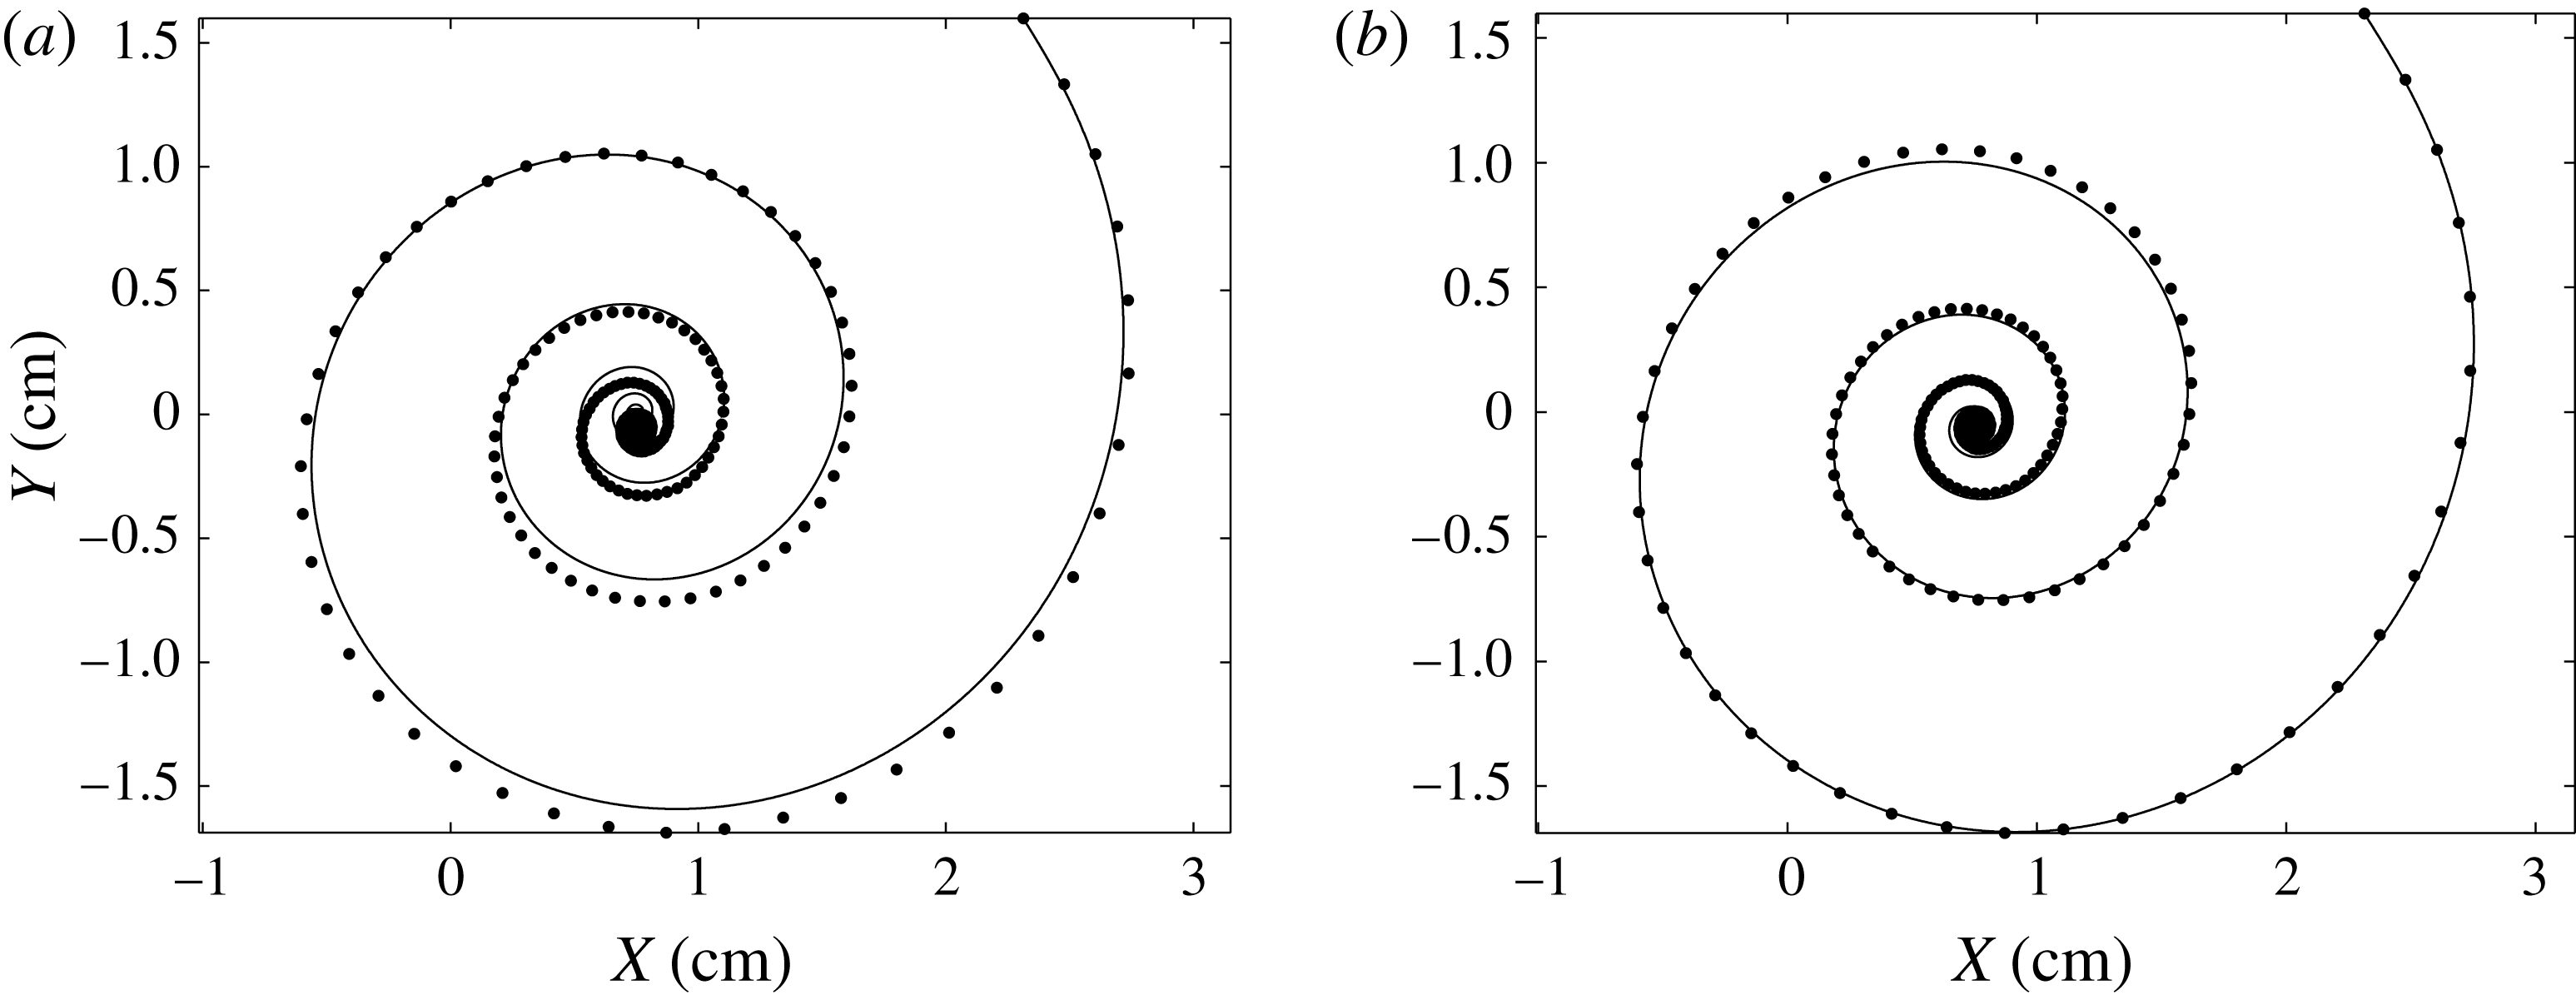
, respectively. Figure 19(a,b) provides an example of trajectory obtained by solving this equation using the Matlab solver
 $ode113$
. The initial conditions are the diameter of the bubble, its position and velocity, as determined at the initial instant of the image sequence, and the initial velocity
 $\boldsymbol{U}$
of the undisturbed flow at the centre of the bubble calculated from the rotation rate
 $\unicode[STIX]{x1D714}$
. Comparison of panels (a) and (b) clearly indicates that the experimental bubble trajectory is not predicted very well when omitting the Magnus-like contribution to the lift. It should be noted that simulations were performed taking
 $Ro$
constant and equal to 6 in (4.9) which is approximately the average value for this bubble trajectory.
(a) Computed bubble trajectory without Magnus-like effect. ●: Experiment (
 $d=0.98$
mm,
 $\unicode[STIX]{x1D714}=14.7~\text{rad s}^{-1}$
); solid line: (4.9) without the second term. (b) Computed bubble trajectory with Magnus-like effect. ●: Experiment same parameters; solid line: (4.9). Centre of the tank: (
 $X=0,Y=0$
).

It was not possible to perform trajectories in silicon oil, since in the present device it implies having the bubble stuck to the tank side walls while the flow is establishing and then release it by knocking on the tank when the flow is in solid-body rotation. Unfortunately, if bubbles stick easily to the side walls when water is inside, there is no way to make them stick to the tank when in silicon oil. Thus, as soon as one sets the tank in motion whatever the speed chosen and the way to reach it, a bubble in silicon oil will begin to move as well while the solid-body rotation flow is not yet established and will quietly reach its equilibrium position together with the flow being organized.
5 Conclusion
This paper comes as a synthesis of our two previous papers Rastello et al. (Reference Rastello, Marié, Grosjean and Lance2009, Reference Rastello, Marié and Lance2011). This synthesis includes new results that improve our understanding of bubble behaviour in a solid-body rotation flow. For that, we have investigated the two remaining points that our previous studies had not tackled. The first concerns forces on deformed contaminated bubbles with Reynolds numbers up to 700. The second, focuses on the surface visualization of clean bubbles.
It was first shown that while the surface is spinning for contaminated bubbles, clean bubbles have a still surface. The wake behind the bubble is different as well: clean bubbles have an unseparated wake with quite a small extension, while for the same Reynolds numbers, the wake behind contaminated bubbles separates very rapidly and gets a much bigger extension downstream. This wake’s extension disturbs the rotating flow incoming on the bubble when its equilibrium position is close to the centre of the tank (Rastello et al.
Reference Rastello, Marié, Grosjean and Lance2009). Thereby, the low Rossby
 $Ro<6$
or high shear
 $S>0.2$
range corresponding to this situation cannot be investigated in water. No restriction of this kind happens with clean bubbles.
The spinning motion of contaminated bubbles’ surface outlined in Rastello et al. (Reference Rastello, Marié, Grosjean and Lance2009) has been studied in detail. Two spinning regimes can in fact be observed. In situations where bubbles are ‘partly contaminated’ or ‘naturally contaminated’, the contaminants accumulate in the rear part of the bubble (the region of the separated wake). The consequence is that their spinning rate is not constant. It is constant and equal to the rotation rate of the tank in the front region (outside the wake). But it increases, passes through a maximum for some angle
 $\unicode[STIX]{x1D703}_{m}$
and then decreases in the rear region (inside the wake). The acceleration/deceleration motion can be modelled by a ‘square’ similarity law with two parameters: the angle
 $\unicode[STIX]{x1D703}_{l}$
delimiting the two regions and the rotation rate of the tank. Both angles
 $\unicode[STIX]{x1D703}_{l}$
and
 $\unicode[STIX]{x1D703}_{m}$
scale as
 $Re^{0.55}$
. The mean spinning rate for the surface obtained in Rastello et al. (Reference Rastello, Marié, Grosjean and Lance2009) has been reformulated in the light of these new data. In the situation where bubble contamination is forced by adding particles to the water, their surfaces are saturated by contaminants. In that case, called the ‘fully contaminated’ bubble, their spinning rate is constant and equal to 1.4 times the rotation rate of the tank. All the results on contaminated bubbles obtained for
 $Re$
up to 150 are consistent with the results reported by Bluemink et al. (Reference Bluemink, Lohse, Prosperetti and Van Wijngaarden2008, Reference Bluemink, Lohse, Prosperetti and Van Wijngaarden2010) for spheres in the same kind of flow.
Compared to clean bubbles, the deformation of contaminated bubbles remains extremely limited. A shape factor, at maximum equal to 1.2, is measured for
 $Re$
as high as 700, while it is of the order of 2 in ultra-purified water (Duineveld Reference Duineveld1995). This shows that the accumulation of contaminants in the rear part of the bubble strongly reduces its ability to deform. The shape factor of these bubbles linearly increases with the Weber number as
 $(3/32)We$
, which is lower than the theory at small
 $We$
of Moore (Reference Moore1965). Clean bubbles in silicon oils at low viscosity have a clean-water-like behaviour. For more viscous oils, the deformation for a given
 $We$
decreases with the Morton number
 $Mo$
, following well the relation proposed by Legendre et al. (Reference Legendre, Zenit and Velez-Cordero2012). This relation better accounts for the deformations than the one we had proposed in Rastello et al. (Reference Rastello, Marié and Lance2011).
The new results for the drag forces concern deformed contaminated bubbles. The measurements are close to the terminal drag coefficients measured by Haberman & Morton (Reference Haberman and Morton1953) for freely rising bubbles in contaminated water. Whether the bubbles are spherical or deformed, their spinning has very little influence on the drag force, in agreement with the simulations of freely rotating spheres in uniform (Bagchi & Balachandar Reference Bagchi and Balachandar2002) and rotating flow (Bluemink et al. Reference Bluemink, Lohse, Prosperetti and Van Wijngaarden2010). It was checked that the drag correlation of Loth (Reference Loth2008), in between the drag law for the spherical case (Schiller & Naumann Reference Schiller and Naumann1933) and that of the spherical cap case (Joseph Reference Joseph2006), well reproduced the data.
The measurements at high
 $Re$
confirm that lift coefficients for a contaminated bubble are much higher than those for clean bubbles for a given value of Reynolds number. This excess lift results from the spinning motion of the surface which takes place when it is contaminated. It can be well modelled by a Magnus-like lift force. The first modelling that we proposed in Rastello et al. (Reference Rastello, Marié, Grosjean and Lance2009) has been revisited in the light of our additional spinning rate measurements and of simulations and experiments of Bluemink et al. (Reference Bluemink, Lohse, Prosperetti and Van Wijngaarden2008, Reference Bluemink, Lohse, Prosperetti and Van Wijngaarden2010) available for spinning and non-spinning spheres in a rotational flow. It varies as
 $(3/16)(\overline{\unicode[STIX]{x1D6FA}}_{b}/\unicode[STIX]{x1D714}),\overline{\unicode[STIX]{x1D6FA}}_{b}$
denoting the mean spinning rate of the bubble. Subtracting the excess lift from the total lift yields the lift contribution of the solid-body rotation flow. This lift contribution is close to that obtained by Bluemink et al. (Reference Bluemink, Lohse, Prosperetti and Van Wijngaarden2008, Reference Bluemink, Lohse, Prosperetti and Van Wijngaarden2010) for non-spinning spheres. Like them, we find that it increases with
 $Ro$
(decreases with
 $S$
) following the same dependency in
 $1-1.45\,Ro^{-1}$
. All these results tend to prove that lift for spinning bubbles and for spinning spheres behave rather similarly. When surface is clean, the lift is caused only by the flow rotation and does not depend on
 $Ro$
. But it is significantly modified as bubbles deform.
Finally, we have included the ‘spin’ induced lift component in the dynamical equation of motion to compute the trajectory of a contaminated bubble measured experimentally. Results indicate that the trajectory is thus better predicted.
Appendix A. Drag correlation for deformed contaminated bubble
Loth (Reference Loth2008) proposed an empirical correlation by compiling a large data base for freely rising contaminated bubbles with
 $Re$
over the range 10–10 000. In this correlation,
 $C_{D}$
for a given
 $We$
, is expressed as a function of a normalized drag increment
 $\unicode[STIX]{x0394}C_{D}^{\ast }$
in the form
 $$\begin{eqnarray}C_{D(\text{cont.})}(We)=C_{D}(We\rightarrow 0)+\unicode[STIX]{x0394}C_{D}^{\ast }(C_{D}(We\rightarrow \infty )-C_{D}(We\rightarrow 0)),\end{eqnarray}$$
where
 $C_{D}(We\rightarrow 0)$
is given by the spherical case (4.2), whereas
 $C_{D}(We\rightarrow \infty )$
is given by the spherical cap case (Joseph Reference Joseph2006) representing the situation with highest deformation
 $$\begin{eqnarray}C_{Dsc}=\frac{8}{3}+\frac{14.24}{Re}.\end{eqnarray}$$
The best fit to our data with a normalized drag increment
 $\unicode[STIX]{x0394}C_{D}^{\ast }$
in the form proposed by Loth (Reference Loth2008) is obtained for a constant of 0.0055
 $$\begin{eqnarray}\unicode[STIX]{x0394}C_{D}^{\ast }=\tanh [0.0055(We\,Re^{0.2})^{1.6}],\end{eqnarray}$$
which is slightly higher than the constant 0.0038 recommended by the author to represent the average trend in various contaminated fluids but is consistent with the tap water data of Haberman & Morton (Reference Haberman and Morton1953), as can be seen in figure 15.
Appendix B. Reformulation of the lift coefficient for contaminated bubbles
The simulations of Bluemink et al. (Reference Bluemink, Lohse, Prosperetti and Van Wijngaarden2008, Reference Bluemink, Lohse, Prosperetti and Van Wijngaarden2010) were performed with two different methods: the direct numerical simulation method Physalis (Zhang & Prosperetti Reference Zhang and Prosperetti2005) and the finite-volume code Jadim (Magnaudet, Rivero & Fabre Reference Magnaudet, Rivero and Fabre1995), which both give comparable results. They suggest that the linear uncoupling of the effects is well satisfied in rotation flow for
 $5\leqslant Re\leqslant 200$
and
 $S\leqslant 0.1$
(
 $Ro\geqslant 10$
) with a Magnus-like lift coefficient based on the calculated spin rate
 $\unicode[STIX]{x1D6FA}_{s}$
:
 $$\begin{eqnarray}C_{LMagnus}(\unicode[STIX]{x1D6FA}_{s})\approx 0.5\frac{3}{8}\frac{\unicode[STIX]{x1D6FA}_{s}}{\unicode[STIX]{x1D714}}=\frac{3}{16}\frac{\unicode[STIX]{x1D6FA}_{s}}{\unicode[STIX]{x1D714}}\end{eqnarray}$$
and that the lift coefficient for a non-spinning sphere increases in a logarithmic way as
 $$\begin{eqnarray}C_{L}(5\leqslant Re\leqslant 200,S\leqslant 0.1,\unicode[STIX]{x1D6FA}_{s}=0)=0.51\log _{10}\,Re-0.22.\end{eqnarray}$$
Their experiments were performed with spinning spheres in various liquids, including water. They show that, in most cases, an increase in
 $S$
results in a decrease of the lift coefficients for
 $Re$
above 130, and has no substantial influence below, in agreement with our bubble data (figure 18). In contrast, for
 $Re$
above 200, the same experiments suggest that the lift coefficient minus the contribution of the spin (B 1) decreases with
 $Re$
as
 $$\begin{eqnarray}C_{L}(Re>274,S\leqslant 0.4,\unicode[STIX]{x1D6FA}_{s})-C_{LMagnus}=-0.40\log 10\,Re+1.99.\end{eqnarray}$$
This equation represents a mean trend. It is a fit to the mean lift coefficients obtained for a given liquid (
 $Re$
) by averaging the values measured for various
 $S$
between 0 and 0.4. It is derived on the assumption that for
 $Re$
above 200, the contribution of the spin to the lift coefficient can still be estimated by (B 1), as it is established for
 $5\leqslant Re\leqslant 200$
. Since the contaminated bubbles in our experiments behave like spheres, in particular concerning the drag, we assessed whether (B 2) and (B 3) provided a correct estimation of
 $C_{L}(Re,Ro,\unicode[STIX]{x1D6FA}_{b}=0)$
in (4.7). This point has been checked by calculating the quantity
 $$\begin{eqnarray}\unicode[STIX]{x0394}C_{L}=C_{L}(Re,Ro,\overline{\unicode[STIX]{x1D6FA}}_{b})-C_{LMagnus}(\overline{\unicode[STIX]{x1D6FA}}_{b}),\end{eqnarray}$$
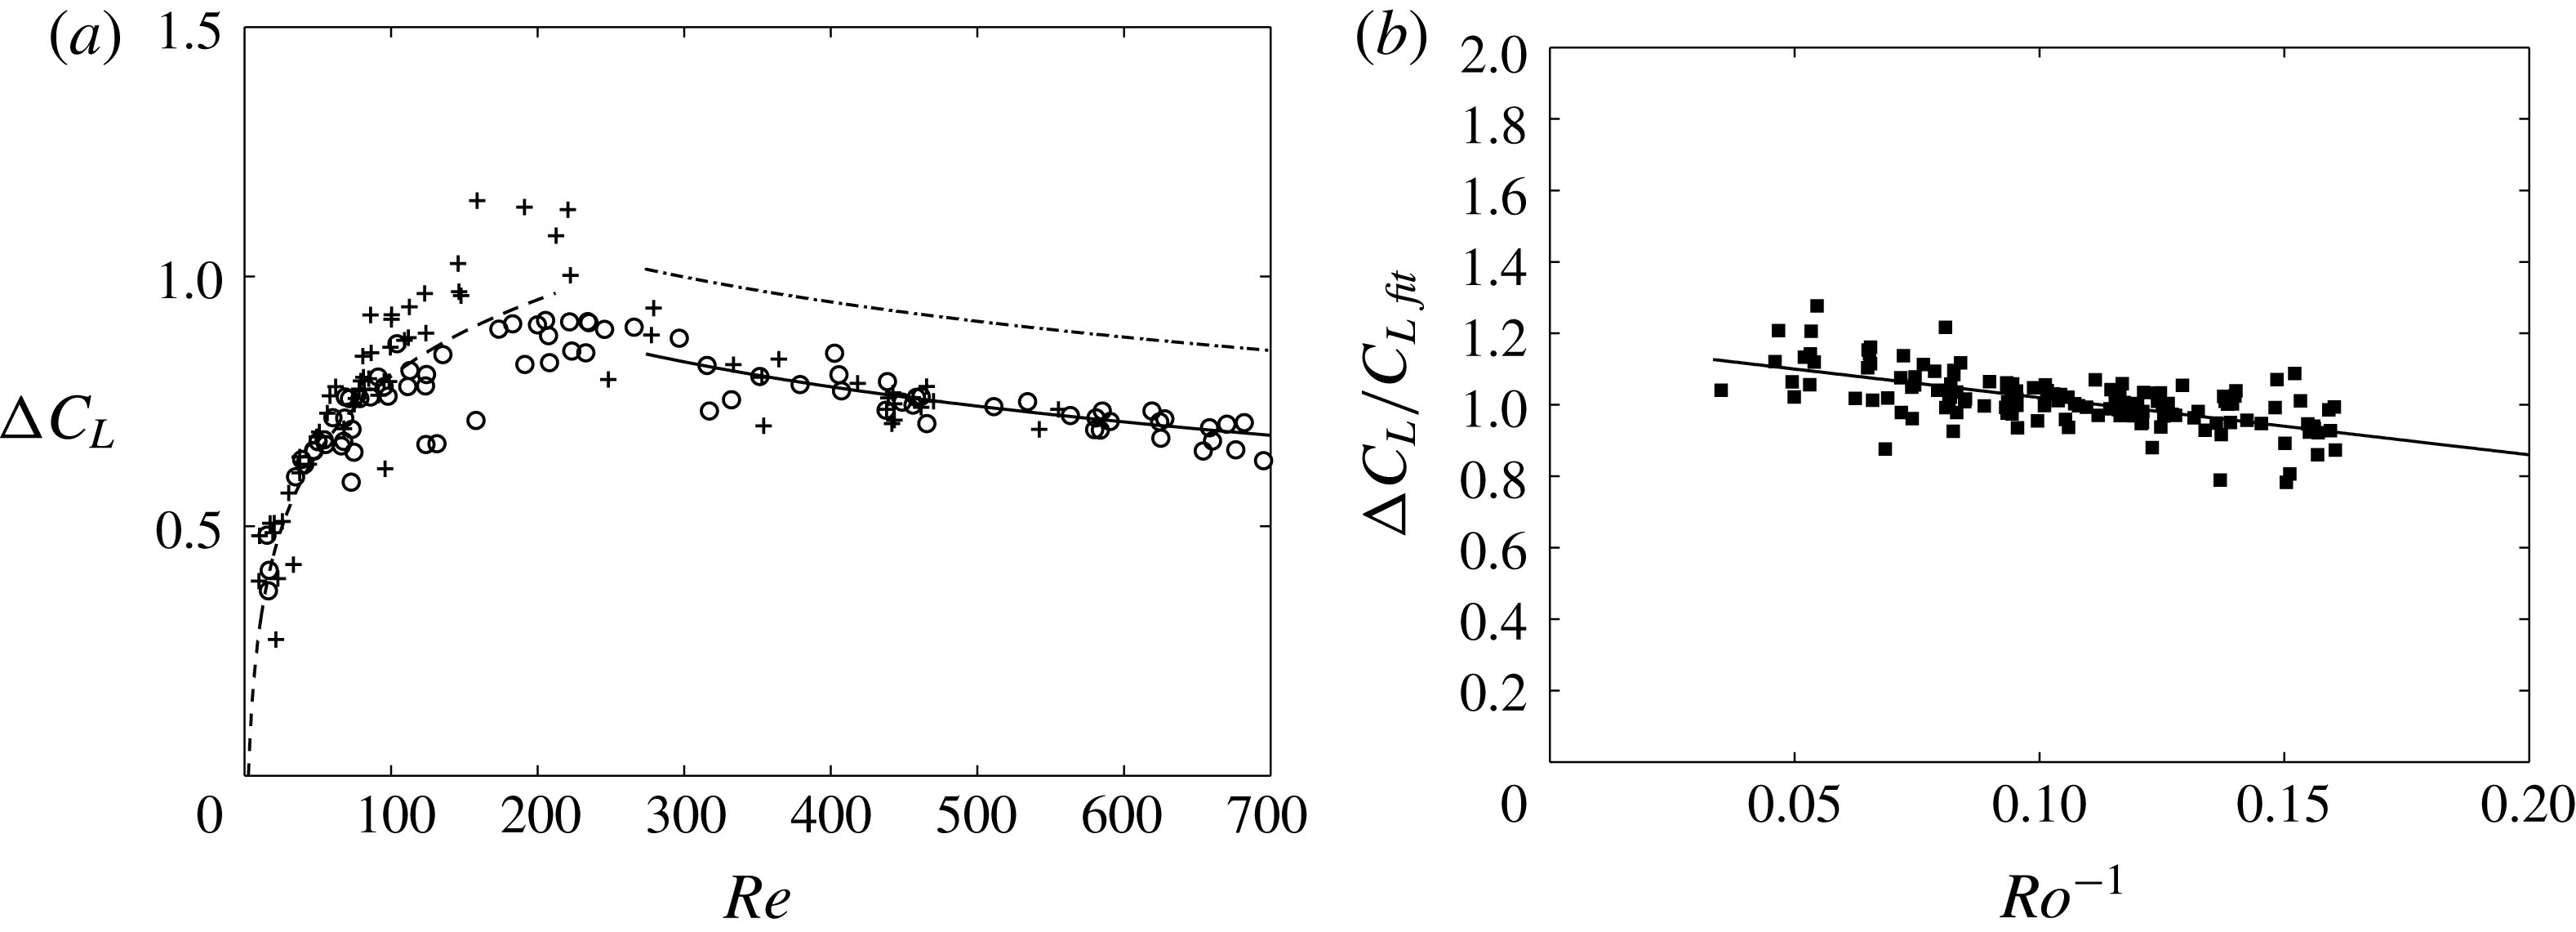
where the Magnus-like contribution is calculated from the new fitting of our average spin rates (3.5). We see in figure 20(a) that
 $\unicode[STIX]{x0394}C_{L}$
is in pretty good agreement with (B 2) for
 $Re<200$
, but lower than the values expected from (B 3) for
 $Re>270$
. A best fit in that range requires to change the additional constant and we modify the equation as
 $$\begin{eqnarray}C_{L}(Re>274,Ro\geqslant 6,\unicode[STIX]{x1D6FA}_{s}=0)=-0.40\log 10\,Re+1.82.\end{eqnarray}$$
(a) Lift coefficients minus Magnus-like contribution versus
 $Re$
. Contaminated water (DW-1 and DW-2): ○:
 $6\leqslant Ro<10$
;
 $+$
:
 $Ro\geqslant 10$
; dashed line: (B 2); dashed-dotted line: (B 3); solid line: (B 5). (b) Lift coefficient minus Magnus-like contribution normalized by (B 2) at low
 $Re$
and (B 5) at high
 $Re$
versus
 $Ro$
; solid line: (B 6).

This constant typically corresponds to the lift coefficients of Bluemink et al. (Reference Bluemink, Lohse, Prosperetti and Van Wijngaarden2010) which are measured in water at shear rates
 $S$
around 0.2 (
 $Ro=5$
), against
 ${\approx}0.1$
in our case. The deformation of bubbles being weak up to
 $Re=500$
, it can hardly be invoked to explain such a difference. Dividing
 $\unicode[STIX]{x0394}C_{L}$
by (B 2) at low
 $Re$
and (B 5) at high
 $Re$
shows that this ratio in average increases with
 $Ro$
as
 $$\begin{eqnarray}\frac{\unicode[STIX]{x0394}C_{L}}{C_{Lfit}}=-1.45\,Ro^{-1}+1.16,\end{eqnarray}$$
which is the increase rate found for spinning spheres in water by these authors. The fact that
 $\unicode[STIX]{x0394}C_{L}/C_{Lfit}$
does not go to 1 as
 $Ro^{-1}\rightarrow 0$
results from the scaling by (B 2) which does not totally fit our data at high
 $Ro$
for
 $Re$
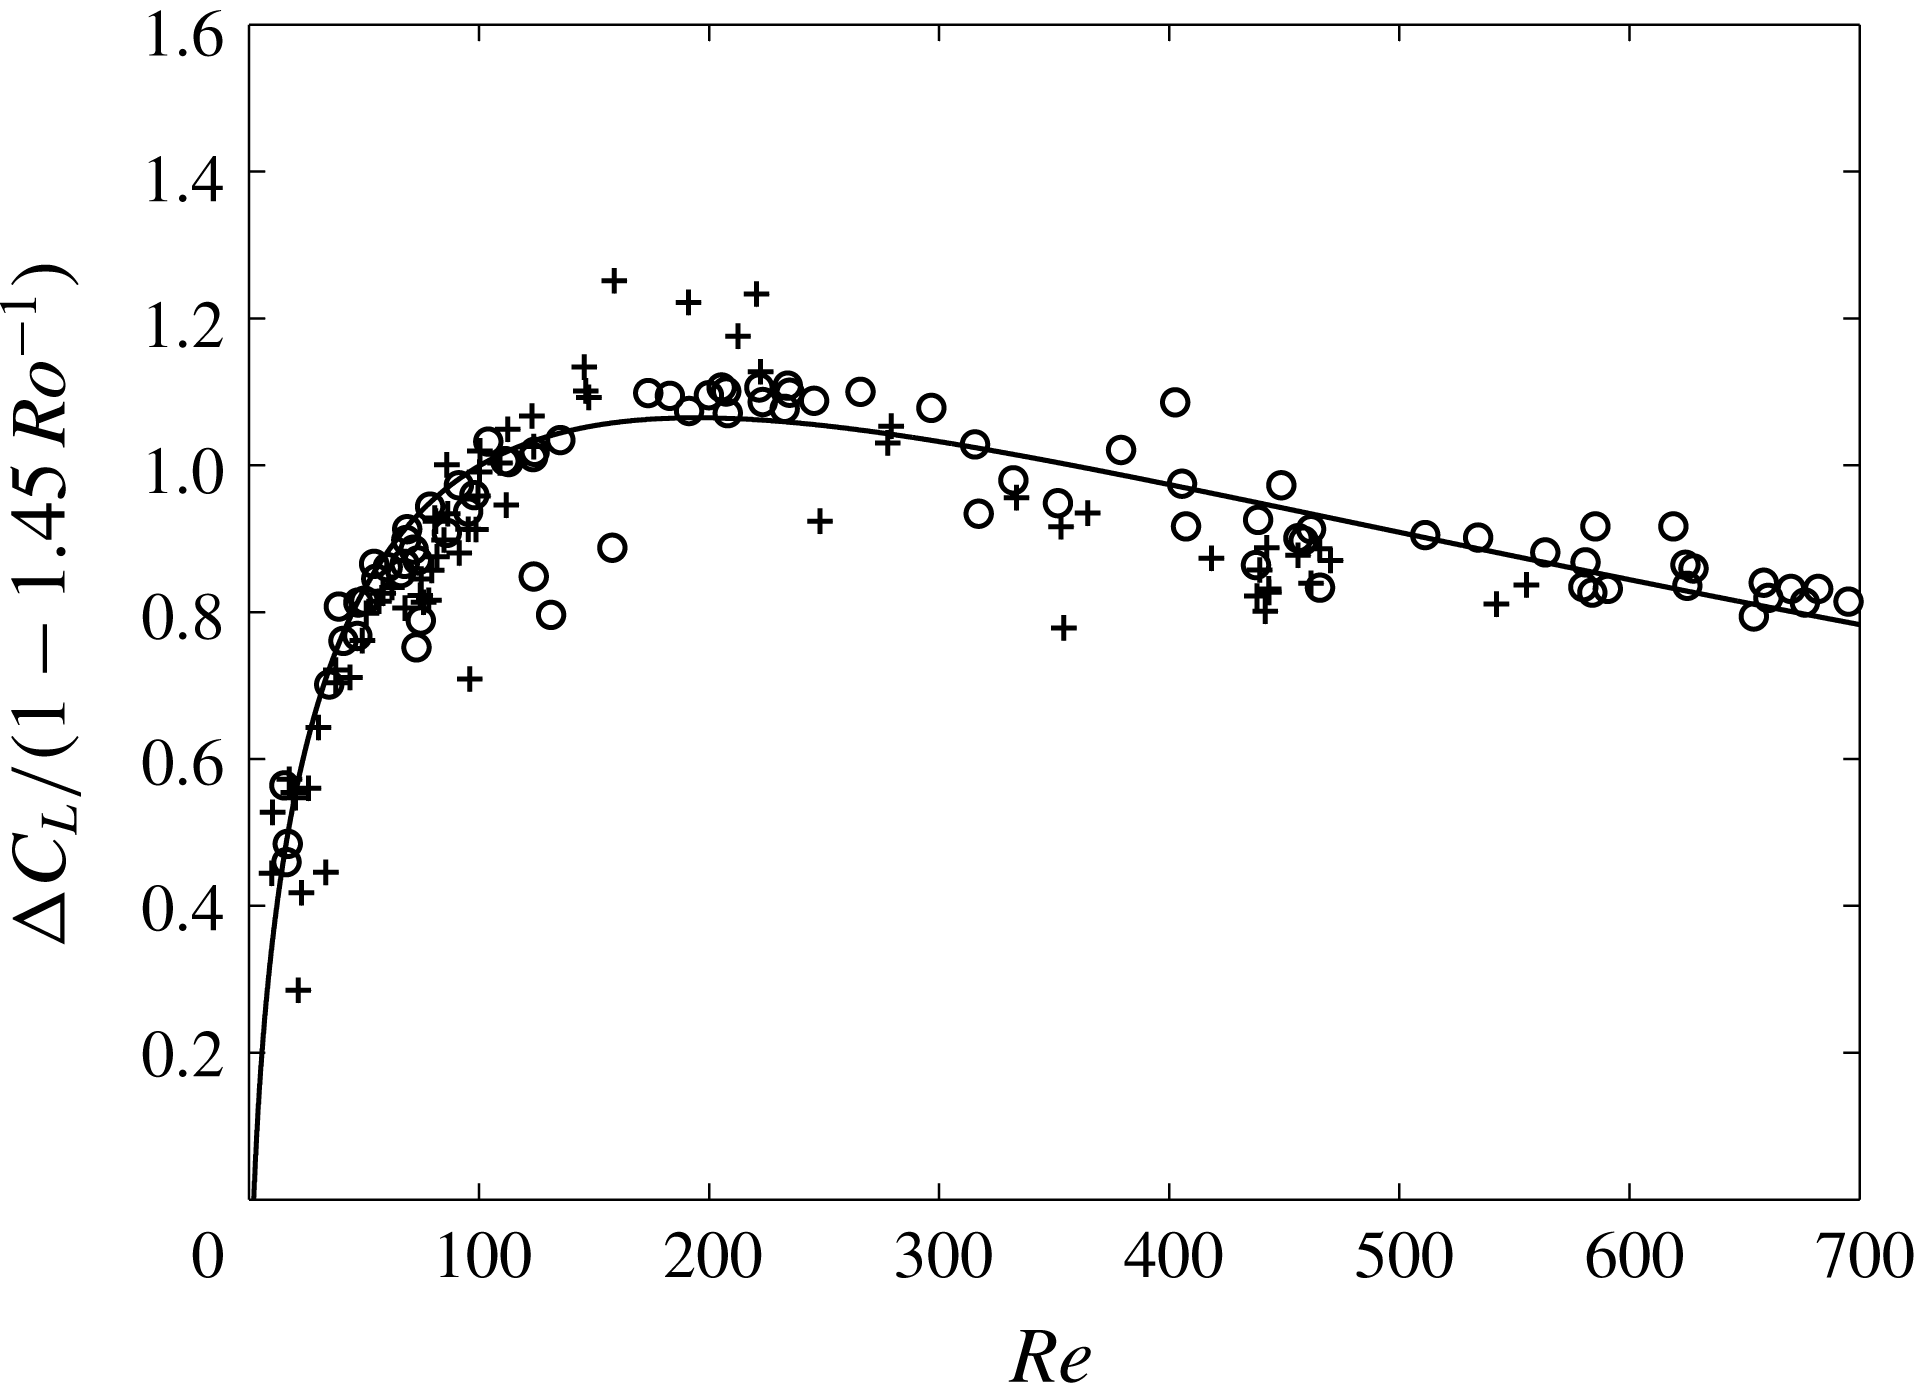
below 200. As a proof, if we normalize
 $\unicode[STIX]{x0394}C_{L}$
by
 $1{-}1.45\,Ro^{-1}$
, we find in figure 21 that the data for the various
 $Ro$
collapse rather well onto a single curve given by
 $$\begin{eqnarray}\frac{\unicode[STIX]{x0394}C_{L}}{1-1.45\,Ro^{-1}}=-0.26(1.45-Re^{1/2})\exp (-0.08\,Re^{1/2}).\end{eqnarray}$$
Lift coefficient minus Magnus-like contribution normalized by
 $Ro$
dependency versus
 $Re$
. ○:
 $6\leqslant Ro<10$
;
 $+$
:
 $Ro\geqslant 10$
; solid line, (B 7).

For the reason mentioned in § 4.1 no measurements were performed at
 $Ro$
below 6, because the bubble’s wake then disturbs the basic solid rotation flow. We have therefore no idea how (B 6) behaves at low
 $Ro$
(high
 $S$
). In the case of spheres, it was found that the normalized lift ratio stops decreasing at approximately
 $S=0.4$
and is approximately constant for larger
 $S$
. This corresponds here to
 $Ro\approx 0.25$
. Equation (B 7) is interesting because it matches the changes in the behaviour of the lift coefficients existing between
 $5\leqslant Re\leqslant 200$
and
 $Re\geqslant 274$
satisfactorily. According to Bluemink et al. (Reference Bluemink, Lohse, Prosperetti and Van Wijngaarden2010), these changes can be attributed to changes in the structure of the wake behind the sphere. This statement is based on the fact that in uniform flows the wake of a sphere becomes non-axisymmetric above
 $Re\approx 212$
and becomes unsteady for
 $Re>274$
(Johnson & Patel Reference Johnson and Patel1999). It results from (B 7) that the lift coefficient for contaminated bubbles can be reasonably well estimated by (4.9) (see figure 18).