


I. INTRODUCTION
Mechanical properties of polycrystalline materials are strongly dependent on the average grain size, as evidenced by the empirical Hall–Petch relationship.Reference Petch1 In principle, decreasing grain size is associated with an increased grain boundary (GB) density, consequently impeding dislocation movement and leading to strengthening of the material.Reference Wang, Cho, Chan, Harmer and Rickman2 Wollmershauser et al. recently showed this relation still applies for nanocrystalline materials, showing hardness increase from about 13.5 GPa for a microcrystalline magnesium aluminate to roughly 20.2 GPa for a sample with grain size 28 nm.Reference Wollmershauser, Feigelson, Gorzkowski, Elis, Goswami, Qadri, Tischler, Kub and Everett3 The results contradict reports describing a low grain size limit below which transitions to diffusion controlled strain accommodation would be expected, similarly to nanocrystalline metalsReference Meyers, Mishra and Benson4 and reported for MgO,Reference Ehre and Chaim5 and gives new breath for the development of new super-hard nanoceramics with ultrafine grains.
On the other hand, thermally activated grain growth is commonly observed in nanoceramics and can severely limit operations under high temperature environments and even moderate processing conditions. This tendency to grain coarsening is attributed to the high excess energy stored in the sample in the form of interfaces, which under conditions of high diffusivity will be eliminated to form the less energetic bulk counterpart.Reference Maglia, Tredici and Anselmi-Tamburini6 Increasing the stability of nanocrystalline ceramics has therefore a direct correlation with grain growth control, which kinetics can be expressed by the equationReference Burke7,Reference Liu and Kirchheim8 :
 $$\upsilon = {{{\rm{d}}D} \over {{\rm{d}}t}} = {M_{{\rm{gb}}}}{{{\gamma _{{\rm{gb}}}}} \over D}\quad ,$$
where υ is the velocity of GB migration, which is directly interpreted as the derivative of the grain size in time, M gb is the GB mobility, γgb the GB energy, and D is the average grain size. A potential method to retard the grain growth and to enable stable nanocrystalline materials is therefore to target a decrease in either GB energy and/or mobility.Reference Gong, Liu, Castro and van Benthem9 Dopant segregation to the grain boundaries can have pronounced effects on both parameters. That is, from a kinetic perspective, during grain growth, the boundary migration can be reduced by a segregated component. This can be physically understood by the fact that segregated atoms have a strong tendency to stay there (exothermic enthalpy of segregation), so as the boundaries move, they have to pull these dopants and will only move as fast as the slower moving dopant.Reference Gottstein and Shvindlerman10 Since the mobility of the boundary has such dependence on its structure and chemistry, Borisov et al.Reference Borisov, Golikov and Shcherbedinskii11 have proposed a semiempirical relationship between GB diffusion and its energy, a treatment utilized later to address the thermokinetics of grain growth.Reference Chen, Liu, Yang and Shen12 This suggests that Eq. (1) has two dependences on GB energy, one arising from the driving force and one due to the interdependence between GB energy and mobility. Also from a kinetic perspective, segregated solutes may have specific coordination surrounding them (cloud) at the GB, so that as GB moves, it must drag the solute cloud along. Since the cloud may extend into the lattice depending on charge and size of the dopant, its movement is controlled by lattice diffusion of solute instead of GB diffusion of solute. This has a fundamental effect on slowing down GB.Reference Rahaman13
The effect of dopants on the mobility of boundaries has been addressed in many micrometric ceramic systems, such as yttria and ceria.Reference Chen and Chen14,Reference Chen and Chen15 Due to the lack of reliable data on GB energies, this parameter is mostly ignored from those discussions which focused on the phenomenological kinetic effects of the dopants (with GB energies as constants). While someone may say this is justifiable from a thermodynamic viewpoint when dealing with large grains, small changes in GB energies can have more profound impacts at the nanoscale.Reference Castro16 From an energetic perspective, it was proposed that dopant segregation at the boundary can markedly reduce its energyReference Weissmüller17 according to:
 $${\gamma _{{\rm{gb}}}} = {\gamma _0} - {\Gamma _{{\rm{gb}}}}\Delta {H_{{\rm{seg}}}}\quad ,$$
where γgb is the GB energy of the doped phase, γ0 represents the GB energy of solvent (host material), Γgb is the solute excess in the phase boundary, and ΔH seg is the enthalpy of segregation. Therefore, material segregation would be directly related to a decrease in the boundary energy and a consequent decrease in grain growth.Reference Cahn18–Reference Millett, Selvam, Bansal and Saxena23 Because the GB energy decrease is linked to the excess of dopant, one may also conclude that as coarsening progresses in a given system, the available interfacial area decreases, what increases the concentration of dopants at the boundaries. That is, the driving force for the segregation is a function independent on the grain size but closely related to the enthalpy of mixing. If a dopant shows highly exothermic segregation enthalpy and unfavorable mixing enthalpy under the grain growth conditions, one may expect an increase in the concentration of dopants at the boundaries as the grains grow. This will cause a continuous decrease in the GB energy, which can potentially lead to a highly stable nanocrystalline material, as the excess energies from the interfaces become mostly negligible in a so-called quasi-zero-GB energy state. This state has been proposed theoretically, but clear evidence of this thesis is lacking.Reference Kirchheim24–Reference Gong, Liu and Zhang27
In this study, we report on the design of grain growth resistant nanoceramics (yttria–zirconia) by selecting a dopant prone to segregation to the boundary (lanthanum), targeting a GB energy decrease. We report for the first time using calorimetric techniques a direct evidence of the reduction GB energy due to component segregation, and demonstrate the resistance to grain growth at high temperatures (1100 °C). We present a detailed description of the phenomena and demonstrate that the GB energy is a critical designing parameter for stable nanocrystalline ceramics by showing that as coarsening occurs in doped nanosamples, the GB energy decreases as a function of grain size. We present experimental data supporting this observation and discuss the possibility of the existence of a zero-GB energy state.
II. DESIGN AND HYPOTHESES
Yttria–zirconia was chosen as the material to target grain growth control. 12 mol% of Y2O3 [12yttria stabilized zirconia (YSZ)] was used to allow full stabilization of the fluorite structure, which has wide range of applications in sensors, solid state electrolytes, and oxygen pumps.Reference Jain, Rao, Kishore and Jain28,Reference Maskell29 Note 12YSZ is obviously a doped system itself, but as it presents a single phase, a foreign dopant was designed to segregate at the grain boundaries and cause the thermodynamic effect predicted in Eq. (2). It has been reported that in this system yttrium segregates to the GB itself. Lei et al. reported that oxygen vacancies are segregated in the GB core of 10YSZ, which makes Y segregate in the GB to partially compensate oxygen vacancies.Reference Lei, Ito, Browning and Mazanec30 Y segregation was also reported for 3YSZ (densified at 1450 °C) and 8YSZ.Reference Dickey, Fan and Pennycook31 On the other hand, it has also been shown that Y segregation can be suppressed in the presence of other dopants,Reference Matsui, Ohmichi, Ohgai, Yoshida and Ikuhara32,Reference Backhaus-Ricoult, Badding, Thibault, Dogan and Kumta33 and we expect this to happen by selecting a dopant with high associated potential for segregation in YSZ.
It has been shown that the key driving forces for cation segregation arises due to elastic and electrostatic interactions of the dopant with the surrounding lattice.Reference Hwang and Chen34 Elastic interaction occurs because of size mismatch between dopant and host cations and system's effort to minimize associated elastic energy by pushing the larger (or smaller) dopant to free surfaces or boundaries. The electrostatic interaction can be explained by the space charge theory of Frenkel,Reference Hwang and Chen34 describing the surfaces, GBs, and dislocation cores in ionic crystals as having net charges and therefore having a region of space charge of opposite sign adjacent to them. The character of the space charge regions would depend on the formation free energy of defects (vacancies and interstitials), but the addition of aliovalent dopants will change the space charge, such that if the dopant addition produces a net positive (negative) effective charge inside the grain, then in thermal equilibrium it makes a net negative (positive) charge at the GB. Hence, the dopants must segregate to the region adjacent to the GB as a space charge so that the bulk of the crystal remains neutral.Reference Kang35,Reference Lee, Han, Chen, Cai and Yildiz36
In this work, we have chosen to select a dopant with similar charge as Y3+. The goal is to focus on the effect of the dopant on the GB energy instead of changes in diffusion coefficients from vacancy formation for charge balancing. Hence, most significant potential for segregation would arise from radii differences and, with that in mind, lanthanum (La3+) was selected. In further attempt to minimize diffusivity differences, we tested 10YSZ containing 2 mol% of La2O3, seeking the same molar concentration of 3+ cations as in 12YSZ. Note that while this may minimize diffusivity differences between doped and undoped conditions, this argument is not absolute, as each sample might have different defect clustering behaviors. Impedance measurements could provide insights on the defect profiles, but this is outside the scope of this work.
The summarized hypothesis question of this work then became: can La3+ stabilize nanocrystalline YSZ against coarsening on a thermodynamic basis due to GB segregation? Obtaining dense nanograined samples to test this hypothesis is not trivial. To achieve this, we used the technique known as spark plasma sintering (SPS).Reference Munir, Quach and Ohyanagi37 This method uses high heating rate associated with high pressure to allow densification with minimal grain growth.Reference Quach, Zavaliangos, Anselmi-Tambtirini, Groza and Fang38 For successful manufacturing, the initial powder must be nanosized itself. We have synthesized nanoparticles by using a reverse strike co-precipitation method that allows nanoparticles with sizes <10 nm.Reference Rufner, Anderson, van Benthem and Castro39
Measuring the effect of La3+ on the GB energy of YSZ is also a significant challenge. This is because GB energies are typically very small thermodynamic quantities, and hence attempts to measure absolute values are often frustrated due to elevated noise to signal ratio. In our work, we used the methodology developed by Quach and Castro that enables quantification of GB energies with high reliability by using a differential scanning calorimeter (DSC).Reference Castro16,Reference Quach and Castro40 In that method, grain growth is induced inside a DSC, and the heat evolved in the process is correlated with the microstructural evolution.
III. EXPERIMENTAL PROCEDURES
A. Synthesis and characterization of powder
12 mol% Y2O3 stabilized zirconia (12YSZ) and 2 mol% La2O3 doped 10YSZ (2La10YSZ) nanopowders were synthesized by reverse co-precipitation method.Reference Quach and Castro40 Zirconium (IV) oxynitrate hydrate (Aldrich, 99%), yittrium (III) nitrate hexahydrate (Alfa Aesar, 99.9%), and lanthanum (III) nitrate hexahydrate (Alfa Aesar, 99.9%) as precursors were the cationic sources. Appropriate molar ratios of ions were mixed with deionized water (D. I. water) and stirred till full dissolution to acquire a 0.3 M aqueous solution. This solution was slowly dripped into 1 M ammonium hydroxide (Fisher, 29.55%) using a tap funnel. Nanocrystalline hydroxide precipitates were immediately formed once cations reacted with base (excess ammonium hydroxide is used to guarantee simultaneous precipitation of all cations). These hydroxide precipitates were washed three times with D. I. water then once with ethanol (Fisher, denatured), followed by centrifugation and drying in a dry oven at 90 °C overnight. After drying these precipitates, chunks were grinded into fine powders and calcined in a box furnace (Lindberg blue M, Thermo scientific) at 450 °C for 2 h to get a white-colored nanocrystalline powder. A Cameca SX-100 electron microprobe was used to confirm the composition of 12YSZ and 2La10YSZ nanopowders. Nanopowder was characterized for phases and crystallite size by using x-ray diffraction, using a Bruker AXS Instrument (Bruker AXS Inc., Madison, WI, model D8 Advance; Cu Kα Radiation λ = 1.5418 Å) under 40 kV and 40 mA.
B. SPS sintering and characterization of pellets
The powder was sintered to dense pellets of 5 mm diameter and 1 mm thickness using spark plasma sintering (SPS machine, model 825S, Syntex, Tokyo, Japan) at 950 °C (measured by K-type thermocouple) for 5 min under a uniaxial pressure of 600 MPa in vacuum. A graphite die with a silicon carbide insert was used to allow high pressures, as detailed elsewhere.Reference Munir, Quach and Ohyanagi37 Pellets were polished to remove graphite contaminations from the surface and reoxidized under air flow at 700 °C for 5 h to make the pellets free of reduced zones resulting from the sintering environment. After that, pellets were characterized for relative density using Archimedes' method. The relative density of all pellets was ∼95%. Grain sizes were calculated initially from x-ray diffraction (XRD) patterns of the pellets using whole pattern profile fitting performed using the JADE 6.1 (MDI) software and double checked by transmission electron microscopy (TEM).
C. Differential scanning calorimetry
DSC experiments of reoxidized sintered pellets were carried out using a Netzsch DSC 404 (Netzsch GmbH, Selb, Germany) located inside a glovebox (Ar atmosphere) to avoid oxidation of any residual carbon. Clean and reoxidized pellets were heated for 3 thermal cycles. Each cycle consists of heating the pellets at a constant rate to 1300 °C, holding at 1300 °C for 10 min and cooling down at the same rate. GB energies of cubic 2La10YSZ and 12YSZ were calculated by exploiting the heat signal associated with grain growth obtained from DSC curve. Experimental parameters and details of GB energy calculation can be found elsewhere.Reference Quach and Castro40
For activation energy measurements, pellets were ran under 3 different heating rates (10, 20, and 30 K min−1), and the peak position determined after smoothing using average points using appropriate software. The activation energy was determined using Kissinger analysis.
D. Transmission electron microscopy
Samples for TEM examination from both compositions heated at 900 and 1300 °C were prepared using focused ion beam (FIB) method. The microstructures were examined for grain size in scanning transmission electron microscope (STEM) mode using JEOL JEM 2500SE (JEOL Ltd., Tokyo, Japan). TEM operated at 200 kV. STEM-EELS experiments were carried out to determine La segregation at GB using JEOL JEM 2100F/Cs STEM (JEOL Ltd., Tokyo, Japan) operated at 200 kV. STEM probe size was ∼1.5 Å. Spectrum imaging was recorded using a Gatan Tridiem parallel electron energy loss spectrometer (EELS). Beam damage of sample was avoided by using a cryo-holder stage which keeps the sample at about −176 °C. EELS line scan was acquired from both the GBs and bulk materials with a pixel dwell time of 0.75 s and dispersion of 0.2 eV/channel. During the spectra acquisition, drift correction offered by using DigitalMicrograph® (commercially sold by HREM Research Inc., Japan) was used to minimize drift.
E. Grain growth experiment
Grain growth study was performed by placing the pellets on a platinum coated alumina boat in a horizontal tube furnace (Lindberg/blue. M. Inc.), heating at 1100 °C, and keeping for the appropriate dwell time. Grain sizes after grain growth experiment were measured by either X-ray diffraction (XRD; model D8 Advance, Bruker AXS Inc., Madison, WI) using whole profile fitting refinement or scanning electron microscopy (SEM; FEI 430 NanoSEM instrument, FEI Company, Hillsboro, Oregon).
IV. RESULTS
Nanoparticles of 12YSZ and 2La10YSZ were synthesized by the co-precipitation method with sizes of 5.2 and 4.1 nm, respectively. XRD patterns for both powders can be found in Fig. 1S (Supplemental Material). Solely the characteristic fluorite cubic crystalline phase is detected for both compositions, with the absence of second phases. The smaller grain size for the lanthanum doped sample already suggests a thermodynamic effect of the dopant on the surface energy of the nanoparticles, as recently proposed.Reference Wu, Dey, Gong, Liu and Castro41 The nanoparticles were subjected to SPS for densification and high densities were achieved (∼95% of theoretical value). XRD patterns after densification are also presented in Fig. 1S and evidenced no phase change induced by sintering. Calculated grain sizes from XRD patterns were 22 nm for 12YSZ and 9 nm for 2La10YSZ. Note that both powders were subjected to the same SPS sintering routine, and while they achieved similar densities, the lanthanum doped sample showed considerably less grain growth, already a hint suggesting the hypothesis of inhibited grain growth by lanthanum is correct. That is, even during sintering, grain growth was hindered in the doped sample possibly as a result of segregation.
Figure 1 shows that the DSC runs on both doped and undoped YSZ nanoceramics corrected for the baseline run with a coarsened sample, as detailed elsewhere.Reference Quach and Castro40 The samples showed minimal heat evolution up to about 900 °C, when an exothermic effect is clearly measurable in both cases (small fluctuations in curves before the peaks are due to differences in the heat capacity of sample and baseline runs). The heat signals were normalized for the GB area change, such that the relative intensity and area of the peak can be directly compared. A qualitative inspection reveals a much more exothermic effect for 12YSZ as compared to 2La10YSZ. Because no parallel reactions other than grain coarsening are observed during the adopted heating profile (as confirmed by thermogravimetric runs showing no mass changes during this process and no evolved gases), the measured integral heat can be directly interpreted as the heat of grain growth. Note that in systems with accumulated stresses and multiple dislocations, the heat released cannot be singly attributed to grain growth. The fact that one is dealing with ceramics minimizes this concern, but for safety the pellets were heat treated at 700 °C for 5h prior to the DSC. The lower integral heat for the 2La10YSZ represents that either the GB energy is smaller than that of 12YSZ or that the grains did not grow at the same level for that sample, what would suggest a kinetic impediment.
DSC data: DSC results showing exothermic peak related to grain growth. Signals are normalized for GB area. Peak area represents enthalpy change during coarsening and indicates a less energetic process for 2La10YSZ as compared to 12YSZ.

The DSC peaks for both samples have onsets at roughly the same temperature, suggesting very similar activation energies for starting of grain growth, what can be a result of the similar defect molar concentration achieved by compositional design. To further explore this, three different heating rates were used in DSC runs of grain growth for 2La10YSZ and 12YSZ and the activation energies calculated using standard Kissinger method.Reference Kissinger42,Reference Chen and Spaepen43 Figure 2S shows the linear correlation of (1/T p) versus  ${\rm{ln}}\left( {{\Phi \mathord{\left{\vphantom {\Phi {\mathop {{T_{\rm{p}}}}\nolimits^2 }}} \right\kern-\nulldelimiterspace} {\mathop {{T_{\rm{p}}}}\nolimits^2 }}} \right)$, where, Φ is the scanning heating rate, T p is the peak temperature (maximum of DSC heat signal), which slope can be directly related to the activation energy. The results showed negligible differences in the activation energies: while 12YSZ had 158 kJ mol−1, the activation energy for 2La10YSZ was 154 kJ mol−1. These energies are relatively small, which is consistent with low activation energies expected for nanomaterials as compared to bulk counterparts. However, it is important to note the limitation of this technique when testing doped samples. In those cases, the GB energy is not constant during the process, and thus the derived activation energy maybe incorrect (details on the activation energy calculations and considerations about its reliability can be found in Supplemental Materials.). Therefore, these data can only suggest that the contribution of the dopant to the activation energy of grain growth is likely small.
An assessment of GB energies using the DSC results relies on the quantification of the microstructure evolution occurring in situ. Therefore, characterizations in terms of phase and grain size were carried out in samples quenched from a position immediately before and after the exothermic peak. TEM images of the samples before and after the peak for both compositions, as well as the grain size distributions, are shown in Figs. 2(a)–2(d). Noteworthy, moderate coarsening happens in both cases, and no second phase formation is observed (as pointed out by XRD and TEM), which confirms the exothermic effect can be reliably indistinguishably related to grain coarsening. Before grain growth, the average grain size for 2La10YSZ is ∼9 nm and for 12YSZ it is ∼22 nm. After the DSC experiment, average grain size became ∼162 nm for 12YSZ and ∼126 nm for 2La10YSZ. Grain size distributions did not significantly change during grain growth as shown in the figure. Note there is some porosity in both samples at the triple joints after coarsening. This can be attributed to a combination of the residual porosity being accumulated, since the samples were ∼95% dense, and the fact that during coarsening, GB volumes are being transformed into crystal volume, creating voids (a common observation in nanocrystalline materialsReference Li, Fang and Liu44,Reference Ma and Langdon45 ). The energetic contribution from residual porosity is negligible (within the error of measurements). Note that there is no gas evolving during the process as mentioned before.
STEM images: STEM images (a and c) of 12YSZ and 2La10YSZ, respectively, and associated grain size distribution (b and d) for the SPS sintered pellets heated at 900 °C (before grain growth) and 1300 °C (after grain growth). Residual porosity is observed in figure c but do not affect the enthalpy measurements.
If one assumes that the specific GB energy (J/m2) remains the same for each sample during grain growth (we will discuss this hypothesis later on), the measured integral heat is directly attributed to a change in the GB area [Δ(GBA)] byReference Gottstein and Shvindlerman10,Reference Quach and Castro40 :
 $$\Delta H = \Delta \left( {{\rm{GBA}}} \right)\cdot{\bar \gamma _{{\rm{gb}}}}\quad ,$$
where the individual GB area before and after grain growth can be calculated assuming a truncated octahedral grain and the grain size distribution byReference Gottstein and Shvindlerman10,Reference Quach and Castro40 :
 $${\rm{GBA = }}{S \over {\bar d}}{V_{\rm{m}}}{\rm{ex}}{{\rm{p}}^{\left[ { - 2.5{{\left( {\ln \,\sigma } \right)}^2}} \right]}}\quad ,$$
where V m is the molar volume,  $\bar d$ is the average grain size, and the exponential term accounts for the grain size distribution with a standard deviation ln σ, and S is a shape factor equation to 3.55 for the assumed grain geometry. Applying Eqs. (5) and (6), γgb can be calculated as 1.15 ± 0.03 J/m2 for 12YSZ and 0.54 ± 0.04 J/m2 for 2La10YSZ. The value determined for 12YSZ is very consistent with previously reported data on GB energy of YSZ from DSCReference Quach and Castro40 and oxide melt solution calorimetry.Reference Costa, Ushakov, Castro, Navrotsky and Muccillo46 The significant decrease in the GB energy (47%) after lanthanum doping is surprising but consistent with the hypothesis of segregation.
To probe GB segregation, STEM-EELS experiment was carried out on 2La10YSZ samples quenched from 900 and 1300 °C. Figure 3(a) shows EELS spectra acquired from bulk (inside the grain) and from GB of the 2La10YSZ sample before grain growth (survey image shown in Fig. 3S). The background before the La M4,5 edge was removed using the standard power-law fitting routines.Reference Egerton47Figure 3(a) shows stronger La signal (La M4 peak is at 849 eV, La M5 peak is at 832 eV) at the GB compared to La signal inside the grain/bulk which indicates La segregation at the GB during the sintering process. Note these samples were all prepared using FIB, and thickness is consistent along the sample, making qualitative assessments of chemical gradients reliable. Figure 3(b) shows EELS spectra from bulk and GB of 2La10YSZ sample after grain growth, i.e., heated at 1300 °C (survey images in Fig. 3S). La M4,5 peaks have appeared sharper in GB than grain interior similarly to the sample heated at 900 °C. Note the segregation profile was observed in other grain boundaries, and those presented here are representative data. Of course some boundaries show more segregation than others, but discussions regarding boundaries of preferential segregation are beyond the scope of this work, as we are dealing with average thermodynamic changes and no abnormal grain growth is occurring.
EELS spectra: EELS spectra at the GB and inside the grain of 2La10YSZ heated at 1300 °C (a) and of 2La10YSZ heated at 900 °C. (b) Segregation is clearly observed for the higher temperature but difficult to detect for 900 °C, due to low signal to noise ratio.
Analyzing the intensity heights of the characteristics absorption edges at the GBs for the samples treated at 900 and 1300 °C [Figs. 3(b) and 3(c)], although the absorption edge height was not quantified by using reference materials, an overall qualitative increase in La peak intensity is clearly seen after grain growth, i.e., higher La content for the 1300 °C sample. If this is true, the GB energy of 2La10YSZ during grain growth cannot be considered unique since its chemistry is evolving and Eq. (1) has to be respected. Therefore, the value of 0.54 J m−2 determined by DSC would represent rather an average value of the GB energy in the temperature range 900–1300 °C. This implies that the GB energy at 900 °C is larger than that at 1300 °C and will have important consequences in the stability of the nanograins. Note that though one may expect a higher solubility limit for lanthanum in YSZ at high temperatures, which would lead to an increase in the La signal in the bulk at 1300 °C with respect to 900 °C, the difference (if any) was within the noise, suggesting a minimal bulk solubility change.
The segregation study suggests that because the driving force for grain growth relies on the average GB energy, a significant reduction in grain growth is expected in 2La10YSZ when comparing with 12YSZ. To confirm this, we performed the grain growth study as shown in Fig. 4(a). 95% dense nanograined pellets were exposed at 1100 °C for different times and grain sizes determined measured by SEM and XRD. The graph clearly evidences the effect of lanthanum segregation in inhibiting grain growth. The 12YSZ grains achieved ∼160 nm after 48 h, with still a quite positive slope at the end of the curve, suggesting further growth is expected for longer annealing times. Meanwhile, the 2La10YSZ leveled at ∼60 nm after the same annealing time, with virtually negligible slope at this point, suggesting grain growth quasi-stopping. SEM images and grain size distributions for both compositions after annealing are presented in Figs. 4(b) and 4(c). One observes very similar grain size distributions for both samples, with 12YSZ plot shifted to larger grains. This suggests similar coarsening mechanisms, and that La3+ is basically slowing down the growth, further suggesting that the dopant affects all GBs and not provoking abnormal grains.
Grain growth data: (a) Grain growth curve showing grain sizes of 12YSZ and 2La10YSZ at different time at 1100 °C, (b) SEM image of both samples heated for 48 h and evidencing different coarsening behaviors; (c) grain size distribution for both samples annealed for 48 h.
Note the starting grain size of the 2La10YSZ is smaller than the grain size of 12YSZ, which means it has higher driving force for growth, but regardless, the 2La10YSZ showed more coarsening inhibition. The observed rapid leveling that deviates from theoretical quadratic can be attributed to residual porosity contributing to slow boundary mobility by acting as pinning agents. Since both 12YSZ and 2La10YSZ samples present this residual porosity in similar amounts and distributions, one may expect quite similar pinning effects from dragging forces in both compositions. However, while this can explain why both curves show drop in slope as function of annealing time, it cannot explain why La doped samples show smaller grain sizes and a quasi-stopping in growth.
V. DISCUSSION
A. Thermodynamics of grain growth
The reduction in GB energy for the 2La10YSZ as compared to 2YSZ suggests a much more stable nanocrystalline form for the La doped sample. However, to further understand the impacts of such energy decrease on the grain growth behavior, it is important to correctly interpret the measured reduction of 1.15 J m−2 (12YSZ) to 0.54 J m−2 (2La10YSZ) obtained by DSC. Though this represents already a surprisingly large decrease in the GB energy, by itself it can hardly be the main responsible for a thermodynamically driven behavior. As stated earlier, the measured energy represents an average of GB energy for the 900–1300 °C temperature range. While for 12YSZ the energy is not expected to be significantly changing in this range but for entropic effects, the GB energy for 2La10YSZ should scale with the grain size. That is, as the grains grow during annealing, the GB energy should decrease because of the increased interfacial enrichment as predicted by Eq. (1). The actual dependence GB energy on the grain size can be calculated by using a combination of Gibbs isothermal adsorption and mass conservation using current descriptive models, as follows.
According to the definition of Gibbs excess, Γgb in Eq. (2) can be approximately written as  ${n_2^{\rm{gb}}/A}$, where
 $n_2^{{\rm{gb}}}$ denotes the amount of solute segregated to GBs with A the total GB area. Furthermore, considering
 $n_2^{{\rm{gb}}}$ is equal to the total amount of sites available in GBs, n gb, multiplied by the mole fractions of solute in GBs,
 $x_2^{{\rm{gb}}}$, Γgb can be expressed as
 ${{x_2^{\rm{gb}}/A/A}\,\,n_{gb}}}$. Herein, the physical meaning for A/n gb is the molar area of the available sites in GBs, which is approximately equal to Ω2/3N Avg/m gb, where Ω is the average volume per site, N Avg is the Avogadro's number and m gb is the number of layers for GBs. Then, the GB excess can be further formulized as:
 $${\Gamma _{{\rm{gb}}}} \approx {{{m_{{\rm{gb}}}}x_2^{{\rm{gb}}}} \over {{\Omega ^{{2 \mathord{\left/ {\vphantom {2 3}} \right. \kern-\nulldelimiterspace} 3}}}{N_{{\rm{Avg}}}}}}\quad .$$
It was pointed out by McleanReference McLean48 that GBs consist of three layers of atom, which agree well with the experimentally determined values of GB. Hence, herein, the value of m gb is assumed to be three. As for Ω in our current system, since each unit cell of a fluorite crystal structure contains four cations (one cation corresponding to one site), a relation  $\Omega = {{\mathop {a_0 }\nolimits^3 } \mathord{\left/ {\vphantom {{\mathop {a_0 }\nolimits^3 } 4}} \right. \kern-\nulldelimiterspace} 4}$ was achieved where a 0 is the lattice constant.
By combining Eqs. (2) and (7), the GB energy is found to be dependent on the molar fraction of solute in GBs, which is thus affected by the extent of solute segregation in GBs. Langmuir–Mclean segregation equation is then used to quantitatively evaluate the segregation extent of La in the GBs in our workReference Chen, Liu, Yang, Shen and Zhao49:
 $${{x_2^{{\rm{gb}}}} \over {1 - x_2^{{\rm{gb}}}}} = {{x_2^{\rm{b}}} \over {1 - x_2^{\rm{b}}}}{\rm{exp}}\left( { - {{\Delta {H_{{\rm{seg,gb}}}}} \over {RT}}} \right)\quad ,$$
where  $x_2^{\rm{b}}$ denotes the molar fraction of solute in bulk. In addition, an equation describing amount conservation of solute is also introduced, i.e.,
 $$x_2^{{\rm{gb}}}{f_{{\rm{gb}}}} + x_2^{\rm{b}}\left( {1 - {f_{{\rm{gb}}}}} \right) = {x_2}\quad ,$$
where f gb is the molar fraction of sites in GBs, approximately equal to GB volume divided by total volume, and x 2 is the total molar fraction of solute. Under the assumption of spherical grains, f gb can be re-written as,
 $${f_{{\rm{gb}}}} = {{4\pi {{\left( {{G \mathord{\left/ {\vphantom {G 2}} \right. \kern-\nulldelimiterspace} 2}} \right)}^2}{{{\delta _{{\rm{gb}}}}} \over 2}} \over {{{4\pi } \over 3}{{\left( {{G \mathord{\left/ {\vphantom {G 2}} \right. \kern-\nulldelimiterspace} 2}} \right)}^3}}} = {{3{\delta _{{\rm{gb}}}}} \over G}\quad ,$$
herein, δgb is the GB width and G is the grain size (diameter).
After substituting Eq. (10) into Eq. (9) and then combining Eqs. (9) and (8), the molar fractions of solute in bulk and GBs are derived to be solely dependent on (i) the grain size under a given temperature, (ii) the total molar fraction of solute, and (iii) the segregation enthalpy at the GB. Once this is known, incorporating  $x_2^{{\rm{gb}}}$ into Eq. (7) and then inserting Γgb into Eq. (2), the GB energy, γgb, can be determined as a function of grain size.
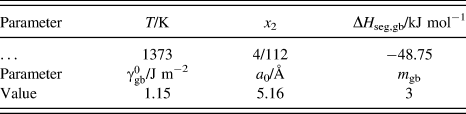
With this set of equations, one can calculate (considered the assumptions), what would be the actual GB energy during coarsening as the boundaries have higher accumulation of La. To do that, experimental values were used in the model calculation were tabulated as shown in Table I. Herein,  $\gamma _{{\rm{gb}}}^0$ is the GB energy for 10YSZ determined by the DSC experiment and a 0 was obtained by XRD (note 10YSZ was used as the dopant will be incremental to the composition).Reference Quach and Castro40 ΔH seg,gb was determined by simply using least-squares method to find the optimum value by combining equations with the total heat measured during the grain growth experiment.
Values of parameters used in the current model calculation.
The estimated GB energy evolution as a function of grain size is shown in Fig. 5. The results show that at the beginning of grain growth in Fig. 4, the GB energy would be about ∼0.83 J m−2, which is already reduced when compared with the GB energy of 12YSZ as a result of La segregation. This shows that while the concentration of La3+ at the GB is small, consistently with the EELS/TEM observation, it already affects the energetics at that point. A systematic decrease of GB energy is predicted and related to the enhanced La3+ concentration by the decrease of GB area. When the grain size reaches 60 nm (final grain size in Fig. 4), the GB energy is calculated to be 0.05 J m−2, a quasi-zero GB energy state. At this point, the driving force for grain growth would be at its minimum as the excess energy in the system is very small and would suggest that the stop of grain growth for 2La10YSZ could be dominated by the thermodynamic factor. Note the average energy in the size range is still 0.54 J m−2 (shown in the graph as the red bar to include error) consistently with the measurement by DSC considering the assumptions of the model.
GB energy as a function of grain size: Evolution of GB energy with grain size for 2La10YSZ at 1100 °C showing the energy significantly decreases and reaches a zero-GB energy state. Red and blue bars indicate the average GB energy directly assessed by DSC for a 2La10YSZ sample starting with 9 nm and one starting with 38 nm, respectively.
To evaluate the prediction of quasi-zero GB energy, we have used the same DSC technique to measure the GB energy of a 2La10YSZ sample with a larger starting grain size than the previously tested one. That is, if the GB energy changes with grain size as predicted, the measured energy for a sample starting at a larger grain sizes should be systematically smaller. Because we are assessing by DSC, it will still be an average value but a smaller one. The test was performed in a nanograined sample with starting grain size 40.9 nm (from SEM, 38.2 nm from XRD), in contrast to 9 (9.2) nm tested initially. The procedure for measuring the GBE was quite the same as that adopted for the smaller grained sample with the only difference being that the grain size was studied by SEM (relevant data for this analysis are available as Supplemental Information). The result is presented within Fig. 5 and shows a significant decrease as compared to the 9.2 nm grain size sample. The energy was measured as 0.36 ± 0.02 J m−2, demonstrating that the energy is indeed decreasing as grain size increases as a result of La enrichment at the boundaries. This decrease is certainly affecting the driving force for growth that tends to decrease as grain sizes get larger, as predicted in Fig. 5. While it would be interesting to test an even larger grain size to see if there is further decrease in energy, the values for large grain sizes become more and more unreliable as the associated energy is very small, as the noise-to-signal ratio in DSC is increased. Moreover, only two grain sizes were tested here because this is an extremely complex and time consuming experiment.
It has been reported that the GB energy is expected to decrease upon grain growth even in dopant free system, which is attributed to the higher instability of high-energy boundaries which means they are more likely to disappear at earlier stages of coarsening.Reference Rohrer50 While this is likely also happening in our system, there is clear enrichment of boundaries by La during grain growth, as demonstrated by EELS/STEM, and this seems to be responsible for a further decrease in the energy in addition to the above mentioned process.
B. Kinetics of grain growth
The prediction of quasi-zero GB energy at about 60 nm is however quite unrealistic even considering our own growth experiments and DSC runs. If that was true, the samples would have completely stopped growing when getting to that size (zero slope of growth in Fig. 4). This is not observed in Fig. 4 and also, for example, in the DSC runs, where larger grain sizes are clearly observed after the coarsening peak [Figs. 2(c) and 2(d)]. This erroneous size estimation can be attributed to limitations of the calculation methods that assume, for instance, a negligible and temperature independent solubility of La in the YSZ crystal. If solubility increases at higher temperatures, the actual amount of La at the boundaries decreases, increasing the GB energy.
Other factor limiting this high enrichment of the boundary is the formation of second phases. As the GBs get high concentrations of La, formation of second phases become energetically favorable, and this will limit the maximum decrease of GB energy one can achieve. We have tested coarsening at 1100 °C for one week, and noticed the formation of a small fraction of La2O3, which is consistent with this hypothesis. However, the second phase is never observed after the DSC runs, even though the grains are much larger than 60 nm. Therefore, we expect that there is indeed an increase in solubility affecting the actual concentration of La at the boundary.
Though this work presents strong evidences that La is indeed decreasing the driving force for growth, not necessarily bringing it to zero, it is naive to neglect well known effects of dopants in pinning growth from a kinetic perspective. It is actually very difficult without a solid model to separate both thermodynamic and kinetic contributions to grain growth. From a kinetic perspective, we can expect that: (i) due to the formation of space charge layers, it is likely that La ions will have a cloud of defects surrounding it that must be moved to enable mobility. This cloud extends to the bulk phase, and this may change the overall diffusion coefficient as now mass has to flow inside the grain as well. Since bulk diffusion is typically slower than GB diffusion, less grain growth occurs.Reference Rahaman13 (ii) Residual porosity can also cause further pinning of movement for the boundaries, in particular when trapped at triple junctions, as we have observed in the micrographs to exist. In our experiments, 12YSZ had observable porosities, which would responsible for the significant leveling of growth observed in Fig. 4 happening despite the absence of La. 2La10YSZ should also have this effect on top of the dopant segregation related ones. Moreover, the mobility of the pores is also affected by the La dopant, so, similarly to point (i), it is impossible to separate the contributions from porosity from the pure GB energy effect on coarsening. We suggest future works to be performed with 100% dense nanocrystalline samples (which are unfortunately extremely difficult to be obtained). (iii) The mobility of La within YSZ is expected to be very low.Reference Taimatsul, Wada, Kaneko and Yamamura51 Since the boundaries migration depends on La to maintain stoichiometry, one can expect slower growth kinetics. (iv) According to Borisov et al.,Reference Borisov, Golikov and Shcherbedinskii11 the decrease in energy of the boundary should also be related to an increase in activation energy for hoping. This is related to the fact that lower GB energy means stronger chemical bonds. As reported by Budan et al., stronger bonds will cause lower ionic mobility at the boundaries. Unfortunately our data on activation energy did not demonstrate that, but this can be attributed to a limitation of the adopted method. Future work to determine mobility activation energy will be performed to further attempt to quantitatively distinguish between thermo and kinetic effects.
VI. CONCLUSION
In summary, we have proposed a successful designing strategy to enable grain growth resistant nanoceramics. We used the scientific and technologically relevant YSZ system to test the hypothesis, but there is no reason to believe the method cannot be applied to other ceramics. The methodology is based on theoretical framework that shows that elements with high segregation to GBs can decrease their energies, significantly lowering the GB energy state that minimizes driving forces for growth and slows boundary mobility by drag forces. For YSZ, La3+ was selected as dopant and showed massive segregation to GBs as demonstrated by STEM/EELS, evident GB energy reduction as proven by a sophisticated DSC approach, and inhibited grain growth at 1100 °C, maintaining the grain sizes below 60 nm even after 48 h in the furnace. This behavior is expected to allow processing of nanocrystalline YSZ and enable usage of nanofeatures at high temperatures. The average GB energy was measured for the doped sample as 0.54 J m−2, as compared to 1.15 J m−2 for the undoped YSZ, but as coarsening progresses, the energy decreases while still in the nanoscale range, resulting in a thermodynamically metastable nanograined sample. Though not thoroughly addressed in this study, one should note that the quasi-zero energy design is expected to find a limitation when the GB so enriched by the dopant such that a second phase nucleates. This leads to precipitate that will also affect grain growth, but from a very different perspective as drag force from the second phase becomes preponderant. We have also shown that the state is also strongly dependent on temperature, such that under the conditions of high mobility, even the small energies of the boundaries are enough to cause coarsening. Other strategies (or other dopants) should be used for higher temperature applications.
Supplementary Material
To view supplementary material for this article, please visit http://dx.doi.org/jmr.2015.269.
Derivations and equations descriptions for activation energy, grain boundary energy evolution and detailed experimental results for 40nm LaYSZ grain boundary energy measurements are reported. This material is available free of charge via the Internet at http://pubs.acs.org.
ACKNOWLEDGMENT
Research supported by the U.S. Department of Energy (DOE), Office of Science, Basic Energy Sciences (BES), under Award # ER46795, Early Career Program Award (spark plasma sintering, S.D., R.C.); National Science Foundation (NSF) under Award # DMR Ceramics 1055504, CAREER Award (calorimetry and grain growth, C-H.C., R.C.); University of California LabFee Program under Award # 12-LF-239032 (microscopy, S.D.). F.L. and M.G. are grateful to the Natural Science Foundation of China (# 51134011 and 51431008), and China National Funds for Distinguished Young Scientists (# 51125002). Dat Quach is greatly acknowledged for fruitful discussions.



