Introduction
The Kessler Psychological Distress Scale measures psychological distress experienced in the previous 30 days. The scale has two versions: one of ten items and one of six items, commonly referred to as the K10 and the K6 respectively (Kessler et al., Reference Kessler2002). Since their initial development, both scales have been widely implemented in epidemiologic surveys and clinical settings. Indeed, epidemiological studies have demonstrated that the K10 and K6 are strongly related to DSM-IV mood and anxiety disorders (Andrews and Slade, Reference Andrews and Slade2001; Furukawa et al., Reference Furukawa, Kessler, Slade and Andrews2003; Kessler et al., Reference Kessler2010a; Slade et al., Reference Slade, Grove and Burgess2011; Sunderland et al., in press). The Kessler scale's screening ability, coupled with its brevity, make it an attractive tool for facilitating comparisons between the psychopathology that is associated with various sociodemographic groups. Such comparisons have substantial heuristic value in that these analyses could reveal group- and/or setting-specific determinants of mental illness that may warrant further research or treatment.
When examining the distribution of psychopathology as a function of age, epidemiological data have consistently indicated that aging is associated with decreases in prevalence of DSM-IV mood and anxiety disorders (Troller et al., Reference Trollor, Sachdev, Anderson, Andrews and Brodaty2007; Kessler et al., Reference Kessler, Birnbaum, Bromet, Hwang, Sampson and Shahly2010b), and this pattern of results has been replicated using the K6/K10 (Slade et al., Reference Slade, Grove and Burgess2011). Skeptics of the finding that the prevalence of syndromal psychopathology decreases across the lifespan have argued that this pattern goes against what practitioners frequently observe in old age settings (Snowdon, Reference Snowdon2001). In contrast, proponents of this finding have argued that a decrease in emotional responsiveness, an increase in emotional control, and an increase in coping skills associated with increasing age contributes to the finding of lower psychopathology (Ernst and Angst, Reference Ernst and Angst1995; Henderson et al., Reference Henderson, Jorm, Korten, Jacomb, Christensen and Rodgers1998; Jorm, Reference Jorm2000).
An empirically robust way of informing the broad debate regarding whether the observed decline in prevalence of psychopathology in old age is a legitimate trend or whether the downward trend in prevalence is artifactually influenced by some form of bias, involves the formal identification of measurement invariance. Essentially, measurement invariance confirms that the likelihood of endorsing a questionnaire item is related solely to the respondent's clinical presentation rather than some other aspect of the individual such as their age or sex. During the development of the K6/K10 measures, detailed item analyses were performed to select questionnaire items that were invariant across age and sex (Kessler et al., Reference Kessler2002). Since this initial item selection phase of developing the K6/K10, few studies have specifically investigated the measurement invariance of the K6/K10 across the lifespan. The most robust findings occur once a measure has been in circulation for some time and a large body of data exists across a variety of subpopulations.
Despite scant data with respect to the measurement invariance of the K6/K10, there has been recent speculation that some methods of assessing internalizing disorder in old age respondents are biased. For example, Grayson et al. (Reference Grayson, Mackinnon, Jorm, Creasey and Broe2000) and Tsang et al. (Reference Tsang2008) have suggested items related to fatigue are problematic when assessing older individuals because of the association between fatigue and chronic physical conditions that becomes more prevalent with increased age. Likewise, measures of worthlessness may be associated with a decline or change in social roles and/or social relationships as well as a decline in overall physical and cognitive functioning, both of which have demonstrated a strong relationship in old age (Vink et al., Reference Vink, Aartsen and Schoevers2008; Hong et al., Reference Hong, Hasche and Bowland2009). Although, these studies did not focus on the potential biases of the K6/K10 specifically, the K6/K10 measures contain similar items to those in question. Consequently, assumptions about the applicability of the K6/K10 in old age or psychogeriatric settings and the measures’ suitability for age-banded comparisons in epidemiological studies may be premature.
One approach that can be used to examine the presence of bias in questionnaire items is known as the identification of Differential Item Functioning (DIF) using procedures grounded in the field of Item Response Theory (IRT). The field of IRT is too large to describe here adequately; however, a brief description is provided and the interested reader is encouraged to gain a greater understanding from the references provided. Briefly, IRT includes a series of models that can be fitted to individual data as a means of describing the probability of responding to a particular questionnaire or scale item in relation to a normally distributed latent dimension under examination (van den Linden and Hambleton, Reference van den Linden and Hambleton1997; Embretson and Reise, Reference Embretson and Reise2000; Baker, Reference Baker2001). For example, IRT assumes that certain questionnaires or scales, such as the K6/K10, are designed to indirectly measure a latent dimension of interest – in this case, psychological distress. Each item of the K6/K10 may index a different area along the normal distribution of the latent dimension; modeling this relationship using IRT therefore enables a further understanding of an individual's latent level of psychological distress based on the specific items that they endorse and vice versa. One model, known as the graded response model (Samejima, Reference Samejima1969; Cohen et al., Reference Cohen, Kim and Baker1993), is particularly suitable for the investigation of ordinal items, such as those in the K6/K10 scales, since it models the relationship between different response options from each item with the normally distributed latent dimension.
The finding of DIF using IRT models implies that the probability of responding to a certain item cannot be solely attributed to the latent dimension but instead may be influenced by an additional feature related to group membership, e.g. gender, age, ethnicity, etc. This is achieved by first defining two groups based on a characteristic of interest and then equating the scale of the latent dimension using common invariant items (known as anchor items). Once all individuals from each group are placed on a common scale, the IRT models are fitted separately to each group and the item characteristics of each questionnaire item are compared (Teresi and Fleishman, Reference Teresi and Fleishman2007). If there are no differences between the item characteristics of the two groups then it can be concluded that the relationship between the item and the latent dimension is the same for all individuals regardless of group membership. On the other hand, if there are significant differences between the item characteristics then it can be concluded that an additional feature related to group membership is influencing the endorsement of the item over and above the latent dimension. Therefore, the identification of DIF implies that a certain group of individuals may be biased towards responding to the items in a certain manner when compared to individuals belonging to the other group. Consequently, the aim of this study is to assess potential age-related bias(es) in the assessment of psychological distress, as measured by the Kessler scales, by investigating the possible presence of DIF in each item between individuals belonging to young, middle-aged, and old-age groups of the Australian general population.
Methods
Sample
The data for the current study were from the 2007 Australian National Survey of Mental Health and Wellbeing (NSMHWB), a cross-sectional household survey of the Australian general population (excluding very remote areas). Private households were randomly selected in each state and territory using a stratified, multistage area design. In total, 8,841 households participated in the survey (a response rate of 60%). Over-sampling (a greater probability of being selected for the interview) of young (16–24 years) and old (65–85 years) age groups ensured that a sufficient sample size was selected to provide reliable estimates for these age groups.
Measures
The Composite International Diagnostic Interview (CIDI) 3.0 was used as the base instrument to derive psychiatric diagnoses in the 2007 NSMHWB. The CIDI 3.0 provided prevalence estimates across the person's lifetime based on DSM-IV diagnostic criteria. Prevalence in the past 30 days was estimated by determining if symptoms relating to a lifetime diagnosis were experienced in the 30 days prior to the interview. The diagnoses assessed by the CIDI 3.0 in the Australian survey included: depression, dysthymia, bipolar disorder (manic episode), agoraphobia, social phobia, panic disorder, generalized anxiety disorder (GAD), obsessive-compulsive disorder (OCD), post-traumatic stress disorder (PTSD), substance use, and substance dependence. Furthermore, the survey collected information on sociodemographics and physical functioning/activity limitation as assessed by the World Health Organization Disability Assessment Scale 2.0 (WHODAS 2.0).
Non-specific psychological distress was measured by the Kessler Psychological Distress Scale (Kessler et al., Reference Kessler2002). The current study examined the K6 rather than the K10, as the latter version did not meet the local independence assumption required by IRT. Local independence means that each item is independently related to the latent factor and the response to one item is not directly influenced by a response from another item. The K10 contains skip instructions meaning that some items are skipped depending on the responses to preceding questions, therefore creating a violation of the local independence assumption. The K6 was used as an alternative since it contains items that exhibit local independence. The K6 has strong psychometric properties and is a valid substitute for the K10 when predicting DSM-IV diagnostic cases and serious mental illness (Furukawa et al., Reference Furukawa, Kessler, Slade and Andrews2003; Kessler et al., Reference Kessler2010a; Sunderland et al., in press). Due to its desirable psychometric properties and brevity, the K6 has been utilized in numerous population-based epidemiological studies around the world as part of the World Mental Health Survey initiative to measure and monitor trends in psychological distress (Kessler and Ustun, Reference Kessler and Ustun2008). Likewise, the K6 has been routinely used in numerous Australian states and territories to measure distress and monitor treatment outcomes. The K6 includes items that measure the presence of nervousness, hopelessness, irritability, negative affect, fatigue, and worthlessness experienced over the past 30 days. Items are rated on a five-point scale, with 0 indicating an absence of the symptom and 4 indicating that the symptom was present all of the time in the past 30 days. As a result, the final score on the K6 can range from 0 to 24, with higher scores indicating higher levels of psychological distress.
Data analysis
Sample characteristics
The invariance of the K6 was examined across three age groups: young adulthood (16–34 years), middle age (35–64 years) and old age (65–85 years). The decision regarding the cut-points for the age groups is rather arbitrary but was informed by epidemiological studies that traditionally define old age as 65+ years. The young group (<65 years) was further defined to investigate any significant differences between those that could be considered young and those that could be considered middle aged. Frequencies and standard errors for sociodemographic characteristics as well as clinical characteristics were calculated for each age group. Diagnosis groups were categorized as any affective disorder (depression, dysthymia, bipolar disorder), any anxiety disorder (agoraphobia, social phobia, panic disorder, GAD, OCD, PTSD), and finally any mental disorder (affective, anxiety, substance use, and substance dependence). K6 mean scores and standard errors were calculated for each age group in the total population.
Age groups were compared on sociodemographic and clinical characteristics using χ2 analysis whereas functional limitation (measured by WHODAS 2.0 scores) and the K6 mean scores were compared using Poisson regression where K6 scores and WHODAS 2.0 scores formed the dependent variable and age group the independent variable. Frequencies and means were weighted for the sex and age distribution of the Australian general population and standard errors were adjusted to account for the complex survey design using the balanced repeated replication technique (Wolter, Reference Wolter2007). All descriptive analyses were conducted using the SUDAAN software package.
Dimensionality
The type of IRT model used in this study requires that the K6 is unidimensional (i.e. the total variance between K6 items can be explained by one underlying latent dimension). Previous studies have demonstrated that the Kessler scales possess a single factor structure of non-specific psychological distress (Kessler et al., Reference Kessler2002; Fassaert et al., Reference Fassaert2009). To further test this assumption, the pairwise polychoric correlations between K6 items were estimated and submitted to single factor confirmatory factor analysis (CFA) using a robust weighted least squares mean and variance adjusted (WLSMV) method of estimation (Muthén and Muthén, Reference Muthén and Muthén2010). Separate CFAs were conducted using the total sample and for each age group under investigation.
The fit of each CFA was based on several statistical indices. The Comparative Fit Index (CFI), the Tucker–Lewis Index (TLI), and the root mean square error of approximation (RMSEA) provide a complementary perspective of model fit. Current recommendations suggest that TLI and CFI values ≥0.90 and values ≥0.95 indicate acceptable and very good fit, respectively (Hu and Bentler, Reference Hu and Bentler1998). RMSEA values less than 0.05 indicate close model fit, values up to 0.08 indicate reasonable model fit, and values exceeding 0.10 indicate poor fit (Browne and Cudeck, Reference Browne, Cudeck, Bollen and Long1993).
Differential item functioning
The graded response model was used to model the probability of endorsing each response option (none of the time, a little of the time, some of the time, most of the time, all of the time) on each K6 item according to the latent level of psychological distress, which in this instance is measured as a normally distributed latent variable. As mentioned previously, the IRT model accounts for the relationship between individual distress levels on the latent dimension and the probability of endorsing a particular item response. This relationship can be described in IRT through the use of several item parameters, known as the discrimination or a-parameter and the difficulty or b-parameters. The a-parameter describes the relationship between the item and the latent dimension, for example the larger the value of the a-parameter the stronger the item discriminates between individuals along a specific point on the latent dimension. The b-parameters describe the location on the latent dimension where examinees have a 50% probability of endorsing a particular response option (Embretson and Reise, Reference Embretson and Reise2000). In the graded response model, each item can be described using one a-parameter and several b-parameters; the number of b-parameters is determined by one minus the total number of response options – in this case four.
The Item Response Theory Loglikelihood Ratio test for Differential Item Functioning (IRTLR-DIF) procedure was utilized to test for significant DIF in the a- and b-parameters of each of the K6 items and is described in further detail by Teresi et al., (Reference Teresi2007). By testing for DIF in the a- and b-parameters separately, the analysis could examine whether the degree of latent psychological distress was associated with respondents’ endorsement of each of the items differently as a function of age (e.g. a-DIF) and whether age influenced the ability of the K6 items to distinguish between continuous degrees of psychological distress (e.g. b-DIF).
As mentioned previously, to examine whether the a- or b-parameters exhibited DIF across age groups, a set of invariant items, or an “anchor” set, is required to equate the separate age groups to a common latent scale. Several selection methods have been developed to “purify” items to assist with the selection of an appropriate anchor set when there is no theoretical basis for the choice of items (Woods, Reference Woods2009). A simulation study found that the identification of a pure anchor set (i.e. items that clearly do not exhibit DIF between the examined group) prior to DIF detection significantly improved the accuracy rate and reduced false positive results, particularly in IRT-based methods of DIF detection (Navas-Ara and Gomez-Benito, Reference Navas-Ara and Gomez-Benito2002).
This study used an iterative procedure recommended by Kim and Cohen (Reference Kim and Cohen1995) to identify an appropriate anchor set. First, all K6 items were tested for DIF using IRTLR-DIF software (Thissen, Reference Thissen2001). At this stage no specific anchor set is specified and therefore each item was tested using the remaining items as a temporary anchor set. For each item the likelihood-ratio test statistic (G 2 change), which compares a model with the parameter estimates constrained to be equal between the two examined groups with a model that frees the parameters to be estimated separately between the two groups, was produced. The item with the largest likelihood-ratio statistic, indicating the largest level of DIF, was removed from the analysis and the remaining items were re-examined. The procedure continued in this manner until items no longer displayed significant DIF at the 0.05 significance level. These items were selected as the anchor set to equate the two groups on a common latent scale. The α level of 0.05 was chosen at this stage, regardless of multiple comparisons, to protect against the possibility of type II error and therefore ensuring a conservative selection of anchor items.
Once the anchor set was selected, the IRTLR-DIF procedure was again used for the final test for significant DIF in the remaining items. The log-likelihood ratio test statistic was again used as an omnibus test for significant DIF measured simultaneously in the a- and b-parameters of the graded item response model. Assuming a theoretical probability that DIF may be located in one parameter, the statistical significance of the omnibus test statistic was calculated using 1 degree of freedom as suggested by Thissen (Reference Thissen2001). If the omnibus test was significant, follow-up tests were then conducted on the individual parameters to identify if the DIF was present in the a-parameter or b-parameters, or both. It was at this stage that the Benjamini-Hochberg method was used to adjust the critical p-value for multiple comparisons to reduce the possibility of type I error (Benjamini and Hochberg, Reference Benjamini and Hochberg1995; Thissen et al., Reference Thissen, Steinberg and Kuang2002). The final IRT parameters were estimated using the MULTILOG 7.03 software package.
In practice, it is possible for significant levels of DIF to be identified by the IRTLR-DIF procedure but the magnitude of the DIF may have a negligible effect on the overall performance of the scale. Graphs of the total expected score functions for each age group comparison were produced to examine the magnitude of DIF and the impact on the overall expected scale scores. These graphs were calculated by summing each of the individual items’ expected score function for the K6 and graphing that as a function of the latent dimension. Briefly, these graphs represent the level of latent psychological distress (x-axis) required to generate an expected total score on the K6 scale (y-axis) for each age group. In addition, a method for quantifying the difference between the expected score functions for each item is known as the non-compensatory DIF (NCDIF) index. This index is calculated by averaging the squared difference in expected scale score for each item between members of the focal group and members of the reference group along the actual distribution of the latent trait (Raju et al., Reference Raju, van der Linden and Fleer1995). Cut-off values based on simulation studies indicate that NCDIF scores greater than 0.096 indicate that the DIF is of a sufficient magnitude to have a substantial impact on the expected scale score (Teresi et al., Reference Teresi2007).
Results
Sample characteristics
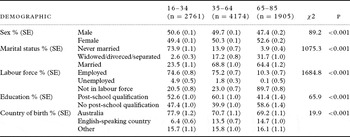
Only respondents with complete data for the K6 were included in the current study. The total sample size was 8,840 as one respondent had one or more missing values on the K6 items. The total sample included 2,761 respondents aged between 16 and 34, 4,174 respondents aged between 35 and 64, and 1,905 respondents aged between 65 and 85. Sociodemographic characteristics of each age groups are presented in Table 1. The results revealed significant differences between the three age groups with respect to all sociodemographic characteristics. On average, the old age group had a slightly higher percentage of female, widowed/separated/divorced, not in the labor force, and lower educated individuals in comparison to the younger age groups.
Sample characteristics of young, middle-aged, and old age respondents in the 2007 Australian National Survey of Mental Health and Well-being

Clinical characteristics
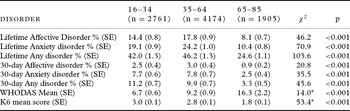
The percentages and standard errors of respondents with any affective, any anxiety, and any mental health disorder across the lifespan and in the 30 days priors to interview for each age group are presented in Table 2. χ2 analyses revealed that old age respondents are less likely to have a diagnosis of any affective, any anxiety, and any mental health disorder over their lifetime and in the past 30 days. Indeed, the lifetime prevalence of any mental health disorder in old age respondents was approximately half that of both the younger age groups. Functional limitation, however, is significantly higher in the old age group in comparison to both younger age groups as measured by the WHODAS 2.0. Finally, K6 mean scores were significantly lower for the old age group in comparison to both younger age groups.
Clinical characteristics of young, middle aged, and old age respondents in the 2007 Australian National Survey of Mental Health and Well-being

WHODAS = World Health Organization Disability Assessment Schedule
“Any disorder” is classified as any affective, anxiety, and substance use disorder measured in the 2007 Australian survey
* Significance generated using Wald F statistic with Poisson regression
K6 item analysis
Dimensionality
One factor CFA of polychoric correlations in the total sample and separately for each age group indicate that a one factor model satisfactorily fit the K6 data as evidenced by the fit indices. CFI, TLI and RMSEA statistics indicated good model fit according to our a priori cut- points in the total sample with values of 0.99, 0.98 and 0.06, respectively. Likewise, CFA conducted separately for each age group indicates that a one factor model provides reasonably good fit in the young (CFI = 0.99, TLI = 0.98, RMSEA = 0.07), middle aged (CFI = 0.99, TLI = 0.99, RMSEA = 0.05), and old aged (CFI = 0.99, TLI = 0.98, RMSEA = 0.05). The individual standardized factor loadings for all the models were significantly high (≥ 0.6). These results support the assumption of unidimensionality required for the IRT analysis.
Differential item functioning
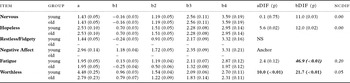
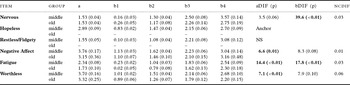
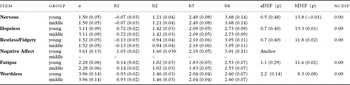
The results of the DIF analyses and the a- and b-parameters comparing the young with the old, the middle aged with the old, and the young with the middle aged are presented in Tables 3, 4 and 5, respectively. The item addressing negative affect was identified as a suitable anchor item comparing young with old and young with middle aged whilst the item addressing hopelessness was identified as a suitable anchor comparing middle aged with old age. No other items were found to be suitable for the anchor set. After Benjamini-Hochberg adjustments, there were no significant levels of DIF identified in the items between young and middle-aged respondents. There were two items – worthlessness and fatigue – that displayed significant levels of DIF between young and old respondents and middle-aged and old respondents. Additionally, the item addressing negative affect displayed significant levels of a-DIF whilst the item addressing nervousness displayed significant levels of b-DIF between middle-aged and old respondents.
IRT parameters (SE) and differential item functioning of the K6 between young and old age respondents in the 2007 Australian National Survey of Mental Health and Well-being

a, b1, b2, b3, and b4 represent the a-parameter and b-parameters for each item estimated by the graded response model.
aDIF and bDIF represent the change in G 2 statistics between constrained and less constrained models.
Bold indicates significance after Benjamini-Hochberg adjustments. Italics indicates that the magnitude meets the required cut-off point.
IRT parameters (SE) and differential item functioning of the K6 between middle age and old age respondents in the 2007 Australian National Survey of Mental Health and Well-being

a, b1, b2, b3, and b4 represent the a-parameter and b-parameters for each item estimated by the graded response model.
aDIF and bDIF represents the change in G 2 statistics between constrained and less constrained models.
Bold indicates significance after Benjamini-Hochberg adjustments.
IRT parameters (SE) and differential item functioning of the K6 between young and middle aged respondents in the 2007 Australian National Survey of Mental Health and Well-being

a, b1, b2, b3, and b4 represent the a-parameter and b-parameters for each item estimated by the graded response model.
aDIF and bDIF represents the change in G 2 statistics between constrained and less constrained models.
Bold indicates significance after Benjamini-Hochberg adjustments.
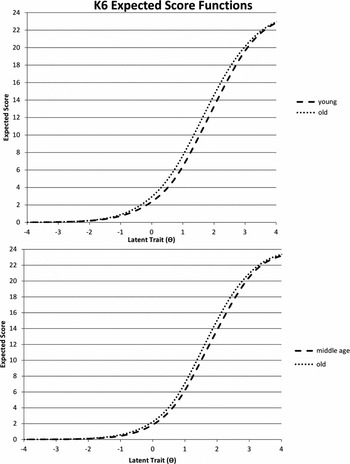
Inspection of the total expected score functions between young and old respondents and middle-aged and old respondents, as shown in Figure 1, reveals that old age respondents tend to receive slightly higher K6 scores when both groups are matched in terms of their underlying psychological distress level. Although, the magnitude of the DIF is relatively low, as evidenced by individual item NCDIF values below the a priori cut-point. The one item with the greatest magnitude of DIF (NCDIF = 0.20), and above our a priori cut-point of 0.09, was found in the item addressing fatigue between old and young respondents. This indicates that old respondents are more likely to endorse higher response options in the fatigue item in comparison to young respondents even though both groups are matched in terms of their underlying psychological distress level.
Expected score functions for K6 in young vs. old and middle aged vs. old.

Discussion
The series of IRT likelihood ratio tests of differential item functioning comparing old, middle-aged and young respondents revealed that not all K6 items are invariant across age. Although worthlessness, nervousness, fatigue and negative affect items were found to be non-invariant, an assessment of their magnitude and therefore their likely impact on scores was explored and only one item –fatigue – remained significant. In the old age group, for the item of fatigue, biases of sufficient magnitude artifactually increased the older groups’ overall mean K6 scores in comparison to the young age group.
The finding of item bias in the assessment of fatigue indicates that psychological distress is slightly over-estimated in the old age group. Inspection of the expected score functions presented in Figure 1 indicates that if we assume theoretically that 99% of the population lie within -3 and +3 on the latent dimension of psychological distress, then on average, old age respondents (equated in terms of latent distress) receive an expected score on the K6 that is approximately 0.61 points higher than the young age group, reflecting an effect size of approximately 0.22. Subtracting 0.61 from the overall total K6 mean score of old age respondents brings their total score to 1.19 compared to 3.00 for the young group. This correction, at the group level, results in an apparent widening of the disparity of mean K6 scores between young and old.
Using K6 scores not corrected for item bias, the current results indicate that levels of psychological distress decrease across the lifespan with increasing age. As above, when correction for the fatigue item is made with the older group, the pattern remains and is more apparent. Given the strong association demonstrated between DSM-IV disorders and psychological distress (Andrews and Slade, Reference Andrews and Slade2001; Furukawa et al., Reference Furukawa, Kessler, Slade and Andrews2003; Kessler et al., Reference Kessler2010a; Slade et al., Reference Slade, Grove and Burgess2011; Sunderland et al., in press), evidence for age-related decline using formal diagnostic classification as operationalized by the CIDI was also assessed. The observed prevalence estimates of DSM-IV affective and anxiety disorders across the lifespan presented in the current study confirm the K6 age-related decline and are consistent with previous evidence that the prevalence of psychiatric disorders, particularly 30-day prevalence of affective and anxiety disorders declines with increasing age (Trollor et al., Reference Trollor, Sachdev, Anderson, Andrews and Brodaty2007; Kessler et al., Reference Kessler, Birnbaum, Bromet, Hwang, Sampson and Shahly2010b).
The current finding – namely, that the correction for age-related item bias in a measure of psychological distress served to heighten rather than minimize the age dependent disparity – goes some way to contributing to the broader debate about the legitimacy of a seemingly pervasive finding of improved mental health during old age. Psychological distress is, however, only one measure of psychopathology, and although the expected relationship with our formal diagnostic instrument (i.e. the CIDI) was observed, our finding would be complemented by systematic research into item bias in the CIDI instrument. Indeed, O'Connor and Parslow (Reference O'Connor and Parslow2009) have argued that due to the lengthy nature and item complexity associated with the CIDI, it may be subject to greater age dependent bias than screening measures such as the Kessler scales. Using prevalence ratios between young and old, they demonstrated that levels of psychological distress, as measured by the K10, did not decrease as dramatically in old age as the DSM-IV prevalence estimates would suggest (O'Connor and Parslow, Reference O'Connor and Parslow2009). Using the current data, we replicated this ratio pattern. For example, the decrease in K6 mean scores from young to old age in the current study was 3.0 to 1.8 respectively, giving a ratio of 1:0.6, whilst the decrease in 30-day prevalence for any mental disorder across young (11.2%) and old (3.3%) results in a smaller ratio of 1:0.3. Interestingly, when K6 scores were corrected for the fatigue item, the K6 young to old ratio was reduced to 1:0.4, a result closer to that observed for the formal diagnostic instrument; however, if the CIDI modules were subject to similar item bias, investigation and then subsequent corrections may cause the ratios to differ again.
This study is not alone in identifying that the clinical feature of fatigue may be interpreted differently in old age respondents filling out screening instruments. Indeed, using the Centre for Epidemiologic Studies - Depression scale, Grayson et al. (Reference Grayson, Mackinnon, Jorm, Creasey and Broe2000) demonstrated that individuals with a disability, bone and joint disease, or stroke were more likely to report higher levels of fatigue above and beyond levels of depression. They concluded that bias may be present in the assessment of depression not due to aging per se but due to increased physical comorbidities and functional impairment associated with age. In the current study, old age respondents had significantly higher levels of functional impairment than both the middle and younger groups and it could be that the age-related bias observed for the fatigue item is related to the higher functional impairment associated with old age. Although our analyses were not designed to confirm if physical comorbidity or any other particular factor mediates the endorsement of the fatigue item in old age, it may be prudent with individual patients for clinicians to consider whether fatigue is presenting as a clinical feature of psychological distress or a subsequent symptom of physical disorders that occur with the normal aging process.
Overall, greater confidence in prevalence estimates, policy planning, and the setting of clinical benchmarks for the old will be achieved when there is further evidence regarding the impact of age-related biases across lengthy diagnostic instruments used to derive national prevalence estimates, as well as across popular screening instruments used in research and clinical settings. Until this is achieved, our findings suggest that clinicians and researchers can use the overall K6 scale to compare psychological distress across various age groups with some degree of confidence. Researchers and clinicians may wish to be mindful that the fatigue item was associated with bias of sufficient magnitude and view this finding in context.
The results of the current study should be interpreted against several limitations. Most notably, simulation studies have indicated that, whilst the use of one item as an anchor set provides an acceptable level of power, the pure anchor set used to equate the measurement scale between the two groups should ideally contain four or more items (Wang and Yeh, Reference Wang and Yeh2003). However, the use of small pure anchor sets appears to be favorable over the use of anchor sets that may contain DIF items, which could distort the results if used to equate the measurement scale (Woods, Reference Woods2009). Given that the purification process in the current study indicated that only one item was free from DIF, it was decided to maintain the use of a one item anchor instead of increasing the chance of including additional items in the anchor that have some indication of DIF. Secondly, the current study utilized the IRT-LR method to detect DIF; however, there are many procedures to identify measurement invariance, including multigroup confirmatory factor analysis or multiple indicators multiple causes (MIMIC) models, each with their own pros and cons. The current results would benefit from future research replicating the findings using various samples and methods to detect age-related bias. Finally, due to statistical constraints our study examined the K6, rather than the K10. However, due to the similarity in items between the two Kessler measures, we suggest that it is likely that the K10 measure can also be used with confidence with old age individuals and across age groups when comparisons are desired.
In summary, when subjected to DIF analyses the K6 revealed only one item with age-related bias of sufficient magnitude to artifactually increase scores in old age. The relative impact of the fatigue item, when comparing scores of respondents aged 65 years and older with respondents aged 16 to 34, is likely to be minor. Overall the measure can be used with confidence in old age respondents and when comparing young and middle-aged group data. Given the relatively small impact of the fatigue item on the overall old age distress scores, it is up to the individual researcher or clinician to judge if this warrants consideration when interpreting results. Those interested in the broader debate about the legitimacy of the apparent age-related decline in psychopathology will be assured that data based on the Kessler scales, which have been used to inform the debate, are unlikely to be subject to marked measurement bias.
Conflict of interest
None.
Description of authors' roles
M. Sunderland formulated the research question, was responsible for the statistical design and analyses and wrote the paper. M. Hobbs formulated the research question, supervised the statistical analyses and assisted with writing the paper. T. Anderson formulated the research question and assisted with writing the paper. G. Andrews provided critical revisions to the draft paper.
Acknowledgments
This research was funded by a NHMRC Capacity Building Grant ID 568940.