I. INTRODUCTION
Nanoporous metals (NPMs), with high surface area, low density, and high strength,Reference Volkert, Lilleodden, Kramer and Weissmüller1–Reference Hakamada and Mabuchi3 have received considerable attention on the applications of catalysis, biotechnology, sensors, actuators, fuel cells, surface enhanced Raman scattering (SERS), etc.Reference Qiu, Xu, Huang, Ding, Qu and Gao4–Reference Zielasek, Jürgens, Schulz, Biener, Biener, Hamza and Bäumer7 Since dealloying was a simple, spontaneous, and effective way to prepare NPMs,Reference Forty8 a great deal of efforts have been devoted to this method.
For a long time, lots of attention have been drawn on the dealloying behavior of single-phase solid solution alloys with solubility across all composition such as Au–Ag,Reference Ding, Kim and Erlebacher9–Reference Hakamada and Mabuchi13 Au–Cu,Reference Morrish, Dorame and Muscat14 Cu–Mn,Reference Chen, Yu, Fujita and Chen15 Cu–Ni,Reference Sun, Chien and Searson16, Reference Chang, Hsu, Sun and Tsai17 Cu–Pt,Reference Pugh, Dursun and Corcoran18 Au–Ag–Pt,Reference Snyder, Asanithi, Dalton and Erlebacher19 and so on, which could generally yield ideal three-dimensional (3D) bicontinuous nanoporous structures. However, the main challenge of this approach is the difficulty to prepare single-phase solid solution due to the existence of miscibility gap in most alloy systems. Simultaneously, a few works on dealloying of amorphous alloys have also been reported, such as Pd–Ni–P,Reference Yu, Ding, Xu, Inoue, Sakurai and Chen20 Al–Cu–Mg,Reference Aburada, Fitz-Gerald and Scully21 and Cu–Cr–Ti.Reference Abe, Sato, Nishikawa, Takemoto, Fukuhara and Inoue22 However, this approach has also been largely limited due to the difficulty of preparing amorphous precursor alloys. Therefore, the preparation of NPMs from the alloy systems with common components and multiple phases needs to be investigated urgently.
Up to date, a lot of literatures on dealloying behavior of multiphase alloys have been published and most of which are binary alloys. For example, Lu et al.Reference Lu, Li and Wang23 have reported that NPC can be successfully fabricated through electrochemical dealloying of nanocrystalline two-phase Cu–Zr film. Wang et al.Reference Wang, Qi, Zhao, Wang and Zhang24 have claimed successful preparation of nanoporous silver from dual-phase Al–Ag alloy. Many other multiphase alloy systems were also reported, such as Al–Cu,Reference Liu, Zhang, Li, Zheng and Xing25–Reference Liu, Zhang, Li, Zheng and Xing28 Mg–Cu,Reference Zhao, Qi, Wang and Zhang29, Reference Zhao, Wang, Qi, Ji and Zhang30 Al–Au,Reference Zhang, Wang, Qi, Wang and Zhang31 and so forth. It has been claimed that different from the dealloying of single-phase solid solution and amorphous alloys, the divergence between different phases leads to markedly complicated structure evolution processes during the dealloying of dual-phase Al–Cu alloys.Reference Liu, Zhang, Li, Zheng and Xing28 Furthermore, multiphase Pt–Au–Cu ternary alloy has also been chosen as precursor of dealloying, by which nanoporous Pt/Au alloy could be achieved.Reference Xu, Wang, Chen, Zhang and Ding32
However, to our knowledge, no systematical investigation on structure evolution process during the dealloying of multiphase ternary alloy was reported yet. Furthermore, in single-phase alloys, the nanoporous material is typically not mechanically stable below about 18 at.% noble elements. Nanoporous structure prepared through dealloying and with relative density below 18 at.% has not been reported either.
In this paper, monolithic NPC with ultralow density (10 at.% nominal Cu in precursor alloy) was successfully fabricated via chemical dealloying of a dual-phase ternary Cu–Mn–Al alloy with HCl solution. Moreover, the evolutions of microstructure and composition during dealloying process were investigated, which would be helpful to imply the mechanism of dealloying of ternary casting multiphase alloys.
II. EXPERIMENTAL
Vacuum induction melting technique was used to fabricate the precursor alloy with nominal composition of Cu1Mn1Al8, utilizing pure Cu (99.9%), pure Mn (99.97%), and pure Al (99.9%) as the raw materials. The ingot was cut into bulk samples with a thickness of 1 mm by a wire cut electrodischarge machine (DK7720, JiangSu CNC Machine Tool Co., Ltd., Jiang Su, China). All the precursor samples were polished with several sandpapers and cleaned in acetone with ultrasound cleaner (KH-100B, Beijing MREDA Technology Co., Ltd., Beijing, China).
Before dealloying, pure argon gas was influxed into the 0.1 M HCl aqueous solution for 15 min to eliminate oxygen. Then, the cleaned bulk precursor samples were immersed in the solution at room temperature of 20 °C for different time ranging from 12 h to 10 days (12 h, 1 day, 2 days, 4 days, 7 days, and 10 days, respectively). The as-dealloyed samples were rinsed in distilled water and acetone for several times and then dried in the air.
The phases of the starting alloy and as-dealloyed samples were identified by an x-ray diffractometer (XRD, DX-2000, Dandong Fang Yuan instrument Co., Ltd., Liaoning, China) with Cu Kα radiation. The microstructure and composition of the as-dealloyed samples were characterized by a field-emission scanning electron microscope (SEM; Hitachi S4800, Hitachi Hi-Tech Co., Ltd., Tokyo, Japan) with an energy dispersive x-ray (EDX) analyzer.
III. RESULTS AND DISCUSSION
A. Phase evolution
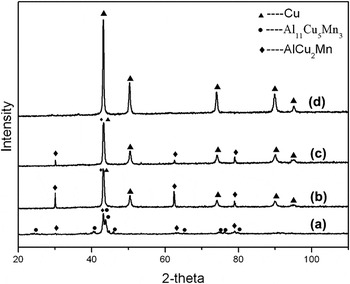
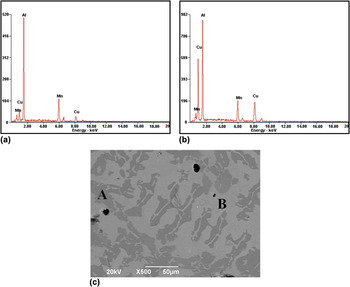
Figure 1 shows the XRD patterns of the starting alloy of Cu1Mn1Al8 and as-dealloyed samples for different dealloying durations (1, 4, and 7 days, respectively). Figure 2 shows the back scattered electron imaging (BEM) image [Fig. 2(c)] and the EDX results of different regions in the BEM image [Figs. 2(a) and 2(b)]. From Fig. 1(a), it can be apparently identified that the starting alloy is mainly comprises two phases: Al11Cu5Mn3 and AlCu2Mn. Correspondingly, there are two regions in the BEM image of the initial alloy, labeled with “A” and “B,” respectively, as shown in Fig. 2(c). The EDX image in Fig. 2(a) is the EDX result of the “A” area, while the EDX image in Fig. 2(b) is the result of the “B” area. As implied from the EDX results of the two regions [as shown in Figs. 2(a) and 2(b), respectively], the “A” and “B” areas represent Al11Cu5Mn3 and AlCu2Mn phase, respectively.
XRD patterns of starting Cu–Mn–Al alloy (a) and samples upon dealloying for (b) 1 day, (c) 4 days, and (d) 7 days.

BEM image of the starting alloy (c) and the EDX result of different regions on the BEM image: (a) for “A” area and (b) for “B” area. (color online)

As shown in Fig. 1, after dealloying for 1 day, the peaks of Al11Cu5Mn3 disappeared and the peaks of Cu phase emerged accordingly [Figs. 1(b) and 1(c)]. With increase of dealloying time, the peak intensity of AlCu2Mn phase kept decreasing to indistinguishable. After dealloying for 7 days, only fcc Cu peaks existed [Fig. 1(d)].
The XRD result confirms successful fabrication of NPC through chemical dealloying of Cu1Mn1Al8 alloy and separate dissolution behavior of the two phases in precursor alloy. Specifically, during the initial days, the dissolution of the Al11Cu5Mn3 phase is the main process. And the dealloying of AlCu2Mn phase has experienced a relatively long period after the dissolution of Al11Cu5Mn3.
The difference of electrochemical activities between the two phases would be an important factor to explain this sequential dissolution phenomenon. Because the standard equilibrium potential of Cu2+/Cu is much higher than Mn2+/Mn and Al3+/Al, the Cu-rich phase would present more electrochemically stable than Cu-poor phase. Therefore, a highly effective galvanic cell would exist between the Cu-rich and Cu-poor phases. Because of a higher content of Al and lower content of Cu, Al11Cu5Mn3 phase played the role of anodic phase in the cell and dissolved preferentially in the solution as a result. A similar phenomenon has been observed in the dealloying of dual-phase Al–Cu alloy, and the electrochemical activities divergence has been proved by the Tafel polarization curves of the single-phase binary intermetallic compounds.Reference Liu, Zhang, Li, Zheng and Xing28 However, in this work, owing to the complicated casting behavior of ternary alloys, preparing the single-phase ternary intermetallic compounds is a challenge, which sets a barrier for the confirm of this theory.
B. Microstructure evolution
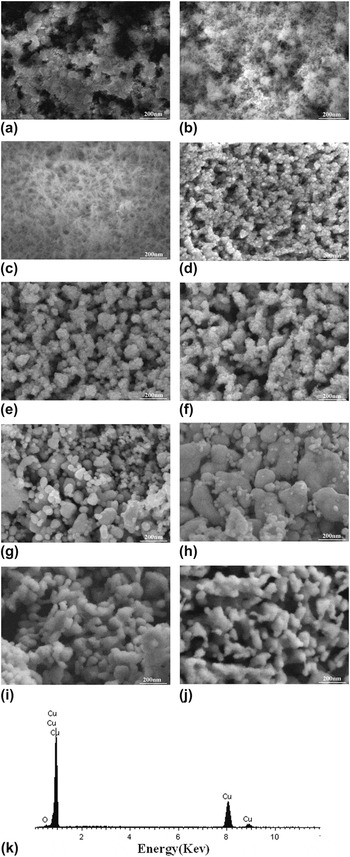
Figure 3 shows the section view microstructures of the inner and outer space of as-dealloyed samples for different dealloying durations (12 h, 1 day, 2 days, 4 days, and 7 days, respectively). Figures 3(a), 3(c), 3(e), 3(g), and 3(i) are SEM graphs of inner space and Figs. 3(b), 3(d), 3(f), 3(h), and 3(j) are outer space. From Fig. 3, it can be observed that the microstructures of both inner space and outer space changed dramatically during the dealloying process. For the inner space, a number of corrosion pits appeared at first [Fig. 3(a)]. Increasing dealloying time, a needle-like structure consisting of ultrafine fibers was constructed upon the sidewalls of the pits [Fig. 3(c)]. Thereafter, a porous structure comprising assembled clusters was observed [Fig. 3(e)]. The aggregated clusters gradually grew up into islands, as shown in Fig. 3(g). The islands observed in Figs. 3(g) and 3(h) are coarser than the resulting ligaments, due to microscale inhomogeneous composition in the initial alloy. Finally, after a long-term dealloying of 7 days, a porous structure with island-like ligaments was obtained [Fig. 3(i)]. And the EDX result [Fig. 3(k)] of the sample dealloyed for 7 days did not detect any residual Al and Mn elements.
SEM graphs of the microstructure of inner and outer space of the samples upon different dealloy time (a, b: 12 h; c, d: 1 day; e, f: 2 days; g, h: 4 days; i, j: 7 days. Parts a, c, e, g, i: inner space; b, d, f, h, j: outer space; k: the EDX result of sample dealloyed for 7 days).

The outer space of the sample dealloyed for 12 h [Fig. 3(b)] presents a similar morphology with Fig. 3(c) (inner space of the sample dealloyed for 1 day). And the outer space of the sample dealloyed for 1 day [Fig. 3(d)] shares a similar microstructure with Fig. 3(e) (the inner space of the sample dealloyed for 2 days). Moreover, during the later period of dealloying, the outer spaces always show similar but coarser morphologies with inner spaces [Figs. 3(e) and 3(f), 3(g) and 3(h), and 3(i) and 3(j). respectively]. This phenomenon indicates that the evolution of outer space is the same as inner space but prior to it.
The asynchronous evolution of inner and outer spaces could be explained by the fact that the corrosion solution percolates from surface into the inner space of the sample. And this asynchronous phenomenon would be severely intensified when the thickness of the sample is as long as 1 mm, which brought in a very long percolation path.
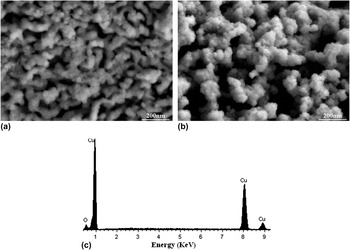
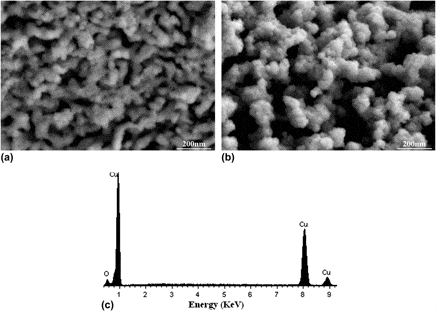
Although the NPC could be successfully fabricated after dealloying for 7 days, the ligaments were not continuous but island like [Figs. 3(i) and 3(j)]. However, the island-like morphology can be effectively ameliorated through simply prolonging the dealloying duration. When the dealloying duration is as long as 10 days, the ligaments of the porous structure would evolve into 3D bicontinuous ligaments, as shown in Fig. 4.
The SEM image and EDX result of NPC samples dealloying for 10 days: (a) SEM image of inner space, (b) outer space, and (c) the EDX result.

Therefore, the microstructure evolution of the casting Cu–Mn–Al alloy during 10 days dealloying process could be summarized as follows: corrosion pits → network with ultrafine fibers → aggregated clusters → islands → island-like ligaments → bicontinuous ligaments. This evolution process is much different from the dealloying of solid solution alloys such as Au–Ag,Reference Ding, Kim and Erlebacher9–Reference Hakamada and Mabuchi13 which experiences a simple evolution process based on clustering of Au atoms in combination with continuous etching of Ag.
It is known that the “dissolution–redeposition” patternReference Forty8, Reference Forty and Rowlands33–Reference Pickering and Wagner35 had ever been proposed to describe dealloying behavior, in which the alloy would dissolve continuously at local anodic regions, while the relatively noble component would redeposit at a local cathode (e.g., on the sidewalls of a corrosion pit). This formation model could satisfactorily explain many issues in dealloying process. However, a principal difficulty existed in this model is to account for the potential difference required for such a local cell to operate. In the case of dealloying of the casting Cu1Mn1Al8 alloy, however, a highly effective galvanic cell has existed between the Al11Cu5Mn3 and AlCu2Mn phases, as discussed before. Therefore, it is reasonable to assume the mechanism of the formation of the nanoporous structure during the dealloying of Cu1Mn1Al8alloy based on the “dissolution–redeposition” pattern.
First, as anodic region, the Al11Cu5Mn3 phase dissolved continuously, which resulted in a number of corrosion pits, as observed in Fig. 3(a) (the morphology of inner space of the sample dealloyed for 12 h), which offered channels for the solution to percolate into the alloy. Thereafter, because of the reduction reaction between the dissolved Cu2+ ions and the remained alloy, the dissolved Cu atoms started to redeposit on the sidewalls of corrosion pits in situ. Simultaneously, due to the low content of Cu2+ ions in the solution, the small amount of released Cu would have to construct into a needle-like structure with ultrafine fibers, as observed in the samples dealloyed for 12 h and 1 day [Figs. 3(b) and 3(c)]. However, the needle-like structure with ultrafine fibers apparently has a high surface area, which made it an unstable structure. Thus, when more Cu atoms were released later, the needle-like structure evolved into aggregated clusters immediately, as shown in Figs. 3(e) and 3(f).
After dealloyed for 1 day, the Al11Cu5Mn3 phase had been dissolved, as confirmed in XRD results (Fig. 1), and the AlCu2Mn phase started to dealloy. However, it is invalid to tell whether the dealloying behavior of AlCu2Mn phase also obeys the “dissolution–redeposition” model for lack of accounting for an apparent galvanic cell. Actually, as shown in the SEM images in Fig. 3, during this period, as with continuous etching of Al and Mn, remained atoms in the alloy first aggregated into clusters [Figs. 3(d)–3(f)] and then gradually evolved into islands [Figs. 3(g)–3(j)]. This observation is in accordance with the dealloying behavior of Au–Ag solid solution,Reference Ding, Kim and Erlebacher9–Reference Hakamada and Mabuchi13 as described in the “phase-separation” pattern,Reference Erlebacher and Sieradzki37–Reference Parida, Kramer, Volkert, Rösner, Erlebacher and Weissmüller39 in which pores form because the Au atoms are chemically driven to aggregate into clusters, while the Ag was continuously etching. After nearly all the Al and Mn elements were dissolved, the remained Cu atoms formed a nanoporous structure with island-like ligaments, as shown in Figs. 3(i) and 3(j).
However, during the dealloying of solid solution, a nanoporous structure with 3D bicontinuous ligaments was formed as well as the relatively active component (less noble component) removed out, which is different from the evolution process reported in this paper. During the dealloying of Cu1Mn1Al8 alloy, when the Al and Mn components were totally depleted after dealloying for 7 days, the ligaments were not connected well but island like [Figs. 3(i) and 3(j)]. Instead, the porous structure with 3D bicontinuous ligaments was formed after a long-term dealloying of 10 days [Figs. 4(a) and 4(b)]. The difference between the morphology of the initially prepared NPC (the NPC sample dealloyed for 7 days) and the common dealloying result of the solid solution alloys would be ascribed to the different dealloying mechanisms of the intermetallic compounds and solid solution. Because similar island-like structures have also been observed in the dealloying of many other alloys, which comprise intermetallic compounds, such as Al–Mg–Cu,Reference Aburada, Fitz-Gerald and Scully21 Mg–Cu,Reference Zhao, Qi, Wang and Zhang29, Reference Zhao, Wang, Qi, Ji and Zhang30 Al–Cu,Reference Liu, Zhang, Li, Zheng and Xing25–Reference Liu, Zhang, Li, Zheng and Xing28 and so on.
After keeping the sample in the solution for 10 days, the island-like ligaments observed in the initially prepared NPC evolved into 3D bicontinuous ligaments, as shown in Fig. 4. A proper explanation for this phenomenon would be that as for the remained Cu atoms in the structure would diffuse along the solid–electrolyte interface at a high speed, the small islands would aggregate and grow into continuous ligaments after long-term dealloying. It has been reportedReference Ding, Kim and Erlebacher9 that severe coarsening phenomenon with time has been observed in the dealloying of Au–Ag, in which the morphology of nanoporous gold (NPG) remained the same but magnified. However, in this work, due to a different nanoporous structure (island-like structure) in the initially prepared NPC, the coarsening process resulted in the formation of bicontinuous ligaments.
Additionally, the EDX result of the NPC samples, which did not detect any residual Al or Mn elements, is also different from the dealloying result of solid solution of Au–Ag.Reference Ding, Kim and Erlebacher9–Reference Hakamada and Mabuchi13 It is generally recognized that the NPG prepared by dealloying of Au–Ag alloy would always contain some residual Ag, which could be detected by EDX even after an exhaustively long-term corrosion (up to 100 h).Reference Erlebacher38 This result implied differences existed between the mechanisms of dealloying of the AlCu2Mn intermetallic compound and solid solutions.
C. Composition evolution
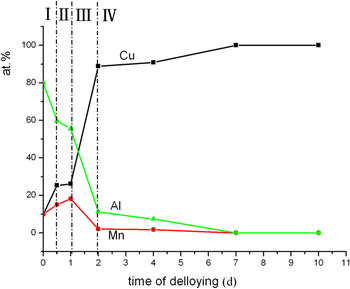
Figure 5 shows the composition evolution curve of the casting Cu1Mn1Al8alloy with dealloying time. Increasing dealloying time, four composition regions can be distinguished, which were marked with region I, II, III, and IV. It can be seen from region I that the atomic percentages of Al decreased severely, while atomic percentages of Cu and Mn increased marginally. After a mild variation in region II, the atomic percentages of all the three elements altered mightily in region III, and Mn content started to decrease for the first time. The composition in region IV, although spanning a long dealloying time from 2 to 10 days, varied mildly.
The composition evolution of Cu1Mn1Al8with dealloying time, as measured by EDX, region I, II, III, and IV denote four distinguishable composition regions. (color online)

The evolution of composition almost accurately corresponds to the evolutions of phase and microstructure. And the marked four regions are in accordance with four periods of the dealloying process, respectively, which could be sequentially defined as “dissolution of Al11Cu5Mn3,” “redeposition of Cu atoms,” “dealloying of AlCu2Mn,” and “coarsening.”
At the beginning of dealloying, as anodic region, the Al11Cu5Mn3 phase dissolved preferentially, which resulted in lots of corrosion pits, as observed in Fig. 3(a). Accordingly, the composition of remained alloy changed dramatically in region I. Therefore, region I could be defined as a stage for “dissolution of Al11Cu5Mn3.” While the Al elements reduced severely at this stage, the Cu and Mn elements experienced a mild increase. The increase of Cu and Mn elements in stage I could be ascribed to the low content of Cu and Mn in the Al11Cu5Mn3 phase, which is below the average content of the alloy. Therefore, when the Al11Cu5Mn3 phase dissolved, the average contents of the Cu and Mn elements increased.
Thereafter, as discussed before, the dissolved Cu atoms started to redeposit on the sidewalls of corrosion pits and constructed into a structure of needle-like structure with ultrafine fibers [Figs. 3(b) and 3(c)], which timely corresponds to region II. Thus, it is valid to define region II as a stage for “redeposition of Cu atoms.” Furthermore, the composition curve of this period (region II) turned to be much milder than region I, which indicates that the dealloying reaction of Al11Cu5Mn3 phase declined, and the redeposition of Cu atoms was the main process in this stage. Two factors are thought to be responsible for the decline. One is the gradual decrease of Al11Cu5Mn3 phase, which inhibited the reaction; the other is the formation of network consisting of ultrafine fibers might have impeded the percolation of solution.
After dealloying for 1 day, the Al11Cu5Mn3 phase had been removed completely, as indicated from the XRD result in Fig. 1. Then, the AlCu2Mn phase started to dealloy, which perfectly corresponds to the vigorous change of composition in region III. Therefore, region III could be defined as a period of “dealloying of AlCu2Mn.” Moreover, owing to the severely dealloying of AlCu2Mn, large amount of released Cu atoms were released, which resulted in a rapid change of the morphology from needle-like structure into aggregated clusters, as shown in Figs. 3(d)–3(f).
Although spinning a long dealloying time from 2 to 10 days, the composition curve in region IV changed mildly, which indicates that the dealloying reaction of AlCu2Mn phase died down. After dealloying for 7 days, it can be confirmed from XRD [Fig. 1(d)] and EDX [Fig. 3(k)] results that the Al and Mn components have been almost completely depleted from the alloy. Therefore, region IV could be defined as a period of “coarsening,” during which the dealloying reaction of AlCu2Mn phase gradually terminated, while the remained Cu atoms continued to diffuse along the alloy/solution interfaces and finally arranged into a porous structure with continuous ligaments [Figs. 4(a) and 4(b)].
D. Macrographs
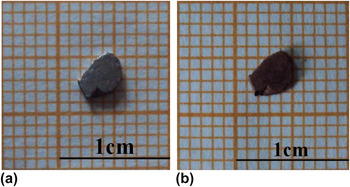
Figure 6(a) is the macrograph of the initial alloy, and the bulk NPC (dealloyed for 10 days) is shown in Fig. 6(b). The porous structure and composition of the bulk NPC have been confirmed by SEM and EDX. The color of the bulk NPC is very close to the color of bulk copper.
The macrograph of (a) the starting alloy and (b) bulk NPC sample by 7-day dealloying. (color online)

No noticeable volume shrinkage can be observed in the bulk NPC, consistent with the observation during dealloying Mg–Cu alloys.Reference Zhao, Qi, Wang and Zhang29 However, macroscopic shrinkage up to 30 vol% was reported during electrochemical dealloying of Ag–Au.Reference Parida, Kramer, Volkert, Rösner, Erlebacher and Weissmüller39 Furthermore, in the dealloying of single-phase alloys (specifically, solid solution), the nanoporous material is typically not mechanically stable below about 18 at.%. However, in this work, mechanically stable NPC with ultralow density of 10 at.% has been obtained. Moreover, it has been reported that in the dealloying of multiphase Mg–Cu and Al–Cu alloy, mechanically stable NPCs with relative density of about 15 at.% have been prepared.Reference Liu, Zhang, Li, Zheng, An and Xing40
Here, we proposed two possible explanations for these differences. The first one could be the different dealloying mechanisms of intermetallic compound and solid solution alloys. It has been generally recognizedReference Liu, Zhang, Li, Zheng and Xing28 that the dealloying mechanism of intermetallic compounds is much more complicated than solid solution and thus is not clear yet. Thus, the different dealloying mechanism of intermetallic compounds could be one reason for these differences.
In secondary, this phenomenon could also be attributed to the different dealloying mechanisms of multiphase alloys and single-phase solid solution. During the dealloying of multiphase alloy, when one phase was etched away, the other phase that did not dealloy would support the volume of the sample as a structural framework. Thus, the volume of the sample would be remained, and the mechanical stability of the sample has also been increased. However, in the dealloying of single-phase solid solution, there is no such structural framework supporting the volume.
IV. CONCLUSION
In conclusion, a freestanding bulk NPC with ultralow density (10 at.% nominal content of Cu in precursor alloy) has been successfully fabricated through dealloying of a casting ternary Cu–Mn–Al alloy. The Al11Cu5Mn3 and AlCu2Mn in the dual-phase precursor alloy dissolved sequentially in the solution, and the Al11Cu5Mn3 phase dealloyed before AlCu2Mn. This phenomenon could be attributed to the existence of a highly effective galvanic cell between the two phases due to the existence of electrochemical activity difference. Compared with single-phase alloys, the dissolution of Al11Cu5Mn3 phase offered percolation channels for the solution. Moreover, when the first phase was etched away, the volume of the sample would be supported by the other phase, which resulted in that no obvious volume shrinkage could be observed during dealloying.
Furthermore, during the dealloying process, a dramatical change of the microstructure has been observed, which could be summarized as the following sequence: corrosion pits → network with ultrafine fibers → aggregated clusters → islands → island-like ligaments → bicontinuous ligaments. The composition evolution with dealloying time corresponds well to the evolutions of phase and microstructure. A formation mechanism based on “dissolution–redeposition” pattern, “phase-separation” pattern, and “coarsening” has been built to describe the evolution process, which could be divided into four stages, sequentially defined as “dissolution of Al11Cu5Mn3,” “redeposition of Cu atoms,” “dealloying of AlCu2Mn,” and “coarsening.”
ACKNOWLEDGMENTS
The authors would like to acknowledge funding from Ph.D. Programs Foundation of Ministry of Education of China (Grant No. 20110181110002). Also, we are grateful to Dr. W.B. Liu for useful discussions.