


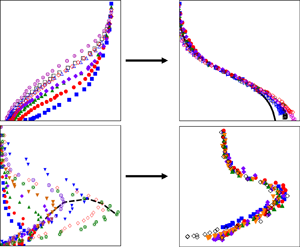



1. Introduction and motivation
Computational fluid dynamics (CFD) continues to be challenged to produce accurate predictions of the complex fluid phenomena that are often encountered in off-design aerodynamic conditions. For example, high Reynolds number turbulent separated flow continues to pose a challenge for numerical simulations (Dupuy, Odier & Lapeyre Reference Dupuy, Odier and Lapeyre2023). A key finding of the CFD Vision 2030 study by Slotnick et al. (Reference Slotnick, Khodadoust, Alonso, Darmofal, Gropp, Lurie and Mavriplis2014) states that ‘the use of CFD in the aerospace design process is severely limited by the inability to accurately and reliably predict turbulent flows with significant regions of separation’. In this context and as described by Simpson (Reference Simpson1981), the term ‘separation’ involves the entire process of the breakdown of boundary layer flow in terms of both a thickening of the rotational flow region and a large increase in the wall-normal velocity leading to detachment from the surface.
Deck (Reference Deck2012) presents three categories of separated flow problems which are shown schematically in figure 1. Category I represents flows where separation is fixed by the geometry. Category II are flows where separation occurs over a smooth surface and is dictated largely by the pressure gradient, and category III are flows where the boundary layer dynamics, along with the pressure gradient, both strongly influence separation. Deck goes on to classify categories I and II as massively separated flows where developing instabilities overwhelm the incoming flow turbulence. Categories II and III are collectively known as smooth-body separated flows. Slotnick et al. (Reference Slotnick, Khodadoust, Alonso, Darmofal, Gropp, Lurie and Mavriplis2014) note that ‘while all turbulent separated flows are difficult to predict, smooth-body separation stands out as the most challenging’. This is due to the fact that, in such flows, the pressure gradient, surface curvature and boundary layer dynamics can all interact and play a significant role. Furthermore, the study goes on to state that ‘in general, two critical components of the flow physics need to be modeled accurately: the exact location of separation as controlled by the boundary-layer physics and the feedback from the separated region to the boundary layer’. Thus, there is a clear need to develop new, improved validation studies on the smooth-body geometries of categories II and III.
Deck (Reference Deck2012) classification of flow separation. (I): separation fixed by the geometry, (II): separation induced by a pressure gradient on a curved surface, (III): separation strongly influenced by the dynamics of the incoming boundary layer (figure and caption from Simmons (Reference Simmons2020)).

The prime example of Deck's category I flow separation is that of the backward facing step. It is one of the most widely studied flow separation geometries, as described in the review by Simpson (Reference Simpson1981). The sharp corner of the step fixes the separation location, allowing the remaining flow parameters (e.g. the step height and span, incoming boundary layer thickness and turbulence level, Reynolds number etc.) to dictate the downstream reattachment process and location. The two-dimensionality of the separation makes this geometry relatively simple to study with the primary focus on the downstream flow evolution and reattachment rather than the separation itself.
Researchers modified the traditional backward facing step by replacing the sharp edge with a large arc in an effort to allow the pressure gradient, instead of solely the geometry, to dictate the separation location. Several, detailed experimental studies, utilizing rounded backward facing steps (i.e. ramps), have been conducted. Song, DeGraaff & Eaton (Reference Song, DeGraaff and Eaton2000) investigated the separation, reattachment and flow recovery process of a turbulent boundary layer developing over a rounded backward facing step. Later, Song & Eaton (Reference Song and Eaton2004a) characterized the large-scale vortical motions of the flow in the separated shear layer as well as their dependence on Reynolds number. The nature of the recovery of the turbulent boundary layer downstream of reattachment was also investigated. Song & Eaton (Reference Song and Eaton2004b) examined Reynolds number effects which showed that, for momentum thickness Reynolds numbers, (Reθ) above 3400, ‘the mean separation and reattachment points are at most a very weak function of Reynolds number’. Since the boundary layer thickness to ramp height ratio at the start of the ramp (δ/H) was 1.2 in these studies, they would be considered category III smooth-body flow separations as defined by Deck (Reference Deck2012). Large-eddy simulations (LES) and Reynolds-averaged Navier–Stokes (RANS) simulations have been conducted by Wasistho & Squires (Reference Wasistho and Squires2005) on the same geometry but with a much lower δ/H (which yielded a category II flow) with the results showing significant differences in the flow field properties compared with those reported by Song & Eaton (Reference Song and Eaton2004a,Reference Song and Eatonb). Radhakrishnan et al. (Reference Radhakrishnan, Piomelli, Keating and Lopes2006) conducted multiple RANS and wall modelled LES (WMLES) at Reθ = 13 200. It is notable that all the RANS and WMLES simulations were able to predict the separation location within 12 %; however, reattachment prediction was far worse; up to 37 % and 14 % differences for the RANS and WMLES simulations, respectively. Additionally, RANS and WMLES produced opposite errors compared with experiment; early reattachment for RANS and late reattachment for WMLES. More recent LES simulations by El-Askary (Reference El-Askary2009) conducted at Reθ = 1100, which showed an overall agreement with the experiment and were able to accurately predict the separation location, also poorly predicted the reattachment.
In the previously cited studies, while the separation location was dictated by the pressure gradient, one could argue that the flow was still forced to separate due to the imposed rather sudden discontinuity in surface curvature. A geometry that avoids this issue is the wall-mounted hump model representing the suction surface of a modified Glauert–Glas II airfoil, first investigated by Seifert & Pack (Reference Seifert and Pack2002). This well-documented, canonical geometry has been used for turbulent boundary layer (TBL) separation studies, validation campaigns and flow control experiments by Seifert & Pack (Reference Seifert and Pack2002), Koklu (Reference Koklu2017), Otto et al. (Reference Otto, Tewes, Little and Woszidlo2019) and is also reviewed by Eaton & Johnston (Reference Eaton and Johnston1981). Computational studies include those by Postl & Fasel (Reference Postl and Fasel2006), Uzun & Malik (Reference Uzun and Malik2017) and Rumsey et al. (Reference Rumsey, Gatski, Sellers, Vatsa and Viken2004). As in the case of the rounded, backward facing step, the separation process over this hump model is a smooth-body flow separation. However, since the surface curvature is now continuous throughout the separation region, this enhances the feedback from reattachment to the separation location. As noted by Simmons (Reference Simmons2020), the location of separation is found to be virtually insensitive to Reynolds number and incoming boundary layer thickness which may be why direct numerical simulations (DNS), LES and RANS simulations have been able to match the experimentally determined separation location fairly accurately. However, the inaccuracies in the predicted reattachment locations from the simulations remain quite large with RANS models performing noticeably worse than DNS and LES. Rumsey et al. (Reference Rumsey, Gatski, Sellers, Vatsa and Viken2004) pointed out that this may result from the Reynolds stresses being seriously underpredicted by the RANS models in the separated region. As for discrepancies in the LES predictions, Uzun & Malik (Reference Uzun and Malik2017) found that the span of the computational domain significantly influences the separation-bubble length. For this reason, they cautioned users attempting to employ spanwise-periodic domains that omit the effects present at the end plates or walls used in the experiments.
In order to avoid so-called ‘sidewall interference’, or ‘three-dimensional contamination’, issues associated with finite span models, axisymmetric geometries have also been employed as a test bed for two-dimensional TBL separation studies. For example, Disotell & Rumsey (Reference Disotell and Rumsey2017) designed an axisymmetric flow separation experiment, consisting of a series of interchangeable boat tail geometries, aimed at CFD validation experiments. The interchangeable geometries allow multiple flow separation configurations, resulting in different separation extents, as well as an attached flow case to be studied on the same test bed. Early experimental work and accompanying RANS simulations were reported by Gildersleeve & Rumsey (Reference Gildersleeve and Rumsey2019) and show, yet again, that while RANS can predict the separation location reasonably well, the reattachment location is not accurately predicted.
The work to be described here is a subset of a larger effort that was conducted at the University of Notre Dame in partnership with the CFD group at NASA Langley Research Center under the Transformative Tools and Technologies Program. It focused on the acquisition of an archival benchmark smooth-body flow separation database for improved model development and validation. The work involved a comprehensive study on a finite span geometry (to be described in detail in § 2) that provides spanwise-uniform, canonical zero pressure gradient TBL development prior to encountering a smooth, two-dimensional backward facing ramp onto which a streamwise adverse pressure gradient (APG) that is fully adjustable was imposed. Three cases were considered: (a) large-scale smooth-body flow separation (i.e. extending over a large fraction of the model geometry) with subsequent reattachment, (b) an intermediate-scale smooth-body flow separation and reattachment and (c) an APG attached flow. All data are archived on the NASA Turbulence Modeling Resource web site: (https://turbmodels.larc.nasa.gov/Other_exp_Data/notredame_sep_exp.html).
As part of the aforementioned investigation, Simmons et al. (Reference Simmons, Thomas, Corke and Hussain2022) present an extensive surface flow visualization study on the ramp surface for the large-scale flow separation case. The primary objective of that work is to characterize both the smooth-body flow separation and reattachment surface topography and topology and compare with those documented in previous studies. Despite the spanwise uniform approach TBL and ramp geometry, the flow separation was found to be highly three-dimensional while the reattachment was remarkably spanwise uniform. The surface flow topology was characterized by the ‘owl face pattern of the fourth kind’ (Perry & Hornung Reference Perry and Hornung1984). This ubiquitous flow separation topology has been reported for a variety of flows including inclined bodies of revolution. It was shown that the roles of pressure gradient, surface curvature and the sidewall/ramp juncture secondary flow dictate the formation of the observed surface separation patterns. The family of owl face patterns (OFP) are some of the most generic forms of three-dimensional flow separation as described by Fairlie (Reference Fairlie1980) and Perry & Hornung (Reference Perry and Hornung1984). Through detailed analysis of the ramp flow separation Simmons et al. (Reference Simmons, Thomas, Corke and Hussain2022) showed that the OFP is a part of a larger structure, called a ‘generalized OFP’, which includes the effect of the tunnel sidewalls. This pattern is a simplified surface flow topology structure, consisting of a repeating pattern of saddle points and foci for separation and a sequence of nodes and saddle points for reattachment.
Dengel & Fernholz (Reference Dengel and Fernholz1990) showed that as an APG TBL approaches separation and the local maximum of the mean strain rate moves away from the wall, the maximum Reynolds stress and the peak turbulence production also shift away from the wall and move towards the middle of the boundary layer. Similarly, in a TBL that separates, reattaches and recovers over a smoothly contoured ramp, Song & Eaton (Reference Song and Eaton2004b) observed that peaks of the streamwise normal stress and shear stress shift outward from the wall as the flow progresses downstream, and remain in alignment with the inflection point in the mean velocity profile. These observations were used to develop an inflection point scaling in the separation region. Song & Eaton (Reference Song and Eaton2004a) scaled the Reynolds stress profiles from the separated flow region with a velocity scale equivalent to the inflection point mean velocity at reattachment and a length scale of the wall-normal location of the inflection point. The Reynolds stress profiles collapsed using the inflection point scaling, indicating that large-scale, low-frequency motions of the separated shear layer are the dominant contributor to the turbulence production in the separated flow.
Of particular relevance to the work to be reported here is the study of unsteady APG TBL separation by Schatzman & Thomas (Reference Schatzman and Thomas2017). Based on their measurements, they postulated the formation of an embedded shear layer within the APG TBL that results from the inviscid instability of the outer inflection point of the mean velocity profile and that this becomes a dominant driver for turbulent APG flow development. This motivated the employment of free shear layer scaling parameters on an attached spatially and temporally varying APG TBL flow. In addition to applying this so-called ‘embedded shear layer (ESL) scaling’ to their own experiments with success, they examined its universality by applying the scaling to the constant APG TBL flow of Marusic & Perry (Reference Marusic and Perry1995) as well as twenty-five mean flows compiled by Coles & Hirst (Reference Coles and Hirst1969) from the AFOSR-IFP- Stanford Conference. In all the cases examined, the ESL scaling did a remarkable job of providing a self-similar collapse of the data sets.
It should be noted that while ESL scaling has given rise to excellent collapse of both mean velocity and turbulent stress profiles in experiments on straight ramps and flat plate APG TBLs, attempts to scale the turbulent stresses using the same procedure have been less effective due to varying degrees of surface curvature (e.g. Balantrapu et al. Reference Balantrapu, Hickling, Alexander and Davenport2021). In such cases, while the mean velocity shows self-similarity, the turbulent stresses do not show collapse for wall-normal locations below the mean velocity outer inflection point with an ESL scaling that is based solely on outer flow parameters. This indicates that some adjustment(s) are required to the scaling to account for the effective isolation of this inner region from the outer flow. This decoupling of the outer flow region from the inner region is apparent when the APG is particularly strong, especially when the layer is approaching separation, during separation and in boundary layers recovering from a region of separation (Song & Eaton Reference Song and Eaton2004a). The relevance of ESL to the smooth-body flow separation under consideration here and its implications for new model development is one focus of the work to be presented.
In this paper, smooth-body flow separation characterization and scaling over the spanwise uniform ramp geometry used in Simmons et al. (Reference Simmons, Thomas, Corke and Hussain2022) is investigated. Consideration is given to an extensive set of both surface and off-surface flow field measurements that are used to fully characterize the streamwise evolution of both mean flow and turbulence quantities for the intermediate smooth-body flow separation case. This smooth-body flow separation case also gives rise to the same OFP of the fourth kind flow separation topology documented in Simmons et al. (Reference Simmons, Thomas, Corke and Hussain2022). Despite the three-dimensional nature of the separation topology, a primary focus of the work is to achieve a similarity scaling for both the mean flow and turbulence quantities. The new scaling and its relation to different stages of the flow separation is believed to play a key role in modelling turbulent separated flows and allows for further examination of the key physical effects present in such flows.
Section 2 describes the experimental apparatus, flow diagnostics and details regarding the ramp geometry. Experimental results are presented in § 3. These include global aspects of the flow development, including the characterization of unsteady aspects of the flow detachment process. Similarity scaling of both the mean flow and turbulence quantities are also presented. Section 4 provides a discussion of the results from the study.
2. Experimental facility and apparatus
2.1. Wind tunnel facility and model geometry
All experiments were performed in the Notre Dame Mach 0.6 closed-circuit wind tunnel facility. This is a large-scale, variable-speed, low-turbulence wind tunnel designed for fundamental aerodynamic research. A schematic of the wind tunnel is shown in figure 2. The wind tunnel test section has a cross-section of 0.91 m × 0.91 m (3 ft × 3 ft) and a length of 2.74 m (9 ft) and is powered by a 1750 horsepower variable-speed AC motor. The tunnel can achieve Mach 0.6 while maintaining a low free-stream turbulence intensity of approximately  $\sqrt {\overline {{u^2}} } /{U_\infty } \approx 0.05\,\%$, where u denotes the streamwise velocity fluctuation and
 ${U_\infty }$ the tunnel free-stream velocity. Chilled water supplied to turning vanes provides for a temperature-controlled environment. Further details regarding this facility are presented in Simmons (Reference Simmons2020).
Schematic of the Notre Dame Mach 0.6 wind tunnel facility.

For all the experiments reported here, the tunnel free-stream Mach number upstream of the ramp geometry was maintained at  ${M_\infty } = 0.2$ corresponding to a free-stream velocity of approximately
 ${U_\infty } = 70\;\textrm{m}\;{\textrm{s}^{ - 1}}$. The experimental geometry was designed to provide for initial TBL growth under nominally zero pressure gradient (ZPG) conditions which subsequently encounters an APG that is fully adjustable over a smooth, backward facing ramp geometry. In this manner, the streamwise extent of the smooth-body flow separation could be controlled with a fixed ramp geometry. Key aspects of the experimental geometry are shown in figure 3. On the lower half of the wind tunnel inlet contraction, an internal inlet contour is installed. The contour brings the flow smoothly from the wind tunnel inlet contraction up to a flat boundary layer development plate where the incoming flow is tripped with a 101.6 mm (4 in.) wide strip of distributed sand grain roughness with an average roughness element size of 46 μm, mounted 1.2 m (47.2 in.) upstream of the ramp leading edge. The boundary layer development plate spans the full 0.914 m (3 ft) width of the test section and is 1.462 m (57.57 in.) in streamwise length. Its top surface is raised 0.352 m (13.88 in.) above the test section floor. It allows a spanwise uniform TBL to grow under nominally ZPG conditions before reaching the ramp leading edge.
Schematic of the test section and ramp model geometry with key elements labelled.

The ramp model geometry, which forms the primary focus of the experiment, is located at the termination of the boundary layer development plate. It was designed in partnership with the CFD group at NASA Langley Research Center and consists of a fifth-order polynomial contour with zero first and second derivative conditions at both upstream and downstream ends of the geometry. The geometry of the ramp, which spans the entire width of the test section, is given by the following parametric form:
 \begin{equation}Y(X) = {a_1} + {a_2}{X^3} + {a_3}{X^4} + {a_4}{X^5},\end{equation}
where the X denotes the streamwise distance from the end of the boundary layer development plate and  $Y(X)$ is the height of the ramp, both of which are in the global coordinate system. The constants are given in terms of the ramp length, L = 0.9 m, the ramp height, H = 0.2 m and the vertical offset from the test section floor, Hoff = 0.152 m (6 in.) (shown in figure 3) as follows:
 \begin{equation}{a_1} = (H + {H_{off}}),\quad {a_2} = - 10H/{L^3},\quad {a_3} = 15H/{L^4},\quad {a_4} ={-} 6H/{L^5}.\end{equation}
The two-dimensional ramp contour is shown schematically in figure 4. It is composed of three spanwise sections, each machined in-house from aluminium blocks, formed to a tolerance of within 0.025 mm (0.001 in.), then welded together. The surface was given a final polished finish so that the seams are undetectable and hydraulically smooth.
Ramp model geometry (without the offset, Hoff).

Note that, in addition to the contoured section of the ramp, there is a flat section downstream that has a length of 0.381 m (15.0 in.). This is manufactured as part of the ramp model and provides the flow with a recovery region prior to entering the wind tunnel diffuser. Downstream of the ramp geometry, the flow smoothly transitions into the diffuser via removable contours installed on the diffuser floor. The intent of the design is to allow continuous, smooth transition from the wind tunnel inlet to the tunnel diffuser section.
On the top of the test section, a wall inlet contour smoothly transitions the flow from the inlet onto a flexible top wall insert, as shown in figure 3. This flexible insert covers most of the test section and acts as an adjustable internal ceiling. It features two rows of turnbuckles that allow a continuous modification of the imposed streamwise pressure gradient. At the end of this flexible insert (which roughly corresponds to the end of the test section) is a hinge assembly that transitions the flexible ceiling into the diffuser and (i) provides rigidity to the design and (ii) prevents feedback via the passage of flow above the flexible insert.
A photograph of the installed ramp model and adjustable ceiling contour can be seen in figure 5. There are two primary right-hand, Cartesian coordinate systems used in the data collection and data presentation of this experiment: the global and the local coordinate systems, both shown schematically in figures 5–7. The global coordinate system (X, Y, Z) has its origin at the start of the ramp and bottom mid-span of the test section. The global coordinate system is used to represent the physical geometry. The local coordinate system (x, y, z) is different for each ramp location and has the same spanwise, z, coordinate as the global coordinate system; however, its other two axes are locally wall normal, y, and wall tangent, x, with respect to the ramp surface. The origin of the local coordinate system is on the surface of the ramp geometry and is defined by a single value of the streamwise global variable, X, or the surface streamwise coordinate, xs. The angle θ as given for each local coordinate system is defined as the local wall-parallel direction, x, rotated counter-clockwise into the tunnel streamwise direction, X as shown in figures 6 and 7.
Photograph of the test section model with side tunnel door removed and the local and global coordinate systems highlighted. Note that although the global coordinate system is shown on the near side, its origin is actually along the centre-span and coincides with the same Z-location as the local coordinate system.

Side view schematic of the global (X, Y, Z) and local (x, y, z) coordinate systems with respect to the ramp geometry.

Schematic showing both the streamwise and multiple spanwise static pressure taps on the ramp surface and the global (X, Y, Z) and local (x, y, z) coordinate systems.

2.2. Flow field diagnostics
Local, wall-normal profiles of mean and fluctuating velocity along the convex ramp section were obtained non-intrusively using a two-component Dantec Dynamics Fiber Flow laser-Doppler-velocimetery (LDV) system with a Spectra Physics Stabilite 2017 Argon Ion Laser. The LDV system was chosen for its ability to unambiguously detect reverse flow (via a Bragg cell) and a high data rate (order of magnitude 10 kHz) that provides a nearly continuous analogue signal for subsequent analysis. The fibre optic LDV system was operated in 180-degree backscatter mode. The Doppler bursts were measured using a BSA F60 Flow processor and BSA Flow Software Version 6.5. The 2D 60 mm fibre optic probe with 400 mm focal length lens was traversed locally normal to the ramp surface at selected streamwise locations using a three-axis Aerotech traverse system and Unidex 11 controller. The probe measurement volume has a maximum wall-normal dimension of 0.36 mm which sets the effective spatial resolution of the measurements. For measurements in the TBL upstream of the ramp, comparison of LDV with hot-wire measurements indicated good agreement to within  ${y^ + } \approx 25\unicode{x2013}30$ of the plate surface. With the significant growth of spatial scales downstream, the flow on the ramp was essentially fully resolved by the LDV. In order to obtain near-wall measurements, the LDV probe head was tilted slightly to align the bottom beam nearly parallel to the ramp surface. This corresponds to the alignment of the wall-normal component of velocity being approximately 3°–5° from locally perpendicular (yielding the measurement to be within
 $99.6-99.8\,\%$ of the wall-normal velocity), which was deemed well within experimental uncertainty for the measurement. Particle seeding was injected wall normal to the flow at select spanwise locations via the internal inlet contour upstream of the test section in the wind tunnel inlet contraction. Comparisons of hot-wire measurements without the seeding and LDV measurements at multiple locations on the boundary layer development plate showed very good agreement and hence no influence due to the particle injection upstream of the test section. The seed particles consisted of di-ethylhexyl sebacate (DEHS) and utilized a TSI Six-Jet Atomizer 9306 high volume liquid droplet seeding generator to achieve particles of nominally 1 μm in diameter.
In cases where flow separation was not an issue and where greater wall-normal spatial resolution was required, constant-temperature hot-wire anemometry was employed. A A.A. Lab Systems AN-1003 anemometer and a conventional straight sensor probe (Auspex type AHWU-100) was used for the boundary layer surveys performed upstream of the convex ramp surface. The probe was traversed normal to the plate using a computer controlled traverse mechanism.
The required static pressure measurements were taken using two Scanivalve DSA3016 modules which incorporate 16 temperature-compensated piezoresistive pressure sensors, along with a pneumatic calibration valve. These modules have a range of 10 psid with an accuracy of 0.05 % of full scale and were used in a Scanivalve DSAENCL 3200 digital sensor array enclosure. Due to the large number of pressure taps along the ramp and boundary layer development plate (89 in total) pressure measurements were taken in three sequential groups using the Scanivalve's 31-port circular quick connectors. Each channel was sampled sequentially at 1 kHz. Pressure data are reported as a pressure coefficient defined as follows:  ${C_p} \equiv ({P_i} - {P_\infty })/({P_T} - {P_\infty })$, where
 ${P_i}$ is the local static pressure,
 ${P_\infty }$ is the free-stream static pressure and
 ${P_T}$ is the free-stream total pressure. Further details regarding the experimental diagnostics may be found in Simmons (Reference Simmons2020).
3. Experimental results
3.1. Global characteristics
The global flow field characteristics are documented in this section. These include the mean ramp streamwise and spanwise surface pressure distributions, the approach TBL characteristics upstream of the ramp and the nature and extent of the flow separation and reattachment.
3.1.1. Mean pressure distribution
Each flow separation case examined in Simmons (Reference Wallace, Eckelmann and Brodkey2020) as part of the overall benchmark study is defined by its unique tunnel ceiling position. For the smooth-body flow separation case that is the focus of this paper, the ceiling position is shown in figure 8(a) and corresponds to a downward tilt of −5.6o over the ramp surface. The resulting streamwise pressure coefficient and pressure gradient distributions are also shown in figure 8. The pressure gradient is initially mildly favourable due to the upper ceiling contour at the test section inlet, followed by a region of nominally ZPG on the boundary layer development plate upstream of the ramp. Note that the streamwise position upstream of the ramp, X = −0.56 m, was selected to define the initial inflow conditions. Mean velocity profiles taken there using constant-temperature hot-wire anemometry showed both spanwise uniformity and canonical ZPG TBL characteristics (as described in the following section). After an initial favourable pressure gradient distribution over the leading edge of the ramp, an APG commences near X = 0.2 m. Around X = 0.5 m the pressure distribution becomes comparatively flat and this will be shown in § 3.1.3 to approximate the location of the onset of flow detachment.
(a) Wind tunnel flexible ceiling configuration and (b) the corresponding centreline pressure coefficient (blue symbols) and pressure coefficient gradient (red symbols) distributions.

In order to ensure a spanwise uniform static pressure distribution, arrays of spanwise pressure taps were installed on both the ramp and downstream recovery regions. Spanwise arrays at seven streamwise locations were used with five pressure taps per array covering approximately the central third of the ramp, as shown previously in figure 7. At the start of each wind tunnel entry, the spanwise pressure was measured and the ceiling adjusted until a uniform spanwise distribution was reached. The resulting spanwise static pressure distribution is shown in figure 9. Although the observed spanwise static pressure uniformity does not in any way imply two-dimensional flow, it does serve to indicate that the upper flexible tunnel ceiling was properly oriented in the spanwise direction.
Measured spanwise static pressure distributions on the ramp surface.

3.1.2. Turbulent boundary layer initial conditions
Outer-variable-scaled mean velocity profiles obtained via hot-wire anemometry at X = −0.56 m are shown in figure 10(a) and demonstrate the spanwise uniformity of the TBL upstream of the ramp. Here, and in what is to follow,  ${U_e}$ denotes the local external velocity outside the TBL as determined by near-zero
 $\partial U/\partial y$ and with turbulent stresses at free-stream values. The centre span mean velocity profile is presented in figure 10(b) and exhibits classic logarithmic law of the wall behaviour. Both the Clauser method and oil-film interferometry were used to determine the upstream local wall shear stress for inner-variable scaling. The Clauser method as well as the oil-film interferometry procedures used are detailed in chapter 2 of Simmons (Reference Simmons2020). Full documentation of the OFI procedure is also posted to the NASA Turbulence Modeling Resource web site. Table 1 summarizes the TBL parameters obtained upstream of the ramp at X = −0.56 m.
(a) Outer-variable-scaled mean velocity profiles at X = −0.56 m and (b) inner-variable-scaled mean velocity at the centre-span location showing logarithmic law-of-the-wall behaviour (solid red curve).

Measured TBL parameters at X = −0.56 m, where  $\delta ,\;{\delta ^\ast }$ and
 $\theta $, are boundary layer 99 % thickness, displacement and momentum thickness, respectively; H is shape factor;
 ${C_f}$ and
 ${u_\tau }$ are skin friction coefficient and friction velocity, respectively;
 $R{e_\theta } = {U_e}\theta /\nu $ and
 $R{e_\tau } = {u_{\; \tau }}\delta /\nu $.

3.1.3. Character of the flow separation
Despite the spanwise uniform approach TBL documented previously and the fully two-dimensional ramp geometry, the flow separation is highly three-dimensional and is followed by a spanwise uniform reattachment. The surface flow separation and reattachment topography and topology for the largest-scale separation case have been fully documented in figures 10 and 11 and the topological map of figure 16 in Simmons et al. (Reference Simmons, Thomas, Corke and Hussain2022). This surface flow topology is characterized by the ‘owl-face pattern of the fourth kind’. As noted in the introduction, this ubiquitous topology has been reported for a variety of separated flows including inclined bodies of revolution. It is demonstrated in Simmons et al. (Reference Simmons, Thomas, Corke and Hussain2022) that the imposed APG and the secondary flow associated with the sidewall–ramp juncture is responsible for the formation of this surface flow separation pattern. The work here is focused on an intermediate-scale flow separation regime that also exhibits the same surface flow separation and reattachment topology but with a detachment region somewhat smaller in streamwise spatial extent than the one considered in Simmons et al. (Reference Simmons, Thomas, Corke and Hussain2022).
Flow field measurements were acquired via LDV and serve to characterize the streamwise development of the mean flow and turbulent stresses. However, due to the three-dimensionality of the surface flow separation, profiles were obtained at multiple spanwise locations in order to also characterize the degree of spanwise variation in the streamwise flow development. In particular, the streamwise evolution of the mean flow and turbulent stresses were obtained at three different spanwise measurement locations on the ramp; one on the ramp centreline, z = 0 m, and at the two off-centre locations, z = −0.13 m and z = −0.26 m, which can be expressed equivalently as z/S = 0, z/S = −0.28 and z/S = −0.56, respectively, where the model semi-span, S = 0.4572 m (1.5 ft). These profile locations, and their relation to the surface flow topography, are depicted as red dashed lines in figure 11. It can be seen from figure 11 that the LDV measurements at z = 0 m and z = −0.26 m qualitatively bound the extent of the primary separation vortex. Note that the off-centre locations are selected such that they capture the spanwise variation in the flow produced by the primary vortical flow separation structures, yet still remain in the central region, thereby avoiding the direct influence of sidewall separation structures. The relative spatial scale of these sidewall separation structures is shown in figures 10, 11 and 16 of Simmons et al. (Reference Simmons, Thomas, Corke and Hussain2022).
The local wall-normal coordinate system and the three spanwise locations of the LDV measurements overlaid on surface fluorescent oil flow visualization.

The significance of surface curvature in a given smooth-body flow separation is usually expressed in terms of the ratio of the local boundary layer thickness, δ, to the local radius of curvature, R, and this is shown in figure 12 for the centre-span location. Here, convex curvature is denoted as positive and concave curvature as negative. The leading edge of the ramp exhibits zero curvature followed by a region of convex curvature from X = 0 m to X = 0.45 m and concave curvature from X = 0.45 m to X = 0.9 m. The half-way point, X = 0.45 m, exhibits zero curvature as does the trailing edge and all locations downstream of the ramp. Figure 12 shows that in the convex region, the local boundary layer thickness approaches 3.3 % of the radius of curvature, while in the concave region downstream it surpasses 11 %, due to the thickening of the separating boundary layer.
(a) Ramp model geometry. (b) Ratio of local boundary layer thickness to local ramp surface radius of curvature.

The flow separation process will first be examined in terms of the mean flow detachment and reattachment (i.e. what is often simply reported as ‘the separation region’), after which unsteady aspects related to flow separation will be examined based upon the fraction of time the near-wall flow is directed downstream.
Mean flow detachment and reattachment locations were determined by estimation of the streamwise location along the ramp where the mean streamwise velocity profile first exhibited zero mean strain rate at the wall,  ${\textrm{(d}U/\textrm{d}y)_{y = 0}} = 0$, and for which a linear interpolation between sequential boundary layer mean velocity profiles was used. This was done for each of the three spanwise locations shown in figure 11. Mean flow detachment and reattachment locations are presented in table 2. Spanwise variations in the detachment location range from X = 0.56 m to X = 0.49 m while variation in the reattachment location is comparatively small and ranges only from X = 0.73 m to X = 0.75 m. The spatial extent of the flow separation as a percentage of the ramp length varies from 19 % at the centre-span to 30 % at z = −0.26 m.
Mean flow detachment and reattachment.

Simpson (Reference Simpson1981) notes that flow detachment cannot simply be viewed as ‘vanishing surface shearing stress or flow reversal’. Instead, another method of examining the separation process from the perspective of the time-mean fraction of time the near-wall flow moves downstream, γp, was described. Here, γp = 1 corresponds to the near-wall flow constantly being directed downstream, and γp = 0 corresponds to the flow being directed totally upstream. The first sign of flow reversal, γp = 0.99, corresponds to ‘incipient detachment’ (ID). Flow reversal occurring 20 % of the time, γp = 0.8, corresponds to ‘intermittent transitory detachment’ (ITD). Flow reversal occurring 50 % of the time, γp = 0.5, corresponds to ‘transitory detachment (TD)’, which will be the same as detachment if the velocity probability distribution is Gaussian. Hence, to show that flow detachment is indeed a dynamic process that evolves in the streamwise direction, the fraction of time the near-wall flow moves downstream, γp, must be examined. Here, γp is calculated as
 \begin{equation}{\gamma _p} \equiv \frac{{{N_{u > 0}}}}{N},\end{equation}
where N is the number of valid LDV samples and  ${N_{u > 0}}$ is the number of event outcomes where the near-wall instantaneous streamwise velocity sample is directed downstream. The ‘near-wall’ data used are from LDV measurements taken approximately 0.4 mm off the ramp surface, corresponding to approximately the lower 1 % of the local boundary layer thickness. Note that the fraction of downstream flow,
 ${\gamma _p}$, as defined in (3.1) is based upon the number of samples headed downstream instead of the fraction of time the flow moves downstream. For a uniform sampling rate, this would be identical to the fraction of time the flow is headed downstream; however, the sampling rate of LDV cannot be controlled by the user, but is instead a function of the frequency of valid bursts, as defined by the flow processor. Figure 13 shows the various states of detachment, as a function of the streamwise and spanwise extent.
Streamwise variation in γp for the three spanwise locations on the ramp. Dashed lines highlighting ID, γp = 0.99, ITD, γp = 0.8 and TD, γp = 0.5. Symbol size denotes ±95 % uncertainty confidence levels in the γp values.

The ID first occurs near X = 0.35 m for the outer, z = −0.26 m, profile and X = 0.4 m for the centreline, z = 0 m, profile. Farther downstream, ITD and TD follow with the three-dimensionality of the detachment process becoming apparent from the offset between the three data sets. ITD occurs near X = 0.44 m for the z = −0.26 m location and near X = 0.47 m for z = 0 and −0.13 m cases. Transitory detachment occurs near X = 0.49 m for z = −0.26 m and near X = 0.55 m for the z = 0 and −0.13 m cases. TD is approximately the same as detachment as seen by comparing figure 13 with table 2 which is consistent with the Gaussian character of the measured  ${\gamma _p}$ probability distributions.
While the spanwise-averaged mean separation extent indicated in table 2 is approximately 24 % of the ramp length, this only tells part of the story. The unsteady separation extent, taken as the streamwise extent over which γp < 1, is much larger than its mean counterpart, at 48 % – approximately twice the size, as highlighted in figure 13. It is also apparent that γp never drops to zero in the separation zone, indicating that there is no location in the measurement region with backflow present at all times. This is not surprising as other TBL flow separation experiments (e.g. Ashjaee & Johnston Reference Ashjaee and Johnston1980; Simpson, Strickland & Barr Reference Simpson, Strickland and Barr1977) exhibited similar phenomena with γp never reaching zero.
Figure 13 also shows, that in contrast with the spanwise variation in detachment locations, TR, ITR and reattachment are largely spanwise invariant which is evidence of the spanwise uniform nature of reattachment process.
Since the streamwise pressure gradient is often thought of as the primary driver for the flow development, and ultimately provides the condition for it to separate, it is not surprising that it can be analysed to predict detachment and reattachment. Studies by Simpson et al. (Reference Simpson, Strickland and Barr1977) and Alving & Fernholz (Reference Alving and Fernholz1996) conducted on a reportedly two-dimensional TBL separation noted that detachment occurs at a local minimum in the streamwise pressure gradient.
For the experiment under consideration here, figure 14 presents the locations of TD and TR (i.e. the  ${\gamma _p} = 0.5$ locations) and the locations of ID (
 ${\gamma _p} = 0.99$) and full reattachment (
 ${\gamma _p} = 1.0$) relative to
 ${C_p}(X)$,
 $\textrm{d}{C_p}/\textrm{d}\kern0.7pt x$ and
 ${\textrm{d}^2}{C_p}/\textrm{d}{X^2}$ at the ramp centre-span location. As in the previously cited references, the transitory detachment location is shown to occur at a local minimum in
 $\textrm{d}{C_p}/\textrm{d}\kern0.7pt x$. Furthermore, the subsequent local maximum in
 $\textrm{d}{C_p}/\textrm{d}\kern0.7pt x$ is shown to correspond to the location of transitory flow reattachment. In the work of Alving & Fernholz (Reference Alving and Fernholz1996) reattachment also appears in close proximity to the local maximum in streamwise pressure gradient although this aspect was not identified by the authors. In this study, ID is shown to correlate well with a local minimum in
 ${\textrm{d}^2}{C_p}/\textrm{d}{X^2}$. The flow transitions to fully attached (
 ${\gamma _p} = 1.0$) at the second local minimum in
 ${\textrm{d}^2}{C_p}/\textrm{d}{X^2}$. This is the location where
 ${C_p}(X)$ peaks as it switches from mildly adverse to mildly favourable. The conclusions derived from this experimental work regarding correlations between the pressure distribution (and gradient distributions) and the degree of detachment, also show excellent agreement with the experimental studies of both Alving & Fernholz (Reference Alving and Fernholz1996) and Debien et al. (Reference Debien, Aubrun, Mazellier and Kourta2014). While no claims will be made on its general universality, it is apparent that for the smooth-body flow separation examined here, the pressure distribution alone with adequate spatial resolution would be enough to accurately determine the various detachment and reattachment locations.
Locations of  ${\gamma _p}$ values relative to (a)
 ${C_p}(X)$, (b)
 $\textrm{d}{C_p}/\textrm{d}\kern0.7pt x$ and (c)
 ${\textrm{d}^2}{C_p}/\textrm{d}{X^2}$. Here,
 $\textrm{d}{C_p}/\textrm{d}\kern0.7pt x$ and
 ${\textrm{d}^2}{C_p}/\textrm{d}{X^2}$ are made non-dimensional by the ramp height H. These
 ${\gamma _p}$ values correspond to ID (
 ${\gamma _p} = 0.99$) and full reattachment, (FR,
 ${\gamma _p} = 1$); transient detachment (TD,
 ${\gamma _p} = 0.5$) and transient reattachment (TR,
 ${\gamma _p} = 0.5$).

3.2. Mean flow development and scaling
In this section consideration is given to the streamwise evolution and scaling of the mean flow on the ramp at the three spanwise locations shown previously in figure 11.
The streamwise evolution of mean flow profiles is shown in physical variables in figure 15. As described in § 3.1.2, over the boundary layer development plate, the profiles exhibit canonical ZPG TBL characteristics (shape factor H = 1.3) and are uniform in spanwise extent. The first significant spanwise deviation in the profiles occurs over the ramp at X = 0.4 m – corresponding to the onset of ID. From this point onward, the outer profile taken at z = −0.26 m shows a larger velocity deficit while the two inner profiles, at z = 0 m and z = −0.13 m continue to show excellent overlap. This suggests that the mean flow along the central third of the ramp is largely spanwise uniform with three-dimensional effects only occurring closer to the tunnel sidewall. The last group of profiles, taken for  $X \ge \; 0.8\;\textrm{m}$, correspond to reattached flow with the near-wall boundary layer beginning to become spanwise uniform again and the magnitude of the outer velocity deficit of the Z = −0.26 m profile reduced.
Streamwise evolution of wall-normal profiles of mean streamwise velocity showing the spanwise variation for flow on the ramp and continuing through separation, reattachment and recovery, X = 0.95 m.

As is typical of an APG TBL, the mean profiles develop two inflection points with the location of the outer inflection point moving away from the wall and the inner toward the wall with downstream distance. It can be shown via the Rayleigh–Fjortoft theorem (Drazin Reference Drazin2002) that the outer inflection point is inviscidly unstable while the inner inflection point is stable. This inviscid Kelvin–Helmholtz instability of the outer inflection point gives rise to the formation of an ESL that is responsible for the development and growth of an outer turbulence peak as described in Schatzman & Thomas (Reference Schatzman and Thomas2017). Based on their measurements, they postulated that an ESL is a dominant driver for turbulent APG flow development and this motivated them to employ shear layer scaling parameters on an attached spatially and temporally varying APG TBL flow. In addition to applying this so-called ESL scaling to their own experiments with success, they examined its universality by applying the scaling to the constant APG TBL flows of Marusic & Perry (Reference Marusic and Perry1995) as well as twenty-five flows compiled by Coles & Hirst (Reference Coles and Hirst1969) from the AFOSR-IFP-Stanford Conference. In each case, the ESL scaling was successful in collapsing the data sets. In what follows ESL scaling is first applied to the mean velocity profiles shown previously in figure 15.
The ESL scaling involves free shear layer parameters as illustrated in figure 16. The length scale used is the ESL vorticity thickness defined as
 \begin{equation}{\delta _\omega } \equiv \frac{{{U_d}{)_{IP}}}}{{{{\left( {\dfrac{{\textrm{d}U}}{{\textrm{d}y}}} \right)}_{IP}}}},\end{equation}
where the subscript IP denotes the quantity is to be evaluated at the outer inflection point.  ${U_d}{)_{IP}}$ denotes the velocity defect at the outer inflection point
 \begin{equation}{U_d}{)_{IP}} \equiv {U_e} - {U_{IP}},\end{equation}
where  ${U_e}$ denotes the local external free-stream velocity just outside the boundary layer. Using these parameters, the scaled wall-normal spatial coordinate is given by
 \begin{equation}\eta \equiv \frac{{y - {y_{IP}}}}{{{\delta _\omega }}}\end{equation}
and the scaled mean velocity,  ${U^\ast }$, is
 \begin{equation}{U^\ast } \equiv \frac{{{U_e} - U}}{{{U_d}{)_{IP}}}}.\end{equation}
Illustration of the ESL scaling parameters.

Figure 17 presents the inflectional mean velocity profiles obtained at the centre-span location (z = 0 m) and the spanwise locations z = −0.13 m and z = −0.26 m, in terms of both conventional outer-variable scaling and ESL scaling. In contrast to the outer-variable scaling, the ESL scaling is shown to give rise to a tight collapse of all the profiles over the full range of streamwise locations extending from initiation of inflectional profiles and through separation and reattachment. Over a large wall-normal extent, the self-similar profiles are well approximated by the relation
 \begin{equation}{U^\ast } = 1 - \textrm{tanh}(\eta ),\end{equation}
with the largest deviation occurring near the wall, which it must in order to satisfy the no-slip boundary condition. As in the centre-span location case, at both spanwise locations (figure 17b,c) the ESL scaling also provides a self-similar collapse of the mean velocity profiles over the same streamwise range examined in figure 17(a). This, despite the spanwise variation in separation location associated with the three-dimensional flow separation topography. The self-similar collapse of the mean flow profiles with ESL scaling speaks to the dominant role the ESL plays in governing the flow physics.
Inflectional mean velocity profiles in outer-variable scaling (a–c) and ESL scaling (d–f) at (a,d) z = 0 m (centre span); (b,e) z = −0.13 m; and (c,f) z = −0.26 m.

The ESL spatial growth rate,  $\textrm{d}{\delta _\omega }/\textrm{d}\kern0.7pt x$, is constant with
 ${\delta _\omega }$ varying linearly with streamwise distance. As an example, figure 18 presents the variation of
 ${\delta _\omega }$with X for the centre-span location. The linear growth of
 ${\delta _\omega }$ is apparent and is comparable to values reported for canonical free shear layers (e.g. Thomas Reference Thomas1991). Figure 18 is also representative of the streamwise variation of
 ${\delta _\omega }$ at the other spanwise locations (Simmons Reference Simmons2020).
The ESL vorticity thickness variation with X at z = 0 m (centre span).

3.3. Turbulent stress development and scaling
The streamwise development of Reynolds shear stress profiles for  $0.35\;\textrm{m} \le X \le 0.75\;\textrm{m}$ at the ramp centre-span location is presented in conventional outer-variable scaling in figure 19. This covers the streamwise range from just downstream of the initial formation of the outer mean velocity inflection point (
 $0.3\;\textrm{m} < X < 0.35\;\textrm{m}$) to just upstream of transitory reattachment (
 ${\gamma _p} = 0.5$ at X = 0.76 m). Also shown is the locus of points characterizing the streamwise variation of the wall-normal position of the maximum Reynolds shear stress. The inviscid instability associated with the outer inflection point that forms in the APG TBL gives rise to the development of the outer Reynolds stress peak whose magnitude and wall-normal location are shown to grow with streamwise distance, reaching a maximum distance from the wall near X = 0.65 m (downstream of transient detachment). Beyond this point the peak Reynolds stress continues to grow but the wall-normal location moves closer toward the wall.
Streamwise development of the outer-variable-scaled Reynolds shear stress profiles and the locus of points associated with  $- {\overline {uv} _{max}}/U_e^2$ at the ramp centre-span location.

The wall-normal location of the turbulent stress peak initially tracks the mean profile outer inflection point (e.g. Elsberry et al. Reference Elsberry, Loeffler, Zhou and Wygnanski2000; Schatzman & Thomas Reference Schatzman and Thomas2017). This aspect is shown in figure 20 which compares centre-span mean velocity, streamwise-component turbulence intensity and Reynolds shear stress profiles obtained at X = 0.45 m. This location is just upstream of ITD (γp = 0.8) and downstream of the initial formation of an inflectional mean velocity profile at  $0.3\;\textrm{m} < X \le 0.35\;\textrm{m}$. Note that the local peak values of both turbulence intensity and Reynolds stress align with the outer mean velocity profile inflection point which provides evidence of the formation of an ESL. This is further confirmed by comparison of the inflectional mean velocity profile and profiles of quadrant 2 (Q2) and quadrant 4 (Q4) Reynolds stresses at X = 0.45 m shown in figure 21. The quadrant splitting method of Willmarth & Lu (Reference Willmarth and Lu1972) and Wallace, Eckelmann & Brodkey (Reference Wallace, Eckelmann and Brodkey1972) using a ‘hyperbolic hole’ size of
 ${\alpha _q} = 2$ was used to obtain the Q2 and Q4 Reynolds stress profiles. Note that the Q2 Reynolds stress peaks just above the inflection point while Q4 peaks just below. This is fully consistent with the formation of coherent spanwise vorticity associated with the ESL development as depicted schematically in figure 21.
(a) Outer-variable-scaled profiles of mean velocity, (b) streamwise-component turbulence intensity and (c) Reynolds stress at X = 0.45 showing the alignment of peak turbulent stresses with the outer inflection point.

Comparison of (a) the mean velocity profile at X = 0.45 m with (b) quadrant 2 and quadrant 4 Reynolds stress profiles at the same location.

Figure 22(a) presents centre-span Reynolds shear stress profiles for  $0.35\;\textrm{m} \le X \le 0.5\;\textrm{m}$ using ESL scaling. These streamwise locations are between initial formation of the outer mean velocity inflection point and just upstream of TD,
 ${\gamma _p} = 0.5$ (as shown in figure 13). In addition, X = 0.45 m represents the location at which the ramp surface curvature changes from convex to concave (figure 12). Using ESL scaling, the Reynolds shear stress profiles show a self-similar collapse with a scaled peak value of
 $- \overline {uv} {)_{peak}}/U_d^2{)_{ip}} \approx 0.009$. Note that the peak Reynolds shear stress occurs at η = 0 corresponding to the outer mean velocity inflection point and also scales with the velocity defect,
 ${U_d}{)_{ip}}$, at the inflection point. It is noted that Schatzman & Thomas (Reference Schatzman and Thomas2017) performed ESL scaling of the constant APG TBL flow 10APG of Marusic & Perry (Reference Marusic and Perry1995) where self-similar Reynolds stress profiles were also obtained with a peak value of
 $- \overline {uv} {)_{peak}}/U_d^2{)_{ip}} \approx 0.011$.
(a) Self-similar Reynolds shear stress profiles obtained using ESL scaling. (b) Self-similar streamwise-component turbulence intensity profiles obtained using ESL scaling.

Figure 22(b) presents the corresponding profiles of streamwise-component turbulence intensity using the same ESL scaling. As expected, these also show self-similar behaviour over the same range of streamwise locations. The scaled peak turbulence intensity is  $\sqrt {\overline {{u^2}} } /{U_d}{)_{ip}} \approx 0.019$ and also occurs at η = 0. In comparison, the ESL scaling of the Flow 10APG of Marusic & Perry (Reference Marusic and Perry1995) showed
 $\sqrt {\overline {{u^2}} } /{U_d}{)_{ip}} \approx 0.021$. It should be noted that the results shown in figure 22(a,b) are also representative of the results obtained by applying ESL scaling to the turbulent stress profiles at the two other spanwise measurement locations.
3.4. A modified embedded shear layer scaling
For streamwise locations downstream of X = 0.5 m, corresponding to both onset of flow TD ( ${\gamma _p} = 0.5$) and significant concave ramp surface curvature (figure 12), the ESL scaling shown above no longer provides self-similar turbulent stress profiles. As an example, figure 23 compares the previously presented ESL-scaled Reynolds shear stress profiles with that at X = 0.55 m which is at the location of TD. The ESL scaling now fails to collapse the Reynolds shear stress profiles, particularly on the low-speed side of the shear layer. Farther downstream, the ESL-scaled peak turbulent stress levels grow with streamwise distance and their wall-normal location consistently falls below the mean velocity outer inflection point. In what follows a ‘modified ESL scaling’ is applied that is shown capable of providing self-similarity of turbulent stress profiles for this region of the flow.
Example of the breakdown of ESL scaling of Reynolds shear stress at the location of TD (γp = 0.5).

For the centre-span (z = 0 m) location, figure 24 presents the streamwise variation in the local wall-normal positions of both the mean velocity outer inflection point and peak Reynolds shear stress. In this figure, the wall-normal location of the inflection point represents the central location of the ESL relative to the ramp surface. As shown previously in the ESL-scaled Reynolds shear stress profiles of figure 22(a), the inflection point and peak Reynolds shear stress locations initially coincide as expected due to the inflectional instability leading to the formation of the ESL vorticity. However, beyond X = 0.5 m the wall-normal location of peak Reynolds shear stress begins to consistently fall below the mean velocity inflection point. Although not presented here, the same is true for the wall-normal locations of the turbulent normal stresses. ITD ( ${\gamma _p} = 0.8$) commences near X = 0.45 m (figure 13) as does the transition from convex to concave surface curvature (figure 12). Figure 24 shows that the disparity between the wall-normal locations of the inflection point and peak Reynolds shear stress begins to grow beyond X = 0.5 m. It is also clear from figure 24 that the wall-normal location of peak Reynolds stress continues to track that of the shear layer infection point but, due to turbulent transport, no longer fully aligns with it. At X = 0.66 m, where the near-wall flow is being directed upstream most of the time, (i.e.
 ${\gamma _p}$ obtains its minimum value of 0.3) the deviation between the wall-normal location of the inflection point and peak Reynolds shear stress is
 ${y_{{{\overline {uv} }_{\max }}}}/{y_{ip}} = 0.85$. The outer inflection point reaches its maximum wall-normal location prior to flow transient reattachment at X = 0.74 m, where
 ${\gamma _p} = 0.5$. At this location, the Reynolds shear stress peak reaches its maximum wall-normal location as well and
 ${y_{{{\overline {uv} }_{\max }}}}/{y_{ip}} = 0.81$. Downstream of this location, the inflection point and maximum Reynolds shear stress both move back toward the wall. Figure 24 may broadly be divided into two regions. For
 $X \le 0.5\;\textrm{m}$ the flow is characterized by the formation of the ESL due to the inflectional instability of the APG TBL and the wall-normal location of peak turbulent stresses coincides closely with the inflection point. For locations beyond X = 0.5 m and TD (
 ${\gamma _p} = 0.5$) the wall-normal locations of both the inflection point and turbulent stress peaks both move away from the wall but
 ${y_{{{\overline {uv} }_p}}}/{y_{ip}} < 1$. The difference in the wall-normal locations of the peak turbulent stresses from the mean profile inflection point has also been observed in other related flow separation experiments. In their study of a separating, reattaching, and recovering TBL developing over a rounded backward facing step, Song & Eaton (Reference Song and Eaton2004a) scaled the turbulent normal and shear stresses using the mean profile inflection point. While they did not point out the extent of the deviation of the turbulent stress peak from the inflection point, examine its streamwise variation or draw attention to it, analysis of their data shows that most of it falls into the range of
 ${y_{u{u_{peak}}}}/{y_{ip}} \approx 0.7\unicode{x2013}0.8$ – comparable to the
 ${y_{u{v_{peak}}}}/{y_{ip}} = 0.86$ average value observed here.
The wall-normal locations of the mean velocity outer inflection point and the peak Reynolds shear stress (relative to particular  ${\gamma _p}$ values) for the centre-span location z = 0 m.

Figure 25 compares the mean velocity outer inflection point wall-normal location with the location of peak Reynolds stress, as well as peak Q2 and Q4 Reynolds stresses at X = 0.7 m, a location which is midway between the locations of  ${\gamma _{pmin}}$ and transient reattachment. Again, a ‘hyperbolic hole’ size of
 ${\alpha _q} = 2$ was used for the quadrant splitting measurements. As was the case at X = 0.45 m, figure 25 also shows that the peak Reynolds stress wall-normal location corresponds to where the ejection (Q2) and sweep (Q4) Reynolds stresses take on equal values. However, at X = 0.7 m, this is now located below the mean velocity inflection point. Note also that, unlike at X = 0.45 m where the Q2 and Q4 Reynolds shear stress peaks were approximately equal, the Q2 Reynolds stress peak is now approximately 47 % greater than the Q4 peak at X = 0.7 m. The dominance of the Q2 Reynolds stress peak value and its alignment with the mean velocity inflection point was found to be true at all streamwise locations downstream of TD,
 ${\gamma _p} = 0.5$. This suggests that the wall-normal transfer of low-speed fluid away from the wall by the shear layer large-scale vorticity is responsible for the dominance of the Q2 Reynolds stress.
Comparison of the location of the mean velocity outer inflection point with peak Reynolds shear stress, and peak Q2 and Q4 Reynolds shear stresses at X = 0.7 m.

If one concludes from figure 24 that the ESL large-scale vortices, once formed, no longer fully track the ramp surface over the region of concave curvature and flow separation, the observed growth in ESL-scaled peak turbulent stresses over this region might be due to the effect of a wall-normal coordinate rotation. To investigate this, a coordinate rotation can be applied that rotates the local wall-normal coordinate system back to the original orientation at the zero-curvature location of X = 0.45 m as shown in the bottom part of figure 26(a). Taking the local Reynolds stress downstream of X = 0.45 m and rotating the coordinate system back through an angle  $\theta $, the Reynolds stress in the rotated coordinate frame (figure 26b) is then given by
 \begin{equation}{\overline {uv} _{rotate}} = {\textstyle{1 \over 2}}(\overline {{u^2}} - \overline {{v^2}} )\,\textrm{sin}(2\theta ) + \overline {uv} \,\textrm{cos}(2\theta ).\end{equation}
To explore the effect of this coordinate rotation on the Reynolds stress, figure 26(a) compares Reynolds stress profiles (in physical variables) obtained at X = 0.45 m and X = 0.6 m. Equation (3.7) is applied to the  $\overline {uv} $ profile at X = 0.6 m which is shown in the figure in both the original and rotated frame. While the downstream profile has widened in its wall-normal extent, remarkably after applying the coordinate rotation, the peak Reynolds shear stress now exactly matches that occurring at X = 0.45 m.
(a) Comparison of Reynolds stress profiles obtained at X = 0.45 m and X = 0.6 m in the wall-normal and rotated frames. (b) The rotated velocity components with respect to local x–y coordinates are shown along with the original velocity components.

If this coordinate rotation process is repeated for all centre-span Reynolds stress profiles ranging from X = 0.50 m to X = 0.8 m, figure 27(a,b), shows the same remarkable result – the magnitude of peak turbulent shear stress in each case remains approximately constant. This would seem to confirm that the ESL large-scale vorticity is not tracking the wall in the concave region but instead is being advected downstream, with the wall curving up toward it. This is not surprising given that most of these streamwise locations are downstream of transient detachment  $({\gamma _p} = 0.5)$ and the shear layer is located above a concave surface. Another way to picture this is to imagine the ramp surface tangent at X = 0.45 m extending linearly downstream (shown as the zero-curvature extension in figure 26a) as the approximate path followed by the shear layer vortices.
Comparison of Reynolds stress profiles in physical variables in (a) the local wall-normal coordinate frame and (b) in the frame rotated with that corresponding to onset of concave curvature and intermittent transient detachment.

In this scenario, the peak turbulent stresses simply follow the zero-curvature extension with the magnitude of the Reynolds shear stress essentially frozen over this streamwise fetch. That the magnitude of the Reynolds shear stress is effectively frozen is due to the fact that the characteristic turbulence time scale,  ${\delta _\omega }/{k^{1/2}}$, compared with that associated with the inverse mean strain rate
 ${(\textrm{d}U/\textrm{d}y)^{ - 1}}$ is a full order of magnitude larger. Hence, the response of the turbulence is quite slow in comparison with the time scale for the reduction of the mean rate of strain across the shear layer in this region (Sbra Reference Sbra1996).
In order to account for the effect of the ESL encountering both concave ramp curvature and the separated flow region, the ESL wall-normal coordinate was modified. A new scaled wall-normal ‘outer’ coordinate is defined as,
 \begin{equation}{\eta _o} \equiv \frac{{(y - {y_{{{\overline {uv} }_p}}}){{\left( {\dfrac{{\textrm{d}U}}{{\textrm{d}y}}} \right)}_{ip}}}}{{({U_e} - {U_{ip}})}} = \frac{{(y - {y_{{{\overline {uv} }_p}}})}}{{{\delta _{\omega o}}}},\end{equation}
where  ${y_{{{\overline {uv} }_p}}}$ denotes the wall-normal location of the peak Reynolds shear stress and subscript ip the location of the outer mean velocity inflection point. Note that this is similar to the ESL scaling shown in (3.4) with the exception that the reference wall-normal location is no longer the mean profile inflection point. In effect, it utilizes a normalizing outer vorticity thickness of
 ${\delta _{\omega o}} \equiv ({U_e} - {U_{ip}})/{(\textrm{d}U/\textrm{d}y)_{ip}}$. Equation (3.8) is valid for
 ${\eta _o} > 0$. In a similar manner, a scaled inner wall-normal coordinate is defined by
 \begin{equation}{\eta _i} \equiv \frac{{(y - {y_{{{\overline {uv} }_p}}}){{\left( {\dfrac{{\textrm{d}U}}{{\textrm{d}y}}} \right)}_{ip}}}}{{{U_{ip}}}} = \frac{{(y - {y_{{{\overline {uv} }_p}}})}}{{{\delta _{\omega i}}}}, \end{equation}
and is valid for  ${\eta _i} \le 0$. It utilizes an inner normalizing vorticity thickness length scale given by
 ${\delta _{\omega i}} \equiv {U_{ip}}/{(\textrm{d}U/\textrm{d}y)_{ip}}$. The difference in inner and outer vorticity thicknesses,
 ${\delta _{\omega o}}$ and
 ${\delta _{\omega i}}$, used in this scaling, will account for the loss of cross-stream symmetry of the ESL development as it encounters and interacts with both the flow separation and the concave curvature of the ramp wall downstream of X = 0.45 m. The flow physics below the outer inflection point is influenced by both
 ${U_{ip}}$ and
 ${u_\tau }$, and because
 ${u_\tau } \ll {U_{ip}}$, it can be neglected for the purpose of scaling.
The Reynolds shear stress profiles in the rotated frame normalized by  $U_{ip}^2$ and with the modified wall-normal ESL scaling described above applied provides for a tight self-similar collapse over the region of concave ramp curvature, as shown in figure 28(a). In the same manner, profiles of the streamwise-component turbulence intensity plotted using the modified ESL scaling for
 $0.5\;\textrm{m} \le X \le 0.75\;\textrm{m}$ are presented in figure 28(b). Again, the modified scaling yields turbulence intensity profiles exhibiting self-similar collapse over the region for which the ESL encounters concave ramp curvature and flow separation.
(a) Modified ESL scaling of Reynolds stress profiles in the rotated frame for  $0.5\;\textrm{m} \le X \le 0.75\;\textrm{m}$ showing self-similar collapse. (b) Modified ESL scaling of streamwise-component turbulence intensity profiles for
 $0.5\;\textrm{m} \le X \le 0.75\;\textrm{m}$.

Figure 29 shows modified ESL scaling of the Reynolds stress profiles for  $0.7\;\textrm{m} \le X \le 0.8\;\textrm{m}$. The location X = 0.8 m corresponds to ITR (
 ${\gamma _p} = 0.8$). Note that at this location, self-similarity is preserved for
 ${\eta _o} > 0$ but is lost for
 ${\eta _i} < 0$. This indicates that similarity is lost as the low-speed side of the ESL begins to encounter the concave ramp surface near reattachment.
Modified ESL scaling of Reynolds shear stress profiles showing a breakdown in self-similar collapse on the low-speed side of the ESL for  $X \ge 0.8$ m (
 ${\gamma _p} \ge 0.8$).

This aspect is further confirmed by figure 30 which shows, to scale, the ramp surface along with the locus of points defining the wall-normal locations of the outer mean velocity inflection point,  ${y_{ip}}$, peak Reynolds stress,
 ${y_{{{\overline {uv} }_p}}}$, peak Reynolds stress with the added normalizing outer vorticity thickness,
 ${y_{{{\overline {uv} }_p}}} + {\delta _{\omega o}}$ and peak Reynolds stress with normalizing inner vorticity thickness subtracted,
 ${y_{{{\overline {uv} }_p}}} - {\delta _{\omega i}}$. This figure shows that loss of self- similarity using the modified ESL scaling commences for those locations where
 ${y_{{{\overline {uv} }_p}}} - {\delta _{\omega i}}$ would lie below the ramp surface.
Wall-normal locations of the mean velocity inflection point,  ${y_{ip}}$, peak Reynolds stress,
 $\; {y_{{{\overline {uv} }_{max}}}}$,
 $\; {y_{{{\overline {uv} }_{max}}}} + {\delta _{\omega o}}$,
 $\; {y_{{{\overline {uv} }_{max}}}} - {\delta _{\omega i}}$ relative to the ramp surface showing shear layer contact with lower surface near X = 0.8 m. The shaded blue near-wall region denotes the mean centre-span separation region.

Despite the three-dimensional nature of the flow separation shown in figure 11, the flow reattachment is highly two-dimensional as suggested earlier in figure 13. To further highlight this aspect, figure 31, which is adapted from Simmons et al. (Reference Simmons, Thomas, Corke and Hussain2022), shows fluorescent oil surface flow visualization where a blue solution was placed in the separated flow region and a green solution was placed just downstream from the reattachment region. Remarkably, after one-hour of run time, there is almost no mixing of the two solutions, thereby indicating both the spanwise uniformity of the flow reattachment and its temporal stability. A physical explanation for this surprisingly strong degree of two-dimensionality in reattachment is that it is associated with the shear layer impingement on the ramp surface as shown in figure 30. The shear layer instability amplitude exhibits an initial exponential spatial growth rate such that the effect of the spanwise variation in upstream detachment location becomes largely irrelevant by the reattachment location.
Two-dimensionality of the flow reattachment, captured using two different coloured ultraviolet illuminating surface flow solutions. The incoming flow is from left to right. Adapted from Simmons et al. (Reference Simmons, Thomas, Corke and Hussain2022).

Finally, for those streamwise locations downstream of ITR ( ${\gamma _p} = 0.8$) and for which the concave curvature becomes quite small (figure 12), the modified ESL scaling is again applied but without any local coordinate rotation and is found capable of obtaining tight self-similar collapse of profiles of Reynolds shear stress as shown in figure 32(a) and streamwise-component turbulence intensity shown in figure 32(b). The use of the modified ESL scaling involving inner and outer vorticity thickness length scales for these reattached flow streamwise locations accounts for the cross-stream asymmetry of the shear layer that results as a consequence of the upstream flow separation and surface curvature history. This is evident from the asymmetry about η = 0 of the scaled turbulent stress profiles shown in figure 32.
(a) Modified ESL scaling of the unrotated Reynolds stress for streamwise locations downstream of flow reattachment. (b) Modified ESL scaling of the streamwise-component turbulence intensity for locations downstream of flow reattachment.

4. Conclusion
In this study, an extensive set of surface and off-surface measurements are used to document the APG TBL streamwise evolution including smooth-body flow separation and reattachment. The experiments were conducted over a fully two-dimensional ramp model geometry of length L = 0.9 m and width W = 0.9144 m. The approach Mach number was fixed at  ${M_\infty } = 0.2$ and the unit Reynolds number was
 $Re\; \approx \; 4.5 \times {10^6}\textrm{/m}\;(R{e_\theta }\; \approx {10^4})$. The results presented here are a subset of a larger archival smooth-body flow separation data set that is available to the reader on the NASA Turbulence Modeling Resource web site. The results here are focused on an intermediate-scale flow separation regime that exhibits the same surface flow topology but is approximately 38 % smaller in streamwise spatial extent than the one considered in Simmons et al. (Reference Simmons, Thomas, Corke and Hussain2022).
The separation process was examined in terms of the time-mean near-wall flow direction via the detachment coefficient, γp, as proposed by Simpson (Reference Simpson1981). This characterizes the dynamical aspects of the flow detachment and reattachment process in terms of near-surface flow direction statistics. As shown in figure 14, it is demonstrated that such stages are highly correlated to the first and second derivatives of the streamwise static surface pressure coefficient profile along the ramp geometry. Transitory detachment is found to be associated with a local minimum of  $\textrm{d}{C_p}/\textrm{d}\kern0.7pt x$ and downstream transient reattachment a local maximum of
 $\textrm{d}{C_p}/\textrm{d}\kern0.7pt x$. Incipient detachment corresponding to
 ${\gamma _p} = 0.99$ and full reattachment each correlate with local minima in
 ${\textrm{d}^2}{C_p}/\textrm{d}\kern 0.06em {x^2}$. Therefore, for the smooth-body flow separation case examined here, the pressure distribution alone, given adequate spatial resolution, would suffice to accurately determine the various detachment and reattachment locations and predict local time-mean flow direction behaviour near the surface, which is dictated by the surface geometry and the imposed APG.
Extensive consideration is given to the streamwise evolution and scaling of the mean velocity, Reynolds shear stress, and streamwise turbulence intensity profiles over the ramp geometry. In particular, the ESL scaling, first proposed and implemented by Schatzman & Thomas (Reference Schatzman and Thomas2017), was applied. It was found that ESL scaling of the mean velocity profiles gave rise to their self-similar collapse from the initial location of the formation of an outer mean velocity inflection point near X = 0.35 m and extending to ITR ( ${\gamma _p} = 0.8$) at X = 0.8 m. The resulting ESL-scaled mean velocity profiles shown in figure 17 are well approximated over a large wall-normal extent by,
 $\; {U^\ast } = 1 - \textrm{tanh}(\eta )$. The tight self-similar collapse of the mean flow profiles at each of the three spanwise locations examined speaks to the dominant role the ESL plays in governing the local flow physics.
The ESL scaling was also successful in giving rise to self-similar profiles of Reynolds shear stress and streamwise-component turbulence intensity. However, this was limited to streamwise locations on the ramp between initial formation of the mean velocity profile outer inflection point and just upstream of TD  $({\gamma _p} = 0.5)$. For streamwise locations downstream of flow detachment and concave ramp surface curvature, the conventional ESL scaling failed to produce self-similar turbulence stress profiles. This was due to two factors: (i) the peak turbulent stresses no longer aligning with the mean velocity inflection point and (ii) their apparent streamwise growth due to the ESL no longer fully tracking the ramp surface in the region of concave curvature. This motivated the development of a ‘modified ESL scaling’. In the modified scaling, first, a local coordinate system rotation back to the local coordinate system fixed at the zero-curvature transition from convex to concave ramp curvature was applied, which yielded turbulent Reynolds stress peak magnitudes that are constant with streamwise development. This indicated that the turbulent stresses associated with large-scale shear layer vorticity are effectively ‘frozen’, with the observed apparent streamwise increases in scaled peak local values resulting from the rotation of the local wall-normal coordinate. This is associated with the turbulence time scale being a full order-of-magnitude larger than the time scale for reduction of the mean rate of strain across the ESL. In addition, a scaled wall-normal ‘outer’ and ‘inner’ spatial coordinate referenced to the wall-normal location of peak Reynolds stress was defined to account for the different parameters that govern the flow physics below and above the shear layer inflection point and which give rise to its cross-stream asymmetry. Quadrant splitting of the Reynolds stress showed that this asymmetry has its origin in the dominance of quadrant 2 Reynolds stress over quadrant 4. This indicates that the asymmetry results from shear layer large-scale vorticity transferring low-speed, near-wall fluid outward from the separated flow region. The modified ESL scaling utilized both inner and outer vorticity thickness length scales to account for the surface curvature/flow separation induced cross-stream asymmetry. The modified ESL scaling proved quite capable of providing self-similar turbulent stress profiles over the full streamwise extent of flow separation. The similarity scaling was shown to eventually fail on the low-speed side of the shear layer due to its eventual contact with the wall near ITR
 $({\gamma _p} = 0.8)$. The results presented in figures 29 and 30 suggest that the reattachment is directly associated with the shear layer impingement on the ramp surface. This further suggests that the difficulty CFD has shown in accurately capturing the reattachment location in smooth-body flow separation may be associated with the need to accurately capture the role of turbulent transport associated with the large-scale shear layer vorticity of the ESL.
Downstream of reattachment the modified ESL scaling is once again shown capable of providing self-similar turbulent stress profiles. In this region, since the flow is reattached, no coordinate rotation needs to be applied before implementing the modified ESL scaling successfully. The modified ESL scaling with its inner and outer vorticity thickness normalizing length scales accounts for the cross-stream asymmetry that results from the upstream flow separation and wall curvature history. In this region the peak turbulent stresses continue to scale on the mean velocity at the inflection point,  ${U_{ip}}$, rather than,
 ${U_{{d_{ip}}}}$ as was the case in the ESL scaling for the initial region of shear layer formation (
 $0.35\;\textrm{m} \le X \le 0.5\;\textrm{m}$).
Declaration of interests
The authors report no conflict of interest.


 Open access

