


1. Introduction
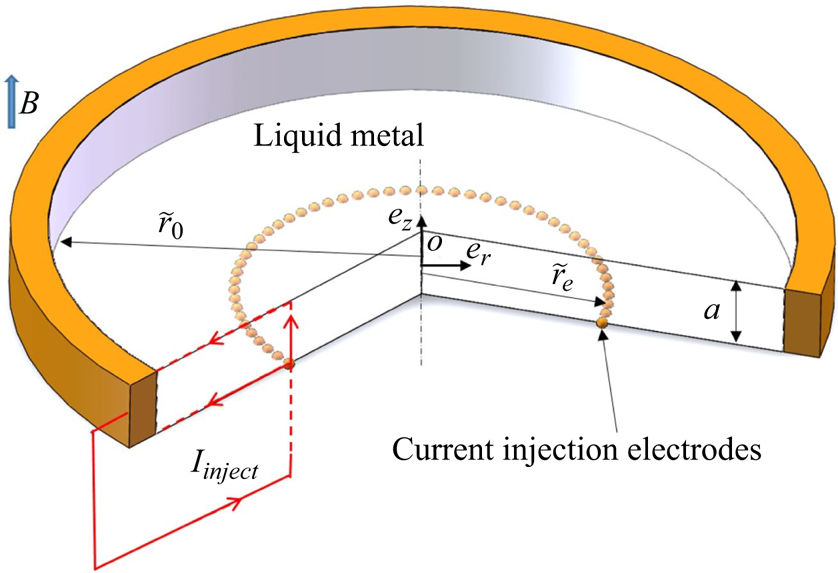
In this paper, we apply the three-dimensional (3-D) direct numerical simulations (DNS) to study the flow of an electrically conducting incompressible fluid in a cylindrical container, popularly known as MATUR (MAgnetohydrodynamics TURbulence), designed to investigate the quasi-two-dimensional (Q2-D) turbulence (Alboussière, Uspenski & Moreau Reference Alboussière, Uspenski and Moreau1999) in the presence of external magnetic fields. The sketch of MATUR is shown in figure 1, where the magnetic field is applied along the axial direction. For such a laboratory-scale configuration, the magnetic Reynolds number is much smaller than unity (here,  $R_{m}= \mu _{m}\sigma U_{0} L\approx 0.007$, where
 $\mu _{m}$ denotes the magnetic permeability of vacuum,
 $\sigma$ is the electrical conductivity,
 $U_{0}=0.1$ m s
 $^{-1}$ and
 $L=0.01$ m are the typical characteristic velocity and the characteristic length scale, respectively), then the induced magnetic field
 $ { {\boldsymbol b}}$ is much smaller than the imposed one
 $ { {\boldsymbol B}}$ (
 $ { {\boldsymbol b}}\sim R_{m} { {\boldsymbol B}} \ll { {\boldsymbol B}}$), and the Lorentz force acting on the flow is obtained as
 $ { {\boldsymbol F}}_{Lorentz}= { {\boldsymbol j}}\times { {\boldsymbol B}}$, where
 $ { {\boldsymbol j}}$ denotes the electric current density (Roberts Reference Roberts1967). If the magnetic field is strong enough, velocity variations along the field lines are damped by the Lorentz force and the flow tends to be Q2-D.
Sketch of the experimental set-up. A typical electric circuit including one of the point-electrodes mounted flush at the bottom Hartmann layer is represented.

This tendency was observed in several experiments. Kolesnikov & Tsinober (Reference Kolesnikov and Tsinober1974) and Davidson (Reference Davidson1997) stated that this evolution towards a Q2-D regime was a consequence of the invariance of the angular momentum component parallel to the magnetic field, when its perpendicular components decay exponentially (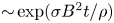 ${\sim }\exp ({\sigma B^{2}t/ \rho })$ where
 $t$ denotes the evolution time,
 $\rho$ is the density). Eckert et al. (Reference Eckert, Gerbeth, Witke and Langenbrunner2001) conducted an experiment on magnetohydrodynamics (MHD) turbulence in a sodium channel flow exposed to a transverse magnetic field, and the measured turbulence intensity and energy spectra were found to exhibit a spectral slope varying with the magnetic interaction parameter (
 $N=\sigma B^{2}L/\rho U_{0}$) from a
 $k^{-5/3}$ law for
 $N \leq 1$ and to a minimum exponent of
 $-4$ for
 $N\simeq 120$ where
 $k$ is the wavenumber. For the MHD turbulent shear flows, Kljukin & Kolesnikov (Reference Kljukin and Kolesnikov1989) performed the very first experiments, in which the mean velocity distribution and correlations of velocity fluctuations were provided, but data concerning the energy spectra and the development of coherent structures fed by the energy transfer towards the large scales was not available.
In order to better understand the elementary properties of the Q2-D turbulent shear flows and check the validation of theoretical work (Sommeria & Moreau Reference Sommeria and Moreau1982), Alboussière et al. (Reference Alboussière, Uspenski and Moreau1999) and Pothérat, Sommeria & Moreau (Reference Pothérat, Sommeria and Moreau2000) carried out experimental and theoretical studies on the Q2-D turbulent shear flows, where the transport of a scalar quantity and the free-surface effect were considered, using the MATUR equipment. Messadek & Moreau (Reference Messadek and Moreau2002) further provided experiment data on the MHD turbulent shear flows in a wide range of Hartmann number ( $Ha$) and Reynolds number (
 $Re$), and highlighted the important role of the Hartmann layers where the Joule effect and viscosity dissipate most of the kinetic energy. Recently, Stelzer et al. (Reference Stelzer, Miralles, Cébron, Noir, Vantieghem and Jackson2015b) built a new experimental device called ZUCCHINI (ZUrich Cylindrical CHannel INstability Investigation), which, as MATUR, featured a free shear layer at the edge of the inner disk electrode. Combining it with finite-element simulations (based on a two-dimensional (2-D) axisymmetric model), they studied the instabilities of the free shear layer and identified several flow regimes characterised by the nature of the instabilities of the Kelvin–Helmholtz type (Stelzer et al. Reference Stelzer, Cébron, Miralles, Vantieghem, Noir, Scarfe and Jackson2015a). Based on the FLOWCUBE platform, a more homogeneous type of turbulence between Hartmann walls was produced from the destabilisation of vortex arrays (Klein & Pothérat Reference Klein and Pothérat2010; Pothérat & Klein Reference Pothérat and Klein2014; Baker et al. Reference Baker, Pothérat, Davoust and Debray2018). These authors focused on the transition between 3-D and Q2-D turbulence. In particular, the cutoff length scale
 $\hat {l}^{c}_{\perp }$ (
 ${\sim }N^{1/3}_{t}$, where
 $N_{t}$ is the true interaction parameter) first theorised by Sommeria & Moreau (Reference Sommeria and Moreau1982) that separates 3-D from Q2-D fluctuations was obtained experimentally, as well as evidence of inverse and direct energy cascades in 3-D magnetohydrodynamic turbulence.
However, a major disadvantage of experimental approaches is that the liquid metal used for their high electrical conductivity is non-transparent. Although the velocity fields can be measured by ultrasonic Doppler velocimetry or potential probe techniques, more complete information, e.g the distribution of the flow fields and the electromagnetic quantities, are rather difficult to obtain. Therefore, numerical simulations, which can complement the experimental measurements, have been developed recently to study MHD turbulence. Taking advantage of the Q2-D property of the MHD flows in the case of high  $N$ and
 $Ha$, several simplified effective 2-D models have been developed by averaging the full Navier–Stokes equations along the direction of the magnetic fields. The advantages of using these 2-D models are evident, not only to save the costs compared with a full 3-D numerical approach, but also to provide accurate results where 3-D numerical solutions cannot fully resolve the boundary layer in the case of high
 $Ha$. Sommeria & Moreau (Reference Sommeria and Moreau1982) derived a 2-D model (denoted as SM82 hereafter) based on the simple exponential profile of Hartmann layers. It gave good results in the flow regime where inertia is small but failed to describe flows where strong rotation induces secondary flows, such as Ekman pumping. The 2-D model developed by Pothérat et al. (Reference Pothérat, Sommeria and Moreau2000) (denoted as PSM hereafter), accounting for some 3-D effects, gave more accurate prediction in the Q2-D flows. With PSM, both of the velocity profiles and the global angular momentum measurements from MATUR (Pothérat, Sommeria & Moreau Reference Pothérat, Sommeria and Moreau2005) were reproduced, and it was proved that the local and global Ekman recirculations altered the shape of the flow significantly as well as the global dissipation. However, both the SM82 model and the PSM model break down if the Hartmann layer becomes turbulent. While the flow may still remain Q2-D the boundary-layer friction is altered. Pothérat & Schweitzer (Reference Pothérat and Schweitzer2011) established an alternative shallow-water model specifically for this case, and recovered experimentally measured velocity profiles and global momentum in this regime.
In mainly azimuthal flows, such as in a toroidal containers, the dynamics of the sidewall layer and the free shear layer near the injected electrodes on the flow is complex because of rotation effects. Even when the Hartmann layers are stable, significant flow alterations may occur, including non-trivial 3-D effects (Tabeling & Chabrerie Reference Tabeling and Chabrerie1981), which could not be observed easily in experiments or with any Q2-D model. It has been proven that turbulence may remain localised in a layer near the outer cylinder wall prior to transition happening in Hartmann layers as indicated by Zhao & Zikanov (Reference Zhao and Zikanov2012), who conducted a series of 3-D DNS of MHD turbulence flows in a toroidal duct. In addition, for cases with lower values of Hartmann number and higher values of Reynolds number, three-dimensionality would be more pronounced, even within the Hartmann–Bödewadt layers, which have been studied theoretically by Davidson & Pothérat (Reference Davidson and Pothérat2002) and Moresco & Alboussière (Reference Moresco and Alboussière2003). All of these discoveries encourage us to perform 3-D DNS on the flows in MATUR configuration (corresponding to the realistic experiment of Messadek & Moreau Reference Messadek and Moreau2002). Besides reproducing the results obtained in the experiments, theories and Q2-D simulations, we focus on answering the following questions in the present work.
(i) Does the separation or turbulence emerge within the sidewall layer when the electrodes are far away from the sidewall and while the Hartmann layer remains laminar?
(ii) What causes the angular momentum dissipation in regimes where the Hartmann layers are laminar?
(iii) How much and what type of three-dimensionality subsists in sheared MHD turbulence at high
 $Ha$? In particular,
(a) How much energy subsists in the secondary flow?
(b) Is there a cutoff length scale between Q2-D and 3-D length scales in sheared turbulence too?

However, two factors restrict the investigated range of Reynolds number and Hartmann number in the present DNS studies. One is the computing resource, because very fine grids are required to capture the small-scale turbulent structure and to resolve the thin Hartmann boundary layers. Another is the lack of robust computational schemes capable of dealing with nonlinear unsteady high- $Ha$ flows. In particular, when non-orthogonal grids are used, extra non-orthogonal correction schemes are required. By applying large eddy simulations (Kobayashi Reference Kobayashi2006, Reference Kobayashi2008),
 $Re$ could be somewhat increased, but the resolution requirements for the Hartmann layers remained essentially the same as those in DNS, since no reliably accurate wall-function models were known for the case of turbulent flows. Here, the problem of inadequate computational resources is overcome by employing massively parallel computing. As for the numerical method, we apply the finite-volume method based on the consistent and conservative scheme developed by Ni et al. (Reference Ni, Munipalli, Huang, Morley and Abdou2007), which can be used to accurately simulate MHD flows at a high Hartmann number. Therefore, the Hartmann number is allowed to vary from
 $55$ to
 $792$ (magnetic fields change from 0.2083 to 3 T) while the Reynolds number also varies from 4792 to 31 944 (total current density change from 3 to 20 A). In such parameter spaces, turbulence is well established while the Hartmann layers remain laminar. Simulations are performed on the full 3-D domain and, for comparison with previous work, with the PSM model in the 2-D-average plane.
The layout of the paper is as follows. In § 2, a short description of the physical model underlying this work and the flow conditions in the MATUR cell are given. Particular attention is given to the modifications dealing with the electrical conductive wall and the injected current density. The numerical algorithm and the detailed computational grid study are also presented in this part. The main properties of the MHD turbulence are described and discussed in § 3, including the general aspect of the flow, the secondary flows, the properties of the free shear layer and sidewall layer, the global angular momentum as well as three-dimensionality. Finally, we offer concluding remarks in § 4.
2. Problem statement and formulation
2.1. Flow configuration and mathematical formulation
The physical model of MATUR is shown in figure 1. It is a cylindrical container (radius  $\tilde {r}_{0}=0.11$, depth
 $a= 0.01$ m, with
 $\tilde {}$ distinguishing the dimensional quantity from their dimensionless counterpart), in which the bottom and the upper walls are electrically insulating while the vertical walls are conducting. Electric currents are injected at the bottom of the container through a large number of point-electrodes spread along a concentric ring parallel with the vertical wall. As indicated by Messadek & Moreau (Reference Messadek and Moreau2002), a continuous electrode ring would induce a strong local damping in the flows, and, thus, a series of discrete point-electrodes are positioned to reduce this unwanted effect. The concentric circles are located at
 $\tilde {r}_{e}=0.054$ m or
 $\tilde {r}_{e}=0.093$ m, respectively. In the present study, only
 $\tilde {r}_{e}=0.054$ m is considered. The container is filled with mercury and exposed to a constant homogeneous vertical magnetic field parallel to the axis of MATUR. The injected currents leave the fluid through the vertical wall to induce a radial electric current that gives rise to an azimuthal force on the fluid in the annulus between the electrode circle and the outer wall.The material properties of the fluid at room temperature, such as the mass density
 $\rho$, the kinematic viscosity
 $\nu$ and the electrical conductivity
 $\sigma$, are assumed constant (
 $\rho =1.3529\times 10^{4}$ kg m
 $^{-3}$,
 $\nu =1.1257\times 10^{-7}$ m
 $^2$ s
 $^{-1}$ and
 $\sigma =1.055\times 10^{6}$ S m
 $^{-1}$). An external homogeneous magnetic field of amplitude
 $B$ is applied along the axial direction. At a low magnetic Reynolds number, the full system of the induction equation and the Navier–Stokes equations for an incompressible fluid can be approximated to the first order
 $\mathcal {O}(Rm)$. Thus, the non-dimensional magnetohydrodynamic equations governing the flow can be written as (Roberts Reference Roberts1967)
 \begin{gather} \boldsymbol{\nabla} \boldsymbol{\cdot} {{\boldsymbol v}} =0, \end{gather}
 \begin{gather}\frac{\partial{{\boldsymbol v}}}{\partial t}+({{\boldsymbol v}}\boldsymbol{\cdot}\boldsymbol{\nabla}){{\boldsymbol v}}={-}\boldsymbol{\nabla} p+\frac{1}{Re}{\rm \Delta}{{\boldsymbol v}}+N({{\boldsymbol j}}\times{{\boldsymbol e}}_{z}), \end{gather}
 \begin{gather}{{\boldsymbol j}}={-}\boldsymbol{\nabla}\varphi+{{\boldsymbol v}}\times{{\boldsymbol e}}_{z}, \end{gather}
 \begin{gather}\boldsymbol{\nabla}\boldsymbol{\cdot}{{\boldsymbol j}} =0. \end{gather}
where the variables  $ { {\boldsymbol j}}$,
 $\varphi$,
 ${{\boldsymbol v}}$,
 $p$ denote the current density, the electric potential, the velocity and the pressure, respectively. Here, lengths are scaled by
 $a$, the velocity by a scale
 $U_{0}$ to be specified shortly, and the current by
 $\sigma B U_{0}$. The typical scales for the other variables are as follows:
 $\rho U_{0}^{2}$ for the pressure,
 $U_{0} B a$ for the electrical potential,
 $a/U_{0}$ for time. The Hartmann number
 $Ha$ and the interaction parameter
 $N$ are defined as
 \begin{equation} Ha=B a\sqrt{\frac{\sigma}{\rho\nu}}, \quad N= \frac{\sigma B^{2} a}{\rho U_{0}}, \end{equation}
and the Reynolds number is given as 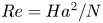 $Re=Ha^{2}/N$. In the present work, all these non-dimensional numbers are based on the thickness of the container
 $a$. For this experiment, an approximate azimuthal velocity can be derived from the theory in Sommeria & Moreau (Reference Sommeria and Moreau1982). Indeed, Pothérat et al. (Reference Pothérat, Sommeria and Moreau2000) derived an approximate expression for the
 $z$-averaged azimuthal velocity in the inviscid laminar, axisymmetric Q2-D regime, using a Dirac delta function centred at the electrodes
 $r=r_{e}$ to describe the injected current
 $j_{W}$, where the integral is equal to the total injected current
 $I$:
 $j_{W}=I/2{\rm \pi} r_{e}\delta (r-r_{e})$ (
 $\delta $ is a Dirac delta function, centered at the injection radius
 $r_{e}$).
 \begin{equation} \left.\begin{array}{l@{}} U_\theta^{\textrm{SM82}}(r)=\dfrac{I}{2{\rm \pi} r \sqrt{\sigma\rho\nu}}, \quad r_{e} < r < r_{0}, \\ U_\theta^{\textrm{SM82}}(r)= 0,\quad r\leq r_{e}. \end{array}\right\}\end{equation}
and  $U_r^{\textrm {SM82}}=0$. Based on this, we choose the velocity scale as
 $U_{0}={I}/{2{\rm \pi} r_{0}\sqrt {\sigma \rho \nu }}$. Finally, velocity fluctuations are defined as
 ${{\boldsymbol v}}'={{\boldsymbol v}}-\langle {{\boldsymbol v}}\rangle$.
The boundary conditions for  ${{\boldsymbol v}}$ and
 $\varphi$ are as follows. For the velocity, we apply standard no-slip conditions at all walls. As for the electric potential, we impose perfectly conducting sidewalls and perfectly insulating Hartmann walls except for the locations where the electrodes are located, i.e. at the top wall:
 \begin{equation} {{\boldsymbol v}} =0,\quad \partial_{z}\varphi=0 \quad \textrm{at}\ z=1 \quad \textrm{(top wall)}. \end{equation}
At the surface of point-electrodes located at the bottom wall,
 \begin{equation} {{\boldsymbol v}} =0, \quad \partial_{z}\varphi=\frac{I}{A_{re}\sigma^{2} BU_{0}} \quad \textrm{at}\ z=0. \end{equation}
At the bottom wall, outside point-electrode surfaces,
 \begin{equation} {{\boldsymbol v}} =0,\quad \partial_{z}\varphi=0 \quad \textrm{at}\ z=0. \end{equation}
At the lateral wall (BC1),
 \begin{equation} {{\boldsymbol v}} =0,\quad \varphi=0 \quad \textrm{at}\ r=r_.0 \end{equation}
Here,  $128$ points-electrodes (
 $0.001$ m diameter and
 $0.00165$ m apart) are uniformly distributed along a circle located at
 $r_e$ at the bottom wall. The surface of each point-electrode contains 102 cells with those on the periphery cut by the electrode edge. The area
 $A_{re}$, which appears in the boundary condition of (2.8a,b), is the total area of the small electrodes. Note that we do not need an extra forcing term in (2.2) to drive the flow because the injected current from the bottom electrodes interacts with the magnetic field, and generates Lorentz force that drives the flow. The current circulates inside the mercury, as shown in figure 1, and leaves the domain at the vertical wall. Moreover, because of the perfectly conducting properties of the wall, the electrical potential across the wall can be regarded as a constant and set to zero in (2.10a,b).
2.2. Numerical algorithm and validation
The DNS of the governing equations are performed based on the finite-volume approach. For the pressure $-$velocity coupling, a second-order temporal accurate pressure-correction algorithm has been used. Based on a consistent and conservative scheme (Ni et al. Reference Ni, Munipalli, Huang, Morley and Abdou2007), the electrical potential Poisson equation is then solved to obtain
 $\varphi$. The detailed process within each time step could be split into: (a) obtain a predicted velocity by solving the momentum equation with pressure from the previous iteration; (b) calculate the predicted velocity fluxes which are used as the source term of the pressure difference Poisson equation, which will be solved to obtain the pressure difference, then apply the updated pressure difference to update the velocity and pressure; (c) solve the Poisson equation for the electric potential to get the electrical potential, which is used to calculate the current density fluxes on cell faces with the consistent and conservative scheme. Then the current density at each cell centre is reconstructed through a conservative interpolation
 ${{\boldsymbol j}} = \boldsymbol {\nabla }\boldsymbol {\cdot }({{\boldsymbol jr}})$ with
 ${{\boldsymbol r}}$ the position vector; (d) calculate the Lorentz force
 $ { {\boldsymbol F}}_{Lorentz} = { {\boldsymbol j}}\times { {\boldsymbol e}}_{z}$ at the cell centre based on the reconstructed current density, which is used as the source term of the momentum equation of the next time step. Step (b) is iterated three times before solving the electrical potential Poisson equation.
The central scheme is applied for all convective-term approximations. All inviscid terms and the pressure gradient are approximated with a second-order accuracy. A second-order implicit Euler method is used for time integration. In order to guarantee a robust solution for unsteady flows and make the temporal cutoff frequency match the spatial cutoff frequency, the present simulations are run with a constant time step which satisfies the Courant–Friedrichs–Lewy condition.
A preconditioned bi-conjugate gradient (PBiCG) solver applicable to asymmetric matrices has been used for the solution of the velocity-pressure coupling equation, together with a diagonal-incomplete lower and upper triangular matrices (DILU) decomposition for preconditioning. The preconditioned conjugate gradient (PCG) iterative solver with a diagonal-incomplete Cholesky (DIC) preconditioner, which deals with symmetric matrices, has been applied for the solution of pressure and electric potential equations. Note that for all the iterative solutions, velocity, pressure and electric potential, a constant convergence criterion of  $10^{-6}$ is used.
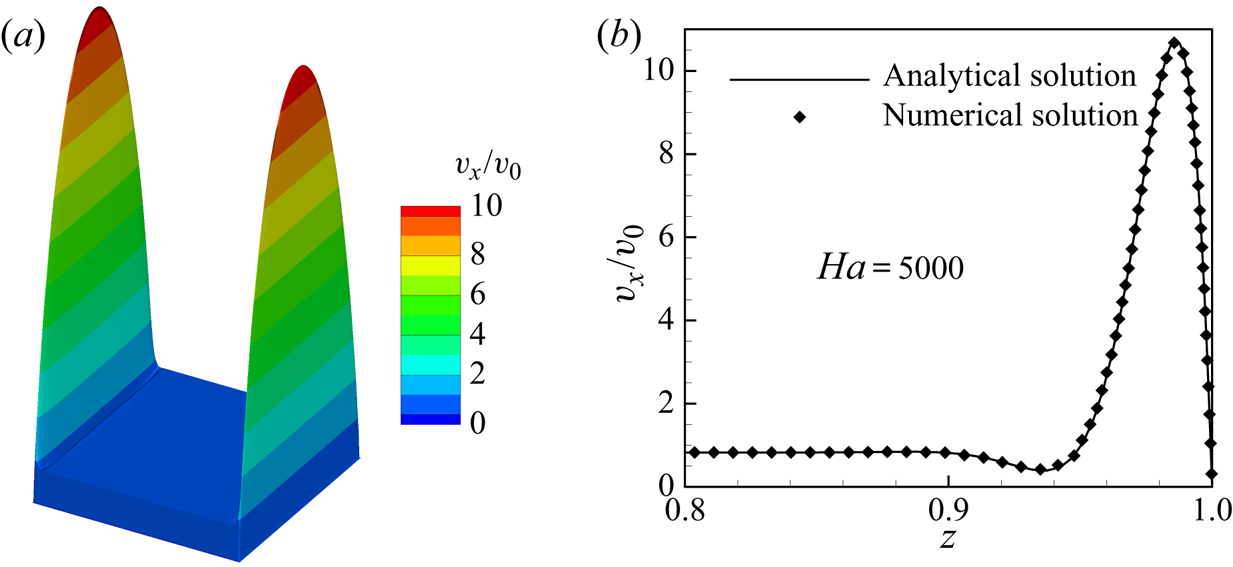
In order to verify the accuracy of our numerical code, the classic Hunt's flow has been simulated for comparison with the analytical solution (Hunt 1965). Herein, the parameters are set to  $Re=100$,
 $Ha=5000$, and the conductance ratio of
 $C_{w}=\sigma _{w}t_{w}/\sigma _{f}L_{f}$ is set to 0.01, where
 $\sigma_{w}$ and
 $\sigma_{f}$ denote the electrical conductivity of the wall and the fluid, respectively,
 $t_{w}$ stands for the thickness of the wall and
 $L_{f}$ is the half Hartmann length of the fluid domain. As illustrated in figure 2, the velocity matches well with Hunt's analytical result, especially within the thin boundary layer from
 $z = 0.8$ to
 $z = 1$. Moreover, the calculated pressure gradient matches well with the analytical pressure gradient, with a relative discrepancy lower than
 $0.08\,\%$ based on an error estimation of
 $|{((\boldsymbol {\nabla } p)_{Anal}-(\boldsymbol {\nabla } p)_{Numr})}/{(\boldsymbol {\nabla } p)_{Anal}}|$.
The typical ‘M-shape’ velocity profile of Hunt's case (a) and the comparison of the numerical result with Hunt's analytical solution (b) for  $Ha = 5000$. Here,
 $v_{x}$ is the streamwise velocity and
 $v_{0}$ is the mean streamwise velocity of the inlet.

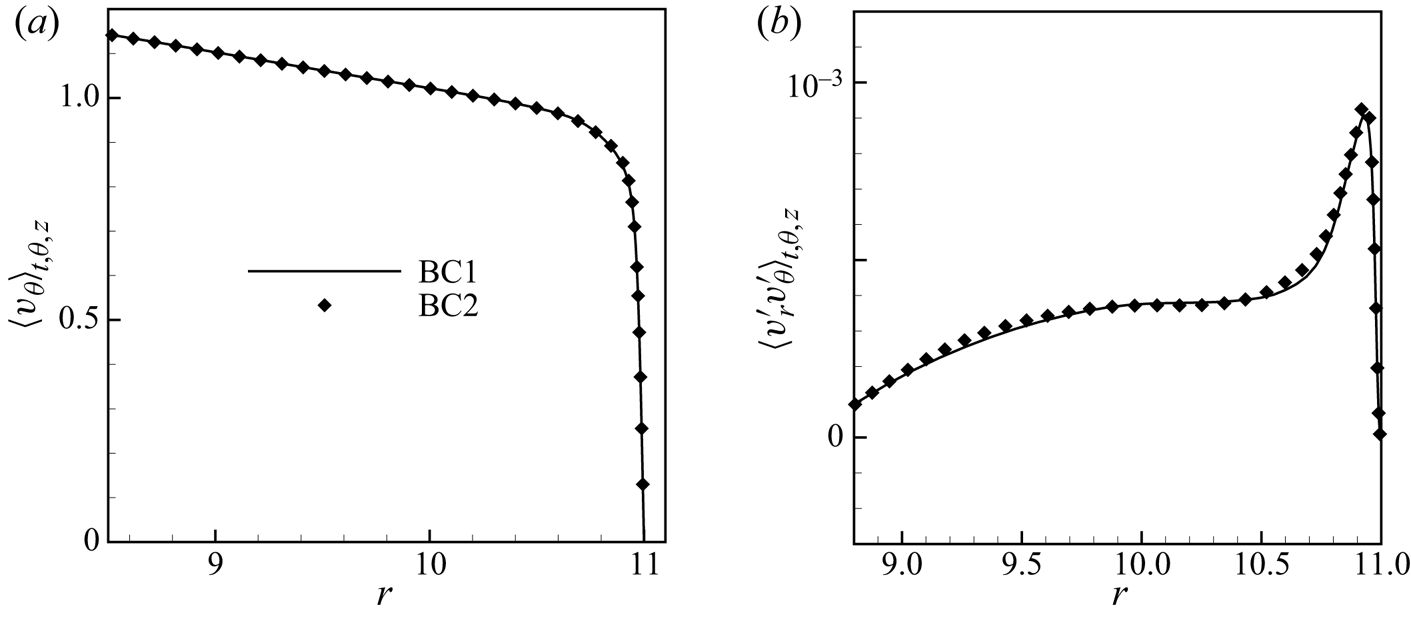
In addition, it should be noted that the boundary condition of a perfectly conducting sidewall which we used in all simulations ((2.10a,b), denoted as BC1) is not entirely consistent with the real experiment where the total current was imposed through the lateral wall. The experimental conditions would be represented by replacing (2.10a,b) by the electric boundary condition
 \begin{equation} {{\boldsymbol v}} =0,\quad \partial_{r}\varphi={-}\frac{I}{A_{side}\sigma^{2} BU_{0}}\quad \textrm{at }\ r=r_0, \end{equation}
denoted as BC2, and where  $A_{side}$ is the surface area of the sidewall. For this reason, we conducted two further validation steps for
 $Ha=66$ and
 $Re=15\,972$. Firstly, we compared the total current through the sidewall with the total injected current
 $I$ based on BC1. The relative error of
 $0.3\,\%$ implies that the applied boundary condition is reasonable. We also compared a simulation with BC1 to one where an homogeneous current is imposed across the outer sidewall (figure 3). The maximum relative errors on the mean azimuthal velocity and the r.m.s. of the fluctuations along the radial direction between the two boundary conditions are less than
 $0.8\,\%$ and
 $3\,\%$, respectively. This indicates that the choice of either BC1 or BC2 does not have any significant impact on the resulting flow field and that both are compatible with good conservation of charge.
The radial distribution of the mean azimuthal velocity (a) and the r.m.s. value of the correlations of velocity fluctuations ( $\langle v\prime_r v\prime_\theta\rangle_{t,\theta,z}$) (b) for BC1 and BC2 at
 $Ha = 66$ and
 $Re= 15\,972$.

As a further validation, the numerical solutions of the average azimuthal velocity  $\langle v_{\theta} \rangle_{\theta,t}$ at
 $r=9.6$ and
 $z=0.5$ and the time and space average of the angular momentum,
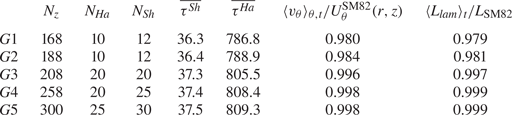
 $\langle L_{lam}\rangle _{t}$, are also compared with the results produced by the Q2-D model, as shown in table 1:
 $\langle \cdot \rangle _{i}\ (i=\theta ,r,z)$ represents the average along the specific direction (Hartmann layers are excluded) and
 \begin{equation} \langle{L}_{lam}\rangle_t=\frac{1}{T}\int^{\textrm{T}}_{0} \langle L_{lam}\rangle_{V}\,\textrm{d} t,\quad \langle L_{lam}\rangle_{V}=\frac{1}{V_\varOmega}\int rv_{\theta}(r)\,\textrm{d}\varOmega, \end{equation}
where  $V_\varOmega =2{\rm \pi} \tilde r_0^2$ is the non-dimensional volume of the computational domain,
 $T$ is the time interval for average,
 $\langle \cdot \rangle _{V}$ is the volume average and
 $v_i$ is the instantaneous velocity. According to the theory of Sommeria & Moreau (Reference Sommeria and Moreau1982), an approximate global angular momentum can be derived (Pothérat et al. Reference Pothérat, Sommeria and Moreau2000), under the assumption of axisymmetry, i.e.
 \begin{equation} L_{\textrm{SM82}}=\frac{I}{4{\rm \pi} U_{0}a\sqrt{\rho\nu\sigma}}\left(1-\frac{r^{2}_{e}}{r_{0}^{2}}\right). \end{equation}
Grid sensitivity study:  $N_{Ha}$,
 $N_{Sh}$ denote the grid points within the Hartmann layer and sidewall layer, respectively,
 $\overline {\tau ^{Sh}}$,
 $\overline {\tau ^{Ha}}$,
 $\langle {L}_{lam}\rangle _t/{L}_{\textrm {SM82}}$ and
 $\langle v_{\theta }\rangle _{\theta ,t}/U_\theta ^{\textrm {SM82}}(r,z)$ at
 $r=9.6$,
 $z=0.5$, which results from the different grids, are compared in the case of
 $Ha=792,\ Re=15\,972$.

Across the range of considered parameters, the maximum relative errors of  $\langle v_{\theta }\rangle _{\theta ,t}/U_\theta ^{\textrm {SM82}}(r)$ and
 $\langle {L}_{lam}\rangle _t/{L}_{\textrm {SM82}}$ are less than
 $2.1\,\%$, indicating that the DNS results are reliable. Moreover, we also conducted an extensive grid sensitivity study, the results of which are presented in the next section.
2.3. Grid details
Due to the localisation of the Lorentz force within  $r\in [5.4, 11]$, the fluid rotates around the axis of the container, and a free shear layer forms at
 $r = 5.4$. In order to capture more precise flow information, highly refined grid resolution is required in both the free shear layer and the outer wall side layer. Note that the unstructured computational grids are made of hexahedra and prisms in the present study, and the grid details in the case of
 $Ha=792$ and
 $Re=15972$ are used for illustration. In the radial direction,
 $N_{r}=864$ grid points are generated, 30 (respectively, 25) of which are devoted to the sidewall (respectively, free shear) layer located at
 $r =11$ (
 $r=5.4$). These points are distributed within the layer according to a geometric ratio of
 $\gamma _{r}= 1.1$ starting at
 $r = 11$ and
 $r = 5.4$ with an initial interval of
 ${\rm \Delta} r_{min}\approx 0.0011$, while the largest step (in the middle of the container) is
 ${\rm \Delta} r_{max}\approx 0.023$. The azimuthal direction uses
 $N_{\theta }=4096$ uniformly spaced grid points and the axial direction uses
 $N_{z}=300$ non-uniformly spaced grid points. Note that to fully resolve the Hartmann layer along the axial direction, 25 uniformly spaced grid points are devoted to each layer and a smooth transition is set toward the core region where a coarser grid resolution is sufficient. Grid points are spread according to a geometric sequence of ratio
 $\gamma _{z}= 1.1$ starting at
 $z \approx Ha^{-1}$ and
 $z \approx 1-Ha^{-1}$. The point nearest to the Hartmann walls is located
 ${\rm \Delta} z_{min}\approx 5\times 10^{-5}$ away from them, and the largest step is
 ${\rm \Delta} z_{max}\approx 1.2\times 10^{-2}$.
In order to assess the quality of the grids, wall coordinates are introduced
 \begin{equation} r^{+}=Re^{Sh}_{\tau}r, \quad z^{+}=Re^{Ha}_{\tau}z, \end{equation}
where
 \begin{gather} Re^{Sh}_{\tau}=\sqrt{Re\overline{\tau^{Sh}}},\quad Re^{Ha}_{\tau}=\sqrt{Re\overline{\tau^{Ha}}}. \end{gather}
 \begin{gather} \left.\begin{gathered} \overline{\tau^{Sh}} = \frac{1}{TA_{Sh}}\int \int \left.\left(-\frac{\partial v_{\theta}}{\partial r}\right)\right|_{r=1}\textrm{d} t\,\textrm{d} s,\\ \overline{\tau^{Ha}}=\frac{1}{2TA_{Ha}}\int \int \left(\left.\frac{\partial v_{\theta}}{\partial z}\right|_{z=0}-\left.\frac{\partial v_{\theta}}{\partial z}\right|_{z=1}\right)\textrm{d} t \,\textrm{d} s. \end{gathered}\right\} \end{gather}
Here,  $\overline {\tau ^{Sh}}$,
 $\overline {\tau ^{Ha}}$ denote the associated dimensionless forms of the mean stress at the sidewall and Hartmann wall, respectively,
 $T$ is the time interval for average,
 $A_{Sh}=22{\rm \pi}$ and
 $A_{Ha}=121{\rm \pi}$. Hence, the value of the smallest wall-normal grid step in the
 ${\rm \Delta} r^{+}$ units varies from 0.08 (see table 1). The respective variation in the
 ${\rm \Delta} z^{+}$ units is from 0.18 (see table 1). Moreover, the simulated results show that the highest velocity occurs at
 $r\approx 7.04$, where the azimuthal grid step
 ${\rm \Delta} \theta \approx 0.011$ is sufficiently small. Meanwhile, in order to ensure that the full range of the dissipative scales is resolved, the smallest turbulent scales (
 $l^{min}_{\perp }$ and
 $l^{min}_{z}$) predicted by Pothérat & Dymkou (Reference Pothérat and Dymkou2010) are used to evaluate the grids quality. The adopted grids indicate
 ${{\rm \Delta} ^{max}_{\perp }}/{l^{min}_{\perp }}\simeq 0.74,\ {{\rm \Delta} ^{max}_{\parallel }}/{l^{min}_{z}}\simeq 0.83$ (
 $\Delta^{max}_{\perp}$ denotes the largest grid scale perpendicular to the magnetic fields,
 $\Delta^{max}_{\parallel}$ denotes the largest grid scale paralleled the magnetic fields and the smallest scales are estimated according to the turbulent Reynolds number,
 $Re_{t}={U_{L}S_{L}}/{\nu }$). Here,
 $S_{L}$ is the size of the large scales, which is evaluated from the profiles of the r.m.s. of relative azimuthal velocity fluctuations (see figure 8(a) of Pothérat & Schweitzer Reference Pothérat and Schweitzer2011) and
 $U_{L}$ is the velocity of the large scales, which is calculated according to
 $U_{L}=(\int v_{i}^\prime v_{i}^\prime \textrm {d} v)^{1/2},\ i=(\theta ,r,z)$, where
 $v_{i}^\prime$ denotes the velocity fluctuations. The sizes of smallest scales according to Pothérat & Dymkou (Reference Pothérat and Dymkou2010) for all cases are listed in table 2.
Non-dimensional parameters in cases calculated numerically.

In addition, the grid independence studies are also conducted on the numerical case of  $Ha=792$ and
 $Re=15\,972$. Note that not only the grid sizes, but also the grid points along the
 $z$-direction, within the Hartmann layer and within the sidewall layer are tested. The time-averaged wall stress
 $\overline {\tau ^{Sh}}$,
 $\overline {\tau ^{Ha}}$, the time-averaged angular momentum
 $\langle {L}_{lam}\rangle _t$ and the time–space average azimuthal velocity
 $\langle v_{\theta }\rangle _{\theta ,t}$, at
 $r=9.6$,
 $z=0.5$ are presented in table 1.
For  $Ha=792,\ Re=15\,972$, (2.6) and (2.13) are not strictly valid since the flow is not axisymmetric but remain sufficiently accurate to roughly assess the accuracy of the simulations.
All the simulations are stopped when the total angular momentum of the flow is statistically steady, i.e. after  $3t_{Ha}$, where
 \begin{equation} t_{Ha}=\tilde{t}_{Ha}/(a/U_{0})\quad\textrm{and}\quad \tilde{t}_{Ha}=a^{2}/(\nu Ha) \end{equation}
denote the non-dimensional and dimensional Hartmann damping times, respectively. Average and the r.m.s. quantities are then evaluated over a time interval of  $4t_{Ha}$, and the computed values of these parameters are compared with evaluate the grid resolution within the Hartmann layer and sidewall layer. Evidently, the results are very close to each other, even with the worst spatial resolution, as shown in table 1. Firstly, the reliability and the accuracy of the DNS results are confirmed by a difference of less than
 $2.1\,\%$ between the present results and the solutions predicted by (2.6) and (2.13). Moreover, grid-independent solutions are also achieved with the grids under consideration. For example, less than
 $3.2\,\%$ difference is found for all the predicted values on the coarsest grid and the finest grid, and this discrepancy is even further reduced when the two finest grids are compared. Hence, one can conclude that grid
 $G5$ is sufficiently fine to simulate the flow in the case of
 $Ha=792$ and
 $Re=15\,972$. The mesh is, however, further refined when 3-D effects become significant, e.g. in the case of
 $Ha=55$ and
 $Re=15\,972$.
For different numerical cases, the dimensionless time steps used in the computations are altered according to the parameters applied in simulation, such that  ${\rm \Delta} t=5.0\times 10^{-5}$ for
 $(Ha,Re)=(264,4791)$,
 $5.5\times 10^{-5}$ for
 $(Ha,Re)=(264,31\,944)$ and
 $1.6\times 10^{-5}$ for all other cases. The values are determined by the limits of numerical stability, which highly depends on the viscous term and the convective term of the momentum equations at high
 $Re$. In addition, higher
 $Re$ or
 $Ha$ demand smaller time steps because of the higher azimuthal velocity and the thinner Hartmann layers.
3. Results and discussion
3.1. Validation of velocity profile at $Ha\gg 1$ and $N\gg 1$


As far as the authors know, it is the very first attempt to reproduce the MATUR experiment by performing 3-D DNS, and hence, as a necessary validation procedure, a detailed comparison with the available experimental results needs to be carried out. In addition, since the PSM model can deal with the cases when  $Ha\gg 1$ and
 $N_{t}=N(\widetilde {r_{0}}/a)^{2} \gg 1$, some numerical cases falling into this space are also investigated for validation. However, note that this model becomes imprecise when either of the parameters,
 $Ha$ or
 $N_{v}$ become of the order of 1, (
 $N_{v}=N(\widetilde {r_{0}}/a)$ is the interaction parameter based on the horizontal scale), which, again, stresses the importance of conducting 3-D DNS.
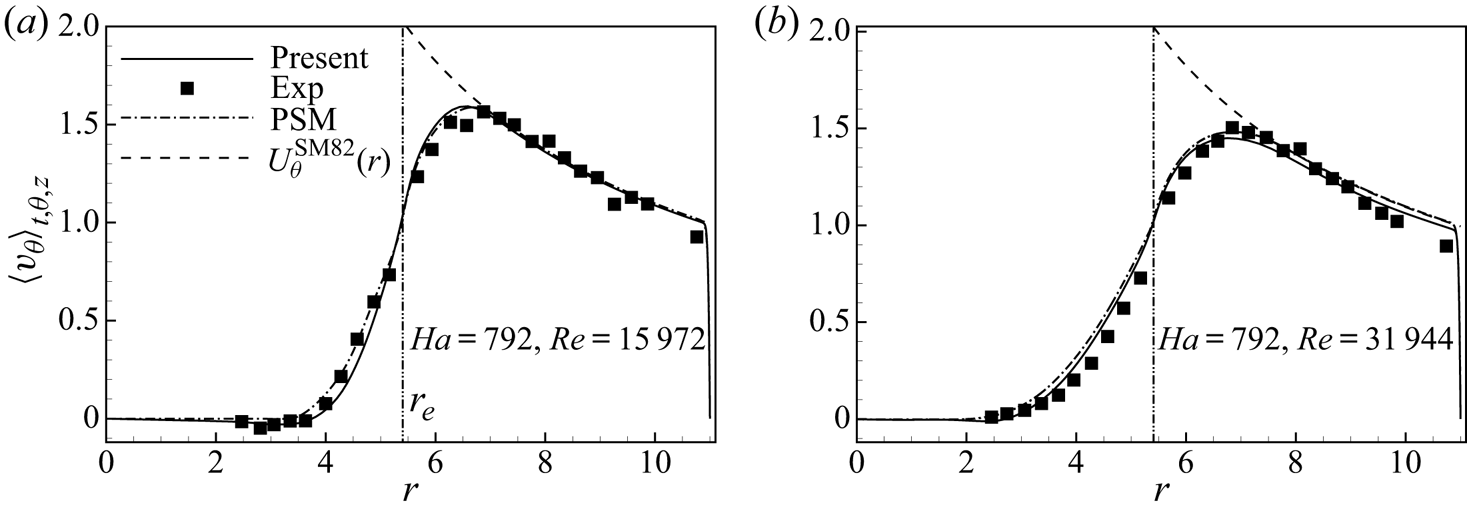
The predictions of the mean azimuthal velocities from different approaches, denoted by  $\langle v_\theta\rangle_{t, \theta,z}$, are plotted in figure 4. A good agreement is found between the experimental results, the numerical data and the laminar theoretical prediction. In the outer region
 $r_{e} < r < r_{0}$, the maximum relative discrepancy between the results of DNS and experiment is less than
 $6.7\,\%$
 $(8.5\,\%)$ in the case of
 $Re=15\,972$
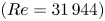 $(Re=31\,944)$ based on an error estimation of
 ${(\|\langle v_{\theta }^{DNS}\rangle _{t}-\langle v_{\theta }^{exp}\rangle _{t}\|_{2})}/{\|\langle v_{\theta }^{exp}\rangle _{t}\|_{2}}$. The maximum relative discrepancy between the results of DNS and the PSM model is less than
 $1.0\,\%$
 $(2.9\,\%)$ in the case of
 $Re=15\,972$
 $(Re=31\,944)$ based on an error estimation of
 ${(\|\langle v_{\theta }^{DNS}\rangle _{t}-\langle v_{\theta }^{PSM}\rangle _{t}\|_{2})}/{\|\langle v_{\theta }^{PSM}\rangle _{t}\|_{2}}$. In particular, the velocities exhibit the characteristic feature that they increase sharply across the free shear layer (
 $r=r_{e}$) due to the current injection. Accordingly, the shear layer separates the flow into outer and inner regions. Moreover, from both the experimental and the numerical data, the downward trend of the azimuthal velocity in regions between the injected electrodes and the vertical wall follows the expected scaling law of
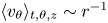 $\langle v_\theta\rangle_{t, \theta,z}\sim r^{-1}$, as predicted by (2.6), and which reflects the geometrical spreading of the radial forcing current in the Hartmann layer, i.e.
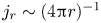 $j_{r}\sim (4{\rm \pi} r)^{-1}$ (see figure 5c).
Comparison of  $\langle v_{\theta }\rangle _{\theta ,z}$ between experiment (symbols), present numeric (solid lines), 2-D numeric based on PSM model (dashed-dot lines) and
 $U_\theta ^{\textrm {SM82}}(r)$ (dashed lines) for cases at
 $Ha=792$,
 $Re=15\,972$ (a), and
 $Ha=792$,
 $Re=31\,944$ (b). The dashed line depicts an algebraic law
 $r^{-1}$ (predicted by (2.6)).

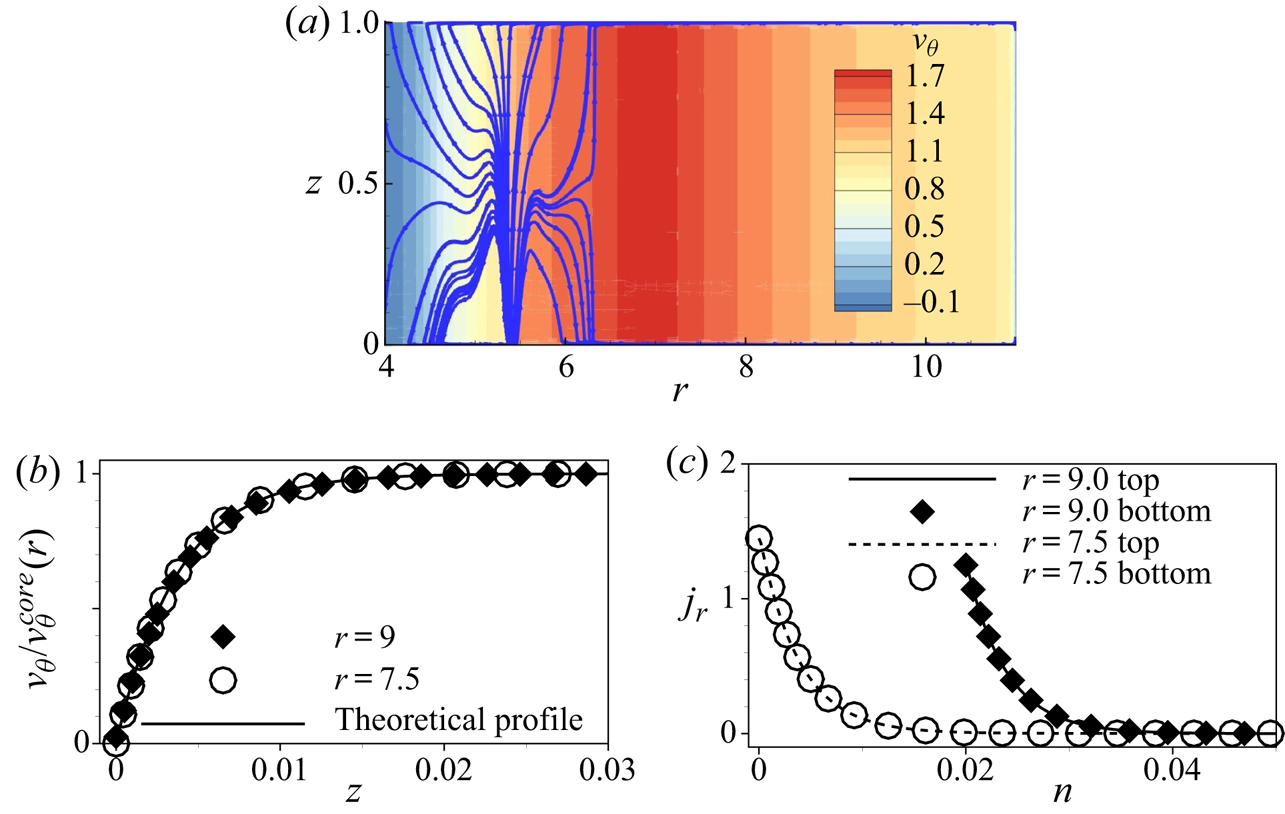
(a) The distribution of the instantaneous azimuthal velocity and current streamlines on plane  $\theta =0$ at
 $Ha=264$,
 $Re=15\,972$. (b) The vertical profiles of the instantaneous azimuthal velocity within the bottom Hartmann layer along
 $r=7.5$ and
 $r=9$. (c) The distribution of radial current density both across the top Hartmann layer and bottom Hartmann layer along
 $r=7.5$ and
 $r=9$, where the origin of the distribution along
 $r=9$ is shifted to
 $n=0.02$, where
 $n$ is the wall-normal coordinate i.e. for the bottom wall,
 $n=z$, and for the top wall
 $n=1-z$.

A typical instantaneous distribution of  $v_\theta$ obtained numerically over a radial cross-section
 $\theta =0$ for moderate forcing current is shown in figure 5(a). Under a strong magnetic field, the velocity gradient along the magnetic field lines is remarkably damped, except in the Hartmann layers where an exponential profile subsists. The detailed velocity distribution in the Hartmann layer is shown in figure 5(b), and a good agreement is observed between the present numerical results and the exact solution, given as
 $v_{\theta }=v_{\theta }^{core}(1-\exp (Haz))$, with
 $v_{\theta }^{core}$ indicating the azimuthal velocity in the core flow. It also demonstrates that the thickness of the Hartmann layer at
 $r=7.5$ and
 $r=9$ is the same. Besides, figure 5(c) reveals that the vertical profiles of radial current density within the top and bottom Hartmann layers collapse with each other, implying that the electric current intensity
 $I$ injected at the electrodes divides in two equal parts between the two symmetric Hartmann layers. In addition, the radial current density is much higher near the Hartmann wall, so the Joule dissipation mainly takes place in the thin Hartmann layers, in line with the laminar Hartmann layer theory. Therefore, the annular fluid domain located between the selected circular electrodes and the cathode
 $(5.4\leq r \leq 11)$ is driven in the azimuthal direction by the Lorentz force, while the central fluid domain
 $(r <5.4)$ is entrained by friction within the free shear layer. Interestingly, the current density at the upper wall stands a little lower than at the bottom wall, showing that despite the excellent agreement between the PSM model and experimental data, the flow is ever so slightly three-dimensional.
In the following part, the evolution of the large structures and the spectral analysis are discussed. Subsequently, we study the secondary flow induced by Ekman pumping. We also investigate the characteristics of the free shear layer and the sidewall layer before presenting the turbulent statistics, global angular momentum and three-dimensionality.
3.2. General behaviour of the flow
The different cases investigated are listed in table 2, where the dimensionless parameter 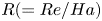 $R(=Re/Ha)$ represents the Reynolds number scaled on the thickness of the Hartmann layer. According to the experiments of Moresco & Alboussiere (Reference Moresco and Alboussiere2004), the flow within the Hartmann layer becomes turbulent when
 $R \geq 380$, in which case the DNS will require enormous computational resources. Therefore, only cases with
 $R<380$ are considered in this paper. Furthermore, five of the relevant interaction parameters scaled on the horizontal length
 $N_{v}$ are at the order of unity, aiming to study the three-dimensionality of the flows.
In the calculations, the electrical current is injected at  $t=0$ when the fluid is at rest and remains constant during the whole simulation, following the actual experimental procedure. For different electrical current intensities, the flow goes through a sequence of evolution and reaches different equilibrium and quasi-equilibrium states presented on figure 6. We shall now give an overall view of the numerical results, while more details of the evolution and local quantities will be reported later.
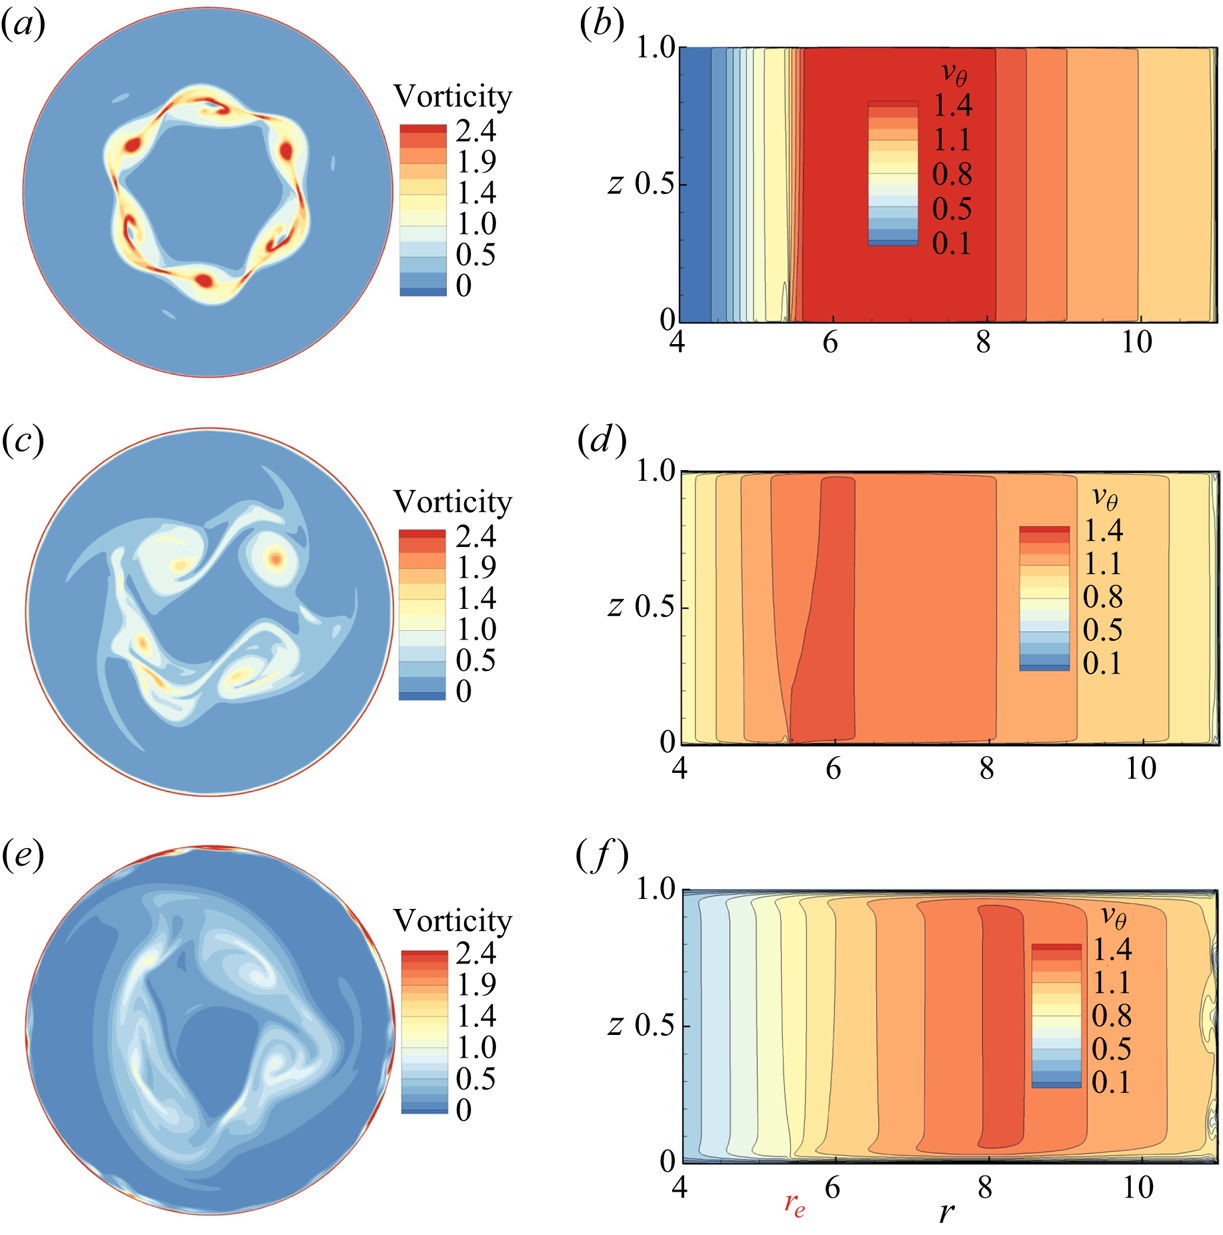
Typical snapshots of equilibrium or quasi-equilibrium states obtained from numerical simulations. Contours of the magnitude of the vorticity on plane  $z=0.5$ (a,c,e), contours of instantaneous azimuthal velocity on plane
 $\theta =0$ (b,d,f). (a,b)
 $Ha=792,\ Re=15\,972$. (c,d)
 $Ha=264, Re=31\,944$. (e,f)
 $Ha=55,\ Re=15\,972$. The velocity is normalised with
 $U_{0}$.

For  $R\leq 121$, the evolution of the flow is qualitatively similar to that found for
 $249\leq R\leq 1122$ in 2-D simulations of MATUR (Pothérat & Schweitzer Reference Pothérat and Schweitzer2011). In this work, the current was injected at the same location as in the present work, and there was no separation of the side layer, but the Hartmann layer was modelled as turbulent for
 $R\geq 380$. The flow contains five or six relatively stable vortices rotating around the
 $z$-axis in near-solid body rotation. They mainly remain localised near the free shear layer once generated there, as shown in figure 6(a). Thus, the velocity fluctuations in the inner region and the annular outer region are of much lower intensity, and the azimuthal velocity contours reveal that the wall side layer and the Hartmann layer are stable. Besides the low value of
 $R$, part of the reason for the stability of the side layer is that these large vorticity structures remain distant from it, and little interaction between them takes place. However, the thickness of the sidewall layer is still smaller than the scaling for a straight duct (
 $Ha^{-1/2}$), due to the recirculations induced by Ekman pumping – a point we will analyse in detail in § 3.5. Since most of the large vortices remain near the centre of the domain, highly turbulent fluctuations are induced there. By contrast, the velocity fluctuations in the annular region are much weaker, especially near the sidewall. It is the tail of the vortices that causes the velocity fluctuations there, as it is stretched and conveyed outwards. The induced flow in the outer region therefore exhibits long azimuthal vorticity streaks and much lower fluctuation intensity than in the inner region.
For  $R\geq 121$, small-scale 3-D turbulence appears in the side layer. The onset of 3-D turbulence within
 $R\lesssim 121$ is consistent with the value of 138 reported by Zhao & Zikanov (Reference Zhao and Zikanov2012), albeit a little lower. The difference in curvature of the external wall (
 $a/\tilde r_0=1/9$ in MATUR and
 $a/\tilde r_0=1/5$ (in our notations) in Zhao & Zikanov (Reference Zhao and Zikanov2012)), suggests that recirculations may be more important in the latter than the former. Since their effect is rather stabilising, this could explain the lower value detected here.
For  $R\geq 145.2$, the size of the large structures increases, leading to highly turbulent fluctuations in both the inner and the outer regions. Accordingly, long azimuthal vorticity streaks of relatively high intensity exist in the outer region that induce instabilities within the wall side layer. Concurrently, the wall side boundary layer separates from the wall, suggesting that separation results from the fluctuations in the outer region, as observed previously by Pothérat & Schweitzer (Reference Pothérat and Schweitzer2011). For
 $Ha=55,\ Re=15\,972$ (
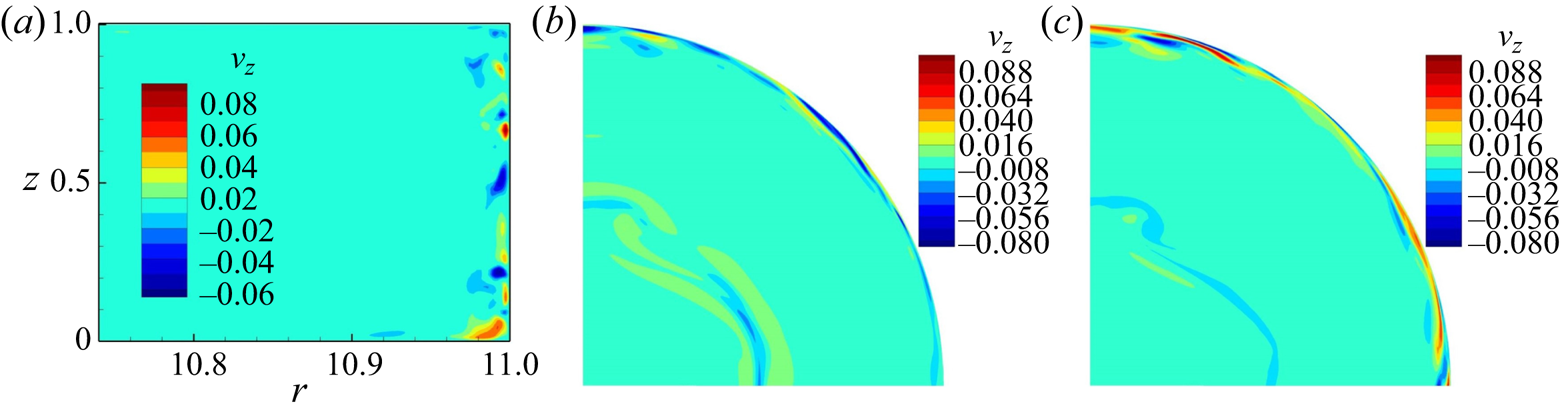
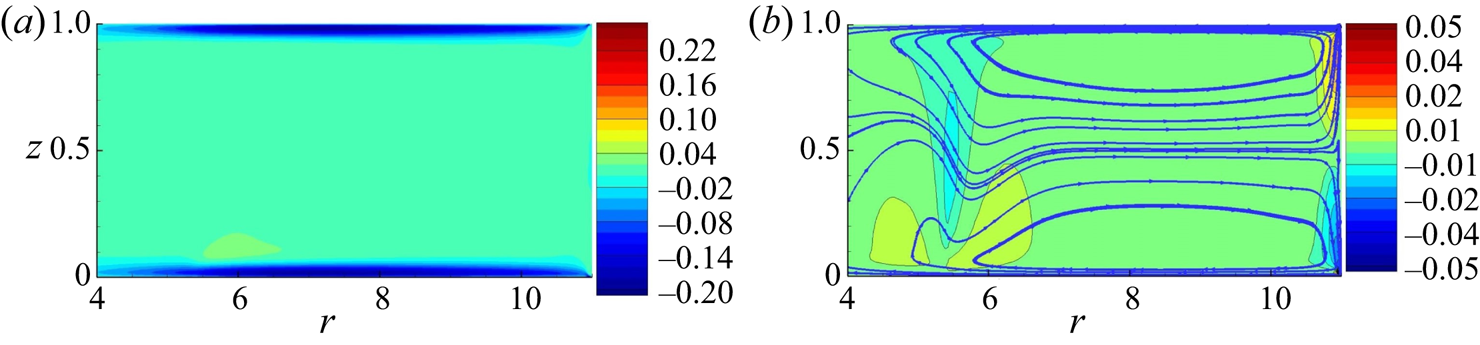
 $R=290$), Ekman recirculations are strong; the Hartmann layer is relatively thick so the centripetal radial velocity in the Hartmann layer is relatively strong (see figure 12). Thus, in the vicinity of a free shear layer, figure 6( f) conveys that the azimuthal velocity near the Hartmann layer is higher than in the core. Within the sidewall layer, one can observe the dramatic variation of the azimuthal velocity and vertical velocity (see figure 7a) along the magnetic field lines besides the separation of the layer.
Snapshots of velocity contours for  $Ha = 55$,
 $Re = 15972$. (a) Distributions of axial velocity
 $v_z$in the plane
 $\theta = 0$ (near the sidewall). (b) Distribution of vorticity in the plane near the top Hartmann wall at
 $z=0.8$. (c) Distribution of vorticity in the plane near the bottom Hartmann wall at
 $z=0.2$. Note that the contour levels for vorticity and
 $v_z$ are chosen so as to enhance the visibility of turbulent flow structures.

Finally, in the examples shown here, 3-D effects are only noticeable within the shear layer for  $R\geq 121$ (
 $Ha=132$,
 $Re=15\,972$; this is in fact better seen from the analysis of the vertical velocity in the side layer in § 3.5). By contrast, for
 $R\simeq 290$ (
 $Ha=55$,
 $Re=15\,972$), weak three-dimensionality, where flow patterns are topologically identical but less intense near the top wall, exists outside the shear layer (see figure 7b,c). The presence of three-dimensionality, however, is controlled by the true interaction parameter at the scale of the considered structure. A consequence is that inertia-induced three-dimensionality is expected to appear in parallel layers of thickness
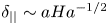 $\delta _{||}\sim a Ha^{-1/2}$ when the local turnover time
 $\delta _{||}/U_0$ becomes smaller than the two-dimensionalisation time at that scale,
 $\rho a^2/\sigma B^2 \delta _{||}^2$, i.e. when the Reynolds number based on the parallel-layer thickness
 $R_{||}=U\delta _{||}/\nu$ exceeds unity. By contrast, since the separation of the wall side layer is induced by the tail of large 2-D structures, which is mostly Q2-D, it can be expected to be controlled by
 $R$.
3.3. Detailed evolution of the flow
For flows without boundary-layer separation, the parameters  $Ha=132$,
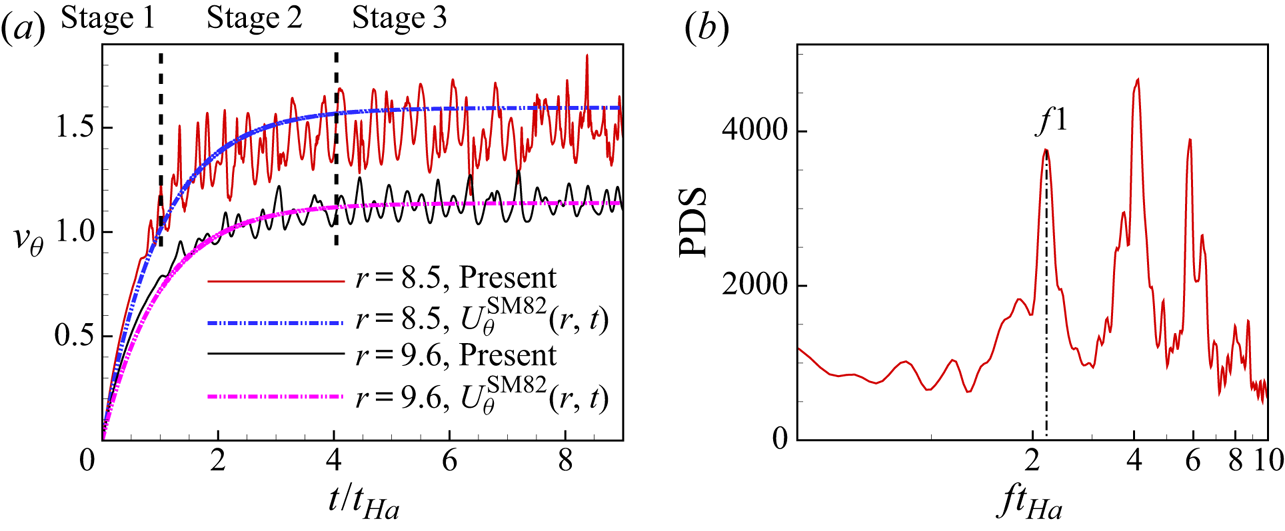
 $Re=15\,972$ are chosen to illustrate the typical evolution process. According to the variation of the azimuthal velocity signals, as shown in figure 8(a), three different stages can be distinguished before the flow reaches its final quasi-equilibrium state. The acceleration of the fluid in a laminar regime corresponds to stage 1. After a short time, the laminar shear layer at
 $r =5.4$ becomes visible as the external annular region
 $5.4 \leq r \leq 11$ is driven in rotation by the Lorentz force. Pothérat et al. (Reference Pothérat, Sommeria and Moreau2005) estimated the stability threshold for this layer as
 $Re/\sqrt {Ha}<2.5$, implying that the circular free shear layer becomes linearly unstable when the Reynolds number based on its thickness exceeds the threshold of 2.5. For all injected current intensities considered here, this critical value on the azimuthal velocity is reached very quickly. Then the circular free shear is subject to a Kelvin–Helmholtz instability, which breaks it up into small vortices (
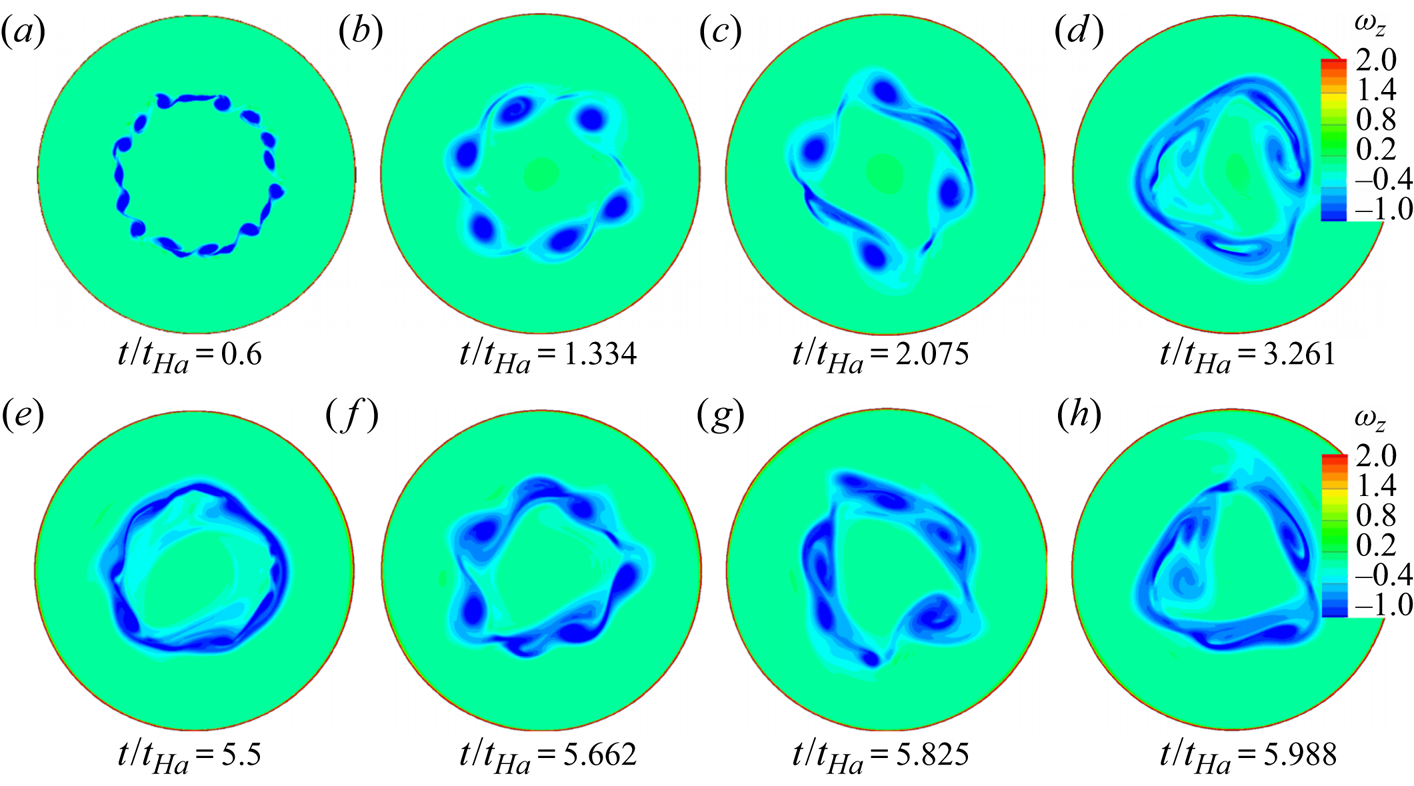
 $t/t_{Ha}=0.6$, figure 9a). This process defines stage 2. The detailed evolution of the vortices along the axial direction,
 $\omega _{z}$, is presented in figure 9. These vortices merge into larger structures very soon after their inception (
 $t/t_{Ha}=1.334,\ 2.075,\ 3.261$, figure 9b–d). They become distorted because of the shear. As shown in figure 8(a), the velocity at two representative locations keeps increasing during this stage. The amplitude of velocity oscillation at
 $r=8.5$ being larger than that at
 $r=9.6$, the turbulent structures exert a weaker influence in the region far from the electrodes.
(a) Typical instantaneous azimuthal velocity signals vs time at  $(6.85,0,0.5)$ and
 $(9.6,0,0.5)$ at
 $Ha=132,\ Re=15\,972$. The solid lines denote the numerical results and the dashed lines denote the theoretical value derived by Messadek & Moreau (Reference Messadek and Moreau2002), i.e.
 $U_\theta ^{\textrm {SM82}}(r,t)=({I}/{4{\rm \pi} rU_{0} \sqrt {\sigma \rho \nu }})(1-\exp (-({t}/{t_{Ha}})))$. (b) Corresponding PDS (power density spectra) at point
 $(5.4,0,0.5)$ within the free shear layer. Here,
 $f$ denotes the frequency.

Evolution of the flow with time at  $Ha=132$,
 $Re=15\,972$. The distribution of the axial vortex structures,
 $\omega _{z}$, on plane
 $z=0.5$.

Stage 3 corresponds to the quasi-equilibrium state of the flow, which, at this point, cycles through a recurring sequence. First, large structures progressively lose intensity and elongate along the free layer ( $t/t_{Ha}=5.5$). Second, these segments break up again and give birth to several smaller vortex structures (
 $t/t_{Ha}=5.662$), which interact with each other and merge into bigger structures (
 $t/t_{Ha}=5.825$). Subsequently, a small number of large structures are formed (
 $t/t_{Ha}=5.988$). The cycle of this recurring sequence is consistent with the base frequency of velocity signals (
 $f1=2.26$) shown in figure 8(b).
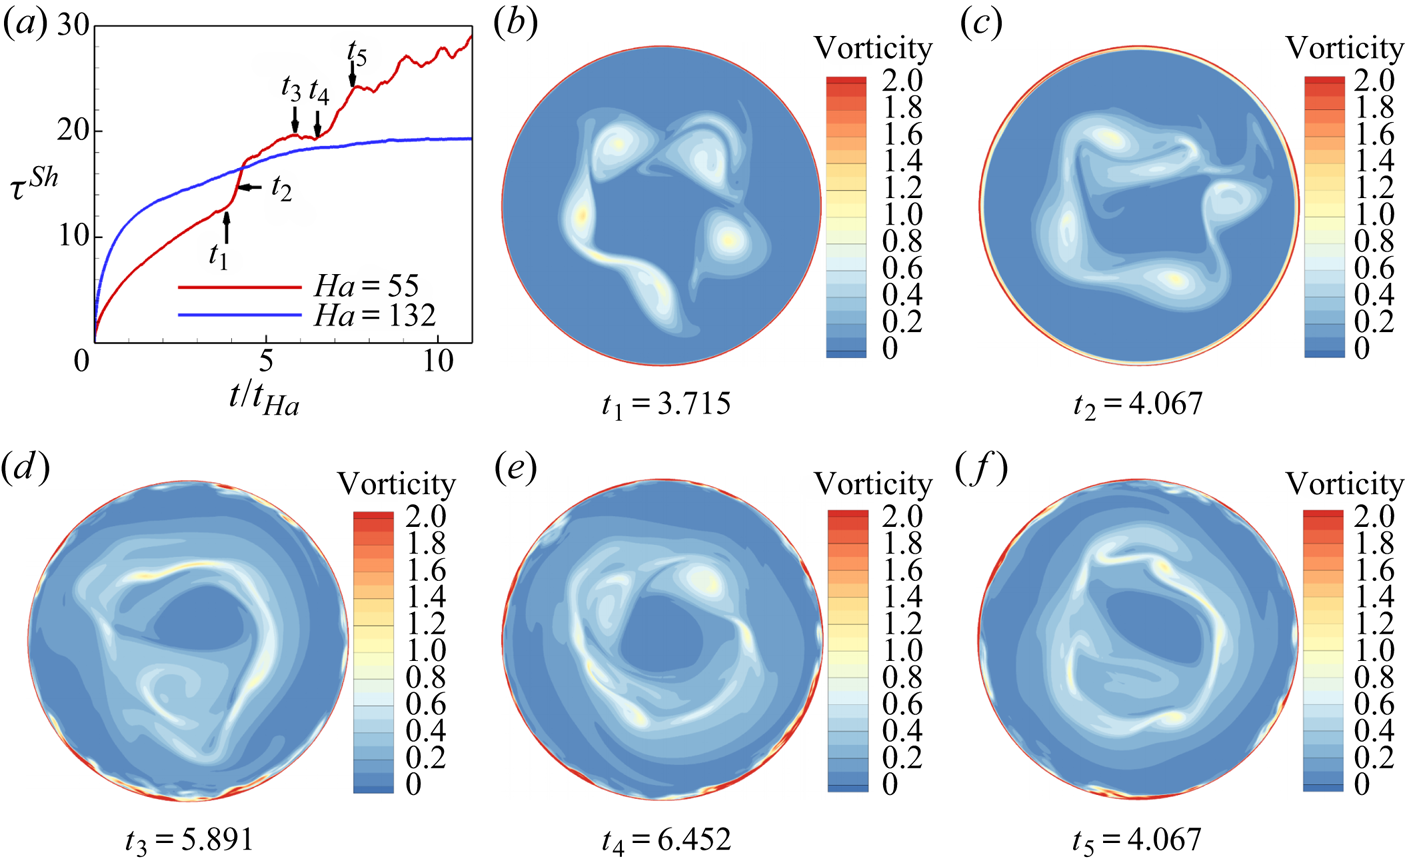
As  $R$ is increased, the most striking feature is the appearance of separation and turbulence within the sidewall layer. Figure 10(a) shows the evolution of the mean shear stress on the sidewall
 $\tau ^{Sh}$, with a sudden increase of
 $\tau ^{Sh}$ between
 $t_{1}$ and
 $t_{2}$ for
 $Ha=55,\ Re=15\,972$. In this interval, the increase of
 $\tau ^{Sh}$ can be ascribed to the random turbulent fluctuations, seen more in detail in § 3.5. From
 $t_2$ (figure 10c), vorticity streaks attached to the vortices generated at the free shear layer start reaching out to the outer side layer, and incur local variations of its thickness. At
 $t_3$ (figure 10d), these variations have become severe to the point of incurring boundary-layer separation. The decrease of
 $\tau ^{Sh}$ at
 $t_{4}$ shown in figure 10(a) confirms the occurrence of separation at the wall side layer. This is consistent with the visualizations of the vortex structures shown in figure 10(d). For
 $Ha=132$ and
 $Re=15\,972$, by contrast, the evolution of
 $\tau ^{Sh}$ is rather smooth and no brutal change in shear stress is observed, indicating the absence of separation. Moreover, the evolution of the case at
 $Ha=55$,
 $Re=15\,972$ in the later stage (
 $t_{3}$,
 $t_{4}$,
 $t_{5}$) is similar to that of the case at
 $Ha=132$,
 $Re=15\,972$, which goes through the same recurring sequence.
(a) The average sidewall shear stress signals variation with time in the case of  $Ha=55$,
 $Re=15\,972$ and
 $Ha=132$,
 $Re=15\,972$. (b–f) Contours of the magnitude of the vorticity on the plane
 $z=0.5$ at different times at
 $Ha=55$,
 $Re=15\,972$.

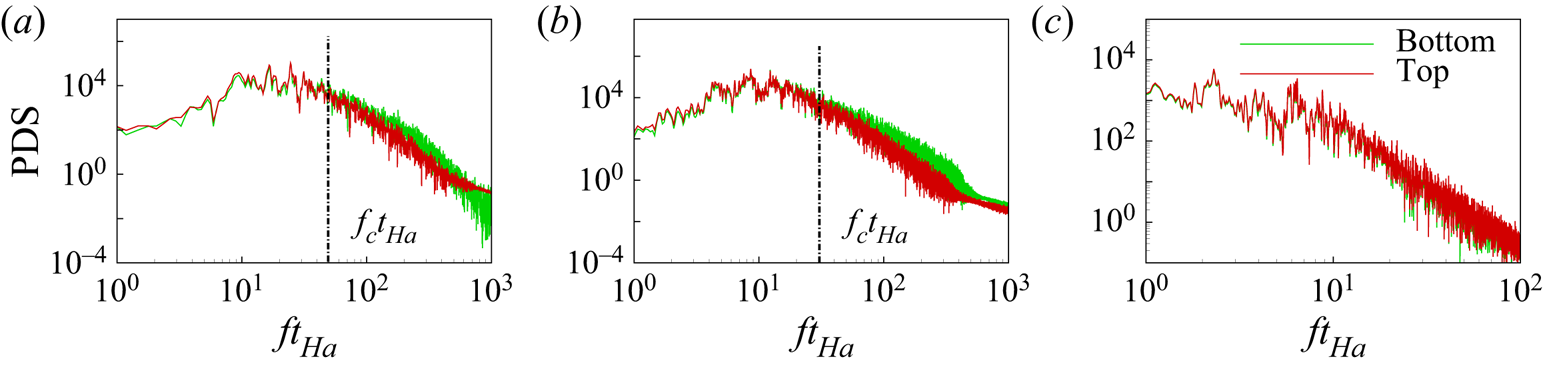
3.4. Spectral analysis
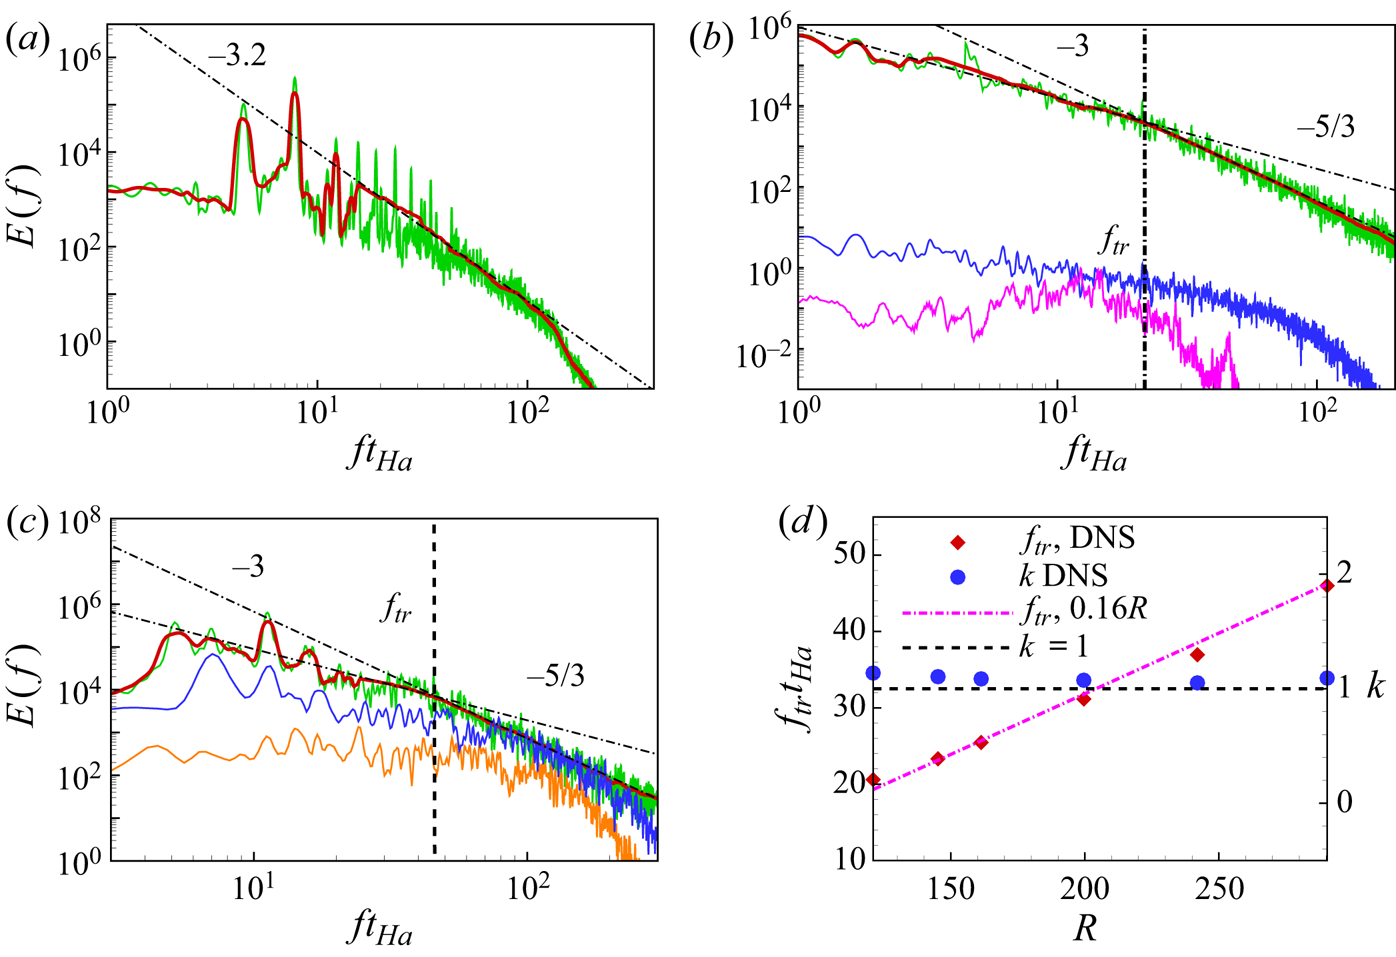
The power density spectra of several typical cases are analysed in this section shown in figure 11. To calculate of the average, we employ 60 probes, uniformly distributed along the angular direction, and take the average of the measured signal as  $v(t)=\frac {1}{60}\varSigma v_{i}(t)$. Spectra are obtained using Welch's averaged periodogram method, while a Hamming window was applied to each overlapping segment of data. Additionally, spatial energy spectra can be deducted from these spectra by taking advantage of the large average azimuthal velocity and using Taylor's hypothesis,
 $2{\rm \pi} f=\langle v_\theta(t,r,\theta,z)\rangle_{t,\theta} k$.
Frequency spectra obtained from velocity time-series. For reference, the power laws  $f^{-3.2}$,
 $f^{-5/3}$ and
 $f^{-3}$, denoted with a dashed-dot line, are also shown. Solid lines correspond to spectra filtered using Bezier spline (red), time-series of azimuthal velocity at point (
 $r=6.85$,
 $z=0.5$, green (within the free shear layer)), axial velocity at point (
 $r=6.85$,
 $z=0.5$, red), axial velocity at point (
 $r=10.98$ (b) 10.95 (c),
 $z=0.5$, blue (within the sidewall layer)), azimuthal velocity at point (
 $r=10.95$,
 $z=0.5$) (a)
 $Ha=528$,
 $Re=15\,972$ (
 $R=30.3$), (b)
 $Ha=264$,
 $Re=31\,944$ (
 $R=121$), (c)
 $Ha=55$,
 $Re=15\,972$ (
 $R=290.4$), (d) The separation frequency of the spectra slops
 $f^{-5/3}$ and
 $f^{-3}$ and the forcing scales for different
 $R$.

For  $R=30.3$, the spectrum of
 $v_{\theta }(t)$ exhibits an expected strong peak at a fundamental frequency corresponding to the passage of the large structures through the measuring probes. The other noticeable peaks represent the harmonic and subharmonic frequencies, as shown in figure 11(a). The spectrum in the inertial region scales as
 $f^{-3.2}$. According to Eckert et al. (Reference Eckert, Gerbeth, Witke and Langenbrunner2001), the spectral exponent in duct-flow turbulence for
 $N\approx 39.0$ relevant to this case is approximately
 $-3.5$, which is consistent with our findings, despite the difference in the geometries of these two types of turbulent shear flows.
When  $R=121$, the peak of the base frequency in the spectra of azimuthal velocity fluctuations can still be observed (see figure 11b), and thus the large structures continue to rotate around the axis. The spectrum in the inertial region can be separated into two parts, with a transition frequency
 $f_{tr}t_{Ha}\simeq 20$. For
 $f_{tr}t_{Ha}\leq 20$, the power spectral density scales as
 $f^{-5/3}$, while for
 $f_{tr}t_{Ha}> 20$, it scales as
 $f^{-3}$. By applying the Taylor's hypothesis, we find the corresponding azimuthal wavenumber of
 $k_{tr}\simeq 1.10$. This value is in accordance with the results of Messadek & Moreau (Reference Messadek and Moreau2002), i.e.
 $\tilde k_{tr}\simeq 1\ \textrm {cm}^{-1}$. The authors claimed that the split spectrum arises as a result of weak Joule dissipation. The spectrum of
 $v_{z}(t)$ within the free shear layer exhibits axial flow that is of much lower energy than the other two components, confirming that the turbulence is dominated by its 2-D horizontal components.
For  $R=290.4$, the spectra exhibit different features (see figure 11c). In the region of the free shear layer, the
 $f^{-3}$ (high frequencies) and the
 $f^{-5/3}$ (low frequencies) power laws are still distinguishable on the azimuthal velocity. The transition frequency,
 $f_{tr}t_{Ha}\simeq 46$, is higher but the corresponding non-dimensional wavenumber almost remains the same,
 $k_{tr}\simeq 1.09$.
Within the sidewall layer, by contrast, the power density spectra of azimuthal velocity (orange line, figure 11(c)) and axial velocity (blue line, figure 11(c)) in the inertial region exhibit a scaling of the form  $f^{-5/3}$.
The apparent constance of  $k_{tr}$ prompts us to compare the transition frequency and the forcing scale for cases of
 $R\geq 121$. As illustrated in figure 11(d), the scaling law for the transition frequency with
 $R$ follows
 $f_{tr}t_{Ha}\simeq 0.16R$. Since in all cases,
 $k\simeq 1$, the separation between the two slopes may simply result from the forcing geometry. In this case, the separation between
 $k^{-5/3}$ and
 $k^{-3}$ may reflect the usual 2-D split between an inverse energy cascade and a direct enstrophy cascade, as already found in MHD flows by Sommeria (Reference Sommeria1986). In this case,
 $k_{tr}$ may be interpreted as the forcing scale at which the mean flow transfers energy to turbulent fluctuations (Alexakis & Biferale Reference Alexakis and Biferale2018).
3.5. Secondary flow
Pothérat et al. (Reference Pothérat, Sommeria and Moreau2000) showed that the recirculations induced by Ekman pumping significantly influence the flow. They can be identified by looking at the variations of the velocity profile in figure 6(e). Although the PSM model already provides a good understanding on the Ekman pumping effect, the detailed flow information across the fluid layer and the structures on the plane parallel to the magnetic fields remain unexplored. This is one of the motivations for carrying out 3-D DNS.
The streamlines of the average fluid velocity shown in figure 12(b) reveal that the Ekman pumping induces a centripetal flow (i.e. away from the sidewall) in the Hartmann layers and a centrifugal flow (i.e. towards the sidewall) in the core. In addition, the streamlines are almost symmetric with respect to the centre plane  $z=0.5$ and the recirculations consist of two symmetrical cells. Due to mass conservation, the mass fluxes in the axial direction match the radial ones. Therefore, two strong vertical jets emerge within the wall side layer because of the decreased boundary thickness. They flow upwards to the top Hartmann layer or downwards to the bottom Hartmann layer, where they pass through a section that is further reduced, since Hartmann layers are thinner than wall side layers. This further enhances the intensity of radial jets driven in the Hartmann layer, as shown in figure 12(a). They then turn towards the core in the much wider region near the electrodes, into much weaker axial flows than those within the side layer, as shown in figure 12(b). This mechanism explains that recirculations are stronger within the free shear layer and the sidewall layer. Ekman pumping incurs a net centrifugal transport of angular momentum as the velocity is smaller in the Hartmann layer. This has two consequences: a squeeze of the sidewall layer and an increased dissipation at the sidewall layer when these recirculations are important. Pothérat et al. (Reference Pothérat, Sommeria and Moreau2000) have derived the analytical expression for the vertical velocity at the interface between the Hartmann layer and the core:
 \begin{equation} v_{z}^-{=}-\frac{5}{6}\frac{\lambda}{HaN}\boldsymbol{\nabla}_{\bot}\boldsymbol{\cdot} [({{\boldsymbol v}}_{\bot}^{-}\boldsymbol{\cdot}\boldsymbol{\nabla}_{\bot}){{\boldsymbol v}}_{\bot}^{-}], \end{equation}
Here,  $ { {\boldsymbol v}}^{-}$ denotes the velocity at the edge of the Hartmann layer,
 $\lambda$ is the aspect ratio and the subscript
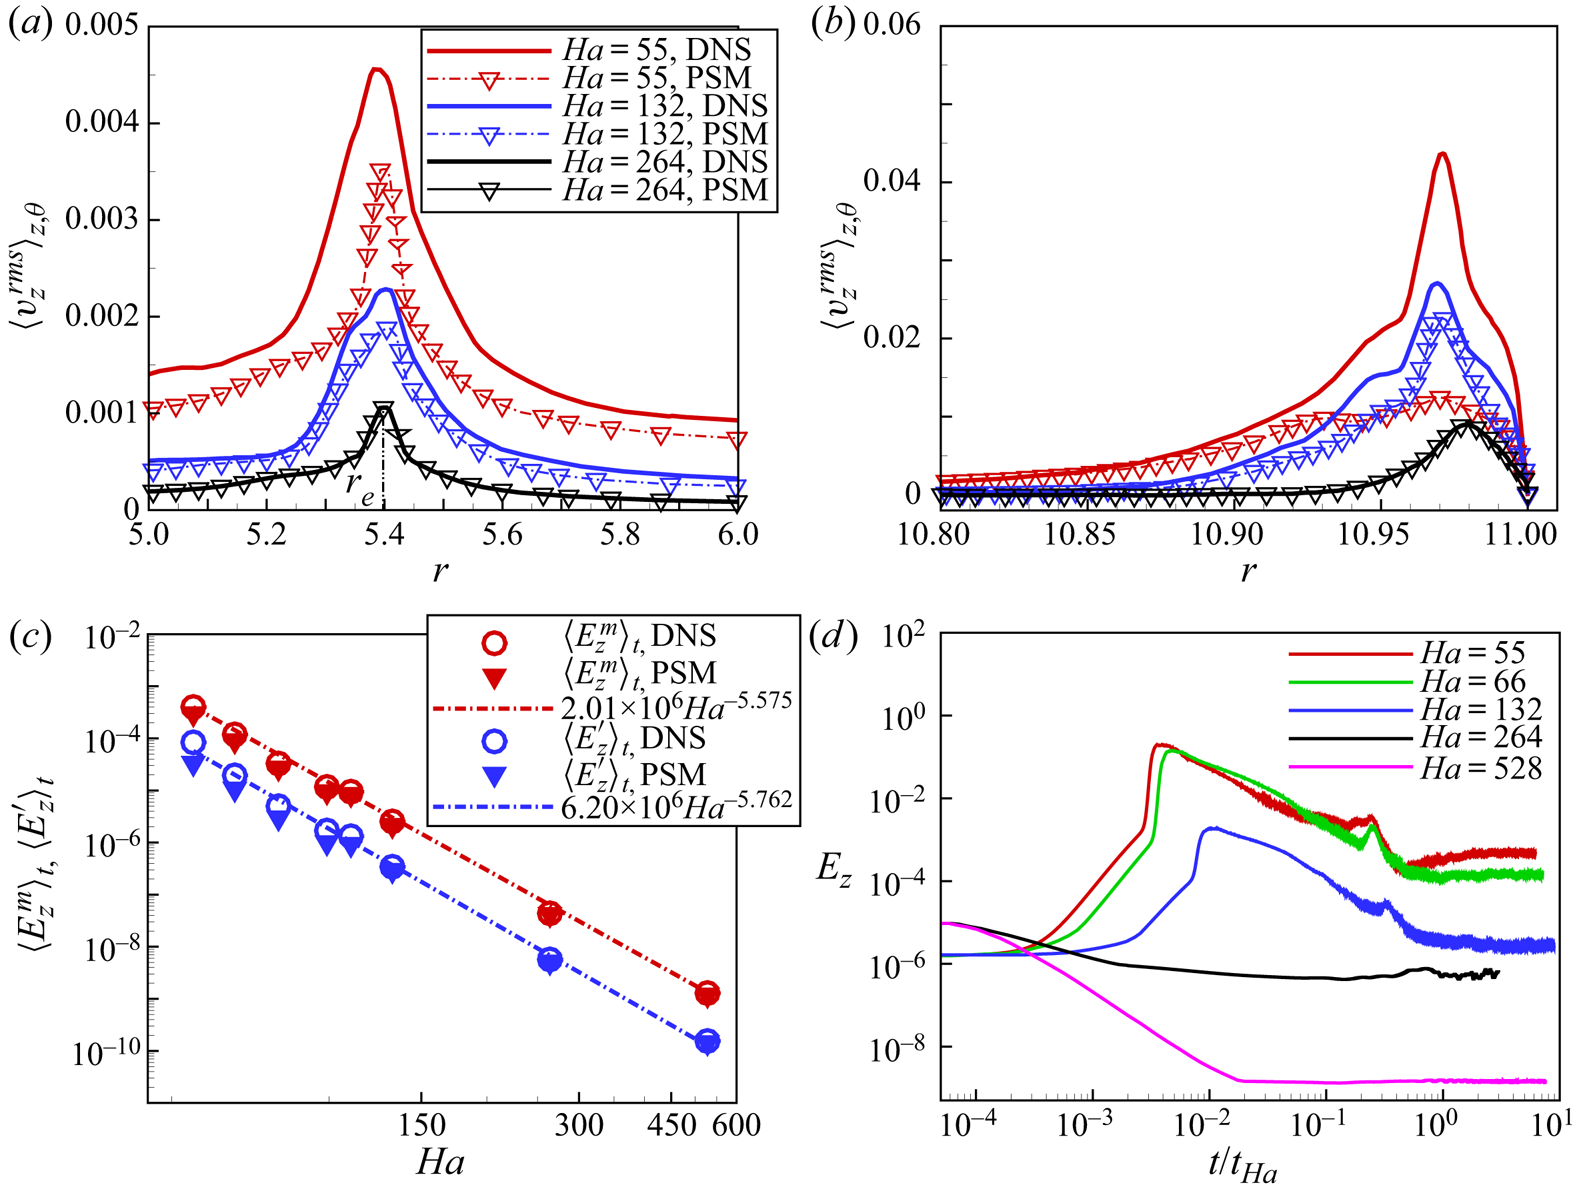
 $_{\bot }$ denotes the vector projection in the direction perpendicular to the magnetic field. Under the assumptions of PSM, any vertical component of velocity is associated with recirculations, whether local or global. Therefore, to assess the limits of the PSM approach, we compare the energies associated with the vertical velocity component obtained with DNS at
 $Re=15\,972$ to the energy obtained from (3.1), distinguishing energies
 $E_z^m$ and
 $E_z^\prime$ associated with the average flow and with the fluctuations. The DNS results show that
 $\langle E_{z}^m\rangle _{t}\sim Ha^{-5.58}$ and
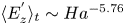 $\langle E^{'}_{z}\rangle _{t}\sim Ha^{-5.76}$ (see figure 13(c), bearing in mind that
 $Re$ is kept constant in these scalings). Values of
 $E_z$ obtained by integrating (3.1) from the results of PSM simulations follow the same scaling even for values of
 $N$ as low as
 $N\simeq 0.19$ (
 $Ha=55$) where the model is expected to break down. This indicates that PSM predicts the global recirculations associated with the mean flow very accurately. The energy associated with the fluctuations predicted by PSM, by contrast, only matches DNS precisely for
 $N\gtrsim 1$ (
 $Ha\gtrsim 126.4$). Below that point, PSM underestimates
 $E_z^\prime$ considerably. The origin of the discrepancy can be found in the radial profiles of vertical velocity fluctuations (figure 13a,b): the discrepancy between the profiles obtained with PSM and DNS is exclusively concentrated in the free shear layer and the wall side layer. More specifically, while this discrepancy grows continuously as
 $Ha$ decreases but remains moderate in the shear layer, the two profiles brutally depart from one another in the wall side layer for
 $Ha=55$, when small-scale turbulent fluctuations appear. Since the profiles of
 $\langle \langle v'_z\rangle^{1/2}\rangle_{t,\theta,z}$ obtained with either PSM or DNS match everywhere else, even for
 $N\lesssim 0.19$, it can be concluded that PSM remains robust at predicting both global and local recirculation down to
 $N\lesssim 1$, but breaks down when small-scale turbulent fluctuations not driven by Ekman pumping appear.
The distribution of mean radial velocity (a), and mean axial velocity, mean streamlines (b) on plane  $\theta =0$ at
 $Ha=80, Re=15972$. (a)
 $U_{r}$ and (b)
 $U_{z}$.

Comparison of the r.m.s. (root mean square) of the fluctuations of the vertical velocity ( $v^{rms}_{z}(r,\theta ,z)$) along the radial direction near the sidewall layer with
 $Re=15\,972$ (a) near the current injection position
 $r=r_{e}$ (b) near the sidewall. Values were averaged along
 $\theta$ and
 $z$. (c) Average part
 $E^{m}_{z}=\int \langle v_{z}\rangle _t ^{2} \,\textrm {d} v$ and fluctuating part
 $E^{'}_{z}=\int (v^{'}_{z})^{2} \,\textrm {d} v$ of the energy in the
 $z$-velocity component, (d) Evolution of
 $E_{z}$, where
 $E_{z}=E^{m}_{z}+E^{'}_{z}$. Here,
 $Re$ is fixed at 15 972 for all four panels.

Figure 13(d) shows the detailed evolution of  $E_z$. One can see that after the injection of the electrical current density at
 $t/t_{Ha}=0$, part of the energy is converted to the kinetic energy along the magnetic field lines, which quickly results in a maximum
 $E_z$. After that,
 $E_z$ tends to decrease until a constant time-averaged value is reached. When stronger magnetic fields are imposed,
 $E_{z}$ reaches a lower constant value for flows initialized in turbulent states. Since the entire secondary flow transits through thin parallel layers, some residual axial flows are always observed within these boundary layers. Therefore,
 $E_{z}$ always stabilises at a non-zero constant value in all the numerical cases, even though it is very small at
 $Ha=528$ (
 $E_{z}<10^{-8}$). Interestingly, the walls have opposite effects on the energy in the third component, depending on whether it is driven by recirculations or turbulence: here the residual value of
 $E_z$ being mostly due to Ekman pumping, it is driven by friction at the Hartmann walls. On the other hand, when turbulence freely decays in the presence of solid Hartmann walls, the energy in the third component associated with random fluctuations vanishes (in the sense that
 $E_z/E\rightarrow 0$ as
 $t\rightarrow \infty$, (Pothérat & Kornet Reference Pothérat and Kornet2015)). In unbounded or periodic domains, by contrast, turbulence decays to a state where
 $E_z/E=1/2$ (Moffatt Reference Moffatt1967; Schumann Reference Schumann1976).
3.6. Boundary layers
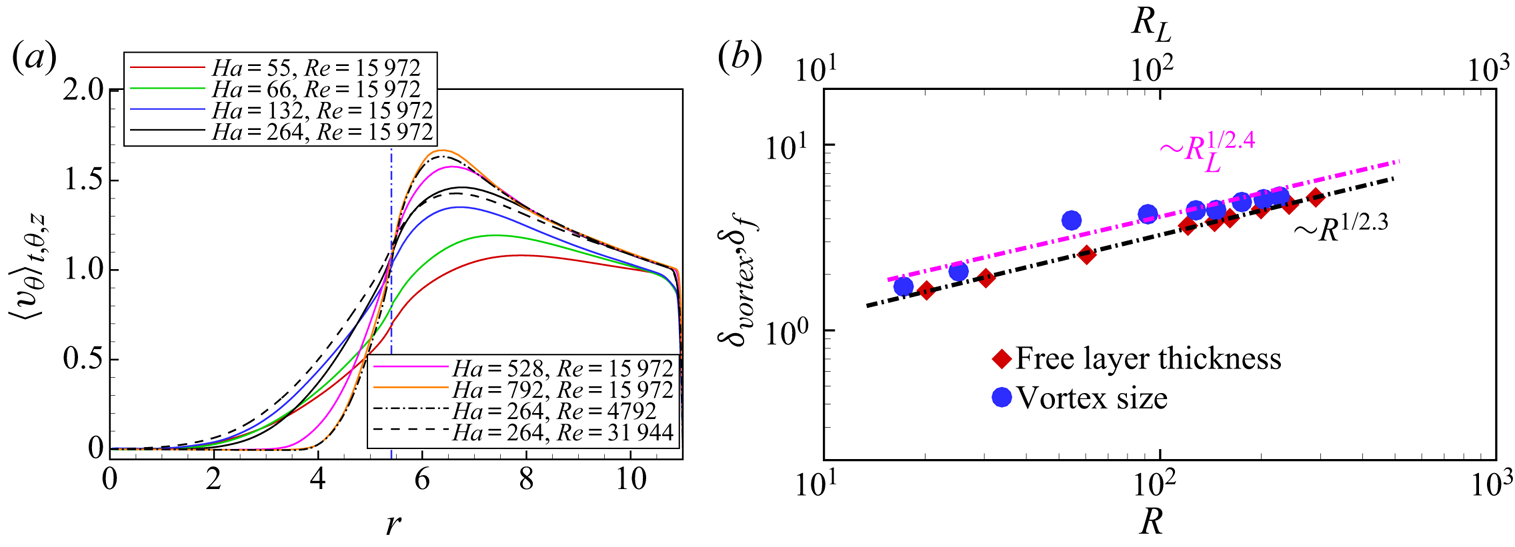
One of the main purposes of the experimental study conducted by Messadek & Moreau (Reference Messadek and Moreau2002) was to investigate the thickness of the free shear layer when turbulence is well established. Figure 14(a) shows the radial distribution of the mean azimuthal velocity, from which the thickness of the free shear layer could be estimated. As mentioned in § 3.4, the free shear layer develops quickly to an unstable state as soon as the current is injected. Therefore, a fraction of the momentum is conveyed from the annulus to the inner region and the boundary layer thickness increases visibly. The resulting entrainment of the fluid in the inner domain is characterised by a lower maximum value of  $\langle v_\theta\rangle_{t,\theta,z}$ compared with that predicted by the laminar theory. For the annulus region, the (non-dimensional) value of
 $\langle v_{\theta }\rangle _{\theta ,z,t}$ increases with
 $Ha$ and decreases with
 $Re$ due to different Ekman pumping effects. To be more specific, at moderate
 $Ha$, either increasing
 $Re$ or decreasing
 $Ha$ enhances the recirculations, and thus the energy dissipation is expected to grow. Conversely, for the inner region, the radial transfer of the momentum associated with recirculations set the fluid in rotation. Thus, the value of
 $\langle v_{\theta }\rangle _{\theta ,z,t}$ in that region increases when recirculations become stronger. In other words, the thickness of the free shear layer increases when the Ekman pumping effect becomes stronger, which is opposite to its effect on the laminar side layer (
 $Ha^{-1/2}$). Thus, the thickness is related to both
 $Re$ and
 $Ha$. We now use the mean azimuthal velocity profiles within a wide parameter space of
 $\{Re,Ha\}$ to determine the thickness of the shear layer
 $\delta _{f}$, which is defined as
 \begin{equation} \delta_{f}=\frac{{\rm \Delta} U_{\theta}}{(\textrm{d} U/\textrm{d} r)_{max}}. \end{equation}
Here,  ${\rm \Delta} U_{\theta }=U_{\theta max}-U_{\theta min}$,
 $U_{\theta min}=0$ and
 $U_{\theta max}$ is the mean velocity value at the intersection of the maximum slope and the mean velocity profile predicted by the laminar theory (2.6). As suggested by Messadek & Moreau (Reference Messadek and Moreau2002), the layer thickness
 $\delta _{f}$ depends on both
 $Re$ and
 $Ha$ according to the relation
 \begin{equation} \delta_{f}=C_{f}(R)^{1/n}. \end{equation}
As shown in figure 14(b), the best fit from our data yields  $C_{f}\simeq 0.44$ and
 $n\simeq 2.3$, respectively, which is consistent with the values obtained by Messadek & Moreau (Reference Messadek and Moreau2002). The maximum relative error between the fitting curve and the calculation data are lower than
 $5.1\,\%$. Moreover, for
 $(Ha,Re)=(792,15\,972)$, the layer thickness from numerical simulation,
 $\delta _{f}\approx 1.64$, agrees well with the experimental one,
 $\delta _{f}\approx 1.61$. This scaling is very different from the theoretical laminar one (
 $\delta _{f} = Ha^{-1/2}$, independent of
 $Re$) and reflects the role of 2-D inertia, measured by
 $R$, in determining the thickness of the free shear layer. In addition, the size of large scales estimated from the velocity fluctuations (see Pothérat et al. Reference Pothérat, Sommeria and Moreau2005) is also shown. Here,
 $R_{L}$ represents the Reynolds number based on the velocity and the size of the large vortices and the size of the large vortices is estimated from the profiles of r.m.s. azimuthal velocity fluctuations. As shown in figure 14(b), their size follows a very similar scaling to the size of the boundary layer
 $\delta _v\simeq 0.57 R_L^{2.4}$ with a maximum relative discrepancy to that law lower than
 $5.6\,\%$.
(a) Radial profiles of  $\langle U_{\theta }\rangle _{\theta ,z}$. (b) Log-log plots of the free turbulent shear-layer thickness
 $\delta _{f}$ and the large-scale vortex size
 $\delta _{vortex}$.

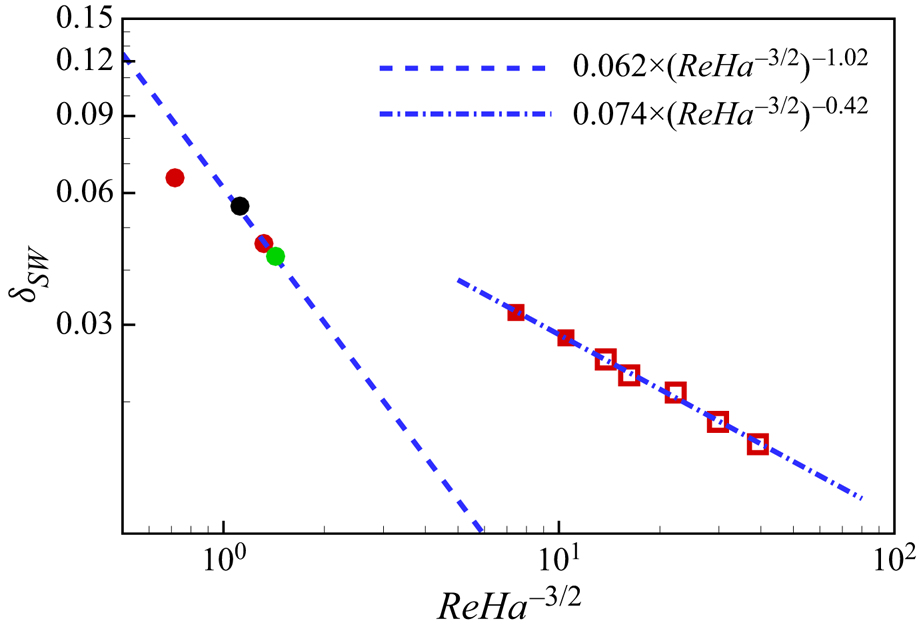
Unlike the free shear layer, the structure of the wall side layer was not experimentally accessible. Three-dimensional simulations make it possible to examine how its thickness varies against parameter  $C=ReHa^{-3/2}$, which Pothérat et al. (Reference Pothérat, Sommeria and Moreau2000) identified as the governing parameter when secondary flows dominate. The thickness
 $\delta _{SW}$ was defined as the distance from the wall to the point where the velocity magnitude reaches 90 % of
 $U_{\theta }^{SW}$, where
 $U_{\theta }^{SW}$ is the azimuthal velocity value at the intersection of the minimum slope and the mean velocity profile. The results are reported on figure 15. For low values of
 $C$, recirculations are weak and
 $\delta _{SW}$ is expected to scale as
 $\delta _{SW}\sim Ha^{-1/2}$. As
 $C$ increases, recirculations become more prominent and
 $\delta _{SW}$ approaches the theoretical scaling of
 $\delta _{SW}\sim C^{-1}$. The picture changes slightly (in the sense of increasing
 $C$) before 3-D turbulence appears in the boundary layer: the thickness suddenly increases to settle on a larger scaling characterised by
 $\delta _{SW}\simeq 0.074(Re\, Ha^{-3/2})^{-0.42}$. More simulations would be needed to confirm that
 $C$ remains the relevant parameter in this regime (though the continued prominence of the secondary flows would suggest this may be the case) and to confirm the exponent of
 $Re$ in this scaling. Interestingly, boundary-layer separation has little visible impact on the scaling of
 $\delta _{SW}$, most likely because of the small ratio of the surface where it occurs to the total surface of the wall.
Variations of the wall side layer thickness  $\delta _{SW}$ against parameter
 $C=ReHa^{3/2}$ (Pothérat et al. Reference Pothérat, Sommeria and Moreau2000) for
 $Re=15\,972$ (red),
 $Re=31\,944$ (green) and
 $Re= 4792$ (black). Full circles: boundary layer in laminar state; full squares: attached boundary layer with 3-D turbulence; hollow squares: separated boundary layer.

3.7. Angular momentum and wall shear stress
For a first estimate of the global angular momentum, we note that most of the viscous and Joule dissipation takes place within the Hartmann layer for Q2-D flows under a strong magnetic field. Since the most intense part of the flow occurs in the outer annulus where the driving force acts, the contribution of the inner region to the total angular momentum can be neglected to derive the simple expression (2.13) from the theory of Sommeria & Moreau (Reference Sommeria and Moreau1982) for the elementary case of a steady inertialess flow. Note that in this case, the Hartmann layers remain laminar and inertialess. This implies that the angular momentum varies linearly with  $I$ and is independent of
 $B$.
The values of  $L_{lam}$ obtained from the present numerical results are plotted in figure 16 (circle open symbols) , along with the values of the angular momentum measured in MATUR (Messadek & Moreau Reference Messadek and Moreau2002) and predicted with the PSM model (triangular open symbols). All the data reported in this figure are normalised by the value
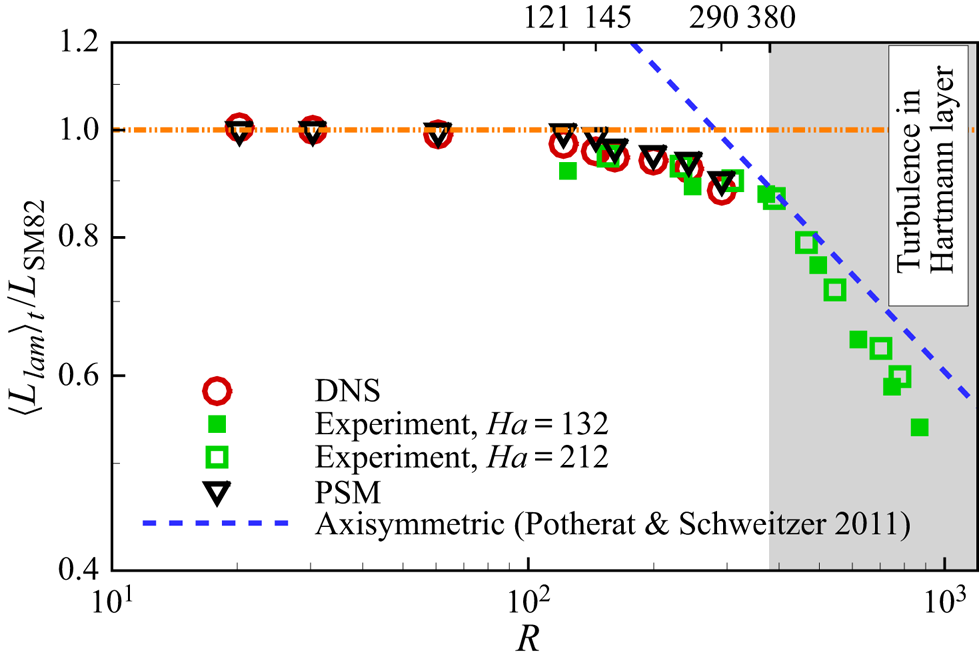
 $L_{\textrm {SM82}}$ predicted with the theoretical expression (2.13), the dashed line corresponds to the theoretical prediction derived by Pothérat & Schweitzer (Reference Pothérat and Schweitzer2011) for turbulent Hartmann layers and the square symbols denote the experimental data. As shown in figure 16, the experimental values, the results of PSM model and our numerical values collapse well into a single curve, which can be divided into three different zones demarcated by changes in slope around
 $R\simeq 121$ and
 $R\simeq 380$. When
 $R < 121$, the numerical values (DNS and PSM) are almost equal to unity, which matches the SM82 linear approximation closely. For
 $R \geq 380$, the experimental values fall to significantly lower values than the linear prediction as would be expected when turbulence arises within the Hartmann layers. However, they match well with the values predicted with the simplified axisymmetric model derived by Pothérat & Schweitzer (Reference Pothérat and Schweitzer2011), which supposes that the Hartmann layers are turbulent. When
 $121 \leq R< 380$, a relatively large discrepancy can be observed between the numerical values (or experimental values) and the theoretical value of SM82 or theoretical value derived by Pothérat & Schweitzer (Reference Pothérat and Schweitzer2011).
Variations of the global average angular momentum  $\langle {L}_{lam}\rangle _t/L_{\textrm {SM82}}$ vs
 $R$. Region with
 $R\geq 380$ (Moresco & Alboussiere Reference Moresco and Alboussiere2004) is defined as regime where turbulence formed within the Hartmann layer. Region with
 $145.2\leq R\leq 290.4$ is defined as flows with turbulence emerging within the side layer. Region with
 $R < 121$ is corresponding to flows without separation of side layer.

An explanation for this intermediate range was provided by Pothérat et al. (Reference Pothérat, Sommeria and Moreau2000), who modified the equation for  $L_{lam}$ from the SM82 theory to account for the dissipation in the side layers:
 \begin{equation} {} \frac{\textrm{d} L_{lam}}{\textrm{d} t}=F-S_{\nu}-\frac{2L_{lam}}{t_{Ha}}, \end{equation}
where  $F$ denotes the global electric forcing and
 $S_{\nu }$ (
 $\sim \overline {\tau ^{Sh}}$) denotes the viscous dissipation at the sidewall layer. At a small forcing, the corresponding viscous effect on the angular momentum is negligible in comparison with the Hartmann friction. Thus, the DNS and PSM results are consistent with the values predicted with the theoretical expression (2.13) when
 $R<121$. By contrast, significant differences emerge between the numerical values and the SM82 theory when
 $121 \leq R<380$, since in this range the viscous dissipation at the sidewall layer cannot be ignored any more. Because the sidewall layer is squeezed by the strong Ekman pumping recirculations, the sidewall layer becomes thin, which results in significant increase of velocity gradient and the global dissipation. The present numerical results confirm this conclusion well when
 $R\in [145.2, 290.4]$, for which these recirculations are significant.
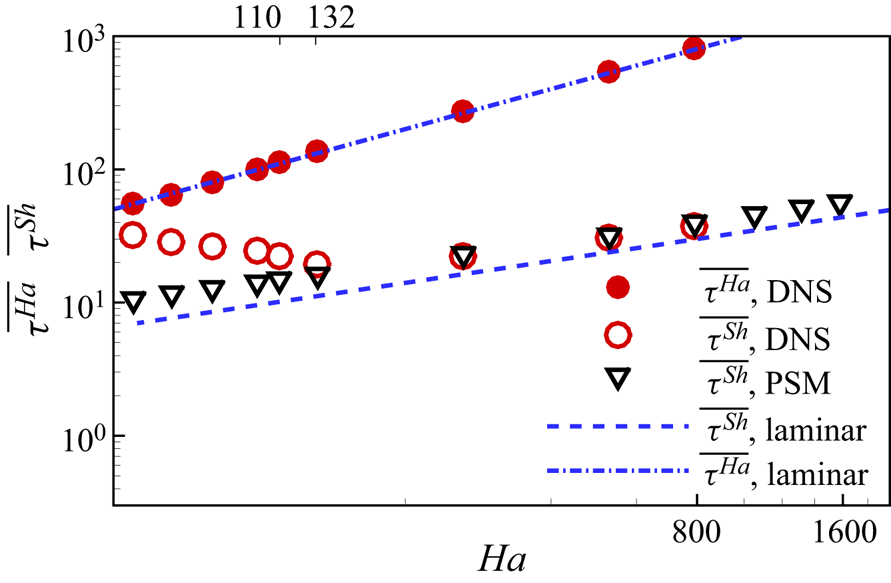
The DNS enable us to go a step further and examine in detail how the wall shear stress is affected by 3-D effects. The variation of the wall stresses ( $\overline {\tau ^{Ha}}$,
 $\overline {\tau ^{Sh}}$) with
 $Ha$ are shown in figure 17. The values of wall stress are different on the Hartmann walls and sidewalls. As shown in figure 17, all the shear stresses on the Hartmann walls collapse well into a single curve (laminar solution,
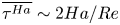 $\overline {\tau ^{Ha}}\sim 2Ha/Re$), even when
 $Ha=55$, which indicates that the Hartmann layers remain laminar for all the cases considered in this work. However, for the sidewall shear stresses, the values gradually depart from the laminar solution as
 $Ha$ decreases (
 $Ha\leq 132$). To understand the role played by recirculation in this phenomenon, all the cases are rerun with the PSM model, as well as additional cases with higher
 $Ha$ (1056 or 1320 or 1584). When
 $Ha\geq 264$, one can see that the results of DNS match well with that of 2-D simulations, but they are noticeably higher than the straight-duct laminar wall stresses because of the recirculations induced by Ekman pumping. For cases with
 $Ha\leq 132$, the recirculations become more and more significant as
 $Ha$ decreases, which results in an increased squeezing of the sidewall layer. Therefore, the values of
 $\overline {\tau ^{Sh}}$ obtained from PSM simulations are higher than those predicted by the scaling law for a straight laminar Shercliff layer. However, DNS values of
 $\overline {\tau ^{Sh}}$ are still significantly higher than the ones from the PSM for
 $Ha\leq 132$. This coincides with the observation that PSM cannot capture the small-scale turbulence within the side layers in this range of parameters and further indicates that the dissipation it incurs dominates even the enhanced dissipation due to the squeezing of the side layer by secondary flows. In summary, the DNS confirm that the Hartmann layer remains laminar for cases with
 $R \leq 290.4$. When
 $121 \leq R\leq 290.4$, the discrepancy between the numerical results and the theoretical results is associated with either the strong squeezing of the sidewall layer or turbulence within the sidewall layer.
Space and time-averaged wall friction over the entire range of  $Ha$ investigated and for
 $(Re=15\,972)$: circle full symbols denote wall stress at Hartmann wall and circle opened symbols denote wall stress on the sidewall For comparison, theories for laminar flows (dashed and dashed-dot line) and results of the PSM model (gradient opened symbols) are shown too.

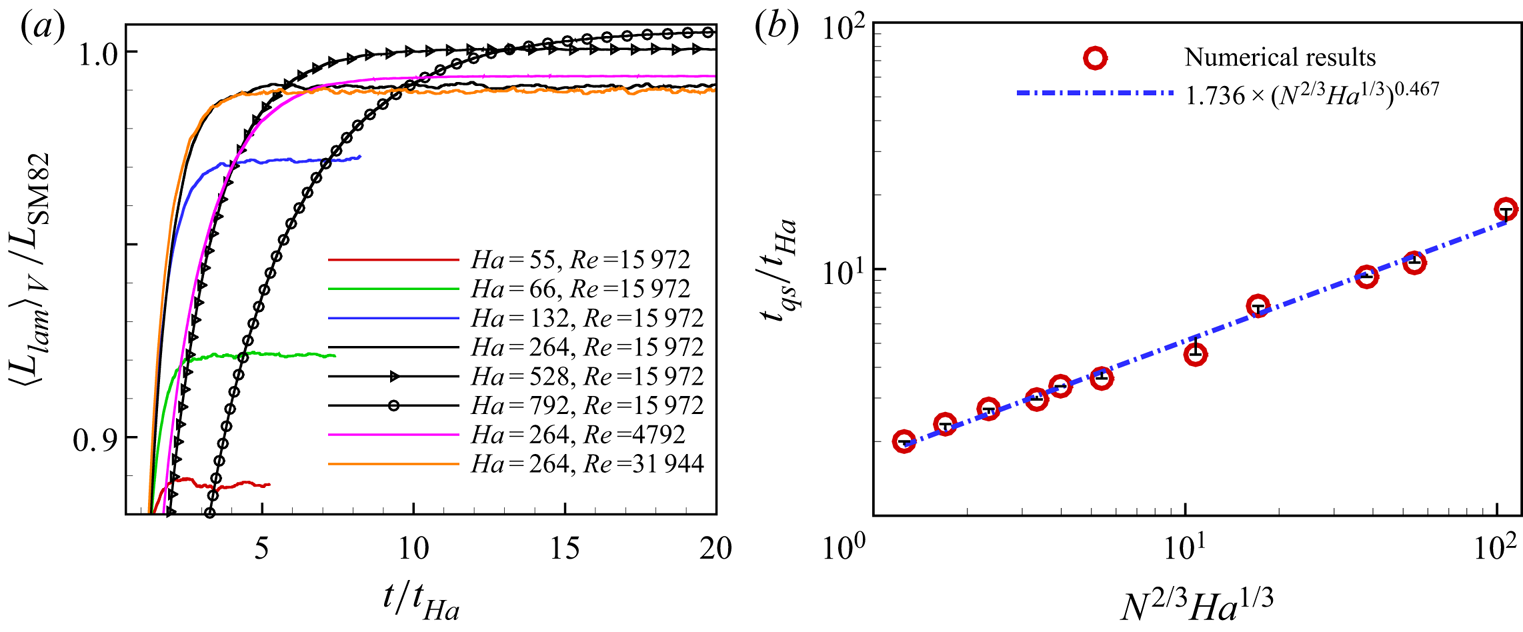
Finally, we compare the time variations of the mean angular momentum for different  $Re$ and
 $Ha$, shown in figure 18(a). For the same
 $Ha$, one can see that the amplitude of the oscillations of the angular momentum in the quasi-steady-state increases with
 $Re$, due to the increasingly turbulent nature of the flow. Furthermore, the transient time (
 $t_{qs}$) for the system to reach the quasi-steady-state from the fluid being at rest decreases with
 $Re$ (we estimate this time by measuring the slope of the
 $L_{lam}(t)$ curve near equilibrium in a log-log diagram, as in Pothérat et al. Reference Pothérat, Sommeria and Moreau2005). This too is associated with global dissipation, which is significantly increased by the strong Ekman pumping at higher
 $Re$, shortening the transient time. For a given
 $Re$, the variation trend with
 $Ha$ is opposite, reflecting the damping of recirculations by the Lorentz force. This effect is quantified in figure 18(b), which shows the variation of the transient time with the combined non-dimensional parameter
 $N^{2/3}Ha^{1/3}=Ha^{5/3}/Re^{2/3}$, with a scaling
 $t_{qs}/t_{Ha}\simeq 1.736(N^{2/3}Ha^{1/3})^{0.467}$, with a maximum relative error between the fitting curve and the numerical data of
 $9.1\,\%$. While
 $t_{qs}/t_{Ha}$ is governed by the same parameter as predicted by PSM, the scaling exponent of 0.467 stands much lower than the value of 1, indicated in Pothérat et al. (Reference Pothérat, Sommeria and Moreau2005). Since a lower exponent is indicative of a higher level of dissipation, this discrepancy may be attributed to the dissipation incurred by 3-D turbulence in the side layers that the PSM model cannot account for.
(a) Evolution of the global angular momentum with time. (b) Transient time obtained numerically after switching on the forcing on a fluid at rest vs the non-dimensional parameter  $N^{2/3}Ha^{1/3}$.

3.8. Three-dimensionality
According to Pothérat & Klein (Reference Pothérat and Klein2014) and Baker, Pothérat & Davoust (Reference Baker, Pothérat and Davoust2015), the dimensionality of a structure in a channel of gap  $a$ is determined by the ratio
 $l_{z}/a$. Here
 $l_{z}$ is the momentum diffusion length along
 ${{\boldsymbol B}}$ by the Lorentz force. This diffusion process takes place in a typical diffusion time
 $\tau _{2D}(l_{\bot })=\tau _{j}(l_{z}/l_{\bot })^{2}$, where
 $\tau _{j}=\rho /\sigma B^{2}$ is the Joule dissipation time. Hence,
 $l_{z}$ can be estimated as (Sommeria & Moreau Reference Sommeria and Moreau1982)
 \begin{equation} l_{z}(l_{\bot})=l_{\bot}\sqrt{N(l_{\bot})}, \end{equation}
where  $N(l_{\bot },v(l_{\bot }))=\sigma B^{2}l_{\bot }/\rho v(l_{\bot })$ is a scale-dependent interaction parameter and
 $v(l_{\bot })$ is the velocity associated with a fluid structure of size of
 $l_{\bot }$. When the Lorentz force diffuses its momentum over a distance much greater than a, i.e.
 $l_{z}/a\gg1 $, the considered structure is consequently Q2-D.
However, the separation of the sidewall may produce complex 3-D structures in the case of  $Ha=55,\ Re=15\,972$. Therefore, the correlation between
 $V_{T}(r,\theta ,t)$ and
 $V_{B}(r,\theta ,t)$ measured at locations within either Hartmann layers exactly aligned with the magnetic field lines (i.e. respectively at
 $z=z_{0}$ (with
 $z_{0}=0.008 < 1/Ha$) and
 $z=1-z_{0}$, but at the same coordinates
 $(r, \theta )$) is used to assess the three-dimensionality of the flow (Klein & Pothérat Reference Klein and Pothérat2010). Here,
 $V_{T}(r,\theta ,t)$ and
 $V_{B}(r,\theta ,t)$ represent the azimuthal velocity fluctuations. The correlation function is defined as
 \begin{equation} c'(r,\theta)=\frac{\sum_{t=0}^{Ti} V_{T}(r,\theta,t) V_{B}(r,\theta,t)}{\sum_{t=0}^{Ti} V_{B}^{2}(r,\theta,t)}. \end{equation}
where  $Ti$ is the duration of the recorded signals. Considering the symmetry of the problem, we shall analyse the radial dependence of this correlation through
 $C^{'}(r)=\langle c'(r,\theta )\rangle _\theta$. For
 $Ha=55,\ Re=15\,972$, the correlation profile of
 $C'(r)$ in figure 19(a) indicates that the flow is very close to Q2-D in most regions, where correlation
 $C'$ is almost unity. This is also demonstrated on figure 19(b), which shows that the instantaneous azimuthal velocity signals away from the shear layers near the top and bottom Hartmann layers are near identical for the same position (
 $r,\theta$). At
 $r=r_{e}$, by contrast, the signals slightly differ, so the correlation
 $C'$ is slightly lower than unity (0.832). At this location, the signals are mostly identical except for a slightly higher amplitude of the bottom signal and short burst where the signals are weakly correlated. The difference in amplitude reflects weak three-dimensionality, as defined by Klein & Pothérat (Reference Klein and Pothérat2010), in the sense that flow near the top and bottom are identical in topology but differ in intensity. The short bursts, by contrast, indicate strong three-dimensionality where topologies are no more identical. The bursts correspond to the passage of coherent structures. Hence, the overall picture is that while the free shear layer itself and the larger structures responsible for the lower frequency oscillations are only weakly three-dimensional, the smaller coherent structures that navigate along it can exhibit strong three-dimensionality.
The results of the case with  $Ha=55, Re=15\,972$. (a) Radial profile of correlation
 $C^{\prime }$. (b) The azimuthal velocity fluctuation signals of six different points in the top and bottom Hartmann layer variation with time. For easy identification, values of
 $v_{\theta }^{\prime }$ at
 $r=6.85$ (
 $r=4.5$) is displayed as
 $v_{\theta }^{\prime }+0.03$ (
 $v_{\theta }^{\prime }-0.03$). (c) The azimuthal velocity fluctuation signals of three different points in the sidewall layer variation with time, along
 $r=10.8$.

Figure 19(c) confirms that strongly three-dimensionality emerges within the sidewall layer, where the signals recorded at all three monitored depths differ noticeably. This is consistent with the distribution of azimuthal velocity within the side layer shown in figure 6( f), where the flows on different transverse plane are not topologically equivalent any more, because of the presence of small-scale 3-D turbulence there.
To further characterise the scale-dependence of three-dimensionality near the electrodes, we analyse the spectra obtained from the velocity signals near the top and bottom Hartmann layers, as shown in figure 20. For  $Ha=66,\ Re=15\,972$ and
 $Ha=264,\ Re=31\,944$, pairs of energy spectra obtained near top and bottom Hartmann walls reveal that the higher frequencies carry significantly less energy in the vicinity of the top wall than that near the bottom wall, which is clear evidence of three-dimensionality. By contrast, lower frequencies almost carry the same amount of energy. According to the theory of Sommeria & Moreau (Reference Sommeria and Moreau1982) and the experiments of Baker et al. (Reference Baker, Pothérat, Davoust and Debray2018), a cutoff scale
 $k_{c}$ (corresponding to
 $f_{c}$ here) separating the Q2-D structures from the 3-D structures can be identified. Here, the velocity signals, averaged over the azimuthal direction, were taken within the free shear layer, so as to minimise the influence of the sidewalls, i.e.
 $r=r_{e}$. For the details about the calculation of
 $f_{c}$, the readers are referred to Pothérat & Klein (Reference Pothérat and Klein2014). When
 $N_{t}$ decreases,
 $f_{c}$ decreases as three-dimensionality contaminates larger and larger scales, as shown in figure 20(a,b). For
 $Ha=264$ and
 $Re=15\,972$, fluctuations within the free shear layer are Q2-D over the entire spectral range (see figure 20c).The variations of the azimuthally averaged cutoff frequency
 $\langle f_c \rangle _\theta (N_{t})$ are represented in figure 21(a), and reveal that the variations of
 $\langle f_c \rangle _\theta$ across all investigated cases collapse onto a single curve, and therefore that
 $\langle f_c \rangle _\theta$ is determined by
 $N_{t}$ with a scaling law
 \begin{equation} \langle f_c \rangle_\theta \simeq0.063N^{0.37}_{t}. \end{equation}
This general law gives a clear estimate for the minimum frequency of vortices that are affected by 3-D inertial effects. Additionally, we obtain the minimum transverse wavenumber of 3-D vortices,  $\langle k_c \rangle _\theta \simeq 0.396 N^{0.37}_{t}$ by applying Taylor's hypothesis, taking advantage of the strong azimuthal flow component. This law is the first numerical confirmation of the original theoretical law given by Sommeria & Moreau (Reference Sommeria and Moreau1982),
 $k_{c}\sim N^{1/3}_{t}$, following Baker et al. (Reference Baker, Pothérat, Davoust and Debray2018)'s recent experimental confirmation. It is also interesting to note that while this law applies to homogeneous and sheared turbulence alike, the corresponding scaling law for the cutoff frequency (3.7) differs from the power law with exponent
 $\sim 2/3$ found in turbulence with weak average flow (Klein & Pothérat Reference Klein and Pothérat2010).
Power density spectra calculated from instantaneous azimuthal velocity signals acquired at locations near the free shear layer inside the top (red line) and bottom (green line) Hartmann layers for different magnetic interaction parameters. (a)  $Ha=66,\ Re=15\,972$. (b)
 $Ha=264,\ Re=31\,944$. (c)
 $Ha=264,\ Re=15\,972$.

(a) The azimuthal averages of  $f_{c}$, separating Q2-D large structures from the small 3-D ones, normalised by
 $U_{0}/a$. (b) Radial profiles of azimuthal averages of
 $f_{c}$, when
 $Ha=55,\ Re=15\,972$ and
 $Ha=66,\ Re=15\,972$.

Given the spatially inhomogeneous nature of the flow in the radial direction, the question arises as to where three-dimensionality is preferentially found. An answer is provided by the spatial distribution of the azimuthally averaged variations of the cutoff frequency  $\langle f_{c} \rangle _\theta$ along
 $r$, shown in figure 21(b). It is quite clear that
 $\langle f_{c}\rangle_{\theta}$ drops at the locus of the free shear layer and the sidewall layer. On the other hand, it remains much higher outside of these regions. Hence, structures are Q2-D over a greater range of scales, down to smaller ones outside the shear layers and 3-D turbulence appears concentrated in the side layer and, to a slightly lower extent, the free shear layer. This suggests that three-dimensionality arises out of direct energy transfer from the mean shear flow to scales at the scale of the shear layers (
 $\delta$) or lower. This is supported by the argument that the high level of energy imparted to them by the shear makes the turnover time at this scale (
 $\sim \delta /\langle U_\theta (r)\rangle$, with
 $r=r_e$ or
 $r=R$ for the free shear and side layers respectively) significantly smaller than the two-dimensionalisation time (
 $\sim (\sigma B^2/\rho )(a/\delta )^2$). Indeed, the ratio of former to the latter expresses as
 $N(\delta /a)^2$, which is significantly smaller than unity in both cases.
Conversely, away from the shear layers, the mean flow does not inject energy into the small scales. Since the recent experiments on MHD turbulence without a strong mean flow of Baker et al. (Reference Baker, Pothérat, Davoust and Debray2018) suggest that even in the presence of moderate three-dimensionality, the energy cascades upscale, the flow is dominated by larger vortices for which two-dimensionalisation is more efficient. Unlike in these experiments, however, the presence of vorticity streaks in the wake of these vortices suggests that an additional transfer mechanism less favourable to large scales may be at play in the outer region of MATUR.
3.9. Componentality
To understand the occurrence of the third component velocity fluctuations not driven by global Ekman pumping, we show instantaneous distributions of axial velocities in the cross-section  $\theta =0$ (see figure 7a). One can see that the turbulent fluctuations are localised within the layer near the sidewall. Moreover, this three-dimensionality contaminates the entire height of the vessel, from the bottom to the top of the Hartmann layers. As conveyed in figure 7(b,c), the distributions of instantaneous vertical velocity (including intensity and topological structure) are different on the plane near the top wall (
 $z=0.8$) and near the bottom wall (
 $z=0.2$). This further confirms that the wall side layer is the region where practically all strong three-dimensionality is concentrated.Since the same regions characterise the appearance of three-dimensionality and three-componentality, the question of how the two are linked naturally arises. To gain insight into it, we have sought a relationship between the local energy in the fluctuations of the third velocity component
 $\langle v_z^{\prime 2}\rangle _{t,z,\theta }$ and the cutoff frequency, which provides a measure of three-dimensionality across the turbulent spectrum. These quantities for several cases are plotted on figure 22. The collapse of the data into a single curve shows that the degree of the two-dimensionality of the energy spectrum is tightly linked to the amount of energy in the third component. Therefore,
 $\langle v_z^{\prime 2}\rangle _{t,z,\theta }$ is solely determined by the true interaction parameter
 $N_t$ and follows a simple power law, i.e.
 $\langle v_z^{\prime 2}\rangle _{t,z,\theta } =2\times 10^{-7}\langle f_c \rangle _\theta ^{-2.485}$. The maximum relative error between the fitting curve and the numerical data are lower than
 $2.2\,\%$. As such, as increasing the magnetic field drives the flow towards a Q2-D, two-component state, both the transitions to the Q2-D state and to the two-component state are progressive and controlled by the true interaction parameters through scalings
 $f_c\simeq 0.063 N_t^{0.37}$ and
 $\langle v_z^{\prime 2}\rangle _{t,z,\theta } \simeq 0.126\times 10^{-7}N_t^{-0.92}$. It is noteworthy that this scaling implies a different dependence on
 $Ha$
 $\langle v_z^{\prime 2}\rangle _{t,z,\theta }\sim Ha^{-1.84}$ than that for
 $E^\prime _z= {\rm \pi}R^2 a\langle \langle v_z^{\prime 2}\rangle _{t,z,\theta }\rangle _r\sim Ha^{-5.76}$. Since the two quantities only differ though radial averaging, the difference can be understood by noticing that if fluctuations are confined to a thin radial region of thickness
 $\delta _{3D}$ then
 $E^\prime _z\sim {\rm \pi}R^2a ({\delta _{3D}}/{R})\langle v_z^{\prime 2}\rangle _{t,z,\theta ,\delta _{3D}}$, where the subscript
 $\delta _{3D}$ indicates averaging over that region. Under this assumption, it would follow that
 $\delta _{3D}/R\sim Ha^{-3.92}$ (finding the scaling with
 $Re$ would require extra simulations over a wider range of its values). The corresponding region is much thinner than the free shear layer and the wall side layer (see § 3.7). However, the radial profiles of vertical velocity fluctuations (figure 13) suggest that a sharp peak of vertical velocity fluctuations develops within the sidewall layer, that would explain this scaling. This suggests that the dominant contribution to the three-component turbulence in the regimes explored in this paper arises out of a very thin region of thickness within the wall side layer.
The distribution of the average relative turbulent intensity  $\langle v^{\prime }_{z}v^{\prime }_{z}\rangle _{t,z,\theta }$ with
 $\langle f_{c}\rangle _{\theta }$, when
 $Re=15\,972$, for the different radial values of
 $\langle f_{c}\rangle _{\theta }$ shown on figure 21(b).

4. Conclusions
The present study reports 3-D DNS of electrically driven MHD turbulent shear flows in the MATUR experiment (Messadek & Moreau Reference Messadek and Moreau2002). The numerical results, which are obtained in a configuration where current is injected far from sidewalls (at a radius of  $r_{e}=5.4$) and in regimes where the Hartmann layers remain laminar (
 $18.2\leq R\leq 290.4$), provide accurate solutions in excellent agreement not only with the experimental data but also with the 2-D PSM model and other theoretical approaches. Crucially, the DNS provide access to the detail of the 3-D dynamics. This enabled us to identify the location and the nature of 3-D structures, and the role they play in the overall flow dynamics.
The simulations reproduce typical flow features observed in the experiment and predicted by the theories. The velocity field is dominated by a limited number of large coherent structures formed at the unstable shear layer. Their dynamics and the inner structure of the layers led us to identify two changes in behaviour when the ratio of 2-D inertia to the Lorentz force  $R=Re/Ha$ was varied: from
 $R\simeq 121$, small-scale turbulence appears in the wall side layer, a value that is consistent with previous findings in other set-ups with curved walls (Zhao & Zikanov Reference Zhao and Zikanov2012). For
 $R\geq 145.2$, that layer separates from the wall, most likely under the influence of fluctuations induced by the large vortices in the outer region. The thickness
 $\delta _{SW}$ of the wall side layers follows this sequence of changes: in the nonlinear laminar regime, it converges to the asymptotic scaling
 $\delta _{SW}\sim (Re\, Ha^{3/2})^{-1}$ theoretically predicted by Pothérat et al. (Reference Pothérat, Sommeria and Moreau2000), but becomes much thicker with a scaling of
 $\delta _{SW}\sim (Re\, Ha^{-3/2})^{-0.42}$ following the onset of 3-D turbulence.
In addition, the energy spectra exhibit a significant dependence on  $R$: for
 $18.2\leq R\leq 60.5$, the turbulent spectrum possesses an inertial range with a
 $E(f)\sim f^{-3}$ power law. For
 $R\geq 121$, inertia plays a greater role. The spectra show a transition frequency between low frequency ranges where
 $E(f)\sim f^{-5/3}$ and high frequency ranges where
 $E(f)\sim f^{-3}$, similar to the split between inverse energy and direct enstrophy cascades found in Q2-D MHD flows by Sommeria (Reference Sommeria1986). The dynamics of the free shear layer seen in the experiments was also recovered as DNS showed that the thickness of the free shear layer varies nearly as the vortex size does (scaling as
 $R^{1/2.3}$ and
 $R_{L}^{1/2.4}$, respectively).
Detailed analysis of the secondary flow confirmed the phenomenology identified by Pothérat et al. (Reference Pothérat, Sommeria and Moreau2000, Reference Pothérat, Sommeria and Moreau2005) whereby, for  $N\lesssim 1$, the global recirculation associated with the main azimuthal flow induces a flux of angular momentum towards the wall side layer. The ensuing thinning of that layer is responsible for an increased dissipation. The intensity of the recirculation matches closely the PSM prediction. At statistical equilibrium, the energy associated with the average axial flow component was found to scale as
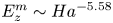 $E_{z}^m\sim Ha^{-5.58}$ both in PSM and the DNS, confirming that it is driven by this main recirculation. The energy associated with the fluctuating part of this component was, on the other hand, underestimated by PSM compared with the DNS for
 $N\lesssim 1$. The discrepancy originates in the small-scale turbulence produced in the wall side layer. This effect was found to incur a significant increase in wall shear stress and in turn a reduction in the global angular momentum, a phenomenon that previous theories could not capture. The extra dissipation is also a possible cause for the shortened transient time observed when the flow is initiated at rest.
A major benefit of the 3-D DNS was to afford a detailed scrutiny of the 3-D effects. The main source of three-dimensionality was found in the small-scale turbulence fed by the mean shear in the free shear layer and the wall side layer. Outside of these regions, turbulent spectra still exhibit a high frequency range of 3-D structures and a low frequency range of Q2-D ones, as predicted by Sommeria & Moreau (Reference Sommeria and Moreau1982) and found in turbulence driven by a crystal of vortices (Klein & Pothérat Reference Klein and Pothérat2010). As in this case, the frequency separating these two ranges scales with the true interaction parameter  $N_t$, albeit with a different exponent as
 $f\sim N^{0.37}$ instead of
 $f\sim N^{2/3}$. The difference is due to the presence of a strong background flow and, when converted into wavenumbers, both experiments exhibit the same cutoff scaling of
 $k_c\sim N_t^{1/3}$ (Baker et al. Reference Baker, Pothérat, Davoust and Debray2018), as predicted by Sommeria & Moreau (Reference Sommeria and Moreau1982). This result shows that the existence of a cutoff wavelength separating 3-D and Q2-D turbulent fluctuations extends to sheared turbulence. As such, this result and the associated scaling can be expected to hold in a wider class of flows including duct flows.
Simultaneous access to all three velocity components further enabled us to establish a link between the local dimensionality of the turbulence (measured by the cutoff frequency  $f_c$) and its componentality, measured by the energy in the axial component of the velocity fluctuations. While the latter decreases monotonically with the former, and both are controlled by the true interaction parameter through simple power laws,
 $\langle v_z^{\prime 2}\rangle _{t,z,\theta } \sim 0.126 N_t^{-0.92}$ and
 $\langle f_c \rangle _{\theta }\simeq 0.063 N_t^{0.37}$. Unlike for the dimensionality scaling (
 $f_c$), no prediction exists for the dimensionality scaling (
 $\langle v_z^{\prime 2}\rangle _{t,z,\theta }$), so this raises the question of its applicability to other types of quasi-static MHD turbulence, beyond shear flow turbulence or even beyond this particular experiment. The question is all the more relevant as in the regime explored here, three-component turbulence was found almost exclusively within a very thin region of the wall side layer. As such, a further step in understanding the link between componentality and dimensionality could target flows where 3-D turbulence is more broadly distributed.
Acknowledgements
The authors also greatly appreciate the anonymous reviewers for their comments, which significantly helped to improve the manuscript.
Funding
The authors acknowledge the support from NSFC under grant nos. 51636009, 51606183 and CAS under grant nos. XDB22040201, QYZDJ-SSW-SLH014.
Declaration of interests
The authors report no conflict of interest.