INTRODUCTION
Tomato (Solanum lycopersicum L.) is widely grown throughout the world because of its adaptability and versatility. India is the second largest producer of tomatoes in the world with an acreage of 865000 ha and production and productivity of 16·8 megatonnes (mt) and 19·5 mt/ha, respectively (Kumar et al. Reference Kumar, Mistry, Singh and Gandhi2011). The crop is susceptible to several pathogens but tomato leaf curl virus (TLCV) has been the major cause of yield losses since it was first reported in the late 1930s in Israel. The disease, transmitted by whitefly, is caused by geminivirus (family Geminiviridae, genus Begomovirus) having either a single genetic component (designated DNA-A) or two components (designated DNA-A and DNA-B). Both DNA-A and DNA-B are single-stranded DNA genomes of c. 2·7 kb size and encode viral factors essential for viral replication, encapsidation, transmission and systemic spread. In India, the disease has been reported to cause up to 90% damage (Shankarappa et al. Reference Shankarappa, Sriharsha, Rangaswamy, Aswathanarayana, Prameela, Kulkarni, Muniyappa, Rao and Maruthi2008; Singh et al. Reference Singh, Rai and Singh2010). Stunted plant growth, shortened internodes, leaves that roll upward and inwards with small chlorotic leaflets, curled lamina between the veins and small-sized fruits, etc. are the major symptoms of this disease (Banerjee & Kalloo Reference Banerjee and Kalloo1987a ,Reference Banerjee and Kalloo b ; Delatte et al. Reference Delatte, Dalmon, Rist, Soustrade, Wuster, Lett, Goldbach, Peterschmitt and Reynaud2003; Singh et al. Reference Singh, Rai and Singh2010). Management of TLCV is focused upon application of systemic insecticides against the insect vectors, which are only partially effective, uneconomical and eco-hazardous. Moreover, vector control will only be of partial success because of the rapid turnover rate of the vector population in the tomato crop (Delatte et al. Reference Delatte, Dalmon, Rist, Soustrade, Wuster, Lett, Goldbach, Peterschmitt and Reynaud2003; Borah & Dasgupta Reference Borah and Dasgupta2012). Hence, breeding for resistance to TLCV is a desirable solution (Shankarappa et al. Reference Shankarappa, Sriharsha, Rangaswamy, Aswathanarayana, Prameela, Kulkarni, Muniyappa, Rao and Maruthi2008). Sources of resistance to TLCV are limited in cultivated species of tomato, except for H-2, H-11, H-23, H-24, H-36, TLB-111, TLB-119 and TLB-183 (Kalloo & Banerjee Reference Kalloo and Banerjee1990; Muniyappa et al. Reference Muniyappa, Padmaja, Venkatesh, Sharma, Chandrasekhar, Kulkarni, Hanson, Chen, Green and Colvin2002). Resistance is prevalent in wild species, e.g. S. habrochaites, S. pimpinellifolium, S. chilense, S. pinnelli and S. peruvianum (Banerjee & Kalloo Reference Banerjee and Kalloo1989; Vidavsky et al. Reference Vidavsky, Leviatov, Milo, Rabinowitch, Kedar and Czosnek1998; Vidavski et al. Reference Vidavski, Czosnek, Gazit, Levy and Lapidot2008) and efforts are directed towards structuring the recombinant inbred lines (RILs) using these sources that are genetically homozygous and can be propagated without further segregation (Gonzalo & van der Knaap Reference Gonzalo and van der Knaap2008). The present investigation was undertaken with the objective of screening tomato genotypes against TLCV and to analyse the inheritance pattern of TLCV resistance, with acceptable horticultural traits, in the progeny of tomato obtained by intra-specific crosses between S. lycopersicum×S. lycopersicum (a derivative of S. habrochaites f. glabratum).
MATERIALS AND METHODS
Evaluation and screening of genetic materials
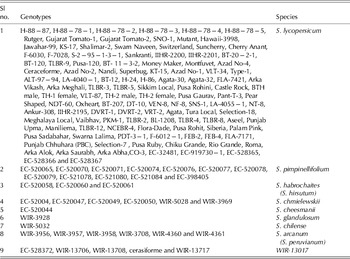
A total of 153 (35 wild and 118 cultivated lines) diverse tomato genotypes including seven Solanum species (Table 1) were evaluated at the Indian Institute of Vegetable Research, Varanasi, U.P., India (83°00′E, 25°19′N latitude, 128·93 m asl). The screening of tomato genotypes was carried out under naturally infected field conditions during the Kharif (July–October) and Rabi (October–February) seasons for three consecutive years (2006/07–2008/09); artificial screening was performed subsequently, during the Rabi season of 2008/09. Tomato seeds were sown in nursery beds during the last week of June and mid-September for the Kharif and Rabi seasons, respectively. Fifteen plants were transplanted in four replications with spacing of 40 × 60 cm during July and October.
Genotypes of tomato and related species used in the study

The observations on disease incidence were recorded after every 15 and 30 days after transplanting (DAT) in glasshouse and field conditions, respectively. The disease was scored on a 0–5 scale with some modifications (Banerjee & Kalloo Reference Banerjee and Kalloo1987a ), where 0 = 0–5% (highly resistant), 1 = 5·1–12·0% (resistant), 2 = 12·1–25·0% (moderately resistant), 3 = 25·1–50·0% (moderately susceptible), 4 = 50·1–75·0% (susceptible) and 5 = 75·1–100% (highly susceptible). The coefficient of infection (CI), percent disease incidence (PDI) and response value (RV) were calculated by the following formula:
 $$\eqalign{{\rm PDI} = & \displaystyle{{{\rm Score}\,{\rm of}\,{\rm individual}\,{\rm plant} \times 100} \over {{\rm No}{\rm.} \,{\rm of}\,{\rm plant}\,{\rm samples \times maximum}\,{\rm rating}\,{\rm scale}}} \cr {\rm CI} = & {\rm PDI} \times {\rm RV}} $$
(RV is categorized by scoring point on 0 = 0, 1 = 0·12, 2 = 0·25, 3 = 0·50, 4 = 0·75 and 5 = 1·00)
Artificial inoculation was performed in the glasshouse by adopting mass and cage inoculation techniques, to screen the genotypes under high disease pressure. Healthy colonies of whiteflies (Bemisia tabaci), to be used as vectors, were maintained on aubergine (S. melongena) plants under controlled conditions. All the 153 tomato genotypes were used for confirmation of results inferred from the field study. Seeds were sown at a density of ten seeds per pot; ten-day-old tomato seedlings were inoculated and kept in an insect-proof glasshouse. For mass inoculation, an insect-proof nylon net (c. 1·8 × 1·2 × 1·5 m) was used and tomato seedlings were exposed to the whiteflies under protected conditions. The healthy and infected plants were maintained in 1:10 ratio and the latter was changed every 72 h to provide a continuous source of virus inoculum. In cage inoculation, viruliferous whiteflies were released into cages covered with nylon nets of mesh size 40 and containing healthy plants for a period of 24 h. After this, imidachloprid was sprayed to stop any further damage by the insects. Plants were examined at regular intervals for TLCV symptoms.
Stability analysis
Meteorological parameters such as rainfall, temperature and humidity were obtained from the Meteorological Observatory of IIVR, Varanasi, UP, India, during the study period. For isolation of stable genotypes against TLCV resistance, the data were first subjected to analysis of variance to test the significance of the genotype × environment interaction. The stability parameter, i.e. regression coefficient (b) and deviation from regression (sd2) were estimated using the model proposed by Eberhart & Russell (Reference Eberhart and Russell1966).
Population development
In the present study, the cultivar H-88-78-1 was recorded as being highly resistant to TLCV. It is a derivative of S. habrochaites f. glabratum. It was used as a control and crossed with four susceptible lines, Punjab Chhuhara, Arka Vikash, CO-3 and DVRT-2, to produce F1 crosses. Four F1 hybrids were selfed and advanced to produce four F2 individual-segregating populations. These four crosses, viz., Punjab Chhuhara × H-88-78-1, Arka Vikash × H-88-78-1, CO-3 × H-88-78-1 and DVRT-2 × H-88-78-1, were designated as Population 1, Population 2, Population 3 and Population 4, respectively. The F2 population was harvested at maturity stage by the single seed dissection method and proceeded to F3 generation with RILs strategy.
Experimental design and observation recorded
The five treatments, P1, P2, F1, F2 and F3 for each population, were planted separately in a randomized complete block design (RCBD) with four replications in October 2008 and 2009, and July and October of 2009 and 2010, at a spacing of 45 × 60 cm. Standard agronomic practices were followed. The plant population of four F2 crosses (150 plants distributed in four replication of each cross), four F3 crosses (150 progeny obtained by each individual F2 crosses) with P1, P2 and F1 hybrids (40 plants of each) were evaluated in field and glasshouse conditions. Observations were recorded after 30, 45, 60 and 90 DAT for TLCV incidence and PDI was assessed on a scale of 0–5 (Banerjee & Kalloo Reference Banerjee and Kalloo1987a ). Five phenotypic characters were observed at the time of harvesting of fruits: PDI, plant height (PH), number of fruits per plant (NFPP), average fruit weight (AFW) and fruit yield per plant (FYPP).
Data analysis
Chi-square (χ 2) analysis
The χ 2 analysis was studied for TLCV (PDI) along with plant and fruit morphology by using four population of F2 generation. Chi-square was calculated by the following formula:
 $$\chi ^2 = \sum {({\rm O} - {\rm E})2/E} $$
where ‘O’ is the observed frequency in each category; ‘E’ is the expected frequency in the corresponding category.
Generation mean analysis
In order to find differences among parents and parents v. hybrids, F2:F3 the data obtained for each character were analysed by RCBD. The five parameter models (m, d, h, i and l) can be estimated (Hayman Reference Hayman1958) by the following formula:where
 $M = \bar F_2 = {\rm mean}\,{\rm effect}$
; D = 1/2
 $\overline {{\rm P}_1} $
− 1/2
 $\overline {{\rm P}_2} $
= pooled additive effects; H = 1/6 (4
 $\bar F_1 $
+ 12
 $\overline {{\rm F}_2} $
− 16
 $\overline {{\rm F}_3} $
) = pooled dominance effect; I=
 $\overline {{\rm P}_1} $
−
 $\overline {{\rm F}_2} $
+ 1/2 (
 $\overline {{\rm P}_1} $
−
 $\overline {{\rm P}_2} $
+ h) − 1/4 l = pooled additive × additive epistatic effects; L = 1/3 (16
 $\overline {{\rm F}_3} $
− 24
 $\overline {{\rm F}_2} $
+ 8
 $\overline {{\rm F}_1} $
) = pooled dominant × dominant epistatic effects.
RESULTS
Screening of genetic material
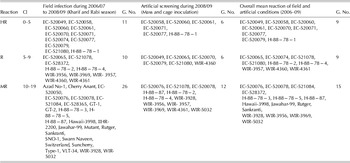
One hundred fifty three tomato genotypes were screened in field conditions during the Kharif and Rabi seasons and in the glasshouse under controlled conditions through cage and mass inoculations technique (Table 2). Thus, the 153 tested genotypes were categorized into highly resistant (9), resistant (9), moderately resistant (15), moderately susceptible (52), susceptible (55) and highly susceptible (13) categories on the basis of natural infection and artificial inoculation. However, nine genotypes of four Solanum species, S. chmielewskii (EC-520049), S. habrochaites (EC-520058, EC-520060 and EC-520061), S. pimpinellifolium (EC-520070, EC-520071, EC-520077 and EC-520079) and S. lycopersicum (H-88-78-1) exhibited high resistance to TLCV up to 12 weeks after transplanting. It was also found that several genotypes recorded as resistant/tolerant under field conditions, proved to be susceptible in the artificial inoculated condition. Initial symptom expression was generally delayed in resistant/tolerant accessions by 5 or 6 weeks after transplantation, while highly susceptible genotypes manifested disease symptoms within 2–4 weeks after transplantation. It was noted in the present investigation that disease spread was rapid, within 30–45 DAT, in the Kharif season as compared with Rabi crops. It was also observed that the incidence of disease increased more rapidly during 45–90 DAT in the Rabi season as compared to 0–44 and >90 DAT.
Response of TLCV disease in tomato genotypes in various environmental (field and artificial) conditions during 2006–09

CI, coefficient of infection; G. No., genotype number; HR, highly resistant; R, resistant; MR, moderately resistant.
Performance of seasonal variation v. coefficient of infection
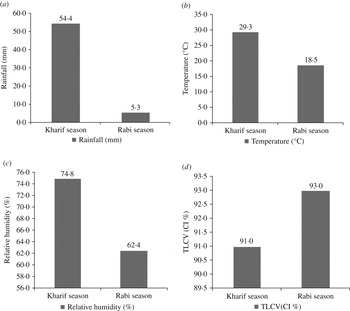
All the 153 genotypes were examined for symptoms and the disease score was recorded under field conditions. Disease severity was greater in the Rabi season than in the Kharif season, as evidenced by the increased number of susceptible genotypes. The disease CI of all genotypes tested was influenced greatly by rainfall, temperature and humidity during both seasons (Fig. 1). During the Kharif season, the rainfall, temperature and humidity increased rapidly but the CI was lower compared with the Rabi season.
(a) Rainfall, (b) average of maximum and minimum temperature, (c) relative humidity and (d) average coefficient of infection (CI %) for TLCV disease under field conditions during Kharif and Rabi seasons of 2006–2009.

Stability analysis
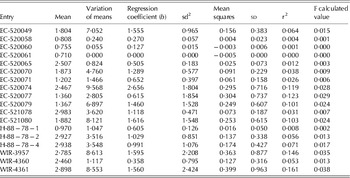
The results of the stability estimates of mean (x), deviation from regression (sd2) and regression coefficient (b) for incidence of resistance to TLCV in 18 genotypes of tomato indicated that EC-520058, EC-520060, EC-520061, EC-520065, EC-520071, EC-520077, WIR-4360, H-88-78-1 and H-88-78-4 showed a lower average response (b < 1) than others (b > 1) (Table 3).
Stability analysis between resistant tomato genotypes in different environments for TLCV disease

Pooled mean = 1·93, s.e. (mean) = 0·15, mean of b = 1·00, s.e. of b = 0·249.
r2 = coefficient of determination, F = f-test for varieties and replications.
Genetic ratio within Mendelian populations
In F2 populations, the female parent (P1) was susceptible and the male parent (P2) was resistant. Mendelian segregation was applied to the F2 populations obtained from these resistant and susceptible parents, which showed a 3 (resistant):1 (susceptible) single major gene dominance ratio for TLCV (Table 4). The resistant: susceptible plant ratio of Populations 1, 2, 3 and 4 were 115:32, 100:40, 101:37 and 108:35 with χ 2 values of 0·819, 0·914, 0·242 and 0·021, respectively. The current work also found that phenotypic dominance of H-88-78-1 had been transferred to the F2 individual plant population. The plants and fruit morphology of the F2 generation showed a 1:2:1 genetic ratio (P1: intermediate: P2) of each population in comparison to both parents (Table 4). The genetic ratio for plant and fruit morphology of Populations 1, 2, 3 and 4 were 35:75:37, 33:64:43, 27:78:33 and 32:77:34 with χ 2 values of 0·289, 2·457, 2·869 and 0·902, respectively.
Number of plants in six classes (score) of TLCV reaction and in three classes (score) of morphological characters for tomato plant growth and fruit shape in four F2 populations and their χ 2 test value and P values

Note: Population 1, (Punjab Chhuhara × H-88-78-1); Population 2, (Arka Vikash × H-88-78-1); Population 3, (CO-3 × H-88-78-1); Population 4, (DVRT-2 × H-88-78-1).
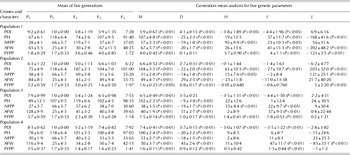
Generation mean and comparison test
The generation mean comparison test indicated the diversity between each trait. In the present study, it was found that the means of P1 were more diverse than those of P2 used in each population for each trait. The mean values of PDI were significantly different in each of the four Populations 1, 2, 3 and 4 (Table 5). In the case of PH, F1 and F3 were close and significant but F2 was different in Population 1. In the remaining three populations, F1 was more diverse and non-significant than the F2 and F3 generations. For NFPP, the F2 and F3 generations were closer to each other than to F1, due to the dominance of P2 (H-88-78-1). For AFW, the average value of the F1 and F2 generations were more diverse and non-significant than F3 generation for Populations 2 and 3. However, F1 and F3 were less diverse and significant than the F2 generation in Populations 1 and 4. For FYPP, the F1 and F2 were near to each other but F3 was diverse in Population 1. Again, F2 and F3 were more diverse and significantly different than F1 in Populations 2 and 3, but in Population 4 the F1, F2 and F3 were less diverse than P2 and more diverse than P1 and significantly different for fruit yield.
Estimates of generation mean and five quantitative parameters in four populations with their s.e.

PDI, percent disease incidence; NFPP, number of fruits per plant; AFW, average fruit weight; FYPP, fruit yield per plant; m, mean effect; d, pooled additive effects; h, pooled dominance effect; I, pooled additive × additive epistatic effects and l, pooled dominance × dominance epistatic effects; PBC, Punjab Chhuhara; A. Vikash, Arka Vikash.
Generation mean analysis
The data presented in Table 5 indicate additive, dominant, additive × additive and dominant × dominant genetic models for four populations with five more diverse characters, viz., PDI, PH, NFPP, AFW and FYPP. In the present study, PDI was significant and was a better fit to the additive (m+d) genetic model for Populations 1 and 2, whereas Populations 3 and 4 were a better fit for additive, dominant and additive × additive (m+d+h+i) inheritance models. In the case of PH, Population 1 exhibited additive, additive × additive and dominant × dominant (m+d+i+l) inheritance and Population 2 was better fitted to the additive, dominant, additive × additive and dominant × dominant (m+d+h+i+l) inheritance model. Populations 3 and 4 exhibited only additive gene action.
The other traits, i.e. NFPP, AFW and FYPP, fitted different non-allelic gene interaction for each of the four populations. Number of fruits per plant was expressed as various types of gene interaction, i.e. the additive and dominant (m+d+h) inheritance model for Populations 1 and 3, additive and dominant × dominant (m+d+l) for Population 2, and additive gene-interaction in Population 4. Average fruit weight was expressed by additive, additive × additive and dominant × dominant (m+d+i+l) non-allelic gene interaction in Populations 1 and 4, respectively, while additive gene-interaction in Population 2 and additive and additive × additive (m+d+i) inheritance models were seen in Population 3. Similarly, FYPP was also governed by dominant, additive × additive and dominant × dominant (Population 1), additive (Population 2), additive, dominant and additive × additive (Population 3), additive and additive × additive (Population 4) non-allelic gene interaction (Table 5). In the current results, the yield traits indicated both types of inheritance model for each population, either additive and additive × additive or dominant and dominant × dominant.
DISCUSSION
In the current study, 153 tomato genotypes were screened against TLCV under field and glasshouse conditions and a number of resistant accessions were observed, mainly from the wild species but including one cultivated species, H-88-78-1, which is derived from S. lycopersicum×S. habrochaites f. glabratum. Most reports in the literature highlight that resistance against TLCV has come from wild accessions, i.e. S. pimpinellifolium, S. peruvianum, S. chilense, S. habrochaites and S. chmielewskii (Banerjee & Kalloo Reference Banerjee and Kalloo1987a , Reference Banerjee and Kalloo b ; Vidavski et al. Reference Vidavski, Czosnek, Gazit, Levy and Lapidot2008) but that a resistant cultivar having a cultivated (S. lycopersicum) background is still to be found (Kalloo & Banerjee Reference Kalloo and Banerjee1990; Singh et al. Reference Singh, Rai and Singh2010). The current study also found that several genotypes were resistant under field conditions but showed susceptibility in the artificially inoculated condition. A possible reason for field resistance could be that these resistant genotypes inhibit the initial infection and delay the incidence of disease, or inhibit further multiplication of the virus, thereby reducing the inoculum load. Another reason may be that artificial screening through mass and cage inoculation provides clearer confirmation and is more stringent in comparison with open field screening methods (Pico et al. Reference Pico, Diez and Nuez1998; Singh et al. Reference Singh, Rai and Singh2010). H-24, a tomato cultivar derived from Hissar Arun×S. habrochaites f. glabratum, was found to be susceptible to TLCV disease in the present study, but was previously reported as resistant or moderately resistant against TLCV (Kalloo & Banerjee Reference Kalloo and Banerjee1990, Reference Kalloo and Banerjee2000) and resistant for tomato yellow leaf curl virus (TYLCV) due to the presence of Ty2 gene on chromosome 11 (Hanson et al. Reference Hanson, Bernacchi, Green, Tanksley, Muniyappa, Padmaja, Chen, Kuo, Fang and Chen2000). Findings similar to those of the present study that this cultivar showed susceptibility against TLCV disease have been discussed in many other studies (Tripathi & Varma Reference Tripathi and Varma2002; Ji et al. Reference Ji, Scott, Hanson, Graham, Maxwell and Czosnek2007; Singh et al. Reference Singh, Rai and Singh2010).
In the present study, disease severity was greater in the Rabi than the Kharif season, when rainfall, temperature and humidity increased but the CI was lower. One plausible reason could be that although the rate of increase in humidity over a short period of time in the Kharif season was high, overall humidity was higher in the Rabi season. Under the conditions found at Varanasi during the Kharif season, the relative humidity is about 45–50%, while in the Rabi season it is around 75–78%. Other reasons could be that the whitefly vectors do not survive in high temperatures, or the viral strain may favour the Rabi season for infection. An earlier study showed that the number of whiteflies (B. tabaci) was higher during December to February (Konaté et al. Reference Konaté, Barro, Fargette, Swanson and Harrison2008) and the spread of TLCV disease was amplified with increases in the whitefly population (Cohen & Antignus Reference Cohen, Antignus and Harris1994). The reports of Moustafa (Reference Moustafa, Laterrot and Trousse1991) and Nono-Womdim et al. (Reference Nono-Womdim, Swami, Green, Gebre-Selassie, Laterrot, Marchoux and Opena1996) stated that the peak whitefly population and the highest spread of disease occurred in the first week of December.
In the current stability analysis results, a total of 18 resistant tomato genotypes showed a low response to TLCV. These lowest disease incidences indicated low regression coefficients (b ⩽ 1) and may be stable in each environment. A stable genotype was taken as one which showed (i) a low/high mean (ii) a regression coefficient (b) around unity and (iii) non-significant means square deviation from regression (Eberhart & Russell Reference Eberhart and Russell1966). An earlier report indicated that low incidence of disease coupled with regression values of b ⩽ 1 showed good stability of tomato genotypes in each environment (Kalloo & Banerjee Reference Kalloo and Banerjee1990). Hence, genotypes with the lowest disease incidence and exhibiting low as well as non-significant sd2 and b values indicate stable and adaptive genotypes that can be grown successfully in leaf curl virus-infested areas.
Mendelian segregation on F2 populations showed a 3 (resistant):1 (susceptible) single major gene dominance ratio for TLCV. As discussed earlier, S. habrochaites is resistant to several diseases and is a good genetic source for developing resistant varieties (Banerjee & Kalloo Reference Banerjee and Kalloo1987a , Reference Banerjee and Kalloo b ; Vidavsky et al. Reference Vidavsky, Leviatov, Milo, Rabinowitch, Kedar and Czosnek1998). The present investigation indicated the involvement of dominant epistatic gene action for the expression of TLCV in all four populations. Banerjee & Kalloo (Reference Banerjee and Kalloo1987b ) also observed a dominant genetic ratio (13:3) when L. hirsutum f. glabratum was crossed with an L. esculentum variety (HS-101, HS-102, HS-110 and Punjab Chhuhara), which agrees with the current findings. The current work also found that phenotypic dominance of H-88-78-1 had been transferred to the F2 individual plant population, which may be due to S. habrochaites f. glabratum, known for possessing tight gene linkage for TLCV resistance. Monforte & Tanksley (Reference Monforte and Tanksley2000) also observed >85% coverage of S. habrochaites (LA-1777) genome in a S. habrochaites×L. esculentum (E. 6206) cross. However, the plants and fruits morphology exhibited a 1:2:1 genetic ratio (P1:intermediate:P2) in each population. The Mendelian ratio may also be possible due to the genetic characters of the two parents used in the breeding programme. Moreover, there was no dominance or epistatic effects. The development of the intermediate-type plant showed heterozygosis in segregating the population, which may depend upon the recombination between each quantitative trait loci (QTL). Similar studies for plant growth morphology and fruit quality have been conducted by many workers (Coaker et al. Reference Coaker, Meulia, Kabelka, Jones and Francis2002; Pornsuriya & Pornsuriya Reference Pornsuriya and Pornsuriya2009; Zdravkovic et al. Reference Zdravkovic, Pavlovic, Girek, Brdar-Jokanovic, Savic, Zdravkovic and Cvikic2011).
The generation mean comparison test indicated the diversity between each trait, viz. PDI, PH, NFPP, AFW and FYPP. In the populations investigated, the means of the parents contrasted more than the means of the F1, F2 and F3 generations for each trait. For the present study, selection of contrasting parents was a prerequisite for the generation mean analysis as proposed by Mather & Jinks (Reference Mather and Jinks1971). Similar methods for generation of mean analysis have been used in tomato to study the inheritance of other complex traits such as a general method of additive, dominant and epistatic variation for using traits (Banerjee & Kalloo Reference Banerjee and Kalloo1989; Shekara et al. Reference Shekara, Kulkarni and Muniyappa2003; Devi et al. Reference Devi, Singh, Devi, Singh and Laishram2005; Zdravkovic et al. Reference Zdravkovic, Pavlovic, Girek, Brdar-Jokanovic, Savic, Zdravkovic and Cvikic2011).
In the present study, Populations 1 and 2 showed additive gene action but Populations 3 and 4 indicated additive, dominant and additive × additive non-allelic gene interaction for TLCV. This may be due to a lack of dominant-type non-allelic gene interaction or absence of homogeneity in Populations 3 and 4 (Banerjee & Kalloo Reference Banerjee and Kalloo1989; Shekara et al. Reference Shekara, Kulkarni and Muniyappa2003). Similarly, PH fitted the additive, additive × additive and dominant × dominant (m+d+i+l) model for Population 1 and additive, dominant, additive × additive and dominant × dominant (m+d+h+i+l) inheritance model for Population 2, whereas Populations 3 and 4 showed additive gene action. In agreement with the current findings, it has been reported previously that the progeny derived from wild species have morphology similar to their wild parents (Banerjee & Kalloo Reference Banerjee and Kalloo1987b , Reference Banerjee and Kalloo1989). The remaining yield traits, such as NFPP, AFW and FYPP, were expressed by different inheritance models for each population, such as additive, dominance, additive × additive and dominance × dominance (m+d+h+i+l), because there were more significant differences between the two parents (P1 and P2), F1 and F3 generations. These types of gene action have also been reported previously for both inter-specific and inter-varietal crosses (Banerjee & Kalloo Reference Banerjee and Kalloo1989; Padmini & Vadivel Reference Padmini and Vadivel1996; Zdravkovic et al. Reference Zdravkovic, Zivoslav, Mirjana, Bogoljub and Milan2000, Reference Zdravkovic, Pavlovic, Girek, Brdar-Jokanovic, Savic, Zdravkovic and Cvikic2011; Dhaliwal et al. Reference Dhaliwal, Gupta, Singh and Cheema2001).
CONCLUSION
In the present study, it was concluded that nine genotypes, viz. EC-520049, EC-520058, EC-520060, EC-520061, EC-520070, EC-520071, EC-520077 and EC-520079 and H-88-78-1 were found to be highly resistant to TLCV under both natural and artificial inoculation conditions. The cage inoculation technique of TLCV screening was more effective than mass and field infections. Moreover, the disease pressure was higher in the Rabi than the Kharif season. The single highly resistant line H-88-78-1 of S. lycopersicum could be used in further breeding programmes against TLCV resistance.
The four F2 individual Populations (1, 2, 3 and 4) were fitted on a 3:1 single major gene dominance ratio for TLCV disease and 1:2:1 for plant growth and fruit shape morphology. During the inheritance study the populations used showed both types of additive and dominant gene action for disease and associated yield traits. The selected progeny provide a source of germplasm to incorporate in breeding programmes for development of homozygous lines and gene pyramiding for resistance to TLCV.