INTRODUCTION
Sheep production is an important agricultural contributor to the Irish economy, with an export value of €230 million in 2015 (Bord Bia Reference Bord Bia2016). The current Irish national sheep flock comprises 2·5 million breeding ewes across 35 254 flocks (DAFM 2016) split across two main production systems: lowland (0·75) and hill (0·25) (Teagasc 2013). The national average flock size (107 ewes; DAFM 2016) remains small relative to international sheep standards, thereby requiring constant focus on increasing efficiency in order to ensure profitability.
Survey analysis has been described as a highly efficient method of accumulating large volumes of data at relatively low costs (Coleman Reference Coleman1958). Previous Irish sheep surveys have focused on labour use and efficiency (Connolly Reference Connolly2000; Morison et al. Reference Morison, Hine and Pretty2005) and sheep health issues (O'Neill et al. Reference O'Neill, O'Connor and O'Reilly2004; Morgan et al. Reference Morgan, Hosking, Burston, Carder, Hyslop, Pritchard, Whitmarsh and Coles2012). Additionally, international sheep surveys have tended to address specific management topics such as mortality (Johnston et al. Reference Johnston, MacLachlan and Murray1980), control of blow-fly (Bisdorff & Wall Reference Bisdorff and Wall2008) or anthelmintic resistance (Bartley et al. Reference Bartley, Jackson, Johnston, Coop, Mitchell, Sales and Jackson2003). The National Farm Survey (NFS) is an annual survey of approximately 1000 Irish farms co-ordinated by Teagasc and focuses on key financial and production characteristics across dairy, beef and sheep systems (Hennessy & Moran Reference Hennessy and Moran2016); however, these surveys tend to focus on financial variables rather than on management strategies.
Flock or herd size has been shown to affect the labour efficiency of farms across both sheep flocks (Connolly Reference Connolly2000) and dairy herds (O'Shea et al. Reference O'Shea, Kavanagh and Reid1988; O'Donovan et al. Reference O'Donovan, O'Brien, Ruane, Kinsella and Gleeson2008), with a lower labour requirement per animal required on larger flocks and herds. Previous international research on flock size has focused on individual flock management and behaviour variables such as animal grazing time (Penning et al. Reference Penning, Parsons, Newman, Orr and Harvey1993), social foraging (Michelena et al. Reference Michelena, Sibbald, Erhard and McLeod2009) and flight distance (Hutson Reference Hutson1982). To the authors’ knowledge, no study has evaluated the effect of flock size on the overall management and performance of the flock.
A multitude of sheep breeds are used across Irish sheep systems, ranging from maternal to terminal to hill breeds (McHugh & Diskin Reference McHugh, Diskin, Diskin and McHugh2010). The effect of ewe breed type on performance indicators such as lamb performance (Dawson & Carson Reference Dawson and Carson2002b ; Casas et al. Reference Casas, Freking and Leymaster2004; Fogarty et al. Reference Fogarty, Ingham, Gilmour, Cummins, Gaunt, Stafford, Hocking Edwards and Banks2005), lambing difficulty (Dwyer et al. Reference Dwyer, Lawrence, Brown and Simm1996; Dawson & Carson Reference Dawson and Carson2002a ; Speijers et al. Reference Speijers, Carson, Dawson, Irwin and Gordon2010), prolificacy rate (Hanrahan Reference Hanrahan1994, Reference Hanrahan2001; Dawson & Carson Reference Dawson and Carson2002a ) and health traits (Good et al. Reference Good, Hanrahan, Crowley and Mulcahy2006; Nieuwhof et al. Reference Nieuwhof, Conington, Bűnger, Haresign and Bishop2008) has been studied extensively. However, the association between ewe breed type management practices and flock performance has not been investigated to date.
The objective of the present paper was to assess the rate of production and current management practices on Irish sheep farms, and quantify their associations with flock size and ewe breed type. Results from the study will provide a database on current management practices and production levels on Irish sheep farms and provide a focus for future research on improving flock performance.
MATERIALS AND METHODS
Survey development
A total of 39 questions relating to the farm production system and farm management practices were devised across four main farm descriptors:
-
(1) Background: farm size, farm location, producer age, enterprises, stock numbers and sheep breeds;
-
(2) Production: animal inventory change, pregnancy scanning rate, barren rate, weaning rate, replacement rate and replacement strategy;
-
(3) Management practices: lamb finishing strategy, lambing date and spread, rate of concentrate supplementation, housing type, lambing supervision and flock health management;
-
(4) Future intentions and farm modernization: future intentions for sheep and other enterprises, current rates of technology adoption and farm modernization.
To determine the completeness of the survey questions and to identify any potential issues, the survey was piloted on a group of sheep producers and, based on feedback, appropriate changes were made to the survey where required. Responses to the survey questions varied from detailed information based on the producer's enterprise to tick the box style questions. To obtain robust information allowing little room for inappropriate interpretation, questions were close-ended where possible. The survey design and layout was created using an online survey package (Survey Monkey, available from www.surveymonkey.com).
Survey administration
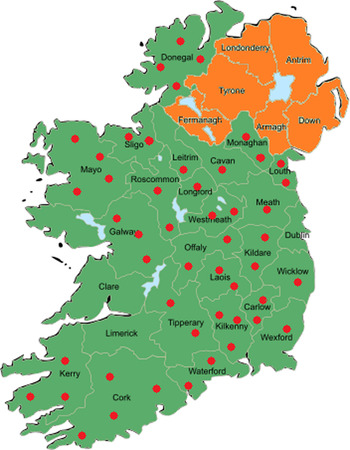
The sample population for the survey was chosen from a geographical representation of Irish sheep producers from across the Republic of Ireland (Fig. 1). Sheep producers were sourced through discussion groups formed as part of the Sheep Technology Adoption Programme (STAP), a programme designed to encourage the adoption of best management practices on sheep farms through discussion groups, farm walks and attending information events (DAFM 2015). A total of 2568 sheep producers (representing 0·07 of the total national sheep flocks) participated in STAP in 2014 (N. Cully, 2015, personal communication). It should be noted that all data were producer reported and not validated by independent sources such as pregnancy scanning reports and abattoir returns. In total, 45 discussion groups were selected, with the aim of surveying approximately 650 producers. The survey was administered to all 45 discussion groups between January and March 2014; the survey was distributed to the discussion group participants, who completed and returned the survey within the discussion group meeting. In order to maximize the number and quality of surveys collected, each discussion group meeting was attended by the lead author, and a detailed explanation of the survey and its objective was provided to each respondent; any questions that arose were explained on a one to one basis (to avoid adding bias) while they were completing the survey.
Red dots indicating the distribution of Sheep Technology Adaption Programme (STAP) discussion groups surveyed by county in the Republic of Ireland.

Statistical analysis
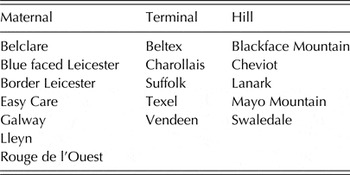
To quantify the association between flock size and flock performance, flocks were classified into four categories based on number of breeding ewes: very small (<62 ewes; n = 178), small (62–103 ewes; n = 178), medium (105–190 ewes; n = 182) or large (⩾190 ewes; n = 180). Each respondent listed the predominant ewe breed used in their flock and each ewe breed was classified based on one of the three breed type groups (Table 1). To quantify the association between ewe breed type and flock performance, each flock was categorized based on the predominant ewe breed type within each flock as: maternal (n = 107), terminal (n = 426) or hill (n = 133).
Classification of sheep breeds into maternal, terminal and hill breed types

Farm performance and management variables were tested as dependent variables and, depending on the variable under investigation, were classified as numerical, binary or nominal variables. Univariate analysis was undertaken to determine the effect of flock size and ewe breed on farm productivity variables using PROC GLM (numerical variables), PROC GENMOD (binary variables) and PROC CATMOD (nominal variables) (SAS Release 9.3). For binary and nominal variables odds ratio (OR) were calculated as the exponent of the model estimates.
RESULTS
Flock descriptive data
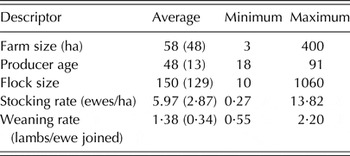
A 0·99 response rate (717 respondents) of the 724 sheep producers surveyed was achieved. A description of the surveyed sheep farms is presented in Table 2. The average flock size was 150 ewes (median = 110 ewes) with 0·16 of respondents having a flock size of ⩽50 ewes. The average flock size for lowland flocks (n = 567) was 142 ewes, 149 ewes for hill flocks (n = 72) and 188 ewes for flocks with both lowland and hill enterprises (n = 73). The average holding size was 58 ha (55 ha lowland farm and 79 ha hill farm). Of the surveyed participants 0·27 operated a sheep only enterprise, with a further 0·53 operating a mixed sheep and beef enterprise. The remainder consisted of a mix of sheep, dairy, tillage and equine enterprises.
Average (standard deviation (s.d.) in parentheses), minimum and maximum ranges for the detailed descriptors of farm and flock performance

Respondent age ranged from 19 to 92 years old, with the average respondent age of 48 years; most producers (0·60) were aged between 41 and 60 years of age. The average stocking rate for the lowland and hill farms was 6·55 and 3·14 ewes/ha, respectively. The average pregnancy scanning rate was 1·74 and 1·43 lambs per ewe joined for the lowland and hill farms, respectively. The average weaning rate was 1·44 and 1·02 lambs per ewe joined for the lowland and hill flocks, respectively.
The proportion of respondents that retained home-bred female replacements was 0·70, while 0·53 of respondents lambed replacement ewes at 2 years old, 0·45 of respondents lambed replacements at 1 year old and the remaining 0·02 were using a combination of both strategies. A total of 0·77 of the respondents were overwintering their breeding ewes indoors and a higher proportion of respondents (0·83) lambed ewes indoors.
The proportion of respondents that intended to maintain their current flock size was 0·65, whereas 0·27 planned to increase ewe numbers; only 0·02 of respondents planned to exit sheep farming. The main reasons stated for reducing or exiting was low profitability (0·51) or the lack of available labour (0·18).
Flock size
Flock performance variables that differed by flock size are shown in Table 3. Pregnancy scanning rate, weaning rate, replacement rate, age at first lambing and the proportions of lambs slaughtered off grass or concentrates did not differ by flock size. Larger flocks tended to have higher stocking rates and ewe to ram ratios (P < 0·05, Table 3), while smaller flocks had fewer lambs finished indoors or sold as stores (P < 0·01, Table 3). Flocks classified as small or very small had greater barren rates (4·28 and 5·35%), relative to medium and large flocks (3·88 and 3·86%, P < 0·001).
The effect of flock size (standard error (s.e.) in parentheses) on flock performance and farm output variables

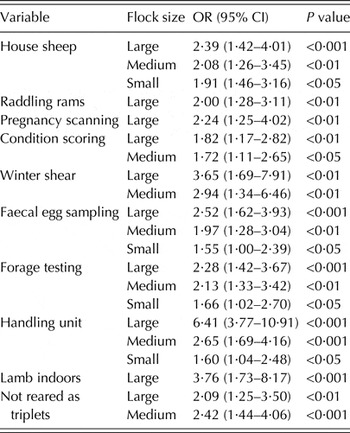
Of the producers surveyed, 0·59 stated that they body-condition scored ewes and 0·10 stated that they winter shear ewes at housing. Relative to very small flocks, medium and large flocks were 1·72 (95% confidence intervals (CI) 1·11–2·65; P < 0·05) and 1·82 (95% CI 1·17–2·82; P < 0·01) times more likely to body condition score ewes and were 2·94 (95% CI 1·34–6·46; P < 0·05) and 3·65 (95% CI 1·69–7·91; P < 0·01) times more likely to winter shear their ewes, respectively (Table 4). Large, medium and small flocks were 2·39 (95% CI 1·42–4·01; P < 0·001), 2·08 (95% CI 1·26–3·45; P < 0·01) and 1·91 (95% CI 1·46–3·16; P < 0·05) times more likely to house ewes, respectively, compared with very small flocks. Of the producers surveyed, 0·35 tested silage quality: large, medium and small flocks were 2·28 (95% CI 1·42–3·67; P < 0·001), 2·13 (95% CI 1·33–3·42; P < 0·01) and 1·66 (95% CI 1·02–2·70; P < 0·05) times more likely to test silage quality compared with very small flocks (Table 4).
Flock size odds ratio (OR) (95% confidence interval (CI) in parentheses) with management practices and technology adoption*

* Where the reference category was ‘very small flock sizes’.
Large flocks were 2·00 (95% CI 1·28–3·11; P < 0·01) times more likely to raddle rams at mating and 3·76 (95% CI 1·73–8·17; P < 0·001) times more likely to lamb ewes indoors compared with the very small flocks (Table 4). Smaller flocks tended to lamb earlier in the year (December to early February), with larger flocks opting for later mid-season lambing (late February to April) (P < 0·001). Large and medium flocks were 2·09 (95% CI 1·25–3·50; P < 0·01) and 2·42 (95% CI 1·44–4·06; P < 0·001) times more likely to cross-foster triplets compared with the very small sized flocks. Smaller flocks were more likely to never feed concentrates to ewes, whereas larger flocks were more likely to feed concentrates strategically pre-lambing (P < 0·001). Large flocks were more likely to feed concentrates to lambs post-weaning, whereas smaller flocks tended not to supplement lambs (P < 0·05). Larger flocks were more likely to drench lambs with trace minerals three times a year (P < 0·005) and footbath ewes every 8 weeks (P < 0·001) compared with smaller flocks, which were more likely to never drench lambs for minerals and never footbath ewes. Of the producers surveyed, 0·31 stated that they never footbath sheep, 0·28 footbath once a month and 0·24 footbath once every 3 months. For the prevention and treatment of lameness, smaller flocks were more likely to pare an infected hoof, whereas larger flocks were more likely to treat ewes through foot bathing and the use of antibiotics (P < 0·001). Smaller flocks tended to only treat lambs once for internal parasite infections, but larger flocks treated lambs multiple times depending on faecal egg count results (P < 0·01).
The rate of technology adoption differed by flock size, with larger flocks tending to adopt more technology. Of the producers surveyed, 0·54 owned a handling unit and 0·82 pregnancy scanned their ewes. Large flocks were 6·41 (95% CI 3·77–10·91; P < 0·001) times more likely to have sheep handling equipment, 2·52 (95% CI 1·62–3·93; P < 0·001) times more likely to faecal egg sample and 2·00 (95% CI 1·28–4·02; P < 0·01) times more likely to pregnancy scan ewes compared with the very small flocks (Table 4).
Ewe breed type
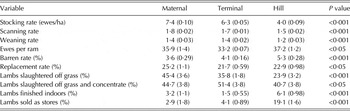
The main lowland ewe breeds used by survey respondents were Suffolk, Texel and Belclare ewes; for hill flocks the most commonly used breeds were Blackface Mountain and Cheviot. A number of management practices such as dagging of ewes and lambs, body-condition scoring ewes, faecal egg sampling, supplementation feeding and the producer's future farming intentions did not differ by ewe breed type. However, flocks with maternal ewe breeds had higher stocking rates (+1·11, +3·32 ewes/ha; P < 0·001), scanning rates (+0·10, +0·30 lambs/ewe joined; P < 0·001) and weaning rates (+0·01, +0·29 lambs/ewe joined; P < 0·001) compared with the terminal and hill ewe breeds (Table 5). The average replacement rate across all ewe breed types was 22·4%, and flocks with maternal ewes had the highest replacement rate (25%), but had the least barren ewes (3·64%; P < 0·05, Table 5). The ewe to ram ratio at breeding for the maternal (36 : 1) and hill (37 : 1) breed types was greater than terminal ewe type (33 : 1, P < 0·05). Maternal ewe breeds had a greater proportion of lambs drafted and slaughtered off a solely grass diet compared with the terminal and hill breeds, (P < 0·001; Table 5). Terminal and hill ewe breeds also had a longer lamb drafting season, with a greater percentage of lambs slaughtered after a period of indoor feeding with supplementation (P < 0·001) and more lambs sold as store lambs for further fattening (P < 0·001; Table 5).
The effect of ewe breed type (standard error (s.e.) in parentheses) on flock performance and farm output variables

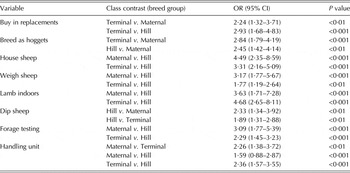
Flocks with terminal ewes were 2·24 (95% CI 1·32–3·71; P < 0·05) and 2·93 (95% CI 1·68–4·83; P < 0·001) times more likely to purchase replacements off-farm compared with maternal and hill ewes, respectively (Table 6). Relative to maternal ewe breeds, terminal and hill breeds were 2·84 (95% CI 1·79–4·19; P < 0·001) and 2·45 (95% CI 1·42–4·14; P < 0·05) times more likely to breed their replacements as hoggets (i.e. 2 years of age at first lambing), respectively (Table 6). Terminal and maternal ewe breeds were 3·31 (95% CI 2·16–5·09; P < 0·001) and 4·49 (95% CI 2·35–8·95; P < 0·001) times more likely to house ewes, relative to hill breeds. Likewise, flocks with terminal and maternal ewe breeds were 4·68 (95% CI 2·65–8·11; P < 0·001) and 3·63 (95% CI 1·71–7·28; P < 0·001) times more likely to lamb ewes indoors compared with flocks with hill breeds. Terminal ewe breeds were more likely to cross-foster lambs than to artificially rear lambs compared with both the maternal and hill breeds (P < 0·001). Dipping of ewes for the treatment of external parasites was common (proportion 0·55) among producers, with hill ewe flocks 2·33 (95% CI 1·34–3·92; P < 0·05) and 1·89 (95% CI 1·31–2·88; P < 0·05) times more likely to dip sheep compared with flocks with maternal ewe flocks and flocks with terminal ewes, respectively. Approximately 0·58 of farmers supplemented lambs with concentrates pre- and/or post-weaning regardless of lamb growth rates or grass supply. Flocks with terminal ewe breeds were more likely to supplement lambs compared with maternal and hill breeds (P < 0·001).
Breed group odds ratio (OR) (95% confidence interval (CI) in parentheses) with management practices and technology adoption

Flocks with terminal and maternal ewe breeds were 2·29 (95% CI 1·45–3·32; P < 0·001) and 3·09 (95% CI 1·77–5·39; P < 0·001) times more likely to test silage quality compared with flocks with hill breeds. Flocks with terminal and maternal ewes were more likely to have a sheep handling unit, in turn terminal ewe type flocks and maternal ewe type flocks were 2·36 (95% CI 1·57–3·55; P < 0·05) and 1·59 (95% CI 0·88–2·87; P < 0·001) times more likely to weigh sheep compared with flocks with hill ewes, respectively (Table 6). Compared with the flocks with hill ewe breeds, flocks with terminal ewe breeds were more likely to maintain ewe numbers rather than exit sheep farming in the future (P < 0·001).
DISCUSSION
Two of the key drivers of profitability identified for the Irish sheep industry are stocking rate and prolificacy (Diskin & McHugh Reference Diskin, McHugh, Diskin and McHugh2010), which are intrinsically linked to flock size and ewe breed type. Maternal breeds such as the Belclare have been shown to wean a greater number of lambs per ewe joined compared with non-maternal ewes (Keady et al. Reference Keady, Hanrahan and Flanagan2009). Earle et al. (Reference Earle, McHugh, Boland and Creighton2016) demonstrated that increased stocking rates and prolificacy, despite reducing individual animal performance, increased lamb carcass output/ha. Higher lamb carcass output/ha when associated with increased grass utilization reduces the cost of production per lamb, thereby increasing the profitability of the enterprise (Bohan et al. Reference Bohan, Shalloo, Creighton, Earle, Boland and McHugh2016).
The high response rate of 0·99 for the present study can be attributed to a multitude of factors including the piloting of the survey on a small group of sheep producers to ensure clarity in all questions, the use of close-ended questions and the author's attendance at each discussion group while the survey was completed.
The average stocking rate reported in the present study for lowland (6·55 ewes/ha) and hill (3·14 ewes/ha) flocks are within the range (5·4–7·4 ewes/ha) reported from Irish production systems in the 2015 NFS (Hennessy & Moran Reference Hennessy and Moran2016) and the 2015 Teagasc e-profit monitor (Teagasc Specialist Service 2016). Similarly, the average weaning rates reported in the present study for lowland (1·44 lambs per ewe joined) and hill flocks (1·02 lambs per ewe joined) are similar to those reported in the 2015 e-profit Monitor (1·43; Teagasc Specialist Service 2016) and the 2015 NFS (1·3; Teagasc 2016). The average number of lambs weaned/ha (9·4 lowland and 3·7 hill) are similar to that of the 2015 NFS (10 lambs/ha; Teagasc 2016), but below those reported internationally under similar grass-based production systems such as New Zealand (12·7) and the UK (18·3) (Connolly Reference Connolly1999).
Flock size
The Irish average flock size (107; DAFM 2016) is small compared with international flocks operated under similar production systems in England (209), Scotland (257) and Wales (317) (EBLEX 2012); the difference in flock size increases dramatically when compared with southern hemisphere countries such as Australia (1026) and New Zealand (1890; MLA 2013). There are a multitude of reasons for Ireland's small average flock size, but most notably are small farm size with 0·43 of holdings, across all enterprises, consisting of <20 ha and farm fragmentation, with the average number of land parcels per farm rising from 1·9 in 1991 to 3·5 in 2007 (Kearney Reference Kearney2010; CSO 2013). The current national average flock size of 107 ewes (DAFM 2016) is lower than the average reported in the present study (150 ewes) but in line with the median flock size in the present study (110 ewes).
The 2015 NFS stated that only 0·17 of farms had ⩾150 ewes, but were more productive than smaller flocks since they accounted for 0·19 of total lamb output (Teagasc 2016); this finding corroborates results from the present study, which show that larger flocks had greater stocking rates and ewe to ram ratios, and lower barren rates. Previous studies have highlighted that costs provide a barrier for technology adoption, especially for smaller farm sizes (Just et al. Reference Just, Zilberman, Rausser, Yaron and Tapiero1980; Feder Reference Feder1985), which may explain the greater rates of uptake associated with larger flocks in the present study compared with smaller flock sizes. Recent figures from the 2015 NFS (Hennessy & Moran Reference Hennessy and Moran2016) highlighted that smaller farms (10–20 ha) are more likely to have off-farm employment (0·43) compared with large farms (⩾100 ha, 0·14), suggesting that larger farms have more time to manage the flock; this may account for the increased performance of larger flocks in the present study. In addition, larger flocks in the present study were more likely to have additional infrastructure, such as housing and handling facilities, which could improve flock management by reducing labour requirement. In addition, a previous survey of Irish sheep flocks has shown that larger flocks had a lower labour requirement per ewe, which was linked to larger flocks having superior housing and handling facilities (Connolly Reference Connolly2000).
Ewe breed type
Maternal sheep breeds both nationally and internationally are usually derived due to their prolificacy potential, for example the Belclare breed, which represents the main maternal breed used within the present study, was developed based on major genes associated with increased ovulation rate (Hanrahan et al. Reference Hanrahan, Gregan, Mulsant, Mullen, Davis, Powell and Galloway2004). Similarly, international breeds such as the Lleyn, Merino, Coopworth and Bluefaced Leicester are marketed as maternal breeds mainly due to the increase in prolificacy potential (Davis Reference Davis2004, Reference Davis2005; Davis et al. Reference Davis, Balakrishnan, Ross, Wilson, Galloway, Lumsden, Hanrahan, Mullen, Mao, Wang, Zhao, Zeng, Robinson, Mavrogenis, Papachristoforou, Peter, Baumung, Cardyn, Boujenane, Cockett, Eythorsdottir, Arranz and Notter2006).
The Belclare breed, which accounted for 0·64 of the maternal breed types in the present study, has been shown to achieve higher litter sizes and more lambs reared per ewe joined compared with non-maternal ewes (Keady et al. Reference Keady, Hanrahan and Flanagan2009), which corroborates the present study's results with greater stocking, scanning and weaning rates associated with the maternal ewe type flocks relative to hill and terminal ewe type flocks. Flocks with maternal ewe breed types had the highest replacement rate (25%), but the lowest barren rate (3·64%), suggesting that higher mortality rates and culling for ill health were associated with maternal type ewes; this corroborates previous research, which also found that greater ewe mortality was associated with more prolific ewes (Hanrahan Reference Hanrahan and Diskin2007). The maternal ewe type flock also had a higher proportion of lambs finished off grass-only diets; this superior performance at grass may be due to the greater milk yield potential of the maternal-type ewes. Previous studies have shown that higher prolificacy stimulates increased mammary gland development, giving rise to increased milk yield (Anderson Reference Anderson1975; Swanson et al. Reference Swanson, Hammer, Luther, Carlson, Taylor, Redmer, Neville, Reed, Reynolds, Caton and Vonnahme2008), which is positively correlated with lamb performance (Snowder & Glimp Reference Snowder and Glimp1991). Flocks with hill-type ewes finished fewer lambs off grass, had lower weaning rates and higher barren rates; this may be attributed to the lower quality feed available to hill flocks relative to lowland flocks (Russel Reference Russel1971). In addition, the more extensive systems operated on Irish hill flocks were reflected in the lower rate of technology adoption such as silage testing, weighing sheep and having a sheep handling unit in the present study.
CONCLUSION
The present study provides an insight into the current management practices and rates of production on Irish lowland and hill farms. Flock size and ewe breed type were found to have a significant association with the management practices and in turn flock performance variables, with larger flocks and maternal ewes achieving higher performance. Results from the present study provide a bank of information on the current management practices and rate of production on Irish sheep farms as well as the demonstrating the effect of flock size and the effect of ewe breed type on flock management and performance.