Implications
Horse well-being and digestive health rely on a balance of the intestinal microbiota and imbalance can even cause disease (colic/laminitis). To evaluate this balance, faecal samples could be used, as they are easy to collect. However faecal microflora may be different from the digestive one. This study aimed to investigate if faecal samples were representative of the intestinal microflora, particularly in the case of changes and potential disturbances generated by high-cereal intake. Potential indicators of microfloral populations changes are highlighted, illustrating the prospects for using faecal samples to identify susceptible horses with higher risks to develop digestive disease.
Introduction
A well balanced hindgut microbiota is a key element for an efficient digestion, well-being and digestive health of the horse. This microbiota is highly susceptible and can easily be disturbed by environmental factor changes (diet, transport, etc.) that can cause negative outcomes such as colic appearance (Sadet-Bourgeteau and Julliand, Reference Sadet-Bourgeteau and Julliand2012). To evaluate hindgut microbiota balance or imbalance in experimental trials, digestive contents are typically collected in the caecum and the colon. The accessibility to such contents is not possible routinely from non-experimental animals, as there is no direct access to these gut regions, whereas faeces can easily be collected and could be used as suitable samples to generate biomarkers to evaluate the status of the hindgut microbiota. Several studies have compared the hindgut and the faeces in terms of microbial diversity and structure (Da Veiga et al., Reference Da Veiga, Chaucheyras-Durand and Julliand2005; Hastie et al., Reference Hastie, Mitchell and Murray2008; Dougal et al., Reference Dougal, Harris, Edwards, Pachebat, Blackmore, Worgan and Newbold2012 and Reference Dougal, de la Fuente, Harris, Girdwood, Pinloche and Newbold2013; Schoster et al., Reference Schoster, Arroyo, Staempfli and Weese2013; Sadet-Bourgeteau et al., Reference Sadet-Bourgeteau, Philippeau, Dequiedt and Julliand2014; Costa et al., Reference Costa, Silva, Ramos, Staempfli, Arroyo, Kim and Weese2015) and in terms of microbial activity (Da Veiga et al., Reference Da Veiga, Chaucheyras-Durand and Julliand2005; Dougal et al., Reference Dougal, Harris, Edwards, Pachebat, Blackmore, Worgan and Newbold2012). Overall, these studies concluded that the microbial communities found in the proximal region of the hindgut (caecum, right ventral (RV) colon and left ventral colon) clearly differed from those found in the distal region (left dorsal colon and right dorsal colon), with the change occurring at the pelvic flexure region of the gut. In addition, it has been reported that volatile fatty acid and lactate concentrations were lower in the faeces than in the hindgut. Therefore, faecal samples may be useful to evaluate the microbial composition of the hindgut distal area, but not the proximal region or hindgut activity. However, the proximal region and, particularly, the ventral colon are the main areas for microbial activity required for fibre digestion and energy generation from volatile fatty acid production in horses (Miyaji et al., Reference Miyaji, Ueda, Kobayashi, Hata and Kondo2008). It is therefore important to find a simple way to obtain information on the balance of those microbial ecosystems.
The comparison between the microbial variations observed simultaneously within the hindgut and the faeces in case of dietary stress has received little research attention. High-starch diets have been reported to be an important risk factor for negatively altering the microbiota (Julliand et al., Reference Julliand, De Fombelle and Varloud2006). When more than 200 g DM of starch/meal per 100 kg BW is fed, it is not entirely degraded in the small intestine by the digestive enzymes, and residual starch enters the hindgut where it can cause acidosis due to the increased population of the bacteria which produce acid as a by-product of starch fermentation (Julliand et al., Reference Julliand, De Fombelle and Varloud2006). Two studies were published which were specifically designed to measure the impact of a high-starch diet versus a fibre-rich feed on the bacterial profiles of the hindgut and the faeces (de Fombelle et al., Reference de Fombelle, Varloud, Goachet, Jacotot, Philippeau, Drogoul and Julliand2003; Julliand and Goachet, Reference Julliand, de Fombelle, Drogoul and Jacotot2005). de Fombelle et al. (Reference de Fombelle, Varloud, Goachet, Jacotot, Philippeau, Drogoul and Julliand2003) used anesthetized horses and reported no variations in the faecal bacterial concentration when the diet was changed, although the caecal and RV colonic bacteria concentrations altered. Conversely Julliand and Goachet (Reference Julliand, de Fombelle, Drogoul and Jacotot2005) used fistulated horses and showed that the faecal microbiota could be an appropriate indicator of bacterial changes in the RV colon. Neither of these two studies assessed the impact of dietary changes simultaneously on the hindgut and faecal microbial activity.
The aim of the present study was to evaluate the variations of the bacterial composition and microbial activity in the caecum, RV colon and faeces of horses undergoing a change from a high-fibre to a high-starch diet. Correlations between variations observed in the hindgut and faeces were performed in order to establish whether faecal parameters could be used as indicators of the hindgut microbial ecosystem.
Material and methods
This project was approved by the local ethical committee (Comité d’Ethique de l’Expérimentation Animale Grand Campus Dijon). The experimental study was conducted at the experimental stud of AgroSup Dijon, Créancey, France.
Animals and management
Six adult crossbred geldings (466±40 kg BW) fitted with cannulas in the caecum and the RV colon were stabled in individual boxes (14 m2) bedded with wood shavings (Tierwohl, Classic® bedding; Rettenmaier & Söhne, Rosenberg, Germany). Each day they were allowed 3 h free exercise in a sand arena. They were exercised six times a week for 1 h/day in an automatic walker at a speed of 4–6 km/h. All were vaccinated against tetanus and influenza (ProteqFlu-Te®, Merial, Lyon, France) and deworming (Hippomectin®, Audevard, Clichy, France) was performed before the start of the experiment.
Diets
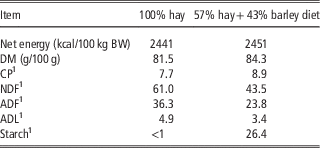
Horses were fed two different diets (Table 1) during the experimental trial. The first diet (H) was composed of 100% meadow hay given at an intake level of 2.2 DM kg/day per 100 kg BW. The second diet (B) was composed of 57% meadow hay and 43% rolled barley fed at an intake level of 1.4 DM kg/day per 100 kg BW (comprising 0.8 DM kg/day per 100 kg BW hay). The two diets were formulated to be iso-energetic and to meet 100% of the energy requirements of a very light exercising horse according to the French recommendations (INRA, 1990). Hay and barley were distributed in two daily meals (0800 and 1700 h). Hay was offered in equal proportion whereas barley was given as 2/3 in the morning and 1/3 in the evening, providing 251 and 126 g DM of starch/meal per 100 kg BW, respectively. Feeding higher quantity of barley in the morning was expected to increase the likelihood that a significant amount of starch reached the hindgut and provoked microbial ecosystem modification, while the total ration respected the horse digestive health. Horses had ad libitum access to water and a mineral salt block containing sodium chloride (Na 39%) (SOLSEL®; European Salt Company, Hannover, Germany).
Chemical and nutritional composition of the diets

1 Percentage of the dry matter.
Experimental design and sampling procedure
The six horses were used in a longitudinal study over 7 weeks. In the first period of 3 weeks, horses were fed the hay diet. After this period, barley was progressively incorporated in the ration over a 5-day adaptation period. Following adaptation, horses received the hay/barley diet for 3 weeks. All hindgut and faecal samples were collected 4 h after the morning meal on the 10th and 20th days of each period. Digesta from the caecum and colon were obtained through the cannulas by gravity, and faecal samples by rectal grab method. Aliquots of each sample was added in a covered flask filled to the maximum capacity to avoid the presence of oxygen, and bacterial analyses was performed immediately after sampling. Another aliquot was filtered through a 100 µm diameter mesh and immediately frozen (−20°C) after being sub-sampled for lactate (1 ml) and volatile fatty acids (VFA, 1 ml added to 0.1 ml of a preservative solution composed of 4.25% H3PO4 and 1.0% HgCl2) analyses. For the faecal samples, a non-filtered aliquot (1 g) was frozen for further lipopolysaccharide (LPS) analyses.
Bacterial count
Total anaerobic bacteria and bacterial functional groups (cellulolytic, amylolytic and lactate-utilizing bacteria) were enumerated from caecal, RV colonic and faecal samples using conventional anaerobic culture techniques as described by (Faubladier et al., Reference Faubladier, Chaucheyras-Durand, da Veiga and Julliand2013). Before inoculation, all samples were serially diluted in a mineral solution under strict anaerobic conditions maintained under a continuous flow of CO2. Total anaerobic bacteria (dilutions 10−5 to 10−7) were grown on a non-selective medium, and lactate utilizing bacteria (dilutions 10−3 to 10−6) on a selective medium containing lactate. Both were cultured anaerobically in roll-tubes and colonies were counted after 48 h at 38°C. Cellulolytic bacteria (dilutions 10−4 to 10−7) were cultured anaerobically in a liquid medium containing one filter paper strip as cellulose source. The concentration of cellulolytics was determined after 14 days incubation at 38°C using the method of most probable number (McGrady’s tables, Clarke and Owens (Reference Clarke and Owens1983)). Amylolytic bacteria (dilutions 10−2 to 10−5) were cultured for 48 h at 38°C on Petri dishes containing a 1% (w/v) soluble starch medium, and were enumerated after the growth of colonies with a lugol’s iodine solution. Finally, all the bacteria concentrations were logarithmically (log10) transformed for numerical comparison.
Biochemical analyses
The relative acidity of each unfiltered caecal and colonic sample and each filtered faecal sample was recorded with an electronic pH meter (CyberScan pH 510; Eutech Instrument Europe B.V., Landsmeer, The Netherlands) immediately after sampling. Total VFA, acetate (C2), propionate (C3), butyrate (C4), valerate (C5) concentrations were assayed by gas-liquid chromatography (Clarus 500; PerkinElmer, Courtaboeuf, France) (Jouany, Reference Jouany1982). Each VFA concentration was expressed as a proportion of total VFA and the ratio [(C2+C4)/C3] was calculated according to Sauvant et al. (Reference Sauvant, Chapoutot and Archimède1994). d-Lactate and l-lactate concentrations were measured spectrophotometrically at 340 nm (MRX revelation; Dynatech Laboratories, Guyancourt, France) using an enzymatic colorimetric method (Megazyme, d-/l-lactic acid (d-/l-lactate) (Rapid) Assay Kit; Megazyme International Ireland Ltd, Wicklow, Ireland) which had been slightly modified in our laboratory. Due to their complex matrix, all the liquid samples were pre-treated by centrifugation at 6000×g for 10 min to separate solid material out, and perchloric acid (1 M, 100% v/v) was added to deproteinize them. Samples were then further centrifuged at 1500 g for 10 min at room temperature. Microplates was agitated on a plate shaker at 900 rpm during 25 min before reading of the first absorbance (A1), during 30 min before reading of the second one (A2), and during 35 min before reading of the third one (A3).
Faecal bacterial LPS concentration was determined by direct quantification of the 3-hydroxymyristic acid (3HM) by HPLC coupled with tandem mass spectrometry (HPLC-MS/MS) following a method adapted from Pais de Barros et al. (Reference Pais de Barros, Gautier, Sali, Adrie, Choubley, Charron, Lalande, Le Guern, Deckert and Monchi2015) (Grimm et al., submitted). The 3HM is the most common hydroxylated fatty acid of the lipid A fraction of LPS, and serves as a marker of LPS.
Statistical methods
Data were statistically analysed using the GLM procedure SAS version 9.3 (SAS Institute Inc., Cary, NC, USA) to evaluate the effect of sampling day (H10, H20, B10, B20). In case of a significant sampling day effect, orthogonal contrasts were performed to test the evolution within each diet (H10 v. H20; B10 v. B20) and the difference between the two diets (H v. B). The CORR procedure of SAS was used to assess the correlation (Pearson’s correlation coefficient) between the caecal/colonic and faecal parameters in a two by two comparison. The significance threshold was set at P<0.05, and at P<0.1 for trends.
Principal component analyses (PCA) was used to generate an overall view of the relationship between all caecal and faecal parameters, and between all colonic and faecal parameters. The analyses were conducted with R software (3.2.2) using the FactoMineR library (Lê et al., Reference Lê, Josse and Husson2008).
Results
Variations of caecal, colonic and faecal bacterial counts
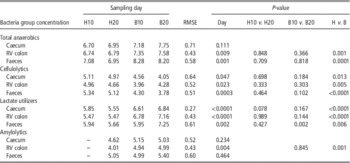
Amylolytic bacteria concentrations could not be enumerated for the first sample taken when the hay diet was fed (H10; Table 2). Thus H10 v. H20 contrast was not estimated. Except for the total anaerobic bacteria concentrations in the caecum (P=0.11) and amylolytic bacteria concentrations in the caecum (P=0.23) and faeces (P=0.46), a significant sampling day effect as well as a significant H v. B contrast were observed for all other bacteria concentrations, whatever the digestive segment. Total anaerobic, lactate-utilizing and amylolytic bacteria concentrations significantly increased and cellulolytic bacteria concentrations significantly decreased when the diet changed from hay to hay+barley. All bacteria concentrations were stable during the H diet (P>0.05 for H10 v. H20 contrast). Apart from faecal lactate-utilizing bacteria concentrations (P=0.02), bacterial concentrations remained stable during the B diet (P>0.05 for B10 v. B20 contrast).
Bacterial group concentration (log10 cfu/g) in caecum, right ventral colon and faeces of horses according to the sampling day (10 or 20) within the diet H (100% hay) and B (57% hay+43% barley)

Orthogonal contrasts were performed only if a sampling day effect was observed.
Variations of caecal, colonic and faecal biochemical parameters
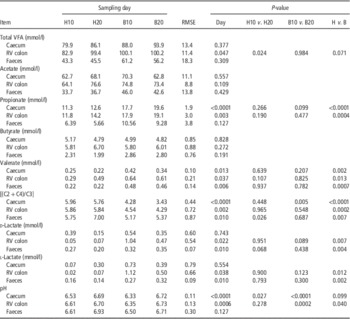
A significant sampling day effect was found for total VFA concentrations in the RV colon, propionate concentrations in the caecum and RV colon and valerate concentrations and [(C2+C4)/C3] ratio in the caecum, RV colon and faeces (Table 3). These parameters showed significant evolution when B diet was fed (significant H v. B contrast), except for the RV colonic total VFA concentrations which tended to increase (P=0.07). The propionate and valerate concentrations were higher and the ratio of VFA lower when B diet was fed than compared with horses fed the H diet. Significant variations were observed within the H diet on RV colonic total concentrations (increasing at H20 sampling) and for the ratio of VFA in faeces (higher in H20 than in H10). When the B diet was given the caecal ratio of VFA was lower in B20 than in B10.
Biochemical parameters in caecum, right ventral (RV) colon and faeces of horses according to the sampling day (10 or 20) within the diet H (100% hay) and B (57% hay+43% barley)

VFA=volatile fatty acids.
Orthogonal contrasts were performed only if a sampling day effect was observed.
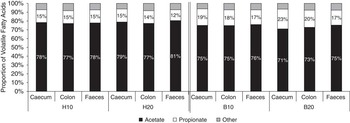
Acetate proportion significantly increased whereas propionate proportion significantly decreased when the diet changed from H to B (Figure 1), whatever the digestive segment (caecum: P<0.0001; colon: P=0.003; faeces: P=0.002). When diet B was fed, a significant intra-diet contrast was observed on caecal acetate (P=0.0002) and propionate (P=0.0002) proportions, whereby in B20, the proportion of acetate was lower and the proportion of propionate higher compared with B10.
Proportions of volatile fatty acids in the equine caecum, right ventral colon and faeces according to the sampling day (10 or 20) within the diet H (100% hay) and B (57% hay+43% barley).

d-Lactate and l-lactate varied significantly between sampling days in the RV colon and faeces, but not in the caecum (Table 3). In these two compartments, the two isomers increased significantly with the B diet. No intra-diet variations were observed. The total lactate, calculated by addition of the two isomers, presented exactly the same variation than the individual isomers.
A significant sampling day effect was found on the caecal and colonic pH, but only colonic pH was significantly different between the two diets. The caecal pH increased significantly for the H diet, and both the caecal and colonic pH were significantly lower at B10 compared with B20.
Variations of faecal lipopolysaccharides
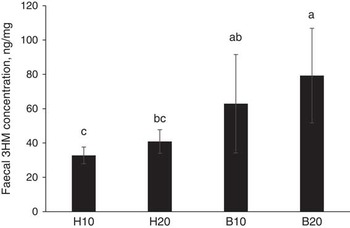
Faecal 3HM concentrations (Figure 2) varied significantly with sampling day (P=0.004) and increased significantly when horses received the B diet compared with H diet (H v. B: P=0.0008). No significant intra-diet variations were observed.
Concentrations of equine faecal 3 hydoxymyristique acid (3HM) according to the sampling day (10 or 20) within the diet H (100% hay) and B (57% hay+43% barley). The 3HM concentration is representative of the lipopolysaccharide concentrations.

Correlations between the caecal/colonic and faecal parameters
The cellulolytic, amylolytic and lactate-utilizing bacteria concentrations were significantly correlated between the caecal and faecal samples and between RV colon and faecal samples, whereas the total anaerobic bacteria concentrations showed a trend in this regard (Table 4). For the biochemical parameters, no significant correlation was observed between faecal and colonic parameters. Caecal valerate and the relative percentage of propionate were significantly correlated with the same parameters in the faeces. Caecal and faecal d- and l-lactate tended to be correlated (P<0.1).
Correlations between the same parameters in the caecum/right ventral (RV) colon and in the faeces

VFA=volatile fatty acids; r=Pearson’s correlation coefficient; P=associated P-value.
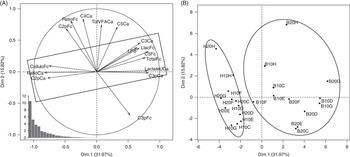
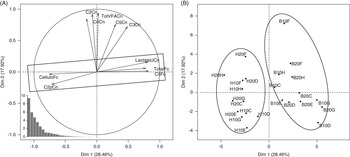
The first three principal components (PC) of the PCA explained 59.2% of the total variance for caecal and faecal microbial parameters (Figure 3), and 60.6% of the total variance for colonic and faecal parameters (Figure 4). Results were plotted onto the first and second PC, and only variables well represented on each axis (cos2>0.55) were displayed to obtain the best graphical representation. Samples from horses fed the B diet formed a cluster which was distinct from samples of horses fed the H diet (Figures 3b and 4b). The two groups were mainly opposed on the PC1 axis. In the PCA between caecal and faecal parameters (Figure 3), the H diet group was characterized by high-faecal cellulolytic bacteria concentration, caecal percentage of C2, and caecal VFA ratio, and low caecal lactate-utilizing bacteria concentration, faecal total bacteria concentration, caecal C3 proportion and concentration, faecal C5 concentrations, faecal l-lactate concentration and faecal LPS concentration. The B diet group presented inverse characteristics for these variables. This data had the highest contribution to the PC1 and Pearson’s correlations confirmed that they were all significantly correlated with each other (P<0.027; r>|0.45|).
Principal components analysis based on equine caecal and faecal parameters. (a) Caecal and faecal variables graph. Only variables well represented on the axis (cos2>0.55) were displayed. Variables were identified by an abbreviation (Cellulo=cellulolytic bacteria; Total=total anaerobic bacteria; LactateU=lactate-utilizing bacteria;, TotVFA=total volatile fatty acids; C2p=proportion of acetate; C3=propionate; C3p=proportion of propionate; C4=butyrate; C5=valerate; Ratio=[(C2+C4)/C3]; Llac=l-lactate; LPS=lipopolysaccharide) and by the digestive segment (Ca=caecum; Fc=faeces). The eigenvalues are graphically represented at bottom left. (b) Individuals graph. Individuals were identified by the diet (H=hay diet; B=hay+barley diet), by the day of sampling (10 or 20) and by the horse (C, D, E, F, G, H).

Principal components analysis based on equine right ventral colonic and faecal parameters. (a) Cecal and faecal variables graph. Only variables well represented on the axis (cos2>0.55) were displayed. Variables were identified by an abbreviation (Cellulo=cellulolytic bacteria; Total=total anaerobic bacteria; LactateU=lactate-utilizing bacteria; TotVFA=total volatile fatty acids; C2=acetate; C2p=proportion of acetate; C3=propionate; C4=butyrate; C5=valerate) and by the digestive segment (Cn=right ventral colon; Fc=faeces). The eigenvalues are graphically represented at bottom left. (b) Individuals graph. Individuals were identified by the diet (H=hay diet, B=hay+barley diet), by the day of sampling (10 or 20) and by the horse (C, D, E, F, G, H).

In the PCA for colonic and faecal parameters (Figure 4), the H diet group was characterized by high cellulolytic concentrations in the faeces and increased proportion of C2 in the colon, with low concentrations of lactate utilizers in the colon, a reduced concentration of total anaerobes in faeces and lower concentration of valerate in faeces. The B diet group presented inverse characteristics for these variables. This data had the highest contribution to the PC1 and Pearson’s correlations confirmed that they were all significantly correlated with each other (P<0.013; r>|0.50|).
Discussion
The study was specifically designed to compare variations in the microbial ecosystem in faeces to those observed in the proximal hindgut under a dietary change, and hence determine if faecal samples were representative of gut microbial ecosystem. Most studies that have measured the impact of the diet on the faecal microbial ecosystem (Hussein et al., Reference Hussein, Vogedes, Fernandez and Frankeny2004; Willing et al., Reference Willing, Vörös, Roos, Jones, Jansson and Lindberg2009; van den Berg et al., Reference van den Berg, Hoskin, Rogers and Grinberg2013; Murray et al., Reference Murray, Longland, Moore-Colyer and Dunnett2014) did not analyse such parameters in the hindgut, prohibiting any extrapolation.
According to current published data, only two previous papers focussed on the alteration both in the proximal hindgut and faecal bacteria due to dietary fibre and starch changes, but none measured microbial activity (de Fombelle et al., Reference de Fombelle, Varloud, Goachet, Jacotot, Philippeau, Drogoul and Julliand2003; Julliand and Goachet, Reference Julliand, de Fombelle, Drogoul and Jacotot2005).
This study examined two very different diets: high-fibre hay and high-starch hay/barley mix. The hay/barley (B) diet was formulated to provide more than the maximum recommendation of 200 g/100 kg BW of starch in the morning meal (Julliand et al., Reference Julliand, De Fombelle and Varloud2006) and less than the minimal recommendation of 1 kg DM/100 kg BW of hay per day (NRC, 2007). As expected the data showed modifications in the hindgut ecosystem in agreement with those observed by other studies testing concentrate diets (Julliand et al., Reference Julliand and Goachet2001, Medina et al., Reference Medina, Girard, Jacotot and Julliand2002; de Fombelle et al., Reference de Fombelle, Varloud, Goachet, Jacotot, Philippeau, Drogoul and Julliand2003) whereby caecal and RV colonic functional bacteria group concentrations (cellulolytics, lactate utilizers) varied, and caecal and colonic microbial activity moved towards an amylolytic activity profile (increase in propionate proportions, valerate and d/l-lactate concentrations and decrease in acetate proportion and VFA ratio [(C2+C4)/C3]). The impact of the change of diet was marked, despite a high inter-horse variability as seen in the large mean standard errors that was found mainly in lactate concentrations in the caecum and colon. This confirmed the individual susceptibility, seen in horses fed high-starch diets as previously reported by several authors studying the equine hindgut microbial ecosystem (Julliand et al., Reference Julliand and Goachet2001; Medina et al., Reference Medina, Girard, Jacotot and Julliand2002; Dougal et al., Reference Dougal, Harris, Edwards, Pachebat, Blackmore, Worgan and Newbold2012 and Reference Dougal, de la Fuente, Harris, Girdwood, Pinloche and Newbold2013; Schoster et al., Reference Schoster, Arroyo, Staempfli and Weese2013; Sadet-Bourgeteau et al., Reference Sadet-Bourgeteau, Philippeau, Dequiedt and Julliand2014; Costa et al., Reference Costa, Silva, Ramos, Staempfli, Arroyo, Kim and Weese2015), and confirmed that some horses are more likely to develop digestive dysbiosis and potential intestinal diseases, such as colic. Using PCA the data showed that the two microbial ecosystems of horses clearly differed with the diet, and thus established that the hindgut microbiota was altered with the B diet.
The caecum and colon microbial ecosystem remained relatively constant within each diet, as the majority of the parameters that were investigated did not show significant intra-diet contrasts. This emphasized that the hindgut microbiota was stable with a hay diet, which was in accordance with studies observing temporal stability of the faecal microbiota (Sadet-Bourgeteau et al., Reference Sadet-Bourgeteau, Philippeau, Goachet, Faubladier, Villot and Julliand2011; Blackmore et al., Reference Blackmore, Dugdale, Argo, Curtis, Pinloche, Harris, Worgan, Girdwood, Dougal and Newbold2013). Interestingly, this study highlighted the habituation of the hindgut microbiota to the B diet within 10 days after the adaptation period, as no major variations between samples at 10 and 20 days were observed. It can be concluded that the stability of the hindgut microbial ecosystem was established 10 days after transition from hay to hay/barley, or even earlier, although further research is required to confirm when such stabilization occurred.
When the diet changed from hay to the hay/barley mix, cellulolytic, amylolytic and lactate-utilizing bacteria concentrations were significantly and positively correlated between the caecal/RV colon and faecal samples. While cellulolytic and lactate-utilizing bacteria concentrations varied significantly in the same way in the faeces and caecum or RV colon, amylolytic bacteria concentrations did not increase in the faeces when the B diet was fed, as reported in the literature (Willing et al., Reference Willing, Vörös, Roos, Jones, Jansson and Lindberg2009; van den Berg et al., Reference van den Berg, Hoskin, Rogers and Grinberg2013). As we had no data for amylolytic bacteria in the first sampling, the statistical analyses were less powerful.
The results from this trial were different from those of de Fombelle et al. (Reference de Fombelle, Varloud, Goachet, Jacotot, Philippeau, Drogoul and Julliand2003), who found that diet had an influence on functional bacteria concentrations in the caecum and colon but not in the faeces. One main reason for this could be that they worked on two groups of anesthetized horses, each fed a different diet, whereas the current study used on fistulated horses that were fed the two diets successively, limiting individual animal effects, as each horse was effectively its own control. Conversely, our results were partly comparable with those of Julliand and Goachet (Reference Julliand, de Fombelle, Drogoul and Jacotot2005), who reported that RV colonic and faecal concentrations of bacteria varied in a similar way when fistulated horses were transitioned from 100% hay to 70% hay plus 30% concentrate. However Julliand and Goachet (Reference Julliand, de Fombelle, Drogoul and Jacotot2005) found no differences in caecal samples, and cellulolytic bacteria count remained unchanged whatever the segment, which may be explained by a lower ratio of concentrate used (30% in the study of Julliand and Goachet (Reference Julliand, de Fombelle, Drogoul and Jacotot2005) v. 43% in our study). Despite difference in the results, it appears that the addition of concentrate in the diet had an impact on hindgut bacterial composition that could reflect those seen in faecal samples. However, the parameters relative to the activity of the microbiota showed few correlations between hindgut (caecum or RV colon) and faeces, where only the proportion of C3 and C5 concentration in caecum and faeces were significantly correlated. VFA and lactate are absorbed through the caecal and colonic mucosa by a concentration-dependent passive diffusion process or via a monocarboxylate/H+ symporter (Argenzio et al., 1977; Shirazi-Beechey, 2008). Due to this absorption, VFA concentrations differ along the hindgut, and so faecal levels cannot be correlated per se. However, their variations as a function of the diet make more sense. It has been reported that the colonic monocarboxylate/H+ symporter transport of VFA is inhibited by the monocarboxylate lactate (Shirazi-Beechey, 2008). Thus it can be assumed that the absorption of VFA would be lower when horses were fed the hay/barley diet. Indeed, even if non-significant, a numerically increase of VFA concentrations in the faeces was seen for the hay/barley diet. Interestingly, the proportions of VFA in the faeces, contrary to concentrations, showed more correlations with the proportions in the hindgut, and thus could be appropriate indicators of the fermentation profile in the proximal hindgut. More investigations on the absorption of fermentation products using different diets are necessary to investigate the possibility to use them as biomarkers.
Using PCA the links between all the parameters in terms of bacterial composition or microbial activity were investigated, with the objective of finding faecal biomarkers of the hindgut microbial ecosystem. In the faeces, it appeared that total anaerobic and cellulolytic bacteria concentrations as well as valerate concentrations could indicate variations of caecal and RV colonic microbial parameters and faecal LPS and l-lactate concentrations could be linked to variations in caecal parameters. These faecal parameters could be of particular usefulness for the diagnosis of microbial imbalances in the caecum and RV colon (the proximal hindgut). Previous studies have shown that faeces could be representative of the distal hindgut microbial composition, but not of the proximal hindgut (Da Veiga et al., Reference Da Veiga, Chaucheyras-Durand and Julliand2005; Hastie et al., Reference Hastie, Mitchell and Murray2008; Dougal et al., Reference Dougal, Harris, Edwards, Pachebat, Blackmore, Worgan and Newbold2012 and Reference Dougal, de la Fuente, Harris, Girdwood, Pinloche and Newbold2013; Schoster et al., Reference Schoster, Arroyo, Staempfli and Weese2013; Sadet-Bourgeteau et al., Reference Sadet-Bourgeteau, Philippeau, Dequiedt and Julliand2014; Costa et al., Reference Costa, Silva, Ramos, Staempfli, Arroyo, Kim and Weese2015). In this study the data demonstrated that variations in the proximal hindgut microbial ecosystem could have repercussions on the faecal one.
Due to its negligible concentration, valerate has received little attention in previous equine nutrition studies. However, the current data demonstrated that its concentration in the faeces varied significantly with diet, being correlated with valerate concentrations and even with other microbial parameters in the large intestine. In ruminant studies, valerate appeared to be the only ruminal variable significantly affected by the levels of grain fed (Lean et al., Reference Lean, Golder, Black, King and Rabiee2013), and a critical indicator of acidosis (Bramley et al., Reference Bramley, Lean, Fulkerson, Stevenson, Rabiee and Costa2008). Valerate is produced from lactate by lactate-utilizing bacteria when lactate accumulation occurs, and principally by Megasphaera elsdenii (Stewart et al., Reference Stewart, Flint and Bryant1997). In the current study, valerate concentration in the faeces was indeed positively correlated with the lactate-utilizing bacteria count in both the caecum and colon. This parameter could be useful to follow during microbial disorders when horses are fed a high-starch diet, and particularly with the increasing levels of lactate-utilizing bacteria.
Another parameter that was studied was faecal bacterial LPS concentration, which has received little attention in horses. In this study the faecal LPS concentrations significantly increased when the hay/barley was fed. This could reflect an increase of gram negative bacteria as LPS is a constituent of their external membrane. Previous results had reported similarly that high-starch diet could be responsible for overgrowth of gram negative bacteria in the caecum (Moreau et al., Reference Moreau, Eades, Reinemeyer, Fugaro and Onishi2014). Those authors found a particularly high increase of the relative abundance of Veillonella sp. which is a lactate-utilizing bacteria genus (Biddle et al., Reference Biddle, Black and Blanchard2013). In the current study faecal LPS concentration was positively correlated with the lactate-utilizing bacteria count in the proximal hindgut. Thus LPS concentration variations could reflected the alteration in the hindgut bacteria composition occurring under the dietary change, and potentially the higher lactate-utilizing bacteria count.
The current study demonstrated that some parameters found in the faecal microbial ecosystem could represent the proximal hindgut microbial ecosystem in terms of variations during a change from a high-fibre to a high-starch diet. The faecal parameters relative to the microbial activity, such as VFA (and mainly C5) or LPS appeared particularly suitable for evaluating such fluctuations in the hindgut microbial ecosystem. Faecal total anaerobes and cellulolytics, amylolytics and lactate utilizers seem to be also appropriate to reflect variations of the hindgut populations. Further investigations are necessary to study the impact of the diet on these parameters and determine if they could be used as biomarkers. Future research may be directed at identifying taxonomic families, genera or species of bacteria belonging to each functional group and that would be suitable candidates to be used in the field.
Acknowledgements
The authors acknowledged Alltech for their financial support and their revisions of this manuscript, and Jules Taylor-Pickard and Helen Warren for their support throughout this study. They thank the staff of the AgroSup Dijon’s experimental facilities (Bernard Château and Claire Sivry) and laboratory (Francine Delamarche, Emmanuel Jacotot and Marie-Claire De Vos Franzin) who contributed actively to this trial. The authors also acknowledged Jean-Paul Pais de Barros (Lipidomic platform Dijon, INSERM UMR 866) for analyses of lipopolysaccharides. They are grateful to Alain Breuvart and Christine Fant from Agrosup Dijon for their help with the statistical analyses. Finally, the Agrosup Dijon students (Cléo Omphalius, Manon Schouller and Clothilde Villot) are thanked for their involvement in the project.