Introduction
This article stems from work on the Poverty and Social Exclusion UK (PSE-UK) Survey of 2012. One of the main aims of the survey is to update the UK's consensual measure of relative poverty originally developed by Mack and Lansley (Reference Mack and Lansley1985). The consensual measure uses an attitudinal survey to identify the items or activities which a majority of the public believes constitute the ‘necessities of life’. These necessities then form the standard for judging whether households or individuals are in poverty: people are regarded as being poor where they lack a specified number of necessities and this lack is due to a lack of resources (notably income). The first aim of this article, therefore, is to examine whether majority views in Scotland on the necessities differ from those in the rest of the UK (RoUK), i.e. whether it is reasonable to have a single poverty standard of this kind for the whole of the UK, or whether a separate standard might be needed for Scotland.
The analysis also has a wider relevance, linked to on-going debates about Scotland's constitutional future. A referendum on Scottish independence will be held on 18 September 2014. Even in the event of a ‘no’ vote, the current constitutional settlement may well change, and Scotland could gain increasing control over fiscal and welfare policy. One central question in the independence debates has been the extent to which a more autonomous Scotland would choose a significantly different social settlement – for example, one which placed a higher emphasis on reducing economic inequality and hence a more generous definition of the social minimum, reflected in a higher minimum wage or higher levels of welfare benefit payments (Scottish Government, 2013; Niedzwiedz and Kandlik-Eltanani, Reference Niedzwiedz and Kandlik-Eltanani2014).
The Scottish National Party certainly appear to believe that cuts in welfare expenditure by the UK government present a political opportunity. Their leader, Alex Salmond, used a major speech in January 2013 to outline how the referendum would be a chance to vote for a future where a different welfare system was possible, one ‘which makes work pay without reducing people to penury and despair’ (Salmond, Reference Salmond2013; see also Dempsie, Reference Dempsie2013). The second aim of this article is therefore to examine whether attitudes to necessities reveal more subtle differences between Scotland and the rest of the UK, which might suggest that greater autonomy for Scotland would lead to policy divergence. Here the focus is not simply on the number of items attracting majority support, but on the degree of support for each item: do Scots tend to be more ‘generous’ in their views about whether items should be considered necessities or not? Are there particular items or activities which attract more or less support in Scotland? In both cases, however, our focus is on the contrast between Scotland and the RoUK taken as a whole. There is obviously the potential for great variation within the latter category, but that is not the focus on this article.
Finally, we seek to identify some of the factors which may explain any differences in attitudes. One possibility is that differences between Scotland and the RoUK arise simply because of differences in population mix, a compositional effect. For example, if older people are more likely to see a given item as a necessity, a region with more older people will tend to have higher aggregate support for that item. The alternative possibility is that people with similar characteristics (age, gender or class, for example) have different views in different places, a contextual effect. One source of contextual effects would be cultural difference, arising from historical development, but others might be the influence of physical environment (for example, climate) or social geography (for example, urban–rural settlement patterns). Recent analyses of falling rates of child poverty in Scotland relative to the RoUK have suggested that compositional differences have been a factor alongside stronger economic growth (Barham, Reference Barham2010; Aldridge and Kenway, Reference Aldridge and Kenway2014). The third aim is therefore to identify the relative contribution of composition and context in explaining any differences in attitudes between Scotland and the RoUK.
Background
Poverty, deprivation and the ‘necessities of life’
Following Townsend's (Reference Townsend1979) definition of relative poverty and early attempts at measurement, Mack and Lansley (Reference Mack and Lansley1985) developed the consensual approach, using public opinion to determine minimum standards. This was further refined in studies by Gordon and Pantazis (Reference Gordon and Pantazis1997), Gordon et al. (Reference Gordon, Adelman, Ashworth, Bradshaw, Levitas, Middleton, Pantazis, Patsios, Payne, Townsend and Williams2000) and Hillyard et al. (Reference Hillyard, Kelly, McLaughlin, Patsios and Tomlinson2003), and it is this body of work that the PSE-UK survey builds on. The consensual approach identifies whether individuals are poor by assessing their living standards against a socially defined set of ‘necessities’. Where individuals lack a predefined number of necessities due to a lack of resources, people are said to be in poverty. This provides a direct measure of poverty based on (self-reported) achieved living standards, overcoming many of the limitations that affect indirect measures based on income or resources alone (Ringen, Reference Ringen1988; Gordon, Reference Gordon, Pantazis, Gordon and Levitas2006). The approach has been extremely influential in the UK and internationally. Versions of the deprivation measure have been incorporated into the UK's statutory child poverty target in the Child Poverty Act 2010, into one of the EU's five headline targets in the EU 2020 strategy (European Commission, 2010) and into UN-recommended poverty measures (Rio Group, 2006).
The measure is regarded as ‘consensual’ in two senses. First, the set of necessities items is determined by public opinion. In an initial attitudinal survey, people are asked to identify items from a long list which they regarded as ‘necessities of life’, things which everyone should be able to afford and which they should not have to do without. Items are regarded as necessities only where they attract majority support. In the PSE-UK survey, the process of determining the initial long list of potential necessities began with a review of past studies and expert consultations combined with fourteen focus groups with a cross-section of the public (Fahmy et al., Reference Fahmy, Pemberton and Sutton2012). Separate lists cover adult items, adult activities, child items and child activities. Child items and activities were covered separately so that the subsequent measures could explore variations in living standards within households, between children and their parents. This set of necessities then goes into a subsequent survey of living standards, where people are asked if they lack each item or do not do each activity and, if so, whether this lack is because they cannot afford it.Footnote 1
Second, the deprivation measure is regarded as consensual because there exists broad agreement across society on the items which should be regarded as necessities. It is a requirement of the methodology that differences in attitudes between population groups are relatively small, ‘Otherwise, the definition of an unacceptable standard of living just becomes the opinion of one group against another’ (Pantazis et al., Reference Pantazis, Gordon, Townsend, Pantazis, Gordon and Levitas2006: 90). Analysis of the 1999 attitudes data confirmed that differences by gender, age, social class and a range of other characteristics were relatively modest (Pantazis et al., Reference Pantazis, Gordon, Townsend, Pantazis, Gordon and Levitas2006). Similar analyses of the 2012 data confirmed that this still holds true for a wide range of contrasts (Kelly et al., Reference Kelly, Tomlinson, Daly, Hillyard, Nandy and Patsios2012; Main and Bradshaw, Reference Main and Bradshaw2013; Patsios et al., Reference Patsios, Nandy and Gordon2013).
For a UK-wide measure, the second condition also requires that differences between nations or regions are modest. In 1999, analyses were limited by the small size of the sample for Scotland and comparisons were made only with England rather than the RoUK (Pantazis et al., Reference Pantazis, Gordon, Townsend, Pantazis, Gordon and Levitas2006). That study concluded that the two countries were remarkably similar in their attitudes. For adult items and activities, people living in England saw thirty-five out of the long list of fifty-four items as necessities. People living in Scotland saw thirty-four out of the fifty-four items as necessities, and all of these were in the English set. The one item where the two countries differed was on having a roast joint (or vegetarian equivalent) at least once a week, where 58 per cent of the English saw it as a necessity compared with 42 per cent of the Scots. For twenty-five of the thirty-four necessities items, the variation in support was less than 5 per cent.
With the present PSE-UK Survey, there is the need to repeat this analysis to ensure that it is still appropriate to use the UK standard for analyses in Scotland; wider analyses of regional or national differences are also possible but they are not the focus here. It is possible that the intervening years, and the experience of devolved government in Scotland since 1999, have served to increase differences. The presence of a much larger Scottish sample along with coverage for the whole of the UK, also provides an opportunity to address this question with more precision and in greater depth.
The basis of a ‘Scottish effect’
The article is given a contemporary relevance by the impending independence referendum, but debates about Scottish ‘exceptionalism’ in political terms have a much longer history. It is these debates which give us some grounds to anticipate a possible ‘Scottish effect’ in relation to attitudes to the poverty line. In general terms, the Scots have tended to see themselves as having a more social-democratic or ‘left-of-centre’ outlook, and this view is bolstered by the recent tendency for the Scots to vote more for left-of-centre parties in Westminster elections (McCrone, Reference McCrone2001; Mooney and Scott, Reference Mooney and Scott2005; Curtice and Ormston, Reference Curtice and Ormston2011). Many factors might be cited as possible drivers of a Scottish difference. One commonly mentioned factor would be the rather different religious/political history of Scotland, where the Reformation took on a more ‘Protestant’ or ‘Calvinist’ character (McCrone, Reference McCrone2001). International comparative work suggests that more Protestant countries tend to be more solidaristic (van Oorschott, Reference van Oorschot2006). This might be expected to filter through into social attitudes which are more supportive of redistributive policies in Scotland.
In spite of the differences in voting patterns, however, survey evidence does not tend to support the view that there are substantial differences in underlying social and political attitudes (Brown et al., Reference Brown, McCrone and Paterson1996; Surridge, Reference Surridge, Bromley, Curtice, Hinds and Park2003). For example, successive surveys of social attitudes since 1999 have shown that in Scotland there tends to be slightly greater concern over levels of inequality in society and slightly greater support for redistribution, but the difference averages only 3 or 4 percentage points and it has not changed in that time (Curtice and Ormston, Reference Curtice and Ormston2011).
Other aspects of the Scottish context may lead to differences in interest and hence in attitudes. One feature of debates about poverty in Scotland has been a stronger emphasis on rural poverty than in other parts of the UK (Scottish Affairs Select Committee, 2000). This reflects the greater extent of rural, and particularly remote rural areas (McCrone, Reference McCrone2001). We might expect that there would be a greater emphasis on problems of mobility and access, and perhaps greater support for the suggestion that car ownership should be seen as a necessity given the dependence of rural populations on private means of transport.
The alternative basis for a difference between countries might be simply compositional effects. For example, previous research suggested that older groups were more likely to view many items as necessities (Pantazis et al., Reference Pantazis, Gordon, Townsend, Pantazis, Gordon and Levitas2006). As Scotland has slightly more older people, this will tend to push up support there even in the absence of any contextual differences arising from culture or geography. Having said this, there is generally little reason to expect large differences to result from compositional effects. For much of the twentieth century, Scotland was notably poorer than the RoUK, with higher unemployment levels and lower wages (Devine et al., Reference Devine, Lee and Peden2005). More recently, however, these differences have reduced so that, on the eve of the independence referendum, Scotland is the region which is most like the UK average in terms of a wide range of indicators such as labour market status or household incomes (McCrone, Reference McCrone2001).
Summary and research questions
This article examines attitudes to the necessities of life in Scotland compared with the RoUK. It addresses three specific questions: whether the same set of necessities items get majority support in Scotland as in the RoUK, and hence whether it is appropriate to use the same standard to judge poverty in Scotland as elsewhere; more generally, whether the Scots tend to express similar attitudes on each item as people in the RoUK; and, related to this, whether any differences observed arise through population composition or through context, including cultural differences.
Data and methods
Surveys
Three linked datasets are used in this analysis: a survey of Britain from 2012, a survey of Northern Ireland from 2012 and a survey of Scotland from 2011. All were conducted as part of the wider PSE-UK study and used the same methodology, albeit with some minor differences. The 2012 British data were collected through a standalone survey conducted between May and August 2012 with a stratified, clustered sample (NatCen, 2013). There were 1,447 completed interviews (51 per cent response rate). The Scottish part of this sample is relatively small (111 completed interviews) and drawn only from the area south of the Caledonian Canal. The 2012 Northern Ireland data come from a module within the June 2012 Northern Irish Omnibus Survey (NISRA, 2012). This was based on a simple random sample (550 completed interviews, 53 per cent response rate).
The 2011 Scottish data were collected from a module within an omnibus survey conducted between February and April 2011. It employs the same sampling design as the 2012 British survey so also excludes the area north of the Caledonian Canal. There were 465 completed interviews (54 per cent response rate). We use this survey in addition to the Scottish data from the 2012 British and NI surveys (hereafter referred to as the ‘UK 2012 survey’) because the sample size for the latter is so small that it is difficult to have much confidence in the results. In the early stages of the analysis, we report results from both surveys, so that it is clear that they show a similar picture and that the differences between the 2011 Scottish sample and the 2012 data for the rest of the UK do not arise from differences in timing or methodology. In the later stages, particularly for the modelling work, the sample size for Scotland in 2012 is simply too small to be useful and we report results only for the 2011 sample.
Necessities data
In all three surveys, views about necessities were captured using a sort card exercise.Footnote 2 Respondents were given a pile of cards with one item or activity on each. Separate piles covered adult items, adult activities, child items and child activities. Respondents were asked to sort cards into one of two boxes: items regarded as ‘necessary – which all adults should be able to afford and which they should not have to do without’; and those which ‘may be desirable but are not necessary’. There was no box for ‘don't know’ or other responses, but such spontaneous responses were recorded separately (as ‘don't know/unallocated’) and are omitted here.
Urban–rural coverage in Scotland
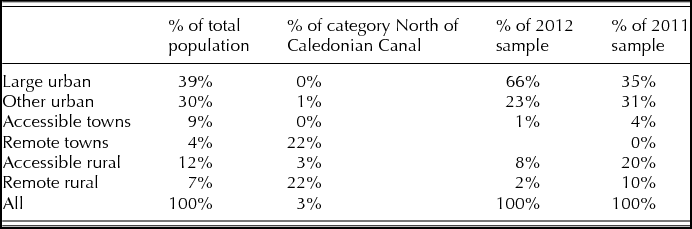
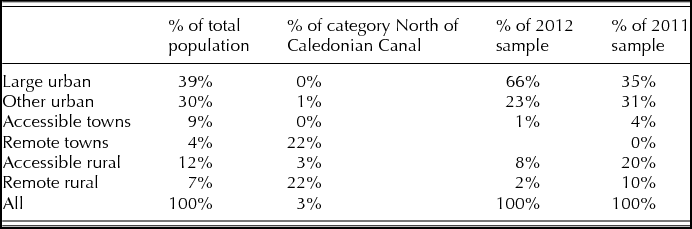
One limitation of both Scottish samples is the absence of data from areas north of the Caledonian Canal. This is a feature of many social surveys, including well-resourced Government surveys, and reflects the high costs of sampling in sparsely populated areas. It leads to the omission of 3 per cent of the Scottish population from the sample frame (Table 1). The potential for this to bias the overall Scottish figures should not be overstated, although there remains a concern that issues which are particularly relevant to those living in rural and remote areas will not be adequately captured.
Urban–rural distribution of Scottish sample
Source: Authors’ analysis. All figures based on Datazones using the Scottish Government's urban–rural classification with population estimates for 2009.
Table 1 also highlights a more worrying aspect of the 2012 data: that it is skewed to large urban centres, and to urban areas more generally. The more rural areas (the lower four categories) make up just 11 per cent of the sample compared with 31 per cent of the population, with all of these coming from the ‘accessible towns’ category. As the 2011 sample is larger and appears to have a better geographic coverage, the later stages of the article focus on those data alone.
Analysis
All three datasets are weighted to allow for unequal probabilities of selection and non-response, and to adjust sample characteristics to fit the known distributions for each region in terms of age and gender. All analyses allow for the effects of the complex sample design on estimates of confidence intervals.
To test for differences in aggregate views between countries, comparisons are made using relative risks: the ratio of the probability that someone from Scotland will view a particular item as a necessity to the probability that someone from the RoUK will view it as such (Gordon, Reference Gordon2012). To address the third research question on the relative role of composition and context, we use a series of logistic regression models. For this stage, we use only the Scottish data 2011 for the reasons noted above, and we compare this with the RoUK in 2012. To examine the effect of composition on aggregate attitudes, we include controls for demographic factors (age, gender, ethnicity, marital status, presence of dependent children, limiting disability), as well as urban–rural location, neighbourhood deprivation and socio-economic status (educational attainment, housing tenure, employment status, social class based on occupation and income quintile). Incomes in the 2011 survey are uprated to 2012 levels to allow for inflation.
Throughout the article, results are reported as statistically significant where the probability that they would have occurred by chance is less than 1 per cent. This is a stricter test than usually applied (the norm is 5 per cent), but it is appropriate here given the large number of tests being performed. At times, however, we do also comment on how the results would have differed if we had used the 5 per cent threshold, so that it is clear that we are not attempting to hide important differences through the use of an artificially tough test.
Findings
Definition of necessities
Our first question is whether majority views are the same in Scotland as in the RoUK, and hence whether the same standard can be used to judge poverty in both areas. The answer is clearly that the same standard can be applied as there is a very high level of agreement between the two groups. This is true for both adult and child necessities. Agreement is particularly close when using the larger 2011 Scottish sample.
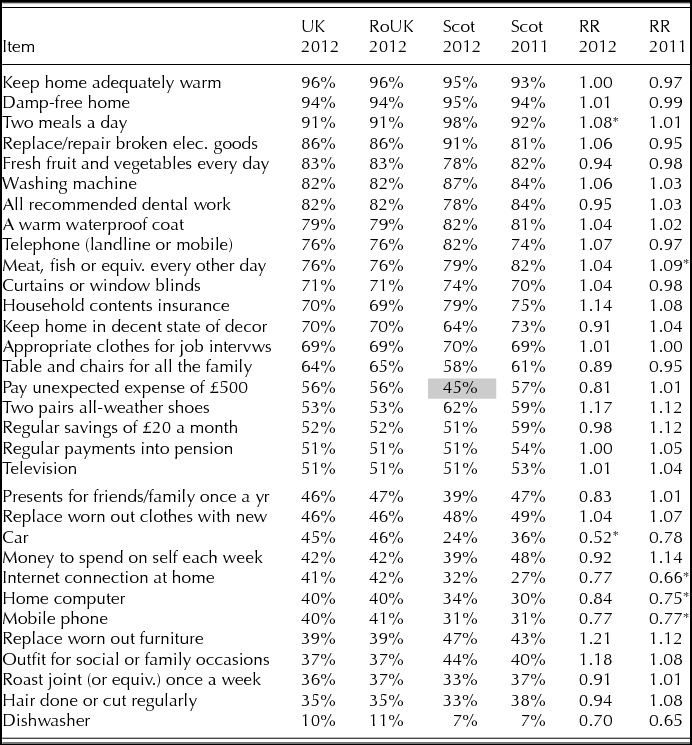
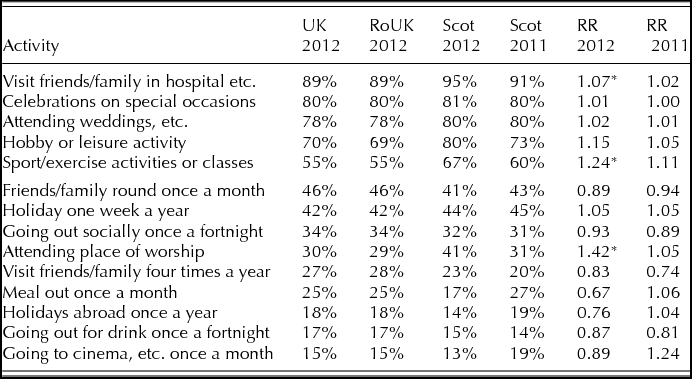
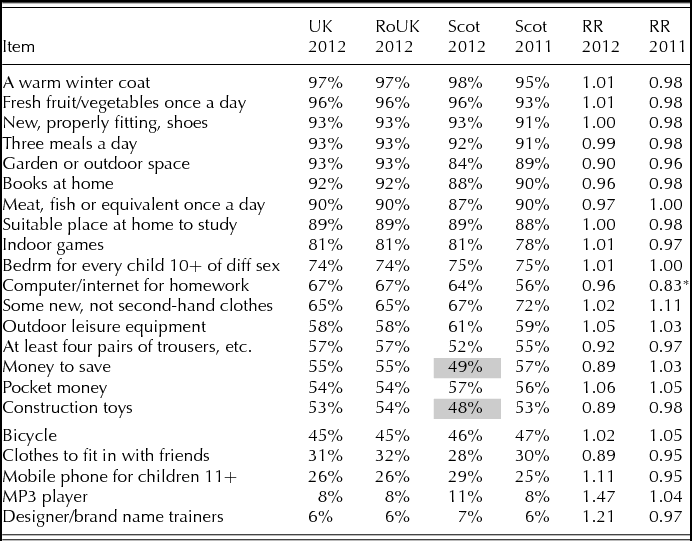
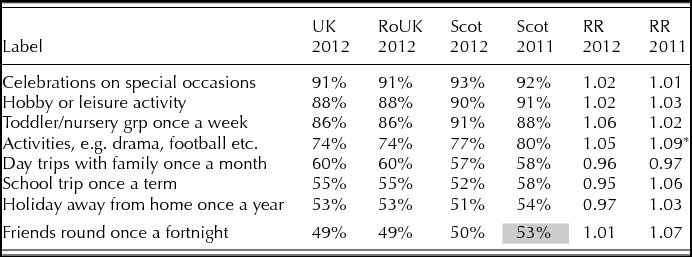
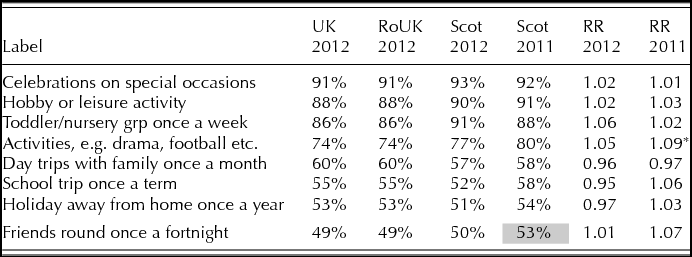
Across all seventy-six items and activities, people in the RoUK view forty-five items as necessities on average, while those in Scotland view forty-four as necessities (both 2011 and 2012 samples); the difference is not statistically significant. Tables 2 to 5 show the proportion viewing individual items as necessities in the UK as a whole, the RoUK and in the two Scottish samples, along with the relative risks for the last two compared with the RoUK. Tables are ordered by the UK percentage, with the horizontal line dividing items regarded as necessities from the others. Cells are shaded where the Scots have a different majority view to people in the UK.
Proportions viewing adult items as necessities and relative risks

Notes: RR 2012 – relative risk (Scotland 2012 vs RoUK 2012); RR 2011 – relative risk (Scotland 2011 vs RoUK 2012); * – significant at 1 per cent level. Shading highlights disagreement over necessities.
Proportions viewing adult activities as necessities and relative risks
Notes: RR 2012 – relative risk (Scotland 2012 vs RoUK 2012); RR 2011 – relative risk (Scotland 2011 vs RoUK 2012); * – significant at 1 per cent level.
Proportions viewing children's items as necessities and relative risks
Notes: RR 2012 – relative risk (Scotland 2012 vs RoUK 2012); RR 2011 – relative risk (Scotland 2011 vs RoUK 2012); * – significant at 1 per cent level. Shading highlights disagreement over necessities.
Proportions viewing children's activities as necessities and relative risks
Notes: RR 2012 – relative risk (Scotland 2012 vs RoUK 2012); RR 2011 – relative risk (Scotland 2011 vs RoUK 2012); * – significant at 1 per cent level. Shading highlights disagreement over necessities.
Across seventy-six comparisons for each of two Scottish samples, there are just four differences in majority views; none is statistically significant (and this is true whether we use the 1 per cent threshold for significance or the less stringent 5 per cent threshold) and they are not all in the same direction. Of the thirty-two adult items, twenty are considered necessities by the whole of the UK (Table 2). With the 2011 Scottish sample, exactly the same set of items was regarded as necessities. With the 2012 sample, there was one difference (on whether ‘unexpected expenses of £500’ were a necessity), but the proportion was only just below the 50 per cent threshold in Scotland and the difference in ratings was not statistically different from the RoUK. Of the fourteen adult social activities, the same five were considered necessities by both Scottish samples as for the RoUK (Table 3).
From the list of twenty-two child items, respondents in the UK selected seventeen as necessities (Table 4). Scots in the 2011 sample chose exactly the same list. In the 2012 sample, Scots identified fifteen of these seventeen as necessities. Two items were not viewed as necessities by the 2012 sample of Scots (‘money to save’ and ‘construction toys’), but both were close to the 50 per cent threshold and, as previously, the difference in ratings was not statistically significant. With child activities, seven of the eight were viewed as necessities by the UK sample. The 2012 Scottish sample identified exactly the same list; the ‘50%’ figure for the eighth item is actually 49.7 per cent but rounded up in the table. The 2011 Scottish sample identified all eight as necessities, adding ‘friends round once a fortnight’ to the UK list (Table 5). Once again, this difference was not statistically significant.
Views on individual items
Our second question goes beyond looking simply at the majority opinion to explore whether similar proportions of Scots rated items necessities as in the RoUK. For brevity, we focus here only on the larger 2011 Scottish sample, although results for both are shown in the tables above. Scatterplots show the proportions viewing each item as a necessity in the two regions (Figures 1 and 2) while the relative risks from Tables 2 to 5 identify statistically significant differences (labelled on figures). Again, the picture is of a very high level of consistency. We test differences for all seventy-six items or activities. With a 1 per cent threshold for significance testing, we would expect to see one or perhaps two items identified as significantly different in each year. In practice, we observe six significant differences in 2011, suggesting something slightly more than random noise; if we had used the 5 per cent threshold, we would have expected to observe around four differences and in practice we see eleven, a very similar result. However, the absolute scale of the differences remains small, as is clear from the scatterplots and the direction is again not consistent.
Adult items and activities – Scotland 2011 vs RoUK
Note: Items labelled where RR shows significant difference at 1 per cent level.
Child items and activities – Scotland 2011 vs RoUK
Note: Items labelled where RR shows significant difference at 1 per cent level.
Of the thirty-two adult items, there is a suggestion that the Scots are less likely to view more advanced consumer goods as necessities (lower scores for internet access, computer, and mobile phone in 2011), but they give a higher rating to one of the food items (meat/fish/vegetarian equivalent). Views on car ownership are particularly interesting given debates about rural poverty in Scotland and the importance attached to cars there given the scarcity of public transport. Both Scottish samples give it less support than their RoUK counterparts, although only in 2012 is the difference significant. There are no significant differences for adult activities in the 2011 sample. Turning to the child items and activities (Tables 4 and 5, Figure 2), differences are even more muted. Of the 22 child items, the only difference is with ‘computer and internet for homework’, which attracts less support in the 2011 Scottish sample. This difference ties in with what we saw in the adult items in relation to advanced consumer goods. With child activities there is one significant difference, with the 2011 Scottish sample giving a higher rating to ‘activities’ or clubs for children.
Composition versus context
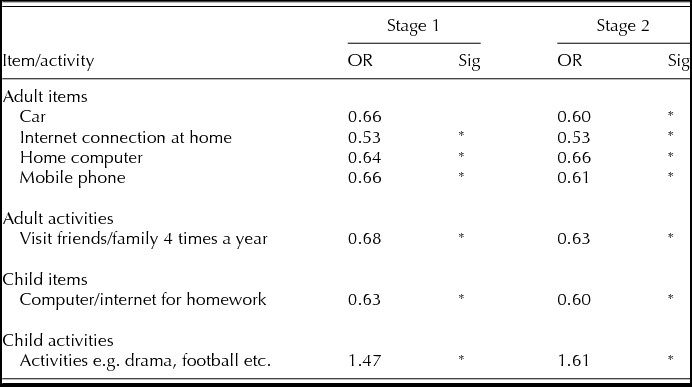
In the third stage we explore whether the differences observed above reflect compositional or contextual factors – or indeed whether contextual differences emerge when we control for composition. The differences between views in Scotland are compared with those in the RoUK using logistic regression models with two stages: at Stage 1 models contain only the Scotland dummy, while at Stage 2 models includes the full set of demographic, location and socio-economic controls discussed in the methods section. The analysis is restricted to the 2011 Scottish sample since the 2012 sample is too small for modelling in this way. Seventy-six models are constructed, and Table 6 shows the seven where the Scottish coefficient was significant at either stage. In other words, for 69 of the necessities items there was no significant difference between Scotland and the RoUK without any controls, and this did not change at Stage 2. In six cases, there was a significant difference without any controls and this remained at Stage 2. In only one case – car ownership – did adding controls make any difference to the Scottish dummy. Differences between Scotland and the RoUK, such as they are, would appear to reflect modest contextual differences arising from culture or geography, not compositional factors.
Logistic regression models – coefficients for Scotland dummy
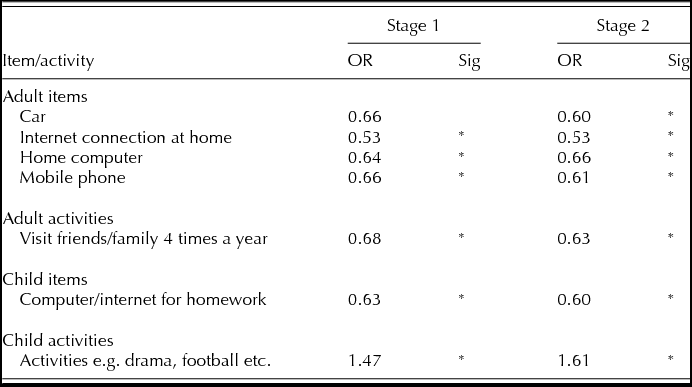
Notes: Each line summarises one model with two stages, showing only the coefficient for the Scotland dummy. * – significant at 1 per cent level.
Five of the seven cases where there are differences are consumer durables: car, home computer and internet connection for adults, mobile phone and computer/internet for children. In all of these cases, the Scots are significantly less likely to view these as necessities. This is perhaps most surprising in relation to car ownership. If there is a Scottish rural effect, it is more than outweighed by a more general Scottish attitude to some kinds of consumer durable. This may stem from the fact that Scotland has long had lower levels of ownership of these kinds of goods than the rest of the UK (Figure 3). For example, the proportion of UK households without access to a car has fallen from about half at the start of the 1970s to one quarter in recent years. Throughout this time, the proportion of the Scots without access to a car has been at least one fifth higher. The proportion without a home computer has been five to ten per cent greater in Scotland since surveys recorded this item. One exception to the general rule has been higher ownership rates for washing machines in Scotland; the reasons for this are unclear but may be to do with the high proportions of Scots who live in flats and therefore lack access to outside drying spaces, as well as the cooler, wetter climate.
Relative risk of lacking consumer durables – Scotland versus UK
Sources: Published tables for: 1970s to 1990s, Family Expenditure Survey; 2001–4, Expenditure and Food Survey; 2009–11, Living Costs and Food Survey. Series stop when percentage lacking item for UK or Scotland below 5 per cent due to volatility in relative risk measure.
Further regional comparisons
One criticism of our approach is that, by contrasting Scotland with the rest of the UK, we may be masking significant regional differences. In particular, one might expect the north of England to share more in common with Scotland, given more similar economic histories, but sharper contrasts to exist between Scotland and the south of England, which is geographically more distant and has had a very different economic history, being dominated by the financial and business centre of London. It is both richer and more unequal than other parts of the UK (Goodman et al., Reference Goodman, Johnson and Webb1997).
We therefore repeat the earlier analysis, now contrasting Scotland with the south of England only (defined as London plus East, South East and South West regions). We make comparisons using the larger 2011 Scottish sample. The overall conclusion is that views on necessities in Scotland are much the same as those in the south of England. On majority views about necessities, the Scots and those in the South agree on seventy-four out of seventy-six items. The two exceptions are both children's activities: a holiday away from home for children once a year; and having friends round for tea once a fortnight. Both are seen as necessities (just) in Scotland but fall just short of majority support in the South (49 per cent); neither difference is significant.
In terms of more general levels of views, there are just five significant differences between Scotland and the South of England, one fewer than when comparing the 2011 Scottish sample with the RoUK as a whole; if we use the 5 per cent threshold, there are six significant differences. In this case, the differences all lie in the same direction, with the Scots slightly less likely to view these items as necessities. If anything, then, the Scots have slightly lower expectations than the South of England. Four of the items are high-tech goods discussed above (home internet connection, home computer, mobile phone, computer/internet for child to do homework), with 10–16 per cent fewer Scots viewing these as necessities, while the fifth is visits to friends/family four times a year. As previously, there is almost no change in this picture when we control for a range of compositional factors through logistic regression models.
Conclusions and discussion
For the analysis of poverty, the key finding from this article is that the population of Scotland does not have a different view about the items which constitute the necessities of life compared to the rest of the UK; it does not even differ from the South of England – the part of the UK with which it might have been expected to have most divergence in views. It follows that the same standard can therefore be used to judge levels of poverty across the whole of the UK. That is an important finding for the PSE-UK project and for the consensual approach more generally. It confirms previous comparisons of views about the necessities of life north and south of the border (Pantazis et al., Reference Pantazis, Gordon, Townsend, Pantazis, Gordon and Levitas2006). More generally, it supports the results of much previous work on consensual measures that a strong consensus on the necessities exists across a very wide range of social groups or divisions.
For the wider understanding of social attitudes, our findings fit with much previous research which has suggested that the image of Scotland as a part of the UK with more ‘progressive’ attitudes tends to be over-stated. The results therefore challenge the claims made by many proponents of constitutional change that independence for Scotland would automatically lead to a fairer, more equal society. The fact that the Scots would set the same minimum standard as the UK as a whole suggests that little would change with independence, at least in the early years. When we extend the analysis of attitudes by controlling for compositional factors, the picture does not change. This suggests that such differences as do exist arise from context rather than composition, and might therefore be viewed as some indication of very limited cultural difference. The overwhelming impression, however, is one of similarity.
At the same time, it is important to remind ourselves of the most glaring contradiction which the PSE-UK's consensual measure exposes: that 29 per cent of households in Scotland and 33 per cent in the UK as a whole have living standards below the minimum identified by this democratic approach (Bailey and Bramley, Reference Bailey and Bramley2013; Gordon et al., Reference Gordon, Mack, Lansley, Main, Nandy, Patsios and Pomati2013). Attitudes to the social minimum are clearly not the only factor shaping social policy. Other kinds of social attitudes may be important, and these may appear contradictory or to pull in other directions (Golding and Middleton, Reference Golding and Middleton1982). Political or public discourses on poverty and inequality are another factor, and these have certainly been more progressive in tone in Scotland in recent years, even if policies have differed little in substance (Scott and Mooney, Reference Scott and Mooney2009). The potential impacts of independence or of greater devolution on the social minimum in Scotland therefore remain unclear.
Acknowledgement
The research on which this article is based was funded by an ESRC grant, the Poverty and Social Exclusion in the UK 2012 Survey (RES-060-25-0052). This involved a large team of researchers, led by Professor Dave Gordon at the University of Bristol and involving academics from the Universities of Glasgow, Heriot-Watt, Queens Belfast and York as well as the Open University. We would like to acknowledge the contribution of our colleagues in the development of the surveys on which this paper is based as well as their many contributions to helping to shape our thinking on this topic.