1. Introduction
Protein misfolding and aggregation are related to many diverse and severe pathologies, several of which are neurodegenerative disorders (Ross & Poirier, Reference Ross and Poirier2004). Considering that age is a risk factor for most neurodegenerative diseases and considering the expected increase in the average lifespan, modern biomedical science is intensely committed to studying the molecular mechanisms responsible for neurodegeneration. In particular, biophysicists, molecular and cell biologists and clinicians are exploiting a multitude of different approaches to tackle this issue.
One of the most studied neurodegenerative disorders linked to protein aggregation is Parkinson's disease (PD). The relevant misfolding protein is the 140 amino acid α-synuclein (aS). aS aggregation is not only related to PD etiopathogenesis but also to other neurodegenerative disorders, i.e., dementia with Lewy Bodies (LBs), multiple system atrophy (MSA) and Alzheimer's disease (AD). These diseases, because of their shared aS involvement, are collectively termed synucleinopathies (Trojanowski & Lee, Reference Trojanowski and Lee2003).
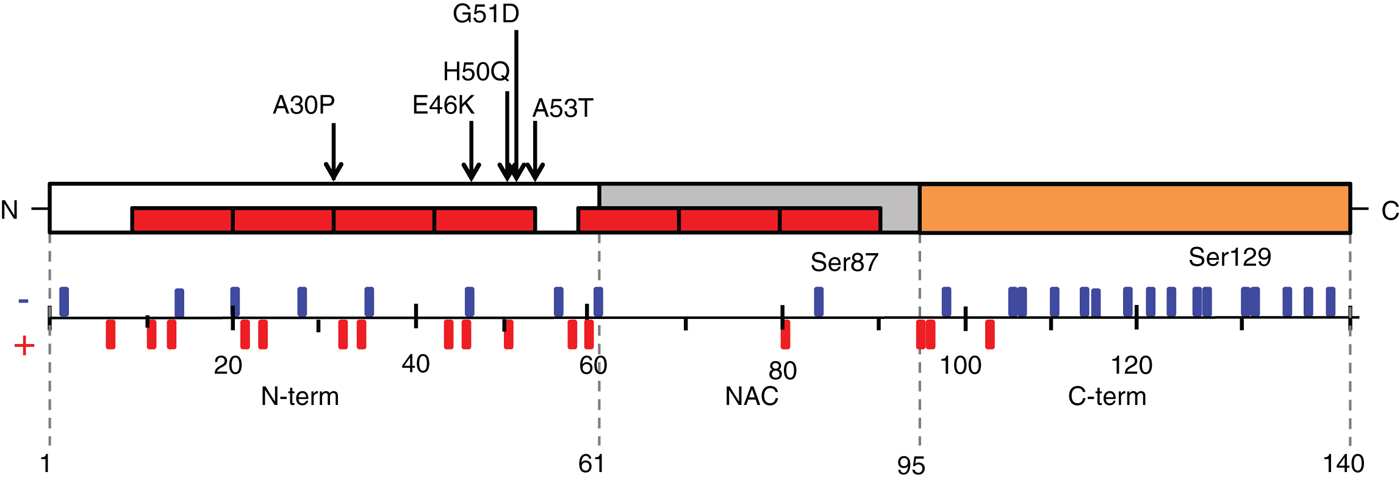
The primary structure of aS (Fig. 1) is divided into three main regions: (i) the N-terminus (N-term), including the first 60 amino acids, (ii) the non-beta amyloid component (NAC) region from residue 61 to residue 95, which is highly hydrophobic and acquires a β-sheet structure when aS forms amyloid fibrils (Weinreb et al. Reference Weinreb, Zhen, Poon, Conway and Lansbury1996), and (iii) the C-terminus (C-term), which includes 14 negatively charged acidic residues and does not exhibit a defined secondary structure. The N-term together with the NAC region can form an amphipathic α-helix that is responsible for protein–membranes interactions (Bartels et al. Reference Bartels, Ahlstrom, Leftin, Kamp, Haass, Brown and Beyer2010) (see Section 4.1). As will be discussed below, most studies suggest that aS has a disordered structure in solution under physiological conditions. Upon binding to phospholipid vesicles and lipid membranes, the N-term residues adopt a helical structure; conversely, aS seems to acquire a β-sheet structure in the fibrils found in the LBs in parkinsonian brains.
Schematic representation of aS sequence. The three regions in which the protein is typically divided are reported: (i) amino acids 1–60 correspond to the N-term, an amphipathic region responsible for aS membrane interactions, which acquires an α-helical structure together with part of the central region of the protein, in the presence of detergents or when bound to lipid membranes. As shown, all the pathological mutations of aS identified so far are located at the N-term (A30P, E46K, H50Q, G51D and A53T). (ii) The NAC region (non-beta amyloid component) is the part of the protein that drives the first steps of the aggregation process and folds into a β-sheet secondary structure when aS aggregates and form amyloid fibrils. (iii) The C-term is characterized by the presence of several negative charges and by the fact that it does not acquire any defined secondary structure features, neither in the fibrils nor when aS is bound to the membranes. The protein sequence shows seven repeats with an apolipoproteins lipid-binding motif [EGS]-K-T-K-[EQ]-[GQ]-V-XXXX, which are represented in the figures as red rectangles (www.uniprot.org). The schema reports also aS charges distribution and the position of the two serines found to be relevant to PD because phosphorylated in parkinsonian brains or PD models.

aS is widely expressed in the central nervous system and is mainly localised in the presynaptic terminals, in both cytosolic and membrane-bound forms (Clayton & George, Reference Clayton and George1999). Human aS belongs to the synuclein protein family, which includes two other proteins, β-synuclein and γ-synuclein. The other two synucleins share a high sequence identity with aS (52 and 63%, respectively) and exhibit similar expression patterns (Clayton & George, Reference Clayton and George1998).
The physiological functions of aS are still poorly understood, but mounting evidence ascribes to the protein a role in synaptic vesicle recycling and docking, Soluble NSF Attachment Protein Receptor (SNARE) complex assembly (Burre et al. Reference Burre, Sharma, Tsetsenis, Buchman, Etherton and Sudhof2010) and neurotransmitter release (Liu et al. Reference Liu, Ninan, Antonova, Battaglia, Trinchese, Narasanna, Kolodilov, Dauer, Hawkins and Arancio2004). aS has been shown to involved in synaptic plasticity and learning (Clayton & George, Reference Clayton and George1998), but its activity is likely dispensable, as knock-out mice are viable and present only subtle alterations in dopamine (DA) release and reduced levels of striatal DA (Abeliovich et al. Reference Abeliovich, Schmitz, Farinas, Choi-Lundberg, Ho, Castillo, Shinsky, Verdugo, Armanini, Ryan, Hynes, Phillips, Sulzer and Rosenthal2000), supporting the hypothesis that the protein is a DA release modulator. Moreover, it has been shown that aS can interact with microtubules (Esposito et al. Reference Esposito, Dohm, Kermer, Bahr and Wouters2007) and actin (Alim et al. Reference Alim, Ma, Takeda, Aizawa, Matsubara, Nakamura, Asada, Saito, Kaji, Yoshii, Hisanaga and Ueda2004) and can affect actin structure and dynamics (Sousa et al. Reference Sousa, Bellani, Giannandrea, Yousuf, Valtorta, Meldolesi and Chieregatti2009). Interestingly, aS knock-out mice also showed impairment in working and spatial long-term memory, as evaluated by the behavioural tests (Kokhan et al. Reference Kokhan, Afanasyeva and Van'kin2012). However, neuronal dysfunctions, alterations in synaptic structures and decreased survival rate were observed in triple knock-out mice lacking all three synuclein isoforms, revealing the importance of these three proteins for the functionality of the central nervous system (Greten-Harrison et al. Reference Greten-Harrison, Polydoro, Morimoto-Tomita, Diao, Williams, Nie, Makani, Tian, Castillo, Buchman and Chandra2010).
PD pathogenesis is mainly sporadic, but ∼5–10% of PD cases are linked to mutations in single genes. Autosomal recessive, early-onset forms of this disorder are inherited through mutations in the PINK1, parkin or DJ-1 genes, which encode proteins involved in the maintenance of mitochondrial function during oxidative stress (Berman & Hastings, Reference Berman and Hastings1999). Autosomal dominant, late-onset PD, on the other hand, is caused by mutations in the Leucine-rich repeat kinase 2 (LRRK2) gene (Funayama et al. Reference Funayama, Hasegawa, Kowa, Saito, Tsuji and Obata2002), the aS-coding SNCA gene (Kasten & Klein, Reference Kasten and Klein2013) and Vacuolar Sorting Protein 35 (VPS35) (Zimprich et al. Reference Zimprich, Benet-Pages, Struhal, Graf, Eck, Offman, Haubenberger, Spielberger, Schulte, Lichtner, Rossle, Klopp, Wolf, Seppi, Pirker, Presslauer, Mollenhauer, Katzenschlager, Foki, Hotzy, Reinthaler, Harutyunyan, Kralovics, Peters, Zimprich, Brucke, Poewe, Auff, Trenkwalder, Rost, Ransmayr, Winkelmann, Meitinger and Strom2011).
Monogenic forms of PD closely resemble idiopathic cases and represent a rich opportunity for revealing the nature of PD pathology. Both idiopathic and genetic forms of PD are characterized by progressive death of dopaminergic neurons in the substantia nigra pars compacta. However, not all dopaminergic neurons in the brain are affected (e.g., dopaminergic neurons of the ventral tegmental area are spared), and other brain regions seem to be affected at later stages (Dickson, Reference Dickson2007). Functional imaging (i.e., positron emission tomography) suggests that at least 70% of the dopaminergic neurons must degenerate before manifestation of the first symptoms of parkinsonism (Brooks, Reference Brooks1998).
The evidence that linked aS and genetic PD was the discovery of single point mutations, i.e., A30P, E46K and A53T (Kruger et al. Reference Kruger, Kuhn, Muller, Woitalla, Graeber, Kosel, Przuntek, Epplen, Schols and Riess1998; Polymeropoulos et al. Reference Polymeropoulos, Lavedan, Leroy, Ide, Dehejia, Dutra, Pike, Root, Rubenstein, Boyer, Stenroos, Chandrasekharappa, Athanassiadou, Papapetropoulos, Johnson, Lazzarini, Duvoisin, Di Iorio, Golbe and Nussbaum1997; Zarranz et al. Reference Zarranz, Alegre, Gomez-Esteban, Lezcano, Ros, Ampuero, Vidal, Hoenicka, Rodriguez, Atares, Llorens, Gomez Tortosa, Del Ser, Munoz and De Yebenes2004), in the gene SNCA and the gene's duplication (Chartier-Harlin et al. Reference Chartier-Harlin, Kachergus, Roumier, Mouroux, Douay, Lincoln, Levecque, Larvor, Andrieux, Hulihan, Waucquier, Defebvre, Amouyel, Farrer and Destee2004) and triplication (Singleton et al. Reference Singleton, Farrer, Johnson, Singleton, Hague, Kachergus, Hulihan, Peuralinna, Dutra, Nussbaum, Lincoln, Crawley, Hanson, Maraganore, Adler, Cookson, Muenter, Baptista, Miller, Blancato, Hardy and Gwinn-Hardy2003) leading to autosomal dominant forms of the disease. Recently, two other mutations in the central region of aS (G51D and H50Q) were associated with familial PD (Kiely et al. Reference Kiely, Asi, Kara, Limousin, Ling, Lewis, Proukakis, Quinn, Lees, Hardy, Revesz, Houlden and Holton2013; Proukakis et al. Reference Proukakis, Dudzik, Brier, Mackay, Cooper, Millhauser, Houlden and Schapira2013). Susceptibility to PD is increased in the presence of risk variants on the SNCA gene, i.e., in the 3′UTR or the promoter region (Fuchs et al. Reference Fuchs, Tichopad, Golub, Munz, Schweitzer, Wolf, Berg, Mueller and Gasser2008).
Protein and lipid aggregates, termed LBs and Lewy Neurites (LNs), are found in the surviving neurons in brains of patients with a PD diagnosis. The observation that the main constituent of LBs and LNs is an aggregated fibrillar β-sheet-rich form of aS is additional evidence linking the protein to PD (Hirsch et al. Reference Hirsch, Graybiel and Agid1988; Spillantini et al. Reference Spillantini, Schmidt, Lee, Trojanowski, Jakes and Goedert1997; Takeda et al. Reference Takeda, Mallory, Sundsmo, Honer, Hansen and Masliah1998).
aS and its propensity to aggregate seem to be crucial in PD etiopathogenesis: in the past years, several studies have attempted to unravel the mechanisms of aS oligomerization and fibril formation and, more importantly, to define the relationship between these processes and neuronal death. Unfortunately, the molecular mechanism of aS aggregation has not been completely elucidated in vitro and remains quite obscure in vivo. To further complicate this matter, the process seems to be heavily influenced by experimental conditions (Giehm et al. Reference Giehm, Lorenzen and Otzen2011a), which can lead to different aggregation products and kinetic parameters. With these premises, it is clear that studying aS aggregation in cell and animal models is important to pin down the (patho)physiologically relevant aS aggregation products and conditions. Several diverse biophysical approaches have recently been developed and used to study aS aggregation. Fluorescence spectroscopy, microscopy and scattering techniques have been exploited to evaluate the kinetics of the aggregation process and to describe the properties of both aggregation intermediates and fibrillar end products. Moreover, a large number of possibly toxicity mechanisms related to aS aggregation have been proposed, but the actual causes of neuronal death are still objects of debate. The gain-of-function, toxic mechanism(s) related to aS mutations or aggregate formation is most likely responsible for aS-induced cell death and should be further elucidated.
In this review, we will try to summarize the key findings on this challenging topic, with the aim of reconstructing the plethora of available biophysical data into a comprehensive biological frame. Moreover, we will suggest important biological question in this field that could be dissected using biophysical techniques.
In particular, the structural characterization of oligomers remains a tricky but crucial issue, considering their heterogeneity and transient nature. Structural information of oligomers, which can be effectively studied using biophysical methods, is necessary to define the relationship between aS oligomer-induced toxicity and their properties.
2. Aggregation kinetics
Unfolded monomeric aS, in extreme or pathological conditions, tends to acquire a transient β-sheet structure prone to aggregation. The first steps of self-interaction of aS monomers occur rarely, but after an initial lag phase, monomers start to aggregate onto the newly formed nucleation centres to form oligomeric species. As soon as the oligomer concentration reaches a critical point, they are rapidly converted into protofilaments, protofibrils and, finally, amyloid fibrils. The kinetic properties that govern aS amyloid formation can be described by a sigmoidal time dependence: an initial lag phase, suggesting a nucleation mechanism (see Section 1.2.2) where oligomers act as nuclei; a subsequent phase of rapid oligomer assembly into higher molecular weight species, resulting in a decrease in oligomer concentration and an increase in fibrillar species concentrations; and finally, the process reaches a plateau when mature fibrils become the majority of the polymers in solution and continue their growth. However, the process described above emerges mainly from in vitro experiments and is likely more complex in the cellular contest, which is characterized by different competing ligands and pathways (Kaylor et al. Reference Kaylor, Bodner, Edridge, Yamin, Hong and Fink2005), leading to multiple forms of aggregation intermediates, oligomers and fibrils.
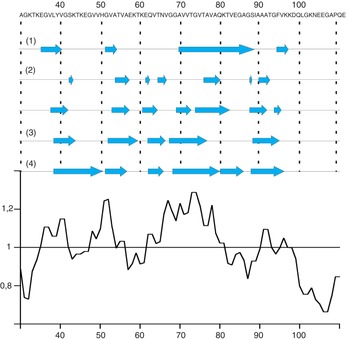
Core region of aS fibril. Amino acidic sequence and β-strands representation for different models: (1) β-strands distribution in aS fibril as obtained from EPR experiments (Chen et al. Reference Chen, Margittai, Chen and Langen2007). (2) β-strands distribution in two different type of aS identified in a solid-state NMR study (Heise et al. Reference Heise, Hoyer, Becker, Andronesi, Riedel and Baldus2005). (3) Five β-strands were proposed by Vilar et al. in a model based on solid-state NMR experiments (Vilar et al. Reference Vilar, Chou, Luhrs, Maji, Riek-Loher, Verel, Manning, Stahlberg and Riek2008). (4) Most recent β-strands distribution in the aS fibrils core region as defined by solid-state NMR assignment of 106 out of 140 residues of the aS sequence (Comellas et al. Reference Comellas, Lemkau, Nieuwkoop, Kloepper, Ladror, Ebisu, Woods, Lipton, George and Rienstra2011). Below, a schematic representation of the result obtained using Chou–Fasman algorithm to calculate the average β-sheet propensity of the central part of aS, starting from residue 30 up to residue 110 (Suk et al. Reference Suk, Lokappa and Ulmer2010). As expected, there is a good correspondence between the calculated β-sheet propensity and the β-strands measured using structural techniques described above.

Among these different aS aggregation products, oligomers are the least well-defined mainly because of their ample heterogeneity: it has been shown (see Section 4 for details) that aS oligomers can acquire ensembles of different secondary structures and morphologies depending on the conditions under which they are formed. Therefore, reaction conditions cannot be used to unambiguously define or classify oligomers. The same can be said for a classification based on oligomers’ structural properties because the structural differences among the ensemble of oligomers do not allow discrimination of individual species. One possibility is to define aS oligomers as all the species that are still able to revert to monomers in a chemical equilibrium. However, this definition does not account for those aS oligomers that are off-pathway in the aggregation process and that neither reverts to aS monomers nor converts to aS fibrils. For these reasons, the definition of aS oligomeric species may not be unequivocal and remains an open question that needs to be answered. Conversely, protofilaments, protofibrils and fibrils are more homogeneous and experimentally manageable species, as will be discussed in Section 5.
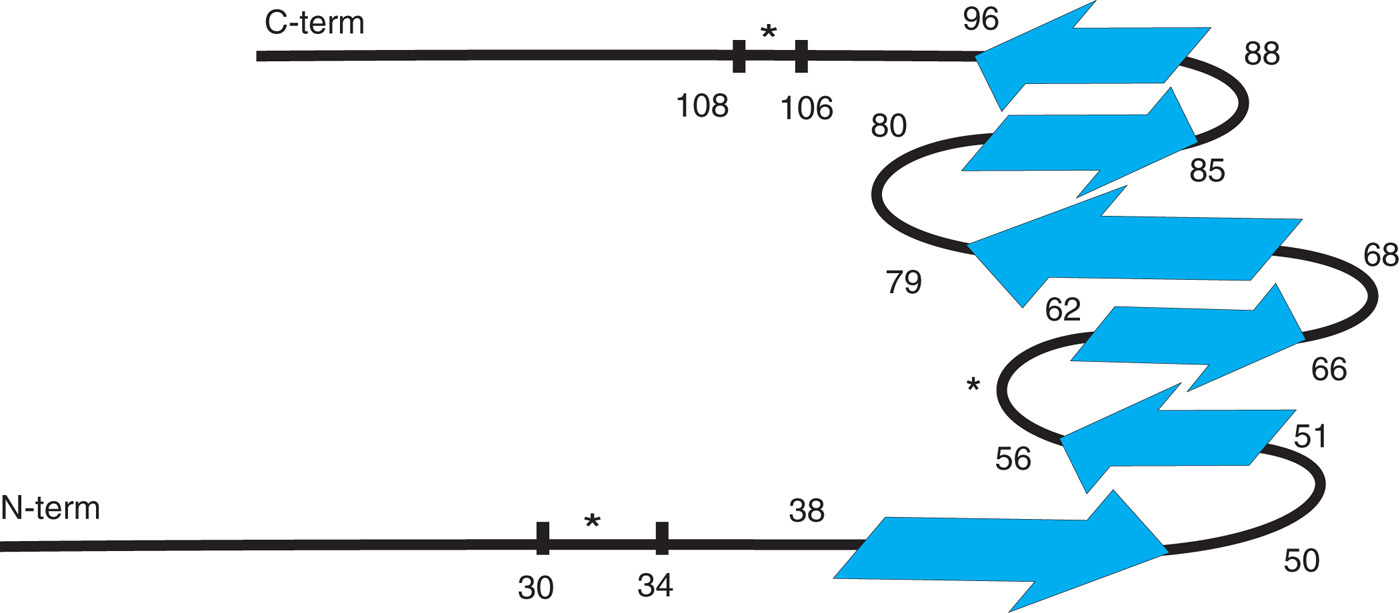
The primary forces that drive aS fibrillization are hydrophobic interactions due to a hydrophobic stretch in the middle of the aS sequence (from residues 71 to 82), which is composed of 12 amino acids (VTGVTAVAQKTV) (Giasson et al. Reference Giasson, Murray, Trojanowski and Lee2001). In this paper, the authors showed how the introduction of a charged residue in this stretch of the fibril core region, i.e., A76R or A76E, decreased the fibrillization rate in vitro. Moreover, a synthetic peptide corresponding to the hydrophobic stretch mentioned above can form filaments when aggregated alone. It should be mentioned that β-synuclein, which seems not to aggregate in vitro, lacks this hydrophobic stretch of amino acids (Yamin et al. Reference Yamin, Munishkina, Karymov, Lyubchenko, Uversky and Fink2005). Interestingly, it has been shown that β-synuclein can be induced to fibrillize in particular conditions (metal ions, pesticides), further suggesting that even non-amyloidogenic proteins can be forced to form fibrils under certain circumstances (Suk et al. Reference Suk, Lokappa and Ulmer2010; Yamin et al. Reference Yamin, Munishkina, Karymov, Lyubchenko, Uversky and Fink2005). A recent report suggests that β-synuclein behaves similarly to aS: it aggregates and forms amyloid fibrils, and oligomeric aggregation intermediates are able to permeabilize membranes and to damage mitochondria, causing neuronal death (Taschenberger et al. Reference Taschenberger, Toloe, Tereshchenko, Akerboom, Wales, Benz, Becker, Outeiro, Looger, Bahr, Zweckstetter and Kugler2013).
The most commonly used technique to study the kinetics of aS aggregation in vitro is fluorescence spectroscopy because measuring the variation in the fluorescence properties of suitable exogenous fluorophores over time allows quantitative analysis of the aS aggregation process. This type of data provides the statistical basis for the comparison of different numerical models proposed to describe the kinetic properties of aS aggregation (Morris et al. Reference Morris, Watzky and Finke2009). Moreover, comparative analysis of the aggregation data obtained under different conditions led to the identification of the relevant parameters of aS fibrillization in vitro, i.e., protein concentrations, pH values, buffer conditions, temperature, agitation speed and type and presence of solution–air interfaces (Giehm & Otzen, Reference Giehm and Otzen2010).
2.1 Fluorescent dyes for amyloid fibrils
In this section, we will present an overview of the fluorescent dyes used to study the time dependence of amyloid fibril formation. The fluorescence emission of the dye Thioflavin T (ThT) increases upon binding to β-sheet structures. Therefore, measuring ThT fluorescence intensity variations as a function of time in an aggregation assay has allowed the monitoring of β-sheet formation and thereby the fraction of aS fibrils. ThT is typically excited at 450 nm, and the emission spectrum is recorded between 460 and 550 nm, with a maximum at 480 nm. The fluorescence intensities of ThT and Thioflavin S (ThS) are usually measured in vitro (LeVine, Reference Levine1993) and in cells or tissue (Luk et al. Reference Luk, Song, O'Brien, Stieber, Branch, Brunden, Trojanowski and Lee2009), respectively. However, ThS can also be used in vitro; there are two main differences between the two dyes, which are both derived from the same chemical precursor: ThT undergoes a change in its emission spectrum and is positively charged under binding conditions, whereas ThS has a negative charge under the same conditions and its emission spectrum only increases in intensity in the presence of β-sheets (LeVine, Reference Levine1993). ThT is preferred over ThS for in vitro assays because the shifted ThT emission peak in the presence of amyloid is more easily distinguished from the background fluorescence of free dye in solution. To our knowledge, it is still unclear why ThT is not used to stain cells or tissues, but it may be related to its reduced binding specificity in a complex environment.
The binding mechanism of ThT to amyloids is not fully understood; Krebs et al. (Reference Krebs, Bromley and Donald2005) proposed that the ThT molecules intercalate perpendicularly to the backbone of aS in a β-sheet conformation and therefore are parallel to the long axes of protofilaments, protofibrils or fibrils. However, even though the binding between aS fibrils and ThT shows high specificity, no binding constants or evidence for the mode of binding aS fibrils have been reported, although the binding constants were estimated using absorbance spectroscopy data of ThT and fibril solution for the amyloids formed by lysozyme (i.e., 7.5 × 10⁶ and 5.6 × 10⁴ M−1) (Sulatskaya et al. Reference Sulatskaya, Kuznetsova and Turoverov2011). A crystallographic structure of ThT bound to β-2 microglobulin amyloid-like aggregates allowed the definition of the photophysical properties of ThT when bound to β-sheets (Wolfe et al. Reference Wolfe, Calabrese, Nath, Blaho, Miranker and Xiong2010). The authors proposed that the fluorophore's electronic ground state distribution is stabilized sterically and electrostatically by β-sheets, that emission due to non-radiative relaxation is minimized, and that consequentially the quantum yield increases. However, it should be mentioned that despite its use in several studies to evaluate the kinetic properties of aS aggregation, emission measurements of ThT fluorescence often show variable emission efficiency and low reproducibility. These difficulties can only in part be ascribed to the intrinsic variability in the kinetics of the aS aggregation process. Indeed, it has been shown that ThT micelles can be present in solution and enhance fluorescence intensity (Khurana et al. Reference Khurana, Coleman, Ionescu-Zanetti, Carter, Krishna, Grover, Roy and Singh2005), even in the absence of the β-sheet structure. It has also been proposed that the surfaces responsible for the interaction with ThT can be shielded upon conversion of protofilaments to protofibrils and fibrils, causing a reduced ThT emission intensity due to decreased binding (Krebs et al. Reference Krebs, Bromley and Donald2005). These findings suggest that this method may not provide a precise determination of the kinetic properties of amyloid fibril formation, not only in the case of aS, in which part of the variability is due to aS, but also for the other amyloidogenic proteins.
Furthermore, the presence of other exogenous compounds, such as molecular chaperones or molecules designed to interfere with aS aggregation, can induce a significant bias in ThT intensity measurements (Hudson et al. Reference Hudson, Ecroyd, Kee and Carver2009), reducing the reliability of this method for the evaluation of aggregation enhancers or inhibitors. Finally, ThT is likely unable to properly bind β-sheets smaller than a fibrillar structure, preventing the detection of aggregation intermediates, which are, according to the latest hypothesis, the most toxic species in vivo (Winner et al. Reference Winner, Jappelli, Maji, Desplats, Boyer, Aigner, Hetzer, Loher, Vilar, Campioni, Tzitzilonis, Soragni, Jessberger, Mira, Consiglio, Pham, Masliah, Gage and Riek2011) (see Section 5.3).
The second most common extrinsic dye used to study amyloid fibrils formation is Congo Red. This dye, when observed through a polarized filter, shows birefringent emission upon binding to amyloid fibrils and has been used in particular to identify amyloids in post-mortem brain tissues. Moreover, the absorbance spectrum of fibril-bound Congo Red shows a red-shift compared with the free form of the dye (Conway et al. Reference Conway, Harper and Lansbury2000). Potential caveats are that Congo Red has been shown to induce oligomerization of native proteins and to bind to partially folded conformations of several proteins, not exclusively to amyloid fibrils (Khurana et al. Reference Khurana, Uversky, Nielsen and Fink2001). For these reasons, Congo Red uses in the study of the kinetic properties of the aS aggregation process or in the detection of amyloid fibrils in vitro has to be approached with care. Up-to-date reviews are available for most of the suitable dyes used to detect amyloid fibrils, and these describe in depth the binding modes and the possible applications of these assays for studying protein aggregation (Groenning, Reference Groenning2010).
However, the potential pitfalls in the use of extrinsic dyes to study the subsequent steps in the aggregation process and the limited reproducibility of data concerning aS fibril formation (Giehm et al. Reference Giehm, Lorenzen and Otzen2011a) propelled the development of alternative methods to evaluate aS oligomerization and fibril formation.
2.2 Monitoring aggregation through the intrinsic properties of aS
2.2.1 Absorbance variation in aggregating aS solution
aS aggregation can be monitored by collecting aliquots from an aS aggregation assay solution at different time points and, after pelleting the fibrils present in the sample, measuring the amount of soluble aS still present. Even if this method does not provide information about the aS aggregation process, i.e., from the early interactions to oligomerization to fibril formation and elongation, it is still useful because it does not require the use of extrinsic dyes or mutations in the aS sequence to monitor the process. Absorbance variation measurements were originally used by Wood et al. (Reference Wood, Wypych, Steavenson, Louis, Citron and Biere1999) to analyse samples in an aggregation assay in which the fibrillization was accelerated by adding fragmented (sonicated) mature fibrils, termed seeds. After demonstrating that aS seeds can function as nuclei, promoting amyloid fibril assembly, the authors defined aS fibril formation as a nucleation-dependent process, in which seeds or early oligomeric intermediates accelerated mature fibril formation. This idea was recently exploited to reproduce cellular models for aS aggregation (see Section 6).
2.2.2 Dynamic light scattering
The kinetic properties of aS aggregation were also studied using dynamic light scattering (DLS), which allows the determination of hydrodynamic radii of macromolecules in solution. In a time-course analysis of aggregation, fibrils were pelleted and supernatants collected and assessed at different time points. DLS showed an increase in the amount of species with larger radii (Dusa et al. Reference Dusa, Kaylor, Edridge, Bodner, Hong and Fink2006) and allowed partial characterization of the intermediate aS oligomers. However, this technique has two main limitations: (i) DLS signal intensity depends on the masses of the objects in solution, so the methods lose their ability to detect small oligomers when larger objects are present in solution, making DLS unsuitable for studying the whole aS aggregation process; and (ii) the radii calculated for each weighted fraction are the results of algorithms that are not standardized and are derived from strong approximations about aggregate shapes.
2.2.3 Intrinsic tryptophan fluorescence
Another method for studying aS oligomerization exploits the intensity variation in the intrinsic tryptophan fluorescence of aS mutants. Given that the aS sequence lacks tryptophans, the fluorescent amino acid was introduced at different positions of the wild type (wt) aS sequence by single-site mutagenesis. This mutagenesis has both an advantage because the position in which the tryptophan is introduced can be freely chosen according to the experimental strategy and a potential disadvantage because it introduces a large and bulky amino acid that is not present in the native sequence of aS and that likely influences aS aggregation properties.
The tryptophan emission maximum is typically at ∼355 nm for unfolded proteins in which the benzimidazole moiety is fully exposed to the solvent. Upon confinement in a more hydrophobic environment, the spectrum displays a blue-shift; this variation can be used to monitor folding or aggregation processes that perturb the local environment of the benzimidazole. Kaylor et al. generated the Y125W/Y133F/Y136F mutant, which shows the kinetic properties of fibrillization similar to those of the wt aS (as evaluated by ThT emission measurements), as well as the similar associated morphology (as evaluated by transmission electron microscopy, TEM) (Kaylor et al. Reference Kaylor, Bodner, Edridge, Yamin, Hong and Fink2005). The Trp emission maximum wavelength was evaluated as a function of time for the pellets, in which the insoluble aggregates were collected. The wavelength value of maximum emission remained 352 nm for the insoluble fibrils, indicating that the Trp125 was still exposed to the solvent. Conversely, a blue-shift, from 356 to 352 nm, was recorded in the supernatants during the latest stages of the aggregation process, suggesting that the larger oligomers present in the solution at longer incubation time have less solvent-exposed tryptophan.
Dusa et al. (Reference Dusa, Kaylor, Edridge, Bodner, Hong and Fink2006) prepared the Y39W mutant, and its tryptophan fluorescence was again measured as a function of aggregation time. This Y39W mutant showed a 2-fold decrease in the fibrillization rate in comparison with the wt aS. Therefore, the insertion of a Trp in the aS sequence has some potential as a structural probe, but it also has a clear drawback in the perturbation that this modification induces, which calls for a careful evaluation of each designed mutant.
2.3 Fluorophores covalently bound to aS monomers
To study the dynamics of aS aggregation by monitoring variations in fluorescent properties, the protein has to be modified. In these paragraphs, we will survey studies in which aS has been covalently bound to specific fluorophores. The binding is usually done through thiol groups by insertion of a cysteine in a specific position in the aS sequence, exploiting the fact that aS does not have any cysteines in its native sequence. In most cases, the cysteine is added at the C-term to limit the effects that both the amino acid and the fluorophore could have on aS aggregation properties. Modification in other regions, i.e., the NAC, could be more informative about aS rearrangements but would also more likely to be invasive because this region is the site of the primary interactions that drive aS fibrillization.
2.3.1 Fluorescence correlation spectroscopy
Fluorescence correlation spectroscopy provides information about the distribution of the diffusion coefficients of fluorescent molecules in a sample. For this reason, it was used to monitor the diffusion coefficients of aS conjugated to a fluorophore at different time points in an aggregation assay. The A140C aS mutant labelled with Alexa Fluor 488 was used by Nath et al. ( Reference Nath, Meuvis, Hendrix, Carl and Engelborghs2010) to investigate the early stages of aS oligomerization. The authors could demonstrate the presence of progressively larger oligomeric species with time: after 7 h of aggregation, they observed a heterogeneous distribution of oligomers with different diffusion coefficients and confirmed the concentration dependence of the early stages of the aggregation process. Although the authors could not characterize any single oligomeric species due to the intrinsic heterogeneity of the sample, it is interesting to note that the FCS technique is sensitive to the early intermediates and that its use for the study of small oligomers is not hampered by the presence of larger aggregates.
2.3.2 Fluorescence polarization
Fluorescence polarization (or anisotropy) measurements are a useful tool to evaluate aS aggregation and can reveal not only larger aggregates or amyloid fibrils but also oligomers.
Preliminary anisotropy measurements on aS fibrils were performed by Dusa et al. (Reference Dusa, Kaylor, Edridge, Bodner, Hong and Fink2006), but fluorescence polarization data concerning the kinetics of the whole aS aggregation process were first reported by Luk et al. (Reference Luk, Hyde, Trojanowski and Lee2007). Fluorescence polarization allows the monitoring of changes in the relative molecular masses of the objects in solution, revealing not only soluble monomers or multimers but also larger aggregates and insoluble fibrils. The main advantages are that fluorescence polarization allows detection of oligomeric species and therefore is the most suitable tool to evaluate the effects of aggregation inhibitors acting at the early stages of aS oligomerization. To perform an fluorescence polarization experiment, a fraction of aS monomers in the aggregation assembly must be conjugated with a fluorophore. For example, Luk et al. (Reference Luk, Hyde, Trojanowski and Lee2007) added a cysteine to the wt aS sequence at position 141 and labelled the protein by reacting succinimidyl-ester forms of the Oregon Green 488 and Alexa Fluor 594 with purified aS cysteine mutant.
2.4 Novel approaches
The approaches mentioned above are well established and provided important information about the aS aggregation process. However, most of these studies manifest some limitations: ThT experiments have limited reproducibility, evaluation of aS fluorescence variations requires modifications of the aS sequence, and most of the studies, for example, the ThT, DLS and absorbance variation experiments, do not allow the characterization of the whole aS aggregation process.
Therefore, investigators embarked on the exploration of alternative techniques to achieve a more thorough characterization of the kinetic properties of aS fibrillization. The favoured approaches are those capable of tackling the early stages of the process, which are the less known stages, and of providing several types of information during the same measurement.
In 2008, a new fluorescence aggregation assay, which provides information on oligomeric species and on amyloid fibrils, was developed (Thirunavukkuarasu et al. Reference Thirunavukkuarasu, Jares-Erijman and Jovin2008). Pyrene-labelled A19C, A90C and A140C aS mutants were monitored in an aggregation assay, and several fluorescence parameters were measured. This assay provides a wide range of information, including the detection of the early stages during aS aggregation process, the decrease of the monomer fraction and the increase of the molecular masses in solution can be easily detected. These parameters are also commonly measured using other probes, but a progressive decrease in the sample's polarity, an increase in the steady-state anisotropy and differences in intramolecular binding can be characterized at the same time, providing a wider set of information concerning the aS aggregation process.
More recently, Yushchenko et al. (Reference Yushchenko, Fauerbach, Thirunavukkuarasu, Jares-Erijman and Jovin2010) introduced a new method that is particularly sensitive to the early intermediates of the aggregation process. They measured excited-state intramolecular proton transfer (ESIPT) in the A140C aS mutant conjugated to a thiol-reactive (maleimide) probe (MFC), based on 2-(2-furyl)-3-hydroxychromone FC (aS-MFC). aS-MFC has two emission bands, the intensities of which were denoted T* and N*; the authors showed that the intensity ratio T*/N* increased upon aggregation and the T* band exhibited a red-shift, meaning that the probe was confined to a less protic and less polar environment. The aggregation reaction can be followed continuously from the early steps of the process using this technique. Moreover, ESIPT measurement of aS-MFC can provide a multiparameter set of data, which is more informative in comparison to other conventional assays.
Variations in the fluorescent properties of a dansyl probe were also used to study the aggregation of aS (Yap et al. Reference Yap, Pfefferkorn and Lee2011). The authors prepared four cysteine mutants (G7C, V26C, L100C and Y136C) on which to place the dansyl moiety in the aS sequence. The dansyl reagent is particularly suitable to study proteins in solution because it is sensitive to the local environment and can act as fluorescence energy transfer acceptor, i.e., it is able to provide a great deal of information by measuring the same fluorescence signal in a single experiment. 1.5% of dansyl-derivatized aS was used to characterize wt aS aggregation kinetic, by monitoring variations in dansyl emission intensity and light scattering. These data suggested that the first steps of oligomerization mainly involve the ends of the protein – the C- and N-term disordered regions.
A very reliable method to study aS aggregation kinetic was recently proposed by Cremades et al. (Cremades et al. Reference Cremades, Cohen, Deas, Abramov, Chen, Orte, Sandal, Clarke, Dunne, Aprile, Bertoncini, Wood, Knowles, Dobson and Klenerman2012). They used single-molecule two-colour coincidence detection (TCCD) and Forster resonance energy transfer (FRET) experiments to estimate the change in oligomer fraction during the aS aggregation process. aS was conjugated to two different fluorophores (Alexa Fluor 488 and 633) and a time series TCCD analysis was performed on different aliquots taken from the aggregation mix. The presence of oligomers was detected in correspondence of fluorescence emission bursts for both colours. Characterization of different oligomeric species belonging to different aggregation pathways was performed over time, leading to the identification of four lag phases and oligomerization rates for these species, before conversion into fibrillar species. This method, first demonstrated in 2006 by the same group (Orte et al. Reference Orte, Birkett, Clarke, Devlin, Dobson and Klenerman2008), is sensitive and able to detect oligomeric aggregation intermediates during the aggregation process, although it requires an experimental apparatus specifically designed for the collection of this type of data.
It was recently shown that aS oligomers and aggregates develop an intrinsic fluorescence emission that can be used in a quantitative assay to monitor amyloid fibril growth (Pinotsi et al. Reference Pinotsi, Buell, Dobson, Kaminski Schierle and Kaminski2013). The major advantage of this method is that it is label-free: monitoring the variations in the intrinsic emission allows the study of the kinetics of aggregation without the introduction of extrinsic dyes that can interfere with the process. The authors of the paper report that the effects of lacmoid on aS fibrillization were properly revealed by measuring the intrinsic fluorescence emission, whereas the measurement of ThT fluorescence led to the incorrect conclusion that lacmoid can hinder the aggregation process because lacmoid interacts with ThT and alters its fluorescence properties. Interestingly, this method could be extended to the characterization of other amyloidogenic proteins.
These different and novel methods could seem less approachable compared with the traditional ones, but they provide more refined information about the process studied. However, these methods do suffer from the drawback that few of the required experimental setups exist, hindering robust replication by multiple-independent laboratories.
2.5 Aggregation inhibitors and enhancers
Early on, aS fibrillization has been suggested as a possible drug target to slow or stop neurodegeneration, and it has been shown to be strongly affected by various factors and molecules that can either enhance or inhibit the process.
The fibril elongation rate was shown to be directly proportional to protein concentration (Wood et al. Reference Wood, Wypych, Steavenson, Louis, Citron and Biere1999), which may explain the pathogenicity associated with SNCA gene multiplication (Singleton et al. Reference Singleton, Farrer, Johnson, Singleton, Hague, Kachergus, Hulihan, Peuralinna, Dutra, Nussbaum, Lincoln, Crawley, Hanson, Maraganore, Adler, Cookson, Muenter, Baptista, Miller, Blancato, Hardy and Gwinn-Hardy2003) that leads to an increased dosage of aS.
The kinetic parameters of fibrillization for the pathological mutants were compared with those of the wt: A53T showed an increased rate of aggregation and a shorter lag phase, whereas A30P displayed a longer lag phase and a slower growth rate, leading to a delay in the midpoint of the fibrillization transition (Li et al. Reference Li, Uversky and Fink2001). In addition, the third mutant E46K, discovered after A30P and A53T, showed an increased fibrillization rate, similar to A53T (Fredenburg et al. Reference Fredenburg, Rospigliosi, Meray, Kessler, Lashuel, Eliezer and Lansbury2007), with a lag phase twice as long (∼8 h) compared with the wt one. Published data concerning the most recently discovered aS pathological mutants are not yet available, but the emerging picture implies that the aS mutants, more than the aggregation process per se, are the culprits in neurodegeneration.
Covalent chemical modifications of aS, such as nitration, oxidation (associated with an inflammatory response) and phosphorylation, lead to variations in both the rates and the final products of the aggregation process. Methionine oxidation reduces aS aggregation propensity in vitro: the presence of a 4-fold molar excess of oxidized protein (Uversky et al. Reference Uversky, Yamin, Souillac, Goers, Glaser and Fink2002) completely inhibits fibril formation. It has also been shown that the presence of a sub-stoichiometric concentration of nitrated aS in the aggregation assembly interferes with the fibrillization process (Yamin et al. Reference Yamin, Uversky and Fink2003). However, aS with tyrosine nitration has been detected in LB, suggesting that interfering with aggregation leads to the sequestration of the nitrated aS into the aggregates (Duda et al. Reference Duda, Giasson, Chen, Gur, Hurtig, Stern, Gollomp, Ischiropoulos, Lee and Trojanowski2000; Giasson et al. Reference Giasson, Duda, Murray, Chen, Souza, Hurtig, Ischiropoulos, Trojanowski and Lee2000).
In addition, the fraction of aS phosphorylated in position 87 (pSer87) and 129 (pSer129) is enhanced in LBs and in the brains of patients affected by synucleinopathies (Fujiwara et al. Reference Fujiwara, Hasegawa, Dohmae, Kawashima, Masliah, Goldberg, Shen, Takio and Iwatsubo2002; Paleologou et al. Reference Paleologou, Oueslati, Shakked, Rospigliosi, Kim, Lamberto, Fernandez, Schmid, Chegini, Gai, Chiappe, Moniatte, Schneider, Aebischer, Eliezer, Zweckstetter, Masliah and Lashuel2010). Of relevance to aggregation, it has been shown that pSer87, generated in vitro by casein kinase 1 (CK1) phosphorylation, inhibits aS fibrillization (Paleologou et al. Reference Paleologou, Oueslati, Shakked, Rospigliosi, Kim, Lamberto, Fernandez, Schmid, Chegini, Gai, Chiappe, Moniatte, Schneider, Aebischer, Eliezer, Zweckstetter, Masliah and Lashuel2010); similarly, Paleologou et al. demonstrated that CK1-mediated phosphorylation of aS hampers aS aggregation (Paleologou et al. Reference Paleologou, Schmid, Rospigliosi, Kim, Lamberto, Fredenburg, Lansbury, Fernandez, Eliezer, Zweckstetter and Lashuel2008), whreas Fujiwara et al. (Reference Fujiwara, Hasegawa, Dohmae, Kawashima, Masliah, Goldberg, Shen, Takio and Iwatsubo2002) reported that pSer129 aS, phosphorylated using casein kinase 2 (CK2), shows an increased fibrillization propensity. It is noteworthy that Ser129 is not in the core of aS fibrils and can also be phosphorylated after fibrillization in a physiological environment (Paleologou et al. Reference Paleologou, Schmid, Rospigliosi, Kim, Lamberto, Fredenburg, Lansbury, Fernandez, Eliezer, Zweckstetter and Lashuel2008). Interestingly, aS is phosphorylated at Ser129 not only by casein kinases but also by Polo-like kinase 1, 2 and 3, both in vitro and in vivo, with different phosphorylation efficiencies (Mbefo et al. Reference Mbefo, Paleologou, Boucharaba, Oueslati, Schell, Fournier, Olschewski, Yin, Zweckstetter, Masliah, Kahle, Hirling and Lashuel2010). However, the relationship between phosphorylation and aggregation is still an open question and needs clarification.
Divalent and trivalent metal ions (for example, Al3+, Cu2+, Fe3+ or Pb2+) have been shown to strongly accelerate the aS aggregation rate in vitro, although their relevance to the process in vivo remains to be proven (Bisaglia et al. Reference Bisaglia, Tessari, Mammi and Bubacco2009). Similarly, polyanions (Cohlberg et al. Reference Cohlberg, Li, Uversky and Fink2002; Liu et al. Reference Liu, Uversky, Munishkina, Fink, Halfter and Cole2005) or polycationic species (Goers et al. Reference Goers, Uversky and Fink2003) accelerate the aS aggregation rate in vitro. The effect of these compounds depends on their concentration and, in the case of polymers, also on their length, and suggests a critical role for electrostatic interactions in modifications of the aggregation rate. It has been proposed that the masking of negative charges at the C-term could lead to the collapse of aS to a more amyloidogenic conformation.
Other molecules, such as catechins or chaperones (Bieschke et al. Reference Bieschke, Russ, Friedrich, Ehrnhoefer, Wobst, Neugebauer and Wanker2010; Dedmon et al. Reference Dedmon, Christodoulou, Wilson and Dobson2005a), or properly designed peptides (El-Agnaf et al. Reference El-Agnaf, Paleologou, Greer, Abogrein, King, Salem, Fullwood, Benson, Hewitt, Ford, Martin, Harriott, Cookson and Allsop2004; Sievers et al. Reference Sievers, Karanicolas, Chang, Zhao, Jiang, Zirafi, Stevens, Munch, Baker and Eisenberg2011), can slow or inhibit aS aggregation by direct interaction with the monomer or with other aggregation intermediates.
2.6 Kinetic models
From the plethora of data available in the literature on the time dependence of aS (but also of other amyloid proteins) fibrillization in vitro, investigators attempted to develop kinetic models to describe and predict aS aggregation behaviour.
The proposed models are based on different types of assumptions and mathematical analysis (for an exhaustive review and the details of the mathematical treatments, see Morris et al. Reference Morris, Watzky and Finke2009), but none of them, to our knowledge, emerge as more significant than the others. This result is most likely due to variability in the data, which depend on the chosen experimental conditions, as well as to the complexity of the described process and the consequent complexity of the proposed models. Furthermore, the real test that could validate a kinetic model is its application to the data on aS aggregation in a cellular environment, a possibility that is hindered by the sparse experimental data on the process in live cells (see Section 6).
Each kinetic model provides a fitting of the data based on different assumptions about the mechanism that leads to oligomer and fibril formation in vitro, but the limiting step remains the intrinsically low reproducibility of aS aggregation kinetic data. In the sigmoid curve, the slope at t50 and the length of the lag phase change significantly (lag phase length varies by two orders of magnitude) by varying the incubation conditions (Pronchik et al. Reference Pronchik, He, Giurleo and Talaga2010). In particular, agitation (Pronchik et al. Reference Pronchik, He, Giurleo and Talaga2010) and shear forces due to mechanical influences, such as centrifugation (Bhak et al. Reference Bhak, Lee, Hahn and Paik2009), have been identified as the most relevant parameters in the intrinsic variability that affect the aggregation process. Pronchik et al. performed aggregation experiments to determine a direct correlation between shaking rate and fibrillization rate. In the literature, three hypotheses have been proposed: (i) a faster fibrillization rate upon faster shaking is due to an increased rate of fibril fragmentation and the consequent generation of more active nucleation sites; (ii) vigorous mixing eliminates local concentration gradients and promotes fibril elongation, but is limited by the mass transfer rate; and (iii) in the presence of hydrophobic–hydrophilic interfaces, aS behaves as a surfactant, i.e., it concentrates, attempting to minimize the exposure of its hydrophobic residues to water solution by clustering, and acquires an aggregation-prone conformation. By aggregating aS under gentle agitation and mixing with beads at different concentrations and with different surface hydrophobicity, the authors observed that only the hydrophobic–hydrophilic interface hypothesis is consistent with their results: they showed how the concentration (the actual active surface area per aS molecule) and the type (polytetrafluorethylene, polymethylmethacrylate and glass) of interface directly correlate with aggregation rates. Based on their results, they propose that the irreproducibility often observed in aS kinetic data is due to the variability in heterogeneous air–water interfaces during agitation. Moreover, they suggested that aS partitioning at these interfaces causes an increase in local protein concentration and drives the equilibrium towards conformations that could more easily prompt amyloidogenesis.
Relatively high concentrations (more than 1 mg/ml ∼ 70 μM) and/or the presence of aS seeds can further enhance reproducibility (Giehm & Otzen, Reference Giehm and Otzen2010; Giehm et al. Reference Giehm, Lorenzen and Otzen2011a), but these parameters can act only from the second or third stage of the process (Fig. 2), when oligomers (or seeds) form and fibrils are growing in length. However, the main source of variability remains the first step of the aggregation when aS undergoes conformational rearrangements whose probability seems to be extremely low. For this reason, we suggest that the reproducibility issue cannot be completely overcome at this point, partially because of technical limits but also because of the intrinsic properties of aS.
Two recent papers explore the possibility of accelerating the aS fibrillization process by preparing chimaeric aS dimers (Pivato et al. Reference Pivato, De Franceschi, Tosatto, Frare, Kumar, Aioanei, Brucale, Tessari, Bisaglia, Samori, De Laureto and Bubacco2012) or by inducing dimerization in a mutated aS through an inducible dimerizing domain (Roostaee et al. Reference Roostaee, Beaudoin, Staskevicius and Roucou2013). In this second case, the induction of dimerization between the C-term of two aS molecules led to an increase in the aggregation rate compared with the wt aS.
In Pivato et al. the comparison between different aS dimers is reported: aS cys mutants were designed to form aS dimers bound through disulphide bonds between the two N- or C-termini (respectively, NN or CC dimers). Moreover, a tandem dimer, consisting of two aS molecules (NC dimer), and a double-core dimer, consisting of two NAC regions (DC dimer), were designed. Interestingly, CC and DC dimers showed faster aggregation kinetics when studied by ThT compared wyth the wt, whereas NN and NC dimers exhibited a negligible increase in ThT fluorescence intensity over time, indicating slower aggregation. These latest results suggest that it is not only the increase in the local concentration of aS molecules due to dimerization but also the chosen constraints in terms of the relative orientation of aS molecules in these dimers that strongly affect the kinetics of the aggregation process.
A final comment on the kinetics of aS aggregation is on the stirring issue: most of the literature regarding aS aggregation in vitro describes experiments performed while shaking. This consideration led to a question on the relevance of stirring for the aggregation process in cells and in PD models more generally. In our opinion, stirring should be seen as an efficient accelerator of the aggregation process and a price to pay to reduce the aggregation time frame to values experimentally approachable. It remains clear that from a physiological point of view, stirring has no relevance, but stirring in vitro allows experiments to fast forward through the years that aS seems to require to aggregate in parkinsonian brains.
3. Monomeric aS conformations
aS, because of its lack of a defined secondary structure when purified from recombinant overexpression systems, has been considered an intrinsically disordered protein (Weinreb et al. Reference Weinreb, Zhen, Poon, Conway and Lansbury1996). In a quite recent and disputed paper (Bartels et al. Reference Bartels, Choi and Selkoe2011), aS was described as an α-helical homo-tetramer when purified from mammalian cells overexpressing aS or from human red blood cells. However, these results could not be replicated by other groups (Fauvet et al. Reference Fauvet, Mbefo, Fares, Desobry, Michael, Ardah, Tsika, Coune, Prudent, Lion, Eliezer, Moore, Schneider, Aebischer, El-Agnaf, Masliah and Lashuel2012b), who found aS as an unfolded monomer in erythrocytes, mammalian cell lines and Escherichia coli. Interestingly, aS with a modification of ten amino acids added at the N-term showed an α-helical tetrameric conformation when purified from E. coli and studied by nuclear magnetic resonance (NMR) (Wang et al. Reference Wang, Perovic, Chittuluru, Kaganovich, Nguyen, Liao, Auclair, Johnson, Landeru, Simorellis, Ju, Cookson, Asturias, Agar, Webb, Kang, Ringe, Petsko, Pochapsky and Hoang2011). Nonetheless, Gurry et al. showed that the very same modified aS in solution was present as a monomer and, in a small fraction, as trimers and tetramers presenting either a β-strand or an α-helical secondary structure (Gurry et al. Reference Gurry, Ullman, Fisher, Perovic, Pochapsky and Stultz2013). Conversely, Binolfi et al. reported that aS directly studied within E. coli with a method that does not require cell lysis or protein purification showed an NMR signal typical of monomeric and disordered proteins (Binolfi et al. Reference Binolfi, Theillet and Selenko2012). An alternative scenario proposed by Trexler & Rhoades (Reference Trexler and Rhoades2012), is that N-terminal acetylation of aS in combination with a mild purification from bacteria results in an α-helical oligomeric aS form. However, other groups studied structural effects of acetylation on aS by NMR and reported that aS acetylation, which was shown to be an abundant modification in human brains (Anderson et al. Reference Anderson, Walker, Goldstein, De Laat, Banducci, Caccavello, Barbour, Huang, Kling, Lee, Diep, Keim, Shen, Chataway, Schlossmacher, Seubert, Schenk, Sinha, Gai and Chilcote2006), was only associated to a transient variation in N-term aS α-helical propensity and did not lead to the formation of stable tetramers (Fauvet et al. Reference Fauvet, Fares, Samuel, Dikiy, Tandon, Eliezer and Lashuel2012a; Kang et al. Reference Kang, Moriarty, Woods, Ashcroft, Radford and Baum2012). These contradictory results keep the issue open: the majority of data points to monomeric aS as the physiologically relevant species, whereas only a few reports suggest the presence of functional aS tetramers. It goes without saying that more work is required to resolve the controversy.
The first stage of aS fibrillization is believed to be the formation of a transient form of monomeric aS that is prone to aggregation. This step is a very rare event crucial for the initiation of oligomerization, and it has been studied using three strategies: (i) ensemble solution techniques, such as NMR, fluorescence measurements and molecular dynamics (MD) simulations; (ii) single-molecule force spectroscopy experiments, which are useful for studying protein folding and unfolding at the single-molecule level and have been used to characterize the conformational changes aS undergoes before aggregation begins; and (iii) fluorescence microscopy, which was used to study perturbations in aS conformations induced by cellular membrane interfaces, showing that in the presence of lipids, the propensity of aS to aggregate is modified.
3.1 Monomeric aS structural analysis
3.1.1 Paramagnetic relaxation enhancement-NMR measurements and molecular dynamics (MD) simulation
The intrinsic heterogeneity of the aS ensemble is challenging for the investigators using NMR spectroscopy and MD simulation with regard to obtaining a high-resolution characterization of aS disordered states. The information thus obtained can only be associated with the average properties of the ensemble and not with single aS molecule conformations. Using a spin-label covalently bound to the protein through a cysteine strategically placed in its amino acid sequence, investigators acquired 1H–15N correlation (HSQC) spectra of the protein. The combination of HSQC and paramagnetic resonance enhancement allowed the identification of long-range interactions between the central part of aS and the C-term, suggesting that the native aS ensemble consists of heterogeneous structures. Matching constraints obtained by the data analysis and MD simulations, the authors found that the distribution of aS monomers in solution is composed of conformers with various gyration radii and is considerably different from the distribution expected for a fully random coil protein (Allison et al. Reference Allison, Varnai, Dobson and Vendruscolo2009; Bertoncini et al. Reference Bertoncini, Jung, Fernandez, Hoyer, Griesinger, Jovin and Zweckstetter2005; Dedmon et al. Reference Dedmon, Lindorff-Larsen, Christodoulou, Vendruscolo and Dobson2005b). Using the same techniques, other research groups investigated monomeric aS transient interactions, folding and rigidity, by considering the effect of acidic pH, which is an experimental condition that promotes aS aggregation by decreasing its negative charge. These experiments allowed the identification of aS conformations that could be prone to aggregation in vitro but went undetected at physiological pH values (Cho et al. Reference Cho, Nodet, Kim, Jensen, Bernado, Fernandez, Becker, Blackledge and Zweckstetter2009; McClendon et al. Reference Mcclendon, Rospigliosi and Eliezer2009; Wu & Baum, Reference Wu and Baum2010). Another method that allows us to explore the thermodynamics of the system by perturbing the aS conformation distributions, is to work at supercooled temperature. Using this setup, Wu et al. (Reference Wu, Weinstock, Narayanan, Levy and Baum2009) measured aS ensembles that are less averaged by NMR relaxation and provided information on aS conformations. It should be mentioned that in the context of an extremely slow process, such as aS aggregation, in which a very small fraction of the molecules present is likely to be able to drive the process, ensemble solution techniques may fail to identify the relevant species. Pushing the experimental conditions far from what can be physiologically expect may lead to the identification of otherwise undetectable forms that could be relevant but must be considered with caution.
3.1.2 Single-molecule force spectroscopy experiments
NMR experiments and MD simulation can only provide ensemble-averaged information on aS monomer structures. Conversely, single-molecule force spectroscopy methods based on atomic force microscopy (AFM)-driven mechanical unfolding permits the characterization of aS conformational variants at the individual molecule level. Sandal et al. first proved the polymorphic nature of aS in solution by measuring its behaviour in response to a mechanical unfolding force (Sandal et al. Reference Sandal, Valle, Tessari, Mammi, Bergantino, Musiani, Brucale, Bubacco and Samori2008). Later on, the same group (Brucale et al. Reference Brucale, Sandal, Di Maio, Rampioni, Tessari, Tosatto, Bisaglia, Bubacco and Samori2009), as well as others more recently (Hervas et al. Reference Hervas, Oroz, Galera-Prat, Goni, Valbuena, Vera, Gomez-Sicilia, Losada-Urzaiz, Uversky, Menendez, Laurents, Bruix and Carrion-Vazquez2012), further characterized the aS conformation ensemble using force spectroscopy and the different conformations that could be ascribed to aS pathological mutants. The identification of stable conformers that precede aS oligomerization may be important because they could be targets for a possible therapeutic intervention.
3.1.3 Fluorescence measurements on aggregation prone monomeric aS conformers
A fluorescence technique that was used to study conformational changes in aS monomers is single-molecule Forster resonance energy transfer (smFRET) (Trexler & Rhoades, Reference Trexler and Rhoades2010). This method allows determination of the distances between two fluorophore-labelled amino acids by measuring FRET between donor and acceptor. Trexler et al. using different labelling sites, were able to characterize the heterogeneous and dynamic state of aS in solution at different pH and in the presence of charged molecules, i.e., in conditions that promote aS aggregation. The authors showed that at low pH, a collapse of the C-term onto the NAC region occurs, while the N-term and the central part of the protein are less affected. The construct labelled at the two ends of the protein, i.e., in positions 9 and 130, presented the same type of structural collapse observed at pH 3.0 and at pH 7.4, showing the C- and N-terms in close proximity. These data suggest that aS in solution undergoes substantial conformational variations. However, it is still unclear if these conformational rearrangements are responsible for the first interactions leading to protein oligomerization. Another possibility is that the proximity of the C- and N-terms can protect the NAC region from those interactions that lead to aS aggregation.
Yap et al. (Reference Yap, Pfefferkorn and Lee2011), measuring dansyl-conjugated aS cysteine mutants, further confirmed that aS aggregation requires both C- and N-term rearrangements. In particular, conformational modifications that involve both residues 7 and 136, in the unstructured C- and N-term regions, respectively, occur early in the aggregation process before aS fibril formation. Conversely, changes at residues 26 and 100, closer to the fibrillar core, occur later in association with fibril formation.
Taken together, these NMR, MD, smFRET and single molecule force spectroscopy data on aS molecules suggest that the unfolded state of aS in solution in vitro consists of an ensemble of different, transient and dynamic conformations, some of which can be, in specific conditions (low pH, higher temperature, different ionic strength), prone to establish transient or stable bonds within the same aS monomer and/or with other aS molecules in vitro, driving the first steps of protein oligomerization. The tested conditions could mimic the environmental changes that occur in neurons and that lead to protein conformational modification and aggregation.
3.2 aS conformation and aggregation on membranes
Recently, a new aspect has been proposed to be relevant in the aggregation process: the accumulation of aS on membrane surfaces. When monomeric aS interacts with vesicles or membranes, the N-term of the protein acquires an α-helical conformation that can be a bent helix, an extended helix or an antiparallel helix-turn-helix structure, depending on the membrane properties. Conversely, the C-term, as amply demonstrated, remains unstructured (Borbat et al. Reference Borbat, Ramlall, Freed and Eliezer2006; Bussell et al. Reference Bussell, Ramlall and Eliezer2005; Davidson et al. Reference Davidson, Jonas, Clayton and George1998; Ferreon et al. Reference Ferreon, Gambin, Lemke and Deniz2009; Georgieva et al. Reference Georgieva, Ramlall, Borbat, Freed and Eliezer2010; Jao et al. Reference Jao, Hegde, Chen, Haworth and Langen2008; Middleton & Rhoades, Reference Middleton and Rhoades2010; Trexler & Rhoades, Reference Trexler and Rhoades2009; Ulmer et al. Reference Ulmer, Bax, Cole and Nussbaum2005). For amyloidogenic proteins, but not for aS, a direct conversion was observed between the α-helical conformation that most of the proteins acquire upon membranes binding (Butterfield & Lashuel, Reference Butterfield and Lashuel2010) and the β-sheet structures typical of amyloid oligomers and fibrils. Furthermore, an increase in fibril formation was observed when aS was aggregated in the presence of brain-derived membranes (Lee et al. Reference Lee, Choi and Lee2002) and anionic detergents or fatty acids micelles (Necula et al. Reference Necula, Chirita and Kuret2003), suggesting that membranes also play an important role in aS aggregation. Interestingly, it has been proposed that the binding of aS to the membrane increases the local concentration, favouring the triggering of the aggregation process (Auluck et al. Reference Auluck, Caraveo and Lindquist2010).
Reynolds et al. (Reference Reynolds, Soragni, Rabe, Verdes, Liverani, Handschin, Riek and Seeger2011) showed by supercritical angle fluorescence microscopy (SAF) that aS in a sub-physiological concentration in solution tends to aggregate in the presence of negatively charged supported lipid bilayers. FRET images of donor-labelled (Dy647-N-hydroxysuccinimide) supported lipid bilayers and acceptor-labelled (Cy7-monofunctional NHS ester dye molecules) aS were performed by SAF microscopy, with the total protein–lipid ratio going from 1:21.6 (200 nM) to 1:1.44 (3 μM). Most of the protein remains in solution, and initially, the interaction between aS and the lipids led to the switch of the protein to the α-helical conformation previously mentioned. Later on, a structural rearrangement occurs, leading to the formation of aggregates on the lipid bilayer of a smaller part of the aS molecules, while the majority of the protein is still in solution. The aggregates were also observed by cryo scanning electron microscopy, showing a size varying from a few micrometres to tens of micrometres and displaying a morphology typical of amyloid fibrils. It seems that the ability of aS to fulfil its physiological function(s) at the membranes depends on the protein–lipid ratio and on the type of lipids. It could be that under pathological conditions, aS binding to the membrane is no longer protective and leads to aS aggregation on the membranes, which can damage membranes through different possible mechanisms. The aS aggregation described here is time and concentration dependent: at nM concentration, aS aggregates led to membrane damage, destabilization, thinning and, more unexpectedly, lipid extraction from the membrane, while at μM concentration, disruption of the bilayer occurred. A solid-state NMR (ss-NMR) study on aS aggregation in the presence or absence of anionic phospholipids showed that fibrils are formed in both cases, but when lipids are present, the fibril structure exhibits major structural perturbations at the N-term (Comellas et al. Reference Comellas, Lemkau, Zhou, George and Rienstra2012). Therefore, the authors proposed a model for aS aggregation in the two different cases, accounting for the revealed structural differences.
The increase in the local concentration of aS at the membranes can induce not only increased aggregation but can also trigger membrane permeabilization induced by monomeric aS that assembles into oligomers at the membranes upon the application of a voltage (Tosatto et al. Reference Tosatto, Andrighetti, Plotegher, Antonini, Tessari, Ricci, Bubacco and Dalla Serra2012). These oligomers are ordered and show a recursive structure similar to the pores formed by some bacterial toxins. The relationship between these objects and the previously mentioned aggregates formed at the membranes and observed by other groups remains unclear.
4. aS oligomeric species
As previously mentioned, aS oligomeric species are heterogeneous, transient and poorly defined. In the last 10 years, their relevance in the molecular studies on synucleinopathies has grown consistently. Since 2001, several studies have proposed oligomer toxicity, especially for their annular structures, similar to the pore-forming toxins, and their purported ability to interact with lipid membranes. In 2004, Pountney et al. (Reference Pountney, Lowe, Quilty, Vickers, Voelcker and Gai2004) were able to purify aS annular oligomers from inclusions in patients affected by MSA. More recently, the E57K aS mutant, the only one able to form oligomeric species that do not convert into amyloid fibrils, was used to study oligomer toxicity in an in vivo mice model (Winner et al. Reference Winner, Jappelli, Maji, Desplats, Boyer, Aigner, Hetzer, Loher, Vilar, Campioni, Tzitzilonis, Soragni, Jessberger, Mira, Consiglio, Pham, Masliah, Gage and Riek2011).
In an early work, Conway et al. (Reference Conway, Harper and Lansbury2000) observed that both A30P and A53T mutants shared a faster oligomerization rate in vitro but not a faster fibrillization, suggesting that a faster fibrillization rate is not directly linked to a higher cytotoxicity in PD. Even the E46K mutant, which also showed an increased aggregation rate with respect to wt, can form soluble, non-fibrillar species with sizes and chemical properties similar to wt soluble annular protofibrils (Fredenburg et al. Reference Fredenburg, Rospigliosi, Meray, Kessler, Lashuel, Eliezer and Lansbury2007).
Based on these observations and on the fact that aS oligomers are still poorly understood despite their importance, a major goal of current research on aS aggregation from the perspectives of both basic science and new therapeutic strategies is their biophysical characterization. The latter is germane to defining the toxicity mechanism(s) of oligomers. A detailed molecular understanding of aS pathological forms can open a new avenue to the design of specific drugs tailored against these toxic conformations.
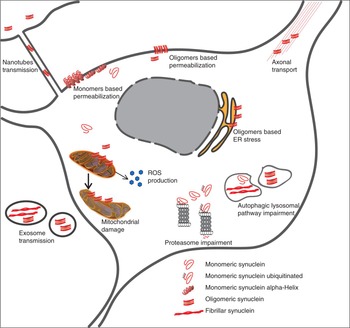
Two roles were mainly ascribed to aS oligomers, although other toxic mechanisms have been recently suggested (Section 6.2): (i) membrane permeabilization through a mechanism typical of pore-forming toxins; and (ii) PD spreading through a mechanism similar to prion protein (Polymenidou & Cleveland, Reference Polymenidou and Cleveland2012), where misfolded aS passes from one cell to another, triggering aggregation and subsequent toxic events. To our understanding, there are some main issues to be noted: first, objects spreading from cell to cell should be stable; second, the spreading, as will be discussed in detail later, may occur through different pathways; third, it remains to be determined if the transferred objects themselves become toxic for the recipient cells or if they work as a template to seed a new aggregation process whose products are responsible for the induced toxicity.
The occurrence of aS-mediated membrane permeabilization is supported by in vitro and cellular experiments: some oligomeric species obtained from recombinant aS showed a pore-like structure when observed using microscopy techniques (Fredenburg et al. Reference Fredenburg, Rospigliosi, Meray, Kessler, Lashuel, Eliezer and Lansbury2007; Lashuel et al. Reference Lashuel, Petre, Wall, Simon, Nowak, Walz and Lansbury2002; Quist et al. Reference Quist, Doudevski, Lin, Azimova, Ng, Frangione, Kagan, Ghiso and Lal2005; Winner et al. Reference Winner, Jappelli, Maji, Desplats, Boyer, Aigner, Hetzer, Loher, Vilar, Campioni, Tzitzilonis, Soragni, Jessberger, Mira, Consiglio, Pham, Masliah, Gage and Riek2011), and they exhibited a clear electrophysiological activity on vesicles (Fredenburg et al. Reference Fredenburg, Rospigliosi, Meray, Kessler, Lashuel, Eliezer and Lansbury2007; Volles & Lansbury, Reference Volles and Lansbury2002) and membrane models (Kim et al. Reference Kim, Cho, Kumar, Maier, Siebenhaar, Becker, Fernandez, Lashuel, Benz, Lange and Zweckstetter2009; Schmidt et al. Reference Schmidt, Levin, Kamp, Kretzschmar, Giese and Botzel2012; van Rooijen et al. Reference Van Rooijen, Claessens and Subramaniam2010), similar to the one expected for pore-forming toxins (Lashuel & Lansbury, Reference Lashuel and Lansbury2006).
The cell-to-cell spreading process of aS was highlighted by clinical data that showed the presence of LBs in grafted neurons in individuals affected by PD who died 10 years after surgery (Kordower et al. Reference Kordower, Chu, Hauser, Freeman and Olanow2008; Li et al. Reference Li, Englund, Holton, Soulet, Hagell, Lees, Lashley, Quinn, Rehncrona, Bjorklund, Widner, Revesz, Lindvall and Brundin2008). This observation strongly supports a cell-to-cell propagation mechanism to explain the spread of aS pathology in these brains. Based on numerous post-mortem analyses, in 2003 Braak formulated a staging classification of PD wherein LBs first appear in the olfactory bulb and only at later stages are found in the midbrain and neocortex (Braak et al. Reference Braak, Del Tredici, Rub, De Vos, Jansen Steur and Braak2003), suggesting a progressive involvement of different brain regions, possibly due to the passage of aggregated aS. In support of this evidence, PD cellular models for aS aggregation have largely been used to study the mechanism of aS spread: in particular, it has been shown that either oligomeric species or seeds obtained from recombinant aS can be up-taken by healthy recipient cells in PD cellular models, in primary neurons cultures and in mice models. These aS species are able to trigger the aggregation process (Danzer et al. Reference Danzer, Krebs, Wolff, Birk and Hengerer2009; Desplats et al. Reference Desplats, Lee, Bae, Patrick, Rockenstein, Crews, Spencer, Masliah and Lee2009; Hansen et al. Reference Hansen, Angot, Bergstrom, Steiner, Pieri, Paul, Outeiro, Melki, Kallunki, Fog, Li and Brundin2011; Luk et al. Reference Luk, Song, O'Brien, Stieber, Branch, Brunden, Trojanowski and Lee2009, Reference Luk, Kehm, Carroll, Zhang, O'BRIEN, Trojanowski and Lee2012; Nonaka et al. Reference Nonaka, Watanabe, Iwatsubo and Hasegawa2010; Volpicelli-Daley et al. Reference Volpicelli-Daley, Luk, Patel, Tanik, Riddle, Stieber, Meaney, Trojanowski and Lee2011).
In view of these facts, the study of oligomeric aS aggregation intermediates in relationship to their putative pathogenic effects in synucleinopathies becomes particularly relevant; however, this study presents some considerable challenges. As previously mentioned, aS oligomeric species are heterogeneous and difficult to define, which becomes an issue when trying to study aS oligomer characteristics in relation to their noxious effects. We propose a minimal but sound definition for aS oligomers as ‘objects consisting of several aS monomers that exhibit newly acquired functional properties in the cell’, which, unfortunately, remains inadequately vague.
The first problem encountered when approaching the study of aS oligomers is the fact that their structural, morphological and functional properties are extremely sensitive to the experimental conditions under which they are formed (i.e., temperature, pH, buffer), to the presence of reactive molecules, to the presence of other proteins during the aggregation process, and to physical or chemical treatments (as reported in Section 3.1, 3.2 and 3.3). The second problem is that some of the oligomers, mainly obtained in vitro using recombinant aS, lack a robust validation in vivo. From the pathological point of view, it is clear that different oligomeric species acquire importance only when there is evidence of both their presence and functional impact in PD cell or animal models or in post-mortem brain tissue and, consequentially, when they can be linked to the pathology.
Despite their evident relevance, aS oligomeric species often form transient species that are difficult to prepare, isolate and analyse (Giehm et al. Reference Giehm, Svergun, Otzen and Vestergaard2011b; Kim et al. Reference Kim, Cho, Riedel, Fernandez and Zweckstetter2008; Lashuel et al. Reference Lashuel, Petre, Wall, Simon, Nowak, Walz and Lansbury2002). Moreover, in some instances, they may be in equilibrium with aS monomers, which again depends on experimental conditions, and may decrease their molar fraction when, for example, an isolation method such as gel filtration (GF) is used (Bhak et al. Reference Bhak, Lee, Hahn and Paik2009). This latter consideration could explain the differences in the estimated amount of oligomeric species observed when aS aggregated in solution was analysed by GF (Lashuel et al. Reference Lashuel, Petre, Wall, Simon, Nowak, Walz and Lansbury2002) or by small angle X-ray scattering (SAXS) (Giehm et al. Reference Giehm, Svergun, Otzen and Vestergaard2011b). Lashuel et al. showed that a type of soluble aS oligomeric species, termed protofibrils, could be obtained by simply incubating aS wt, A30P and A53T on ice. The protofibril fraction that can be separated by GF was always <15% of the total protein in solution. The estimated apparent molecular mass of the oligomeric species is 600 kDa on average, corresponding to more than 42 aS molecules. In the same sample, Lashuel et al. could observe annular and/or tubular oligomers by EM that, in their speculation, consisted of 20–24 aS monomers. A similar result was obtained by an independent technique more recently. Single-molecule photobleaching was used by Zijlstra et al. (Reference Zijlstra, Blum, Segers-Nolten, Claessens and Subramaniam2012) to determine the average number of monomers in aS oligomeric species. The A140C aS mutant was labelled with Alexa Fluor 488, and wt aS was incubated together with different percentages of labelled protein at a concentration of 1 mM for 18 h at room temperature with mixing at 1250 rpm. aS oligomers were purified by GF, and through analysis of the number of bleaching steps, the authors were able to quantify the average number of aS monomers that constituted the purified oligomers, i.e., between 25 and 32, depending on the labelling densities.
Conway et al. (Reference Conway, Harper and Lansbury2000) generated oligomeric intermediates by incubating aS in solution at 37°C without agitation, isolated oligomers with a molecular weight higher than 600 kDa, as determined by GF, and analysed them using AFM. These oligomers showed a spherical shape and heights varying between 2 and 6 nm. Upon incubation for 72 h at 4°C, the spherical oligomers formed larger circular or elliptical ring-like structures, with diameters between 35 and 55 nm for the circular rings and with widths between 35 and 55 nm and lengths between 65 and 130 nm for the elliptical rings.
Giehm et al. performed aggregation of aS by shaking at 37°C in the presence of glass microspheres to increase reproducibility and, using SAXS, found that 30–40% of the protein formed oligomeric species (SAXS measurement does not affect the monomer–oligomer equilibrium). Moreover, they could reconstruct a low-resolution structure of the oligomers and found that aS oligomers in these conditions are shaped as closed wreaths 18 nm long and 9 nm wide, with a diameter of ∼4.5 nm. Comparing the volumes of monomers versus oligomers (460 ± 30 nm3) obtained by modelling and starting from the constraints established by SAXS measurements, the authors suggested that the oligomers are constituted by ∼16 aS molecules. Moreover, the model suggested that these oligomers are on-pathway and may be the building blocks of aS fibrils (Giehm et al. Reference Giehm, Svergun, Otzen and Vestergaard2011b).
The oligomeric structure proposed by Giehm et al. could also account for the pore-forming activity thought to be one of the toxic mechanisms of aS aggregates. However, considering that oligomers are transient and heterogeneous, it seems quite improbable that ∼30–40% of the aS in solution consists of a monodisperse ensemble of oligomers. Our interpretation is that this result is an approximation due to the low resolution of the technique, which, however, remains one of the most effective techniques used in vitro to characterize these aggregation intermediates.
In addition, E46K protofibrils, isolated by GF after protein lyophilization and resuspension, show a recurrent annular shape (d = 10–15 nm) (Fredenburg et al. Reference Fredenburg, Rospigliosi, Meray, Kessler, Lashuel, Eliezer and Lansbury2007), similar to that observed for wt, A30P and A53T aS (Conway et al. Reference Conway, Harper and Lansbury2000; Lashuel et al. Reference Lashuel, Petre, Wall, Simon, Nowak, Walz and Lansbury2002).
Other biophysical techniques have been used in the attempt to classify oligomeric species. Kaylor et al. (Reference Kaylor, Bodner, Edridge, Yamin, Hong and Fink2005) identified two main species by fluorescence spectroscopy, i.e., early and late oligomers: the first ones are transient and convert rapidly to fibrils at the end of the lag phase, while the late oligomeric species coexist with the fibrils even at the end of the reaction. A Fourier transform infrared spectroscopy (FTIR) analysis of the same two oligomeric species in comparison with aS monomers or fibrils showed that the early oligomeric species have a fraction of β-sheets comparable with that of aS fibrils (∼43%), while in the late oligomers, the β-sheet structure is ∼18%. The authors also generated the triple aS mutant Y125W/Y133F/Y136F, suitable for performing FRET measurements. The differences in FRET efficiency allowed determination of the mean distance between Tyr39 and Trp125 for the different aS species during the aggregation process. The average value decreased from 2.49 nm for the monomers to 2.19 and 1.88 nm for the early and late oligomers, respectively; the fibril spectrum showed no energy transfer, most likely because the fibril structure quenches the tyrosine emission. To further characterize these oligomeric species, the same research group performed DLS experiments (Dusa et al. Reference Dusa, Kaylor, Edridge, Bodner, Hong and Fink2006): they measured the scattering signal of the supernatants at different time points during the aggregation reaction. At the early phases of the fibrillization, only monomers were found in the sample (mean radii were inferred from the scattered light: R monomer = 3.1 ± 0.2 nm), while after a few hours, oligomers with R early oligomer = 22 ± 2 nm were revealed. At the end of the fibrillization, smaller oligomeric species were in the sample supernatants (R late oligomers = 12–15 nm).
Apetri et al. (Reference Apetri, Maiti, Zagorski, Carey and Anderson2006) analysed aS aggregates during an entire fibrillization process at 37°C without shaking (initial monomer concentration 300 μM) to study oligomeric intermediates’ morphology and secondary structure. As first species, they found spheroidal oligomers that were divided into two different classes on the basis of their heights, as detected by AFM (1.4–3.5 or 4.0–7.5 nm); after a few days, chains of spheres were found in the samples, with mean heights of ∼5 nm, which disappeared upon fibril formation. The secondary structure of the different oligomeric species was, in this case, evaluated by Raman spectroscopy: the authors assigned the band at 1650 cm−1 that typically corresponds to α-helical structures mainly to aS monomers in solution. The same analysis revealed that the two oligomeric species have a decrease in their α-helical content and an increase in their β-sheet structure content compared with the monomers.
More recently, experiments using Trp fluorescence emission variations were performed to evaluate the residues involved in the formation of aS oligomeric species (van Rooijen et al. Reference Van Rooijen, Van Leijenhorst-Groener, Claessens and Subramaniam2009b). Oligomers of aS Trp mutants (F4W, Y39W, A69W, A90W, A124W and A140W) were obtained by aggregating mutated aS at a 1 mM concentration overnight at room temperature and 300 rpm, followed by 2 h at 37°C without shaking. The aggregated aS was then filtered (0.2 μm) and injected into a GF column, and the oligomers were collected in the void volume. While all the aS Trp mutants in the monomeric form have a Trp emission maximum between 347 and 355 nm, the peaks of the F4W, Y39W, A69W, A90W mutants were considerably blue-shifted in the oligomeric species, suggesting that these residues in the oligomers were less exposed to the solvent. A124W and A140W showed a minimal blue-shift, suggesting that the negatively charged C-term is not buried in the oligomer core, which seems to comprise between residues 4 and 90.
A recent step forward is studied by Cremades et al. (Reference Cremades, Cohen, Deas, Abramov, Chen, Orte, Sandal, Clarke, Dunne, Aprile, Bertoncini, Wood, Knowles, Dobson and Klenerman2012), which showed that aS oligomeric species are present as a heterogeneous ensemble during the aS aggregation process using single-molecule fluorescence experiments (smTCCD). The oligomer distribution was divided into three different classes: small (2–5 monomers), medium (5–15 monomers) and large (15–150 monomers) oligomers, confirming the variability reported before. The mass fraction of oligomers present in solution at all the observed time points (<5%) is in good agreement with part of the results mentioned above.
As previously reported, the oligomeric species obtained in vitro vary considerably according to the experimental conditions, and this heterogeneity is further enhanced in experiments that involve additional physical or chemical procedures to induce oligomer formation. The use of elaborate protocols aims to obtain more reproducible results and/or to prove that an excess of some chemical compounds can lead to the formation of specific types of oligomers with particular toxicity. However, it remains to be proven whether these procedures lead to the identification of aS oligomers that are relevant to the study of the molecular mechanisms of synucleinopathies or if they are just another paradigm of aS oligomeric species of unproven relevance among all others.
4.1 Physical methods for obtaining aS oligomers
Several physical methods have been applied to aS oligomer ‘production’. In a first case, lyophilization of recombinant proteins after purification and their subsequent resuspension led to the formation of stable aS oligomers that were analysed by different biochemical and biophysical methods (Apetri et al. Reference Apetri, Maiti, Zagorski, Carey and Anderson2006; Lashuel et al. Reference Lashuel, Petre, Wall, Simon, Nowak, Walz and Lansbury2002). Fragmentation of aS fibrils by supercooling was also used to obtain an enriched preparation of aS oligomers with electrophysiological activity on artificial membranes and whose structural features were extensively characterized in two papers (Kim et al. Reference Kim, Cho, Riedel, Fernandez and Zweckstetter2008, Reference Kim, Cho, Kumar, Maier, Siebenhaar, Becker, Fernandez, Lashuel, Benz, Lange and Zweckstetter2009). In particular, oligomer morphologies were characterized by AFM and TEM, whereas their secondary structure, a β-sheet non-fibrillar structure, was studied by solid-state NMR.
The sonication of recombinant aS fibrils results in the formation of so-called ‘seeds’. Although seeds are heterogeneous objects of variable size, they turned out to be an extremely useful tool in aggregation experiments in which the introduction of seeds as preformed nucleation centres into the aggregation mix led to more reproducible results (Giehm & Otzen, Reference Giehm and Otzen2010; Wood et al. Reference Wood, Wypych, Steavenson, Louis, Citron and Biere1999). Moreover, aS seeds have been used to trigger aS aggregation in the cellular compartments using cell lines or primary neuronal cultures (Luk et al. Reference Luk, Song, O'Brien, Stieber, Branch, Brunden, Trojanowski and Lee2009; Nonaka et al. Reference Nonaka, Watanabe, Iwatsubo and Hasegawa2010; Volpicelli-Daley et al. Reference Volpicelli-Daley, Luk, Patel, Tanik, Riddle, Stieber, Meaney, Trojanowski and Lee2011; Waxman & Giasson, Reference Waxman and Giasson2010), as will be discussed more in detail in Section 6.1.
4.2 Chemical oligomers
The presence of specific chemical compounds in the aggregation mix was shown to influence the aS aggregation process, leading to the formation of off-pathway oligomerization products through the formation of covalent bonds. Among these products, particularly interesting are the oligomers formed in the presence of docosahexaenoic acid (DHA) (De Franceschi et al. Reference De Franceschi, Frare, Pivato, Relini, Penco, Greggio, Bubacco, Fontana and De Laureto2011) or 4-hydroxy-2-nonenal (HNE) (Nasstrom et al. Reference Nasstrom, Fagerqvist, Barbu, Karlsson, Nikolajeff, Kasrayan, Ekberg, Lannfelt, Ingelsson and Bergstrom2011; Qin et al. Reference Qin, Hu, Han, Reaney, Di Monte and Fink2007b). DHA is a fatty acid present in high abundance in the brain regions where LBs are present, whereas HNE is a lipid peroxidation product that can modify proteins, most likely by forming adducts or aggregates in parkinsonian brains (Yoritaka et al. Reference Yoritaka, Hattori, Uchida, Tanaka, Stadtman and Mizuno1996). De Franceschi et al. obtained covalent oligomers after incubation of aS with DHA at the molar ratio of 1:50; these oligomers are characterized by annular and spherical morphologies, as detected by AFM and TEM. Moreover, FTIR and circular dichroism (CD) analysis showed a high content of α-helical and random structures but almost no β-sheet structure, suggesting that these oligomers are not on-pathway intermediate aggregates of mature amyloid fibrils. DHA can therefore modulate the properties of the covalent aS oligomers, which were shown to be toxic to SH-SY5Y neuroblastoma cells (De Franceschi et al. Reference De Franceschi, Frare, Pivato, Relini, Penco, Greggio, Bubacco, Fontana and De Laureto2011).
HNE–aS oligomers also showed an annular morphology, as detected by AFM (inner diameter 30–50 nm, outer diameter 80–100 nm), but also a curved protofibrillar structure 100–200 nm long and 2–4 nm high. However, in contrast to DHA–aS oligomers, their secondary structure is characterized by a shift in the CD spectra to wavelengths typical of a β-sheet conformation (Nasstrom et al. Reference Nasstrom, Fagerqvist, Barbu, Karlsson, Nikolajeff, Kasrayan, Ekberg, Lannfelt, Ingelsson and Bergstrom2011). HNE–aS oligomers are internalized by SH-SY5Y, which show a reduced viability induced by the oligomers’ toxicity.
Another physiologically relevant molecule responsible for the formation of covalent oligomers of aS is DA. DA is particularly important in PD pathogenesis because the prominent death of dopaminergic neurons in parkinsonian brains suggests that this neurotransmitter may play a key role in the toxic events that lead to cell death and neurodegeneration. Bisaglia et al. showed that incubation of aS and DA leads to the formation of aS oligomeric species that are stable when separated in a sodium dodecyl sulphate (SDS)–PAGE (Bisaglia et al. Reference Bisaglia, Mammi and Bubacco2007). The structure of aS/DA oligomers was also studied by groups (Cappai et al. Reference Cappai, Leck, Tew, Williamson, Smith, Galatis, Sharples, Curtain, Ali, Cherny, Culvenor, Bottomley, Masters, Barnham and Hill2005; Rekas et al. Reference Rekas, Knott, Sokolova, Barnham, Perez, Masters, Drew, Cappai, Curtain and Pham2010) using SAXS and CD; size-exclusion chromatography allowed separation of aS/DA dimers, trimers and higher molecular weight oligomers. Dimers and trimers showed an increased content of β-sheets and turns, while SAXS data permitted the elaboration of a low-resolution model for the aS/DA oligomers shape. It is worth noting that 3,4-dihydroxyphenylacetaldehyde, i.e., the monoamine oxidase metabolic product of DA, can form SDS insoluble oligomeric adducts with aS (Burke et al. Reference Burke, Kumar, Pandey, Panneton, Gan, Franko, O'Dell, Li, Pan, Chung and Galvin2008).
Interestingly, the presence of metal ions in the aggregation assay also induces the formation of SDS-resistant aS oligomers, whose main characteristic is again their annular or spherical structure (Kostka et al. Reference Kostka, Hogen, Danzer, Levin, Habeck, Wirth, Wagner, Glabe, Finger, Heinzelmann, Garidel, Duan, Ross, Kretzschmar and Giese2008; Lowe et al. Reference Lowe, Pountney, Jensen, Gai and Voelcker2004). The type of metal ion appears to affect the dimensions and shape of the aS oligomers formed: spherical particles (0.4–8 nm) are obtained from aS in the presence of copper(II), iron(III) and nickel(II); and larger spherical oligomers (5–8 nm) result from the aggregation of aS with magnesium(II), cadmium(II) and zinc(II). Moreover, calcium(II) and cadmium(II) lead to the formation of annular oligomers with diameters, respectively, of 70–90 and 22–30 nm (Lowe et al. Reference Lowe, Pountney, Jensen, Gai and Voelcker2004). To summarize, aS oligomeric species generated in vitro have to be taken cum grano salis. The numerous studies reported above suggest that the heterogeneity observed can hardly be ascribed only to the intrinsic heterogeneity of the aS aggregation products and is most likely strongly affected by the experimental conditions under which aggregation assays are performed. On this ground, it appears difficult to firmly ascribe a pathological function to these oligomers without robust proof of their presence and activity in PD cell or animal models or, even better, in parkinsonian brains.
The key future challenge for PD researchers is to conceive of an experimental method to observe these oligomers in action within the cell to determine which among the several aS oligomeric species are truly relevant for the pathology.
5. aS fibrils: structure and properties
5.1 Fibril structure
5.1.1 Fourier transform infrared and small angle X-ray spectroscopy measurements
Secondary structure information of aS fibrils can be obtained by FTIR (Fourier transform infrared) spectroscopy, which provides a fingerprint of the secondary structure distribution rather than precise structural details. FTIR spectra of resuspended aS fibrils (Kaylor et al. Reference Kaylor, Bodner, Edridge, Yamin, Hong and Fink2005; Qin et al. Reference Qin, Hu, Han, Hong and Fink2007a) showed a maximum at 1630–1635 cm−1, characteristic of the vibrational frequencies of intramolecular parallel β-sheets. The broad shoulder at ∼1650 cm−1 reflects the presence of disordered structures, i.e., parts of the N- and C-terms. We are aware that FTIR analysis cannot compete with NMR in term of resolution; however, it is clear that it is much more affordable and easier to use FTIR fingerprints to compare the secondary structure characteristics. Furthermore, this technique has potential for the study of aggregation directly in cells, as recently reviewed for other aggregating proteins (Miller et al. Reference Miller, Bourassa and Smith2013).
Information on fibril quaternary structure can be obtained by SAXS experiments on full-length fibrils (Giehm et al. Reference Giehm, Svergun, Otzen and Vestergaard2011b). As previously reported, Giehm et al. presented SAXS data on aS oligomeric species that they suggested represent the building blocks of mature fibrils. These SAXS experiments allowed the authors to obtain a reconstruction of aS fibrils derived from the analysis of the data on oligomeric species, whose resolution is very low compared with the models obtained using the methods previously introduced. However, this reconstruction allows an establishment of a relationship between aS oligomer structure and aS fibril formation, providing a possible characterization of aS assembly, in which fibrils are built by a class of aS oligomers.
5.1.2 NMR and EPR to probe aS fibril structure
Among the aS aggregation products, amyloid fibrils are the best characterized, being stable in solution and easy to isolate. They share several structural characteristics with amyloid fibrils formed by other aggregating proteins (Dobson, Reference Dobson1999) linked to neurodegenerative disorders, such as AD, Huntington's disease and amyotrophic lateral sclerosis (Ross & Poirier, Reference Ross and Poirier2004).
A first attempt to define the structure of fibrillar aS was accomplished by X-ray diffraction (Serpell et al. Reference Serpell, Berriman, Jakes, Goedert and Crowther2000). Serpell et al. measured X-ray diffraction patterns of dried fibrils obtained from wt aS, from a deletion mutant consisting of the first 120 residues, and from the pathological mutants A30P and A53T. All samples showed a ring shape at a spacing of ∼0.47 nm, and the wt also showed a weak diffraction at ∼1.0–1.1 nm; the X-ray data suggest a β-sheet structure for all these fibrils, with the β-strands perpendicular to the fibril axis.
More resolved structural information has been acquired by nuclear and electron magnetic resonance techniques, which were applied to the characterization of the aS fibril structure. The main goal was to define both the structures of the fibril core and of the N- and C-terms to ultimately define a model for aS amyloid fibrils.
The structural features of aS fibrils were first studied by site-specific spin labelling and by electronic paramagnetic resonance (EPR) (Der-Sarkissian et al. Reference Der-Sarkissian, Jao, Chen and Langen2003). This work was based on a nitroxide spin label, used as reporter molecule, whose structural environment and proximity to other reporter molecules can be deduced from the modulation of its EPR properties. EPR spectral analysis allowed the determination of loops, buried sites and secondary structure elements in amyloid fibrils. The data suggested that aS fibrils have a core region (including not only the NAC domain) organized in an ordered, in-register, parallel structure, consisting of 68 amino acids from residues 34 to 101. The N-term region showed a more heterogeneous and less ordered structure, while the C-term was described as completely unfolded.
In an ss-NMR study (Heise et al. Reference Heise, Hoyer, Becker, Andronesi, Riedel and Baldus2005), the authors used correlation experiments, reverse isotope labelling and novel strategies for the characterization of the aS fibril structure. The residue-specific resonance assignments of 48 amino acids in the aS core region (from residues 38 to 95) were obtained using two-dimensional (2D) and 3D correlation experiments. These data also allowed determination of the structure of the β-sheet core region, constituted in the proposed model by six β-strands. Within this core region, a turn and a loop were identified (at residues 66–68 and 83–86). Moreover, the authors found, in accordance with the previous EPR study (Der-Sarkissian et al. Reference Der-Sarkissian, Jao, Chen and Langen2003), that the N-term starting from residue 22 is quite rigid, while the C-term is mobile and has no secondary structure. Through the differences in 13C and 15N shifts found for the amino acids between E83 and I88 and for the side-chain atoms, Heise et al. identified two different types of fibrils: a relatively ordered form and a disordered one (Heise et al. Reference Heise, Hoyer, Becker, Andronesi, Riedel and Baldus2005). The parallel TEM imaging experiments performed suggested that the differences in the structure detected by ss-NMR correspond to at least two different fibril morphologies (see Section 4.2).
An EPR study was performed on fibrils obtained from 83 different point mutation spin-labelled derivatives to define more precisely the fibril boundaries of the core region and to determine its secondary structure elements (Chen et al. Reference Chen, Margittai, Chen and Langen2007). Consistent with previous work, Chen et al. found a core packed region that extended from amino acids 36 to 98 and, within this region, some mobile and flexible areas. Moreover, they confirmed the fibrils’ parallel arrangement, in which the β-strand planes are perpendicular to the fibril axis.
In 2008 Vilar et al. (Reference Vilar, Chou, Luhrs, Maji, Riek-Loher, Verel, Manning, Stahlberg and Riek2008) presented new NMR experiments on aS fibrils. Hydrogen–deuterium (H/D) exchange measurements suggested, as expected, that most of the residues from 30 to 110 were not exposed to the solvent. Moreover, H/D exchange showed biphasic behaviour consisting of two exchange rates, consistent with the presence of two distinct conformations in the sample, as previously reported (Heise et al. Reference Heise, Hoyer, Becker, Andronesi, Riedel and Baldus2005). Residues 1–27 and 104–140 appeared flexible and showed no secondary structure, as indicated by their fast exchange rates. ss-NMR experiments on 15N,13C-labelled aS fibrils allowed the assignment of 70% of the residues in the core region (35–95), but no heterogeneity was detectable with this technique in the samples. Based on ss-NMR and EPR experiments performed by other groups and on their own work, Vilar et al. proposed a new structural model, in which the core of the fibrils (from residues 30 to 110) is a β-sandwich consisting of five β-strands with different possible packings and solvent exposure, while the N- and C- terms are unstructured. This model also accounts for the data on the proteolysis resistance of the fibrils in solution (Pivato et al. Reference Pivato, De Franceschi, Tosatto, Frare, Kumar, Aioanei, Brucale, Tessari, Bisaglia, Samori, De Laureto and Bubacco2012; Qin et al. Reference Qin, Hu, Han, Hong and Fink2007a).
In a recent work, Comellas et al. by assigning via ss-NMR 106 residues, versus the 62 residues presented in a previous ss-NMR study (Heise et al. Reference Heise, Hoyer, Becker, Andronesi, Riedel and Baldus2005), demonstrated that the core of the fibril goes from residues 38–96 (Comellas et al. Reference Comellas, Lemkau, Nieuwkoop, Kloepper, Ladror, Ebisu, Woods, Lipton, George and Rienstra2011). The novelty of their model is due to the identification of a motif repeated twice in the fibrils’ secondary structure, consisting of a long β-strand and two short β-strands, from residues 38 to 66 and from 68 to 96. Moreover, the authors could identify structural features in both the N- and C- terms (Comellas et al. Reference Comellas, Lemkau, Nieuwkoop, Kloepper, Ladror, Ebisu, Woods, Lipton, George and Rienstra2011), in disagreement with the previous NMR and EPR works, in which these parts of the protein were described as completely unfolded. More recently, the same research group published a comparison between each pathological mutant and wt aS fibrils in terms of structural features, based on an ss-NMR study. The authors showed that, despite the slower aggregation rate of A30P mutants, the resultant amyloid fibrils have chemical shifts and secondary structure similar to the wt aS (Lemkau et al. Reference Lemkau, Comellas, Kloepper, Woods, George and Rienstra2012), whereas the structures of A53T and E46K fibrils show some small differences around the mutated region and significant variations compared with the wt aS (Lemkau et al. Reference Lemkau, Comellas, Lee, Rikardsen, Woods, George and Rienstra2013). Given these latest results, the mutants’ pathogenicity may be attributable not only to the properties of the aggregation intermediates but also to the characteristics of the final products of the aggregation process.
Over the past decade, structural data has provided a satisfactory description of the aS fibrillar core and allowed the elaboration of models that describes the aS monomer structure within the fibril (Fig. 3).
Schematic representation of the arrangement of an individual aS molecule within a fibril, following the results obtained by Comellas et al. by solid-state NMR. N-term and C-term do not present a define structure, but still present some structural features, in disagremeent with part of the previous works. Conversly, the central part of the protein is folded into six β-strands: solid-state NMR allowed also the identification a repeated motif, constituted by one long and two short β-strands (from amino acids 38 to 66 and from 68 to 96). Structural features (turns, loops and β-strands) and the associated number of residues are reported in the schema. Fibril axis is perpendicular to the plane that contains the folded protein (Comellas et al. Reference Comellas, Lemkau, Nieuwkoop, Kloepper, Ladror, Ebisu, Woods, Lipton, George and Rienstra2011).
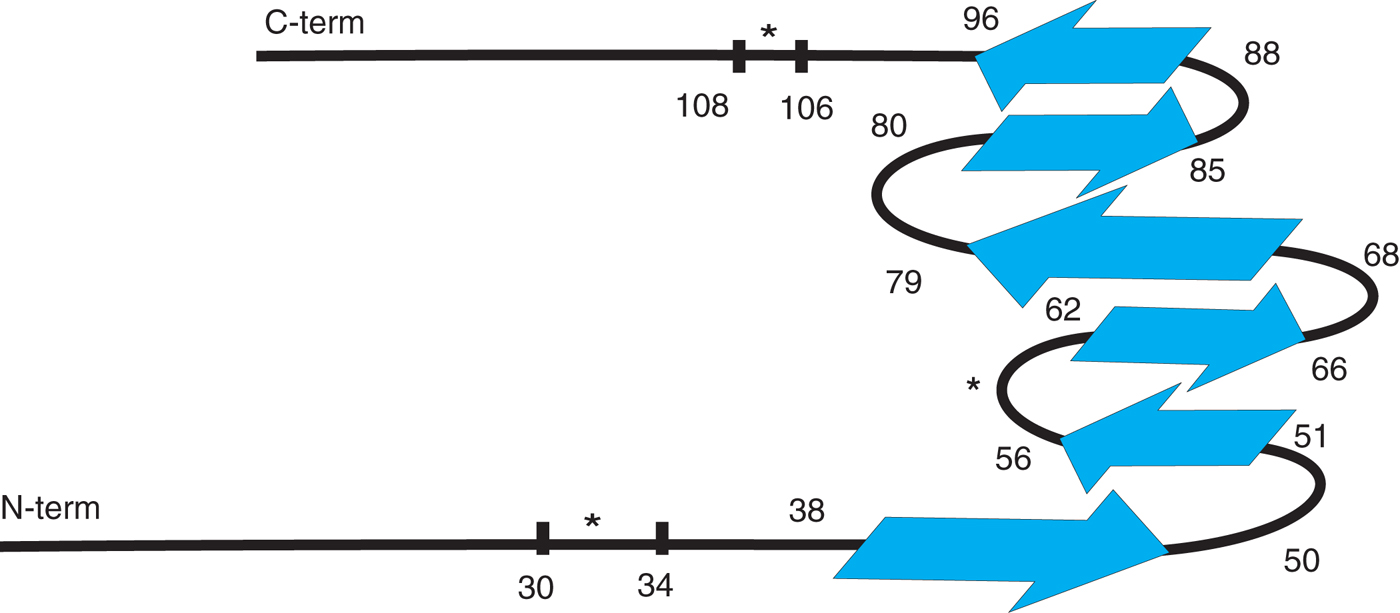
The latest model clearly suggests that the pathological mutations E46K and A53T are structured, while the missense mutation A30P is located in an unstructured loop; moreover, the N- and C-terms are not completely unfolded, as hypothesized in the first studies, but present some minor structural elements that could be crucial, as we will see in the next section, for the formation of mature fibrils.
5.2 Fibril imaging
TEM and AFM are the main imaging techniques used to study aS fibrils and to determine their morphology, in particular, their mean diameters, mean lengths and periodicity. Optical imaging, even in its more recent developments, such as stimulated emission depletion microscopy (STED), still has not achieved a sufficient resolution compared with the actual aS fibril dimensions.
5.2.1 Fibrils observed with TEM
TEM allows imaging of aS fibrils, but its resolution is limited not only by the electrons’ wavelength but also by the staining procedure. Information on fibril length and periodicity can therefore be estimated, but diameter measurements are strongly biased by the presence and dimensions of the grains of uranyl acetate salt. Therefore, TEM experiments on fibrils are typically used to qualitatively evaluate aggregate morphology and, as such, are reported in most of the publications on aS aggregation (Heise et al. Reference Heise, Hoyer, Becker, Andronesi, Riedel and Baldus2005; Vilar et al. Reference Vilar, Chou, Luhrs, Maji, Riek-Loher, Verel, Manning, Stahlberg and Riek2008).
5.2.2 Fibrils measured by AFM
AFM imaging, which does not require staining and is less invasive, is typically used to measure fibrils’ diameters and periodicity. AFM can be applied to biological studies using different imaging modes (Casuso et al. Reference Casuso, Rico and Scheuring2011), and in most of them, it only mildly affects fibril integrity and structure and therefore has been used to develop structural models of fibrils and hypotheses on fibril assembly.
This method allowed identification of a strong dependence of aS fibril morphologies, lengths and heights on the experimental conditions, i.e., solution pH, salt concentration and aS concentration (Hoyer et al. Reference Hoyer, Antony, Cherny, Heim, Jovin and Subramaniam2002; van Raaij et al. Reference Van Raaij, Van Gestel, Segers-Nolten, De Leeuw and Subramaniam2008), in good agreement with the kinetics and the structural data previously discussed.
Van Raaij et al. performed AFM experiments to determine the dependence of fibril length distribution on protein concentration and found that longer fibrils are obtained by increasing the initial aS concentration. Moreover, they found a concentration threshold below which there is no significant fibrillization. This concentration has been estimated to be below 15 μM.
Hoyer et al. (Reference Hoyer, Antony, Cherny, Heim, Jovin and Subramaniam2002) studied aS fibril morphology at different pHs (from pH 4.0 to 7.0) and used AFM to identify the periodicity in the obtained fibrils. They found only untwisted fibrils when aS was aggregated at pH 7.0, whereas at pH 6.0, they could find two twisting modes: right-handed with an ∼45 nm periodicity and left-handed with a periodicity of ∼95 nm. At lower pH, they reported a decreased amount of detectable fibrils, while amorphous aggregates were abundant. Conversely, other authors (Qin et al. Reference Qin, Hu, Han, Hong and Fink2007a; van Raaij et al. Reference Van Raaij, Segers-Nolten and Subramaniam2006) reported twisting in fibrils obtained at pH higher than 6.0, and, moreover, van Raaij et al. compared the morphological characteristics of wt aS, A30P and E46K fibrils by measuring their heights and periodicities with a robust statistical analysis. They found mean heights of 10.0 ± 1.1, 8.1 ± 1.2 and 9.0 ± 0.8 nm for wt aS, A30P and E46K fibrils, respectively, and periodicities of 81 ± 24, 103 ± 20 and 76 ± 34 nm. The authors were not able to characterize A53T fibrils because, in their experimental conditions, they could only obtain large amorphous aggregates (diameter>1 μm) for this mutant.
Khurana et al. performed AFM experiments that allowed the characterization of fibril morphology and led them to hypothesize a fibril assembly mechanism at the late stages that leads to mature fibrils (Khurana et al. Reference Khurana, Ionescu-Zanetti, Pope, Li, Nielson, Ramirez-Alvarado, Regan, Fink and Carter2003). They proposed that aS monomers, in aggregating conditions, first assemble into protofilaments, which are 3.8 ± 0.6 nm high; after protofilament elongation, two of them intertwine and form protofibrils (mean height 6.5 ± 0.6 nm), likely to minimize the exposure of hydrophobic interfaces. For the same reasons, two protofibrils intertwine into mature fibrils that are 9.8 ± 1.2 nm high. The authors also reported a clear periodicity of 100–150 nm for protofibrils and an amplitude of ∼1 nm.
In 2007, Qin et al. reported detailed height measurements for aS fibrils, digested fibrils and deletion mutants’ fibrils lacking the N-term, C-term or both, to determine the role of the two terminals in fibril assembly (Qin et al. Reference Qin, Hu, Han, Hong and Fink2007a). The authors proposed an average height for canonical fibrils of 13.6 ± 0.7 nm, while all the other fibrils had different sizes. In particular, it has been shown that the removal of the C-term (truncated aS from amino acid 1 to 103) leads to the formation of protofibrils (mean height 5.7 ± 0.3 nm), while in the absence of the N-term (from amino acid 30 to 140), the mean height is 10.7 ± 0.5 nm, suggesting that the fibrils’ structure is conserved but that the mean diameter is smaller because of the N-term removal. The absence of both the N- and C-terms leads to the formation of protofilaments whose mean height is 2.9 ± 0.3 nm, a value comparable with the data on trypsin-digested fibrils (2.8 ± 0.2 nm).
The results obtained by Qin et al. highlighted a key role for the C- and N-terms in mature fibril formation and strongly supported the model previously proposed by Khurana et al. on the late steps of aS fibril hierarchical assembly (Khurana et al. Reference Khurana, Ionescu-Zanetti, Pope, Li, Nielson, Ramirez-Alvarado, Regan, Fink and Carter2003).
Recently, different types of chimaeric aS covalent dimers were generated to investigate the relative orientation of aS monomers within the amyloid fibrils (Pivato et al. Reference Pivato, De Franceschi, Tosatto, Frare, Kumar, Aioanei, Brucale, Tessari, Bisaglia, Samori, De Laureto and Bubacco2012). The dimers were obtained by disulphide bridge linking of aS molecules in different ways, i.e., through their N-term, through their C-term, or by simply expressing wt monomeric aS in tandem. A fourth dimer, in which the two fibril core regions of the two aS molecules were juxtaposed, was also prepared and purified. These chimaera induce different minimal constraints to the possible orientations of the aS molecules stacking within the fibrils, showing that CC and NN dimers exhibit morphologies and mean diameters very similar to wt aS, whereas NC shows shorter diameters and the DC dimer exhibits a very broad distribution of diameters from 3 to 15 nm, as if the fibrils in this case were clustering.
5.2.3 Super resolution fluorescence imaging of aS fibrils
Fluorescence microscopy has rarely been used to study aS aggregation in vitro because of its low resolution. More recently, super resolution methods have been applied to the characterization of fibril features and their growth dynamics; however, these techniques are not widely used, mainly because they are not commonly available. In a very recent paper, Roberti et al. (Reference Roberti, Folling, Celej, Bossi, Jovin and Jares-Erijman2012) studied aS fibril structure and growth using photoactivated localization microscopy (PALM). They achieved a resolution of ∼20 nm and were able to identify, using aS conjugated with two different derivatives of rhodamine spiroamides, i.e., RSA577 and RSA617, the dynamics of fibril accretion, which, interestingly, occur in their aggregation process only at one single end of the fibril. Recently, Ries et al. (Reference Ries, Udayar, Soragni, Hornemann, Nilsson, Riek, Hock, Ewers, Aguzzi and Rajendran2013) used the super resolution method termed binding-activated localization microscopy (BALM) to image aS fibrils in vitro. This method is based on the use of an amyloid-specific dye (pentamer-formyl thiophene acetic acid) that binds to aS fibrils, fluoresces, and is then bleached, to determine fibrils’ diameters without being diffraction-limited. The apparent diameter of aS fibrils measured by BALM is 14 nm, meaning that the achieved resolution is below 20 nm. In both the cases, PALM and BALM images of aS fibrils resemble the AFM micrographs very closely but do not add information about fibril features.
These methods could be interesting if used in cells to characterize aggregates in a more biological milieu. The resolution of this method can break the diffraction limit and is therefore very powerful in fixed cells; however, the acquisition is very slow, which presents a problem for its application to the imaging of live cells (see Section 6.1).
5.3 Fibril modelling
Taking into account most of the structural data on aS fibrils present in the literature, it has been possible to recapitulate the results in a structural schema representing the most probable folding of aS molecules within the fibrils (Fig. 3), which is in good agreement with the putative aS β-sheet propensity calculated from aS primary sequence (Fig. 2) (Suk et al. Reference Suk, Lokappa and Ulmer2010; Zibaee et al. Reference Zibaee, Jakes, Fraser, Serpell, Crowther and Goedert2007). Moreover, the assembly of aS molecules in fibrils was proposed to be a general hierarchical mechanism, from protofilaments to protofibrils to fibrils.
However, the recognition of polymorphisms in fibrils samples by NMR, EPR and microscopy techniques and the differences in the quantitative analysis on fibril diameters, even when performed with the very same technique (Sections 4.1 and 4.2), suggest that even small changes in the general aggregation conditions and in the sample preparation can lead to large variations in the results obtained.
In terms of differences between the fibrils obtained in vitro from wt aS and from the pathological mutants, it seems that there are some structural differences around the mutation regions, at least for A53T and E46K, while morphological or dimensional differences can be found for all of the mutants.
An interesting observation arose from an aggregation assay performed with chimaeric aS mutants, in which β-sheet-prone regions in the aS sequence were shuffled (Suk et al. Reference Suk, Lokappa and Ulmer2010). The authors showed that even after scrambling the aS sequence, some of the mutants, but not all, were still able to form fibrils. This result suggested that the formation of aS fibrils is associated with the possible spatial rearrangements of the β-sheets composing the structure. Moreover, the formation of the initial nucleation centre is affected by the presence of gaps between the different β-sheet regions.
Our opinion on this issue is that many of the structural and morphological differences among fibrils reported in the literature may not only depend on the different aggregation intermediates, including protofilaments, protofibrils and fibrils (see Section 3.2), present in the same sample but may also be, for the multiple amyloidogenic mechanisms of fibril formation, strongly affected by aggregating conditions that are still uncharacterized but that can result in different final aggregation products. Interestingly, all pathological mutations in the aS sequence, excluding A30P, are located in the core region of the fibril, suggesting that they can have some consequences not only in the assembly of aS fibrils but also in the formation of the oligomeric species.
If even small differences in the protofibrillar and fibrillar aggregation products could be relevant to their potential effects in vivo, a fine and detailed characterization of even the tiniest dissimilarities is pivotal for designing the most appropriate therapeutic strategy.
Moreover, an in-depth characterization of aS fibrils purified from LBs extracted from parkinsonian brains or from cellular models for aS fibril formation is still lacking, although TEM images of aS fibrils have been available since the discovery of aS presence in LBs (Spillantini et al. Reference Spillantini, Crowther, Jakes, Hasegawa and Goedert1998). These data will allow the exploitation and testing of the knowledge acquired through in vitro studies in physiologically relevant models.
6. Aggregation in cell models
Recently, efforts to link the in vitro aggregation properties of aS to their biological and pathological significance have increased tremendously, along with interest in recasting these biophysical data into biologically relevant processes.
The main techniques used to study protein aggregation in cells typically require fixation, labelling with antibodies (suitable for TEM or fluorescence microscopy) and fluorescent dyes recognizing amyloid fibrils. These methods allow the detection of aS aggregates, but little detailed information can be obtained on the kinetics of the aggregation process in the cellular environment and on the structural properties of these cellular aggregates.
Moreover, the study of aS aggregation in cells presents additional problems that should be outlined here: (i) aS overexpression itself is not always enough to trigger aggregation in cells, the process is often accelerated by exogenous agents (i.e., seeds obtained by sonication of aS fibrils or exogenous co-expression with synphilin) (Buttner et al. Reference Buttner, Delay, Franssens, Bammens, Ruli, Zaunschirm, De Oliveira, Outeiro, Madeo, Buee, Galas and Winderickx2010; Engelender et al. Reference Engelender, Kaminsky, Guo, Sharp, Amaravi, Kleiderlein, Margolis, Troncoso, Lanahan, Worley, Dawson, Dawson and Ross1999; Luk et al. Reference Luk, Song, O'Brien, Stieber, Branch, Brunden, Trojanowski and Lee2009); and (ii) early oligomeric species are rarely observed, mainly because their instability and transient nature impedes their accumulation to detectable levels.
Generally, discriminating among different aS aggregation intermediates and fibrils in cells remains a difficult task because the resolution of conventional optical microscopy is low (200–300 nm) compared with the objects observed (fibril length is of the order of micrometres, but their diameters are ∼10 nm). Advanced optical microscopy techniques, such as fluorescence lifetime, fluorescence recovery after photobleaching, and fluorescence anisotropy, may provide additional information. However, these data require interpretation to become relevant for describing specific aS aggregation intermediates. Conversely, super resolution techniques require cell fixation and either specific expensive dyes for staining, in the case of STED microscopy (for example, Atto), or photoactivatable dyes or proteins, in the case of PALM, to obtain a sensible improvement in the quality of the data. Nevertheless, the recent use of advanced and super resolution fluorescence or dye-free microscopy techniques that allow a study of the dynamics of the aggregation process in a cellular environment have provided novel results, as described in the next paragraphs.
6.1 Aggregation kinetics and aggregate properties in cells
Several studies employ immunocytochemistry and the conventional fluorescence microscopy technique to identify aS aggregation in cells. These assays require cells transiently transfected with aS or stable cell lines overexpressing aS. Moreover, aS aggregation in cells is triggered by exogenous agents, such as recombinant aS seeds or oxidative stress (Luk et al. Reference Luk, Song, O'Brien, Stieber, Branch, Brunden, Trojanowski and Lee2009; Nonaka et al. Reference Nonaka, Watanabe, Iwatsubo and Hasegawa2010; Roberti et al. Reference Roberti, Bertoncini, Klement, Jares-Erijman and Jovin2007; Waxman & Giasson, Reference Waxman and Giasson2010). A few days after treatment (from 2 to 7 depending on the experimental conditions), cells are fixed and immunostaining is performed to visualize aS with fluorescence microscopy.
6.1.1 aS fused with fluorescent proteins (FPs) or tags
As an alternative, aS fused to FPs can be used (McLean et al. Reference Mclean, Kawamata and Hyman2001). FPs are valuable tools, being detectable in live cells, with the caveat that they are much larger than aS (enhanced green fluorescent protein – EGFP – is ∼28 kDa, while aS is 14.6 kDa). Moreover, FPs have a β-barrel structure, whereas aS, at least, the fraction that seems to be more aggregation prone, is in an unfolded state in the cell cytoplasm.
The possibility that aS fused to a FP could behave differently from the wt, could hamper the use of these constructs to study aggregation in live cells or in living organisms (McLean et al. Reference Mclean, Kawamata and Hyman2001). McLean et al. observed that aS fused to EGFP (or other tags) at the C-term can form large inclusions when overexpressed in mouse-cultured primary neurons, whereas no detectable aggregation was present when neurons were transfected with untagged aS, suggesting that manipulation of C-term aS may enhance its aggregation propensity, possibly altering the long-range intramolecular interactions normally present. Moreover, using the same experimental setup, the authors observed differences in cellular aggregation between PD pathological mutants and wt aS fused with EGFP. A53T aS-EGFP and wt aS-EGFP showed inclusions in ∼5% of transfected cells, while A30P aS-EGFP did not cause the formation of large inclusions.
However, other research groups successfully used aS-EGFP variants to investigate aS behaviour and aggregation in immortalized cells (Outeiro et al. Reference Outeiro, Putcha, Tetzlaff, Spoelgen, Koker, Carvalho, Hyman and Mclean2008; van Ham et al. Reference Van Ham, Esposito, Kumita, Hsu, Kaminski Schierle, Kaminski, Dobson, Nollen and Bertoncini2010); the reason for such discrepancies may be the use of primary neuron cultures, which are likely to be more sensitive to variations in protein homeostasis due to aS overexpression. aS overexpression can interfere with pathways that control the amount of proteins present within a cell. Accordingly, aS was shown to hamper protein clearance mechanisms (Ebrahimi-Fakhari et al. Reference Ebrahimi-Fakhari, Wahlster and Mclean2012), and similar to chimaeric amyloidogenic proteins, aS was proposed to sequester essential cellular proteins during aggregation (Olzscha et al. Reference Olzscha, Schermann, Woerner, Pinkert, Hecht, Tartaglia, Vendruscolo, Hayer-Hartl, Hartl and Vabulas2011). McLean et al. concluded that overexpression of aS in primary neuronal culture remains a good model for studying aS aggregate formation in cells.
An unceasing effort is on-going to improve the study of the aS aggregation process and to determine to what extent fluorescence probes or proteins fused to aS are suitable tools for studying aS aggregation in PD cell or animal models by live imaging. A first attempt in this direction came from Roberti et al. who generated a construct in which aS was fused to a tag containing four cysteines (C4 tag) inserted in a 12-mer peptide (FLNCCPGCCMEP). C4 tags can covalently bind biarsenical compounds (termed FlAsH and ReAsH, depending on fluorescence excitation and emission wavelengths), which because of their high selectivity, are expected to label the protein directly in the cytoplasm of live cells after permeating the cell membrane. FlAsH and ReAsH become fluorescent only under the structural constraints imposed by binding to the C4 tag (Roberti et al. Reference Roberti, Bertoncini, Klement, Jares-Erijman and Jovin2007). Since the C4 tag plus the biarsenical dye have a combined molecular weight of ∼1.3 kDa, it is likely that they have negligible effects on aS structural features and its aggregation process. The aggregation properties of aS-C4 compared with those of the wt aS in a ThT fluorescence assay in vitro, showed no relevant differences, confirming that the C4 tag and its bound fluorophore are a suitable probe for studying aS aggregation. The caveat of using FlAsH ligands is that they do not bind only to the tetracysteine tag but could also stain proteins rich in cysteines. Furthermore, the staining is typically less efficient than conventional staining methods, such as immunocytochemistry (Hearps et al. Reference Hearps, Pryor, Kuusisto, Rawlinson, Piller and Jans2007; Stroffekova et al. Reference Stroffekova, Proenza and Beam2001).
A second method has been proposed by van Ham et al. who expressed and purified a recombinant form of aS fused to a yellow fluorescent protein (aS-YFP). They then used biochemical and biophysical techniques in vitro to demonstrate that aS and aS-YFP (or other similar FPs) showed similar aggregation kinetics and products (van Ham et al. Reference Van Ham, Esposito, Kumita, Hsu, Kaminski Schierle, Kaminski, Dobson, Nollen and Bertoncini2010).
Clearly, further investigation is required to characterize the possible effects of fused FPs or staining with biarsenical compounds not only on aS aggregation but also on aS function and behaviour in the cellular environment (degradation, stability, post-translational modifications, etc.).
6.1.2 TEM and ThS staining on fixed cells
To overcome the limitations of optical microscopy, Nonaka et al. performed TEM on aS-overexpressing cells, in which aggregation of overexpressed or endogenous aS was triggered by addition of seeds to the culture medium (Nonaka et al. Reference Nonaka, Watanabe, Iwatsubo and Hasegawa2010). TEM microscopy resolution is approximately three orders of magnitude higher than that of conventional optical microscopy techniques (∼0.2–2 nm), and in fact, the authors were able to identify aS amyloid fibrils in cell cytoplasm. Recently, we were also able to image aS fibrils being phagocytosed by macrophages and subsequently internalized into lysosomes by TEM (Codolo et al. Reference Codolo, Plotegher, Pozzobon, Brucale, Tessari, Bubacco and De Bernard2013), further supporting that TEM imaging is a powerful technique for visualizing fibrillar aS in cells. The limitation is that TEM does not provide any information about the presence of other aggregation intermediates or oligomers because of their heterogeneity, which makes them difficult to distinguish from other intracellular structures.
The presence of β-sheet fibrillar forms of aS triggered by seeds was also observed by ThS measurements. Staining with an antibody against aS phosphorylated at Ser129 was used to validate the proposed cell model (Luk et al. Reference Luk, Song, O'Brien, Stieber, Branch, Brunden, Trojanowski and Lee2009; Waxman & Giasson, Reference Waxman and Giasson2010) as this phosphorylated form of aS is highly enriched in LBs (Fujiwara et al. Reference Fujiwara, Hasegawa, Dohmae, Kawashima, Masliah, Goldberg, Shen, Takio and Iwatsubo2002). The limitation of these techniques is that they require cell fixation and are therefore not suitable for live imaging.
6.1.3 Advanced fluorescence microscopy techniques applied to the study of aS aggregation in cells
aS aggregation in cell models was also studied by advanced fluorescence microscopy techniques, i.e., FRET, fast recovery after photobleaching (FRAP) and fluorescence lifetime imaging microscopy (FLIM). In 2006, a combination of FLIM and FRET was used to study aS conformations and self-interactions within cells (Klucken et al. Reference Klucken, Outeiro, Nguyen, Mclean and Hyman2006). The technique allows detection of molecular proximity and oligomerization by measuring the fluorescence lifetime of a fluorophore. In this particular case, human H4 neuroglioma cells were transiently transfected with an equimolar ratio of aS plasmids tagged with V5 or haemagglutinin (HA), fixed, and stained with primary antibodies against V5 and HA and with secondary antibodies conjugated with two different fluorophores (Cy3 and Alexa 488, respectively). The fluorescence lifetime of an FRET donor fluorophore (Alexa 488) is shortened when it is close to (<10 nm) an FRET acceptor (Cy3), and the degree of shortening is proportional to the donor–acceptor distance. Using this setup, the authors were able to detect aS oligomers within intact cells, although they could not observe large aggregates. They also performed FLIM measurements and showed that the lifetime of the aS-HA staining fluorophore Alexa 488 was ∼2.2 ns in the absence of the corresponding acceptor Cy3, while in the presence of aS-V5 stained with Cy3 at the C-term, the lifetime of Alexa 488 decreased to 1.4 ns. The authors proposed two different interpretations: (i) aS monomers in the cell cytoplasm fold and bring the N-term and the C-term of the same aS molecule into close proximity, causing a strong interaction; and (ii) the C-term of an aS molecule interacts with the N-term of another aS molecule, possibly at the early stages of the oligomerization process. These results correlate very well with some of the data on aS folding (Section 2), further suggesting that some of the reported conformational modifications may truly be associated with the early steps of the aggregation process. No information on the later steps of aS oligomerization was provided by this type of experiment in cells.
Biomolecular fluorescence complementation (BiFC) is a method used to validate protein–protein interactions; fragments of the FP sequence are fused with the proteins of interest, and when an interaction occurs, the fragments come into close proximity and the FPs reassemble and regain their fluorescence emission properties. This technique allowed Outeiro et al. (Reference Outeiro, Putcha, Tetzlaff, Spoelgen, Koker, Carvalho, Hyman and Mclean2008) to visualize aS oligomerization in living cells. They generated BiFC aS mutants, in which aS is fused with GFP fragments that become fluorescent only when aS molecules come together. Using this setup, they identified aS dimers and higher oligomeric species formed within cells, including the nuclear region. The authors also demonstrated that these low molecular weight species are essential for the formation of larger aggregates and can be related to the observed cytotoxicity. The induced toxicity decreased upon oligomer stabilization through a chaperone protein (heat-shock protein 70), which has been previously reported to reduce aS aggregation and toxicity in PD cell and animal models (Auluck et al. Reference Auluck, Chan, Trojanowski, Lee and Bonini2002; Klucken et al. Reference Klucken, Shin, Masliah, Hyman and Mclean2004).
Although these studies provided new clues into the initial steps of the aggregation process, they are not informative enough to fully describe aS aggregation in cells. The difficulties in the determination of the kinetics of the aggregation process and the dimensions and structural properties of the aggregation intermediates are major drawbacks in working with aS aggregation in cells.
The biarsenical fluorophores mentioned above were used to study aS aggregation in live SH-SY5Y cells by FRET (Roberti et al. Reference Roberti, Bertoncini, Klement, Jares-Erijman and Jovin2007). Imaging over time with confocal microscopy allowed observation of aS aggregates in SH-SY5Y transfected with aS-C4 and stained with FlAsH and ReAsH 48 h after transfection (in this experiment, the aggregation of aS was triggered by oxidative stress). The authors found a high variability in pixel-by-pixel FRET efficiency (10–80%), which was related to the proximity of aS-C4 stained molecules in different cells. They were able to define two ensembles by analysing the FRET efficiency distributions. The first ensemble is characterized by FRET efficiencies between 60 and 80% and represents aS aggregates, while the second one, with efficiencies between 30 and 45%, corresponds to the non-aggregated form of the protein. This method, however, does not allow the determination of the size of aS aggregates, but it gives a hint about the amount of aggregates and their distribution in live cells and may be used to detect the effects of aS inhibitors or enhancers.
Using the same aS-C4 plasmid to overexpress aS in SH-SY5Y cells and staining the protein with ReAsH, the same authors investigated aS aggregation in living cells by FRAP and confocal fluorescence anisotropy (CFA) (Roberti et al. Reference Roberti, Jovin and Jares-Erijman2011). FRAP allows the monitoring of molecular mobility through fluorescence recovery of labelled aS over time after photobleaching. Therefore, FRAP data provide information on the mobile fraction of a protein and on its diffusion coefficient, D. In transfected cells, the regions without aggregates show complete recovery, with a biphasic behaviour characterized by a very fast recovery, which is associated with free protein (D = 10 μm2 s−1), followed by a slower recovery due to membrane-bound protein and to small aggregates (D = 0.08–0.15 μm2 s−1). Conversely, where large aggregates are present, most of the protein is immobilized; the small FRAP recovery observed in this case is most likely due to small aggregates exchanging with the larger aggregates (D = 0.03–0.04 μm2 s−1).
CFA provides information on changes in the size of aS aggregates; fluorescence anisotropy r measurements were used to generate anisotropy maps and total fluorescence intensity I f images of cells or regions of interest within them by classifying pixels in the images using I f and r values. On this basis, the authors suggested the presence of four different aS species in the cell cytoplasm: monomeric free aS, membrane-bound aS and dim or bright aS aggregates.
The FRET principle was exploited by Schierle et al. to study the kinetics of aS oligomerization. Starting from the observation that aS aggregates can act as FRET acceptors for various fluorescence proteins, they fused aS with a yellow fluorescent protein (aS-YFP) and measured FRET between the growing oligomers (acceptors) and the donor YFP (Kaminski Schierle et al. Reference Kaminski Schierle, Bertoncini, Chan, Van Der Goot, Schwedler, Skepper, Schlachter, Van Ham, Esposito, Kumita, Nollen, Dobson and Kaminski2011). After the in vitro characterization of the FRET sensor response to the aggregation process, the technique was used to study aS aggregation in the SH-SY5Y cell line. aS-YFP was introduced into cells through electroporation, and measurements of the excited state lifetime allowed monitoring of FRET pixel-by-pixel as a function of time after electroporation. The average lifetime was ∼3020 ± 20 ps for extracellular aS and 2970 ± 70 ps for cytoplasmic monomeric protein at the beginning of the process. The lifetime value decreased with time to 1480 ± 40 ps after 4 days. FRET efficiency, and consequently donor YFP lifetime, in this system is strongly correlated to aggregate size; however, a quantitative evaluation of oligomer size is not possible using this method.
Super resolution methods, as mentioned before, can be applied to the study of aS aggregation not only in vitro but also in cell models. The application of these methods required the delivery of aS labelled with rhodamine spiroamide RSA577 mixed with wt aS in a 1:3 molar ratio into HeLa cells and cell fixation after aggregate appearance (Roberti et al. Reference Roberti, Folling, Celej, Bossi, Jovin and Jares-Erijman2012). Using PALM, Roberti et al. were able to identify the formation of spheroidal aggregates that were assigned to two different groups. The first group consisted of aggregates with diameters <40 nm, while the second included aggregates with diameters between 40 and 200 nm. Their results are considerably higher resolution compared with the images that can be obtained using confocal microscopy. However, PALM imaging requires fixation, mainly because of the large number of frames that are needed to reconstruct a high-resolution image; therefore, it does not allow the study of aS aggregation in live cells. However, to perform a sort of kinetic analysis of aS aggregation, cell samples can be fixed at different time points for later analysis.
The new techniques described here for studying aS aggregation in live cells confirmed some in vitro observations, such as the identification of oligomeric species as the early products of the aggregation process. Moreover, they suggest that aS oligomers do not always proceed to form amyloid fibrils in cells, a process that is promoted in the presence of seeds. The level of characterization of aggregates in fixed or live cells needs to be improved; a refinement of the available methods both in term of structural properties and available resolution must be reached to tackle the link between aS aggregate properties and toxicity in cells.
6.2 aS aggregates toxicity
As gene dosage of SNCA is linked to pathology and aS is deposited in LBs, it seems reasonable that point mutations in SNCA act through a gain of function rather than through a loss of function.
Several different toxic mechanisms have been correlated to the aS aggregation process and to its oligomeric and fibrillar products. Given the heterogeneity of the aggregation products, it is reasonable to expect that cytotoxicity may occur through different mechanisms.
aS could be defined as a polymorphic protein, plastically changing its conformation, secondary structure and interactors (proteins or lipids). Given this premise, it is not surprising to find a large variety of noxious effects ascribed to aS in its different observed conformations.
Among the most studied toxicity mechanisms ascribed to aS is the ability of monomeric or oligomeric aS to interact in a disruptive way with lipid membranes (Reynolds et al. Reference Reynolds, Soragni, Rabe, Verdes, Liverani, Handschin, Riek and Seeger2011) or to form well-characterized pores similar to those observed in the presence of pore-forming toxins (Kim et al. Reference Kim, Cho, Kumar, Maier, Siebenhaar, Becker, Fernandez, Lashuel, Benz, Lange and Zweckstetter2009; Tosatto et al. Reference Tosatto, Andrighetti, Plotegher, Antonini, Tessari, Ricci, Bubacco and Dalla Serra2012; Zakharov et al. Reference Zakharov, Hulleman, Dutseva, Antonenko, Rochet and Cramer2007). To explore the pore-forming capacity of aS in its various forms in intact cells, aS was overexpressed in both SH-SY5Y and HEK293 cells, in which aS can aggregate. Specifically, aggregate-like aS species observed in SH-SY5Y by fluorescence microscopy were localized in part of the cell membrane, with a concomitant increase in conductance (Feng et al. Reference Feng, Federoff, Vicini and Maguire-Zeiss2010). Increased conductance was also independently found in HEK293T cells overexpressing aS (Tsigelny et al. Reference Tsigelny, Bar-On, Sharikov, Crews, Hashimoto, Miller, Keller, Platoshyn, Yuan and Masliah2007). Based on these convergent observations, and in agreement with in vitro studies (Kim et al. Reference Kim, Cho, Kumar, Maier, Siebenhaar, Becker, Fernandez, Lashuel, Benz, Lange and Zweckstetter2009; Schmidt et al. Reference Schmidt, Levin, Kamp, Kretzschmar, Giese and Botzel2012; van Rooijen et al. Reference Van Rooijen, Claessens and Subramaniam2009a), increased membrane conductance could be predicted to result in ion leakage with expected deleterious effects. Formation of membrane pores may support Na+ diffusion from the extracellular environment to the cytoplasm, driven by its favourable electrochemical potential, with consequent unwanted electrical responses in neuronal cells. Ca2+ may also diffuse into the cytoplasm from the extracellular space, causing cytotoxicity. Furthermore, under the assumption that aS oligomers induce an increase in plasma membrane conductance, it is reasonable to predict that they could also damage intracellular membranes, i.e., vesicles containing neurotransmitters (Mosharov et al. Reference Mosharov, Staal, Bove, Prou, Hananiya, Markov, Poulsen, Larsen, Moore, Troyer, Edwards, Przedborski and Sulzer2006) and mitochondrial membranes. The latter have been independently reported to be damaged by aS overexpression. Indeed, aS overexpression in HeLa cells induces mitochondrial fission and variation in mitochondria morphology (Nakamura et al. Reference Nakamura, Nemani, Azarbal, Skibinski, Levy, Egami, Munishkina, Zhang, Gardner, Wakabayashi, Sesaki, Cheng, Finkbeiner, Nussbaum, Masliah and Edwards2011). The authors could not verify that the mitochondrial-associated aS was oligomeric, but they were able to demonstrate aS oligomer interaction with mitochondrial-like membranes in vitro. More to the point, aS overexpression in PC12 cells (a pheocytochroma-derived dopaminergic cell line) leads to mitochondrial depolarization and subsequent mitochondrial-mediated cell death (Smith et al. Reference Smith, Jiang, Pei, Tanaka, Morita, Sawa, Dawson, Dawson and Ross2005; Tanaka et al. Reference Tanaka, Engelender, Igarashi, Rao, Wanner, Tanzi, Sawa, Dawson, Dawson and Ross2001). Although a few studies suggest the formation of oligomeric aS pores in vitro, their existence in vivo still awaits direct experimental evidence.
The presence of toxic aS forms affects the physiology not only of membranes but also of other cellular structures. In this respect, aS overexpression was shown to induce endoplasmatic reticulum (ER) stress in PC12 cells (Smith et al. Reference Smith, Jiang, Pei, Tanaka, Morita, Sawa, Dawson, Dawson and Ross2005) and Golgi fragmentation in COS-7 cells (Gosavi et al. Reference Gosavi, Lee, Lee, Patel and Lee2002). The observed ER stress induced by aS was further confirmed by the finding of aS oligomers within the ER in an A53T transgenic mouse model of PD (Colla et al. Reference Colla, Jensen, Pletnikova, Troncoso, Glabe and Lee2012).
Both the ubiquitin–proteasome system and the autophagic lysosomal pathway have been suggested as targets of aS aggregation products. These systems are involved in the clearance of monomeric, oligomeric or aggregated aS, among other proteins, and have been shown to be impaired in cell and animal models of aS aggregation, possibly because they are saturated by an excessive amount of misfolded protein. However, the literature regarding this field is wide and sometimes controversial (Cuervo et al. Reference Cuervo, Stefanis, Fredenburg, Lansbury and Sulzer2004; Ebrahimi-Fakhari et al. Reference Ebrahimi-Fakhari, Wahlster and Mclean2012; Mak et al. Reference Mak, Mccormack, Manning-Bog, Cuervo and Di Monte2010; Plotegher & Civiero, Reference Plotegher and Civiero2012).
A related aS toxicity mechanism that has been recently proposed is the sequestration of essential proteins during the aggregation process. As proof of concept, this sequestration mechanism was shown for amyloid-forming chimaeric proteins in a recent paper (Olzscha et al. Reference Olzscha, Schermann, Woerner, Pinkert, Hecht, Tartaglia, Vendruscolo, Hayer-Hartl, Hartl and Vabulas2011). An analogous process was shown to occur for aS in primary neurons treated with seeds, in which synaptic proteins are sequestered into the aggregates (Volpicelli-Daley et al. Reference Volpicelli-Daley, Luk, Patel, Tanik, Riddle, Stieber, Meaney, Trojanowski and Lee2011), and can be predicted for other chaperone proteins present in cell cytoplasm. Molecular crowding induced by aS aggregates and the ability of aS to co-aggregate with other proteins or chaperones (Dedmon et al. Reference Dedmon, Christodoulou, Wilson and Dobson2005a; Xu et al. Reference Xu, Kao, Lee, Song, Jin and Yankner2002) found in LBs (Shirakashi et al. Reference Shirakashi, Kawamoto, Tomimoto, Takahashi and Ihara2006; Xia et al. Reference Xia, Liao, Cheng, Duong, Gearing, Lah, Levey and Peng2008) further substantiate this hypothesis.
Finally, it has been shown that neuroinflammatory mechanisms (Alvarez-Erviti et al. Reference Alvarez-Erviti, Couch, Richardson, Cooper and Wood2011a; Maguire-Zeiss & Federoff, Reference Maguire-Zeiss and Federoff2010), oxidative stress and ROS production (Cremades et al. Reference Cremades, Cohen, Deas, Abramov, Chen, Orte, Sandal, Clarke, Dunne, Aprile, Bertoncini, Wood, Knowles, Dobson and Klenerman2012; Freeman et al. Reference Freeman, Cedillos, Choyke, Lukic, Mcguire, Marvin, Burrage, Sudholt, Rana, O'Connor, Wiethoff and Campbell2013) can be induced by the presence of aS oligomers and fibrils.
Interestingly, Codolo et al. showed that recombinant aS fibrils trigger inflammation in human monocytes (Codolo et al. Reference Codolo, Plotegher, Pozzobon, Brucale, Tessari, Bubacco and De Bernard2013), likely through a pathway that is general for needle-shaped objects, such as amyloid beta fibrils (Halle et al. Reference Halle, Hornung, Petzold, Stewart, Monks, Reinheckel, Fitzgerald, Latz, Moore and Golenbock2008) as well as asbestos and carbon nanotubes (Palomaki et al. Reference Palomaki, Valimaki, Sund, Vippola, Clausen, Jensen, Savolainen, Matikainen and Alenius2011). In addition, a specific form of aS oligomer directly released from cells was shown to activate microglia (Kim et al. Reference Kim, Ho, Suk, You, Michael, Kang, Joong Lee, Masliah, Hwang, Lee and Lee2013), while other aS aggregates obtained from recombinant aS did not result in an inflammatory response. Interestingly, both papers suggest that the activation of this process is mediated by an interaction with the membrane protein toll-like receptor 2.
Although it is widely accepted that aS aggregation is toxic to cells, albeit that the nature of these toxic species is still controversial, another possibility is that aS aggregation instead causes a decrease in the available functional aS and a consequent loss of function, which leads, in turn, to cell death. aS has in fact been suggested to play an important role at the presynapse through interaction with the SNARE complex during vesicle exocytosis and neurotransmitter release (Burre et al. Reference Burre, Sharma, Tsetsenis, Buchman, Etherton and Sudhof2010; Nemani et al. Reference Nemani, Lu, Berge, Nakamura, Onoa, Lee, Chaudhry, Nicoll and Edwards2010). Indeed, a recent report showed that aS oligomerization is responsible for the inhibition of SNARE-mediated vesicles docking (Choi et al. Reference Choi, Choi, Kim, Yang, Lai, Kweon, Lee and Shin2013).
Figure 4 summarizes the most important toxic mechanisms related to aS aggregation in cells that could be addressed by biophysical methods. For example, organelles’ integrity in the presence of aS aggregates could be studied by TEM, FRET or other microscopy techniques (Nakamura et al. Reference Nakamura, Nemani, Wallender, Kaehlcke, Ott and Edwards2008, Reference Nakamura, Nemani, Azarbal, Skibinski, Levy, Egami, Munishkina, Zhang, Gardner, Wakabayashi, Sesaki, Cheng, Finkbeiner, Nussbaum, Masliah and Edwards2011), or electrophysiological studies could monitor membrane permeabilization due to aS oligomers (Kim et al. Reference Kim, Cho, Kumar, Maier, Siebenhaar, Becker, Fernandez, Lashuel, Benz, Lange and Zweckstetter2009). These major advancements in biophysics could provide new tools for addressing these open issues.
Summary of the most recurrent toxic mechanisms proposed related to aS aggregation and transmission: membrane damages (Feng et al. Reference Feng, Federoff, Vicini and Maguire-Zeiss2010; Mosharov et al. Reference Mosharov, Staal, Bove, Prou, Hananiya, Markov, Poulsen, Larsen, Moore, Troyer, Edwards, Przedborski and Sulzer2006), mitochondrial morphology alterations, dysfunctions and damages (Devi et al. Reference Devi, Raghavendran, Prabhu, Avadhani and Anandatheerthavarada2008; Nakamura et al. Reference Nakamura, Nemani, Azarbal, Skibinski, Levy, Egami, Munishkina, Zhang, Gardner, Wakabayashi, Sesaki, Cheng, Finkbeiner, Nussbaum, Masliah and Edwards2011; Smith et al. Reference Smith, Jiang, Pei, Tanaka, Morita, Sawa, Dawson, Dawson and Ross2005; Tanaka et al. Reference Tanaka, Engelender, Igarashi, Rao, Wanner, Tanzi, Sawa, Dawson, Dawson and Ross2001), ER stress (Smith et al. Reference Smith, Jiang, Pei, Tanaka, Morita, Sawa, Dawson, Dawson and Ross2005), oxidative stress and ROS production (Cremades et al. Reference Cremades, Cohen, Deas, Abramov, Chen, Orte, Sandal, Clarke, Dunne, Aprile, Bertoncini, Wood, Knowles, Dobson and Klenerman2012; Freeman et al. Reference Freeman, Cedillos, Choyke, Lukic, Mcguire, Marvin, Burrage, Sudholt, Rana, O'Connor, Wiethoff and Campbell2013) and clearance mechanisms impairment (Cuervo et al. Reference Cuervo, Stefanis, Fredenburg, Lansbury and Sulzer2004; Ebrahimi-Fakhari et al. Reference Ebrahimi-Fakhari, Wahlster and Mclean2012; Mak et al. Reference Mak, Mccormack, Manning-Bog, Cuervo and Di Monte2010). Among the aS aggregates transmission mechanism exosome transmission (Alvarez-Erviti et al. Reference Alvarez-Erviti, Seow, Schapira, Gardiner, Sargent, Wood and Cooper2011b; Danzer et al. Reference Danzer, Kranich, Ruf, Cagsal-Getkin, Winslow, Zhu, Vanderburg and Mclean2012), axonal transport (Freundt et al. Reference Freundt, Maynard, Clancy, Roy, Bousset, Sourigues, Covert, Melki, Kirkegaard and Brahic2012) and nanotubes transport (Gousset et al. Reference Gousset, Schiff, Langevin, Marijanovic, Caputo, Browman, Chenouard, De Chaumont, Martino, Enninga, Olivo-Marin, Mannel and Zurzolo2009) are reported.

A relevant question that remains unanswered in the etiopathogenesis of PD is when aS oligomerization or aggregation is the cause of toxicity and when toxicity is, instead, the result of upstream pathological events that affect aS physiological functionality and induce aS aggregation.
6.3 Misfolded aS transmission in cell models
Braak staging for PD indicates that LBs first appear in the olfactory bulb and that only later in disease progression do they form in other brain regions (Braak et al. Reference Braak, Del Tredici, Rub, De Vos, Jansen Steur and Braak2003). This result suggests that the transmission of misfolded or aggregated aS from unhealthy to healthy neurons could be the culprit for the spread of the pathology and the progression of the disease. This hypothesis gained further support from clinical evidence (Kordower et al. Reference Kordower, Chu, Hauser, Freeman and Olanow2008; Li et al. Reference Li, Englund, Holton, Soulet, Hagell, Lees, Lashley, Quinn, Rehncrona, Bjorklund, Widner, Revesz, Lindvall and Brundin2008) showing the presence of LBs in naïve neurons grafted in parkinsonian brains 10 years after surgery.
The evaluation of this hypothesis requires many of the experimental approaches that fall in the realm of biophysics. Several cellular studies have now confirmed that oligomeric aS can transfer from a donor to a receiving cell (Desplats et al. Reference Desplats, Lee, Bae, Patrick, Rockenstein, Crews, Spencer, Masliah and Lee2009; Hansen et al. Reference Hansen, Angot, Bergstrom, Steiner, Pieri, Paul, Outeiro, Melki, Kallunki, Fog, Li and Brundin2011). Although some results suggest that the transfer may occur via endocytosis, they did not provide any direct evidence.
The transmission of fragments of recombinant aS fibrils was found to be responsible for enhanced aS aggregation. The fragments serve as ‘seeds’ and trigger aS aggregation in the recipient cells (Nonaka et al. Reference Nonaka, Watanabe, Iwatsubo and Hasegawa2010), as evaluated by TEM and fluorescence microscopy imaging.
Volpicelli-Daley et al. (Reference Volpicelli-Daley, Luk, Patel, Tanik, Riddle, Stieber, Meaney, Trojanowski and Lee2011) further showed that pre-formed recombinant aS fibrils were taken up by cultured primary mouse neurons. These fibrils affected neural excitability and connectivity, as reported by calcium imaging of the hippocampal neuronal networks. Moreover, aS inclusion formation caused both the sequestration of some synaptic proteins and neuronal cell death. Volpicelli-Daley et al. further showed intracellular propagation of fibrils from soma to neurites and vice versa using microfluidic devices as precast templates to guide the growth of neurites.
In vivo fibril propagation was recently documented by immunohistological experiments: transmission from neuron to neuron in mouse brains after fibril injection induced the spread of PD pathology to untreated brain regions. Interestingly, these mice showed some of the symptoms that can be ascribed to PD (Luk et al. Reference Luk, Kehm, Carroll, Zhang, O'BRIEN, Trojanowski and Lee2012).
Despite these recent studies, the precise, and most likely multiple, mechanisms that cause aS spreading from neuron to neuron or aS uptake by cells from the extracellular space are not clear. Several different hypotheses have been proposed: (i) direct cell-to-cell transfer due to the increased protein concentration in the extracellular space, possibly caused by cell death; (ii) exosomes or vesicles that protect the protein from the action of proteolytic enzymes and carry it to recipient cells; (iii) molecular chaperones that mediate aS transmission; (iv) misfolded aS that moves through the slow movement of axonal transport; and (v) membrane nanotubes that interconnect cells over long-distances serving as highways for aS aggregates (Steiner et al. Reference Steiner, Angot and Brundin2011).
Hints about the possible mechanism came from two recent papers. The first proposed that overexpressed aS can be transmitted from transfected SH-SY5Y cells to normal SH-SY5Y cells by exosomes (Alvarez-Erviti et al. Reference Alvarez-Erviti, Seow, Schapira, Gardiner, Sargent, Wood and Cooper2011b; Danzer et al. Reference Danzer, Kranich, Ruf, Cagsal-Getkin, Winslow, Zhu, Vanderburg and Mclean2012). The second showed that fibrillar aS can be transferred along axons via anterograde axonal transport, with a velocity that was inversely proportional to the aggregate size (Freundt et al. Reference Freundt, Maynard, Clancy, Roy, Bousset, Sourigues, Covert, Melki, Kirkegaard and Brahic2012).
Among the other mechanisms, tunnelling nanotubes, which allow the movement of organelles and vesicles (Rustom et al. Reference Rustom, Saffrich, Markovic, Walther and Gerdes2004), seem to be promising candidates, mostly because of their proven involvement in prion protein spreading. Indeed, it has been shown, by time-lapse confocal imaging of live neurons, that tunnelling nanotubes are responsible for the transfer of endogenous and exogenous prion proteins confined in lipid vesicles (Gousset et al. Reference Gousset, Schiff, Langevin, Marijanovic, Caputo, Browman, Chenouard, De Chaumont, Martino, Enninga, Olivo-Marin, Mannel and Zurzolo2009).
This emerging interest is related not only to the mechanisms that govern the transfer of aS but also to the definition of those aS species that are specifically transferred. The latter represent the true key to understanding the pathological process as those species are likely to carry the structural information required to spark aS aggregation in healthy neurons. These unanswered questions are perfect candidates for future biophysical investigations
7. Conclusions
As can be seen from the contents of this review, a plethora of information is available on the kinetics of the aS aggregation process in vitro and on the properties of stable aggregation products. However, less is understood about aS oligomers, which appear to be heterogeneous, transient, numerically less abundant and, when generated in vitro, highly variable in nature. However, they are likely to be the most toxic species.
Recently, the use of more powerful advanced microscopy techniques to study aS aggregation in cells has begun to emerge. In the near future, the newly available methods should allow the correlation of specific aS aggregation intermediates to precise toxic events. The new methods, combined with appropriate experimental strategies, have the potential to unravel the sequential cascade of non-toxic and toxic events triggered by aS oligomeric and fibrillar species, thus identifying the primary and secondary toxic mechanisms and their timing in the progression of the disease.
Another relevant issue that biophysicists should consider is the translation of advanced fluorescence microscopy techniques successfully used to study aS aggregation in vitro into more physiological environments – live cells as the first step, with whole organisms, such as zebrafish and mice, as the ultimate goal.
8. Acknowledgements
This work was supported by grants obtained from the University of Padova (grant no. PRAT2010-CPDA103503) and the Italian Ministry of Education, University and Research (grant no. PRIN2010-M2JARJ), the Rientro dei Cervelli Program (lncentivazione alla mobilità di studiosi stranieri e italiani residenti all'estero) from the Italian Ministry of Education. We thank Daniele Ottaviani for reading the manuscript and for the useful discussion.