





Introduction
Madagascar is a biodiversity hotspot with exceptionally high rates of endemism (Mittermeier et al. Reference Mittermeier, Robles Gil, Hoffmann, Pilgrim, Brooks, Mittermeier, Lamoreux and Da Fonseca2004). However, nearly 60% of vertebrates and almost 90% of plant species in Madagascar are estimated to be at risk of extinction (Ralimanana et al. Reference Ralimanana, Perrigo, Smith, Borrell, Faurby, Rajaonah, Randriamboavonjy, Vorontsova, Cooke, Phelps, Sayol, Andela, Andermann, Andriamanohera, Andriambololonera, Bachman, Bacon, Baker, Belluardo, Birkinshaw, Cable, Canales, Carrillo, Clegg, Clubbe, Crottini, Damasco, Dhanda, Edler, Farooq, Ferreira, Fisher, Forest, Gardiner, Goodman, Grace, Guedes, Hackel, Henniges, Hill, Lehmann, Lowry, Marline, Matos-Maraví, Moat, Neves, Nogueira, Onstein, Papadopulos and Perez-Escobar2022). Most of Madagascar’s plants and animals are forest-dependent (Goodman and Benstead Reference Goodman and Benstead2005). Between 2019 and 2024 alone, the highly species-rich humid forests (Antonelli et al. Reference Antonelli, Smith, Perrigo, Crottini, Hackel, Testo, Farooq, Jiménez, Andela, Andermann, Andriamanohera, Andriambololonera, Bachman, Bacon, Baker, Belluardo, Birkinshaw, Borrell, Cable, Canales, Carrillo, Clegg, Clubbe, Cooke, Damasco, Dhanda, Edler, Faurby, de Lima, Fisher, Forest, Gardiner, Goodman, Grace, Guedes, Henniges, Hill, Lehmann, Lowry, Marline, Matos-Maraví, Moat, Neves, Nogueira, Onstein, Papadopulos, Perez-Escobar, Phelps, Phillipson and Pironon2022) lost approximately 7% of their tree cover (GFW 2026). Loss of forest habitat is driven primarily by slash-and-burn agriculture (Yesuf et al. Reference Yesuf, Brown and Walford2019; Zaehringer et al. Reference Zaehringer, Eckert and Messerli2015). Shortened and frequent fallow periods lead to vegetation degradation and, in the longer term, to the replacement of trees by grasses (Styger et al. Reference Styger, Rakotondramasy, Pfeffer, Fernandes and Bates2007). At the same time, forest recovery in Madagascar is among the slowest reported for tropical regions globally (Culberston et al. Reference Culbertson, Treuer, Mondragon-Botero, Ramiadantsoa and Reid2022).
In the context of slowed ecological succession, trees on deforested land can buffer biodiversity decline and promote regeneration (Manning et al. Reference Manning, Fischer and Lindenmayer2006; Prevedello et al. Reference Prevedello, Almeida-Gomes and Lindenmayer2018). Trees that provide shelter, structural support, food or other resources for associated organisms in anthropogenically modified environments are referred to as habitat trees (Mölder et al. Reference Mölder, Schmidt, Plieninger and Meyer2020). This concept can be extended to habitat plants: for example, palms can offer important foraging and nesting resources (Virapongse et al. Reference Virapongse, Endress, Gilmore, Horn and Romulo2017), while the presence of bamboo determines habitat suitability for the specialist giant panda (Shang et al. Reference Shang, Qin, Yang, Dai, Pan, Yang, Gu, Yang, Zhang and Zhang2024). Formerly forested landscapes along, for example, the eastern coast of Madagascar are often dominated not by trees but by arborescent herbs commonly known as traveller’s tree or traveller’s palm: Ravenala spp. The name derives from the Malagasy word ravinala, traditionally used for this plant genus (Watson Reference Watson1893), and we use this original denomination hereafter to avoid confusion with trees or palms.
Along with the genera Phenakospermum and Strelitzia, ravinala belongs to the family Strelitziaceae (Cron et al. Reference Cron, Pirone, Bartlett, Kress and Specht2012). The genus is endemic to Madagascar but is also cultivated in other tropical and subtropical regions for ornamental purposes (Suroowan and Mahomoodally Reference Suroowan, Mahomoodally and Lall2020). Ravinala is one of Madagascar’s emblematic plants and is widely used by rural communities for construction, tools and food (Rakotoarivelo et al. Reference Rakotoarivelo, Razanatsima, Rakotoarivony, Rasoaviety, Ramarosandratana, Jeannoda, Kuhlman, Randrianasolo and Bussmann2014; Saterson et al. Reference Saterson, Margoluis and Salafsky1999). The genus was long considered monospecific (Ravenala madagascariensis Sonn.), but Haevermans et al. (Reference Haevermans, Hladik, Hladik, Razanatsoa, Haevermans, Jeannoda and Blanc2021) recognised six species that differ in several morphological traits, geographical ranges and habitat preferences.
In the fan-shaped crown of ravinala (Figure 1a), new leaves emerge from the petioles of younger leaves, remain furled and then gradually open and fray with age (Figure 1b–c). Rainwater can enter the parent petiole at the scar formed during leaf emergence. Water is stored at the bases of petioles after rainfall and may subsequently leak out, moistening the upper stem compartment. Ravinala flowers (Figure 1d) provide nutritional nectar for several days each year (Calley et al. Reference Calley, Braithwaite and Ladd1993), and this period may extend to several months within ravinala stands due to asynchronous flowering among individuals (Kress et al. Reference Kress, Schatz, Andrianifahanana and Morland1994).
Ravinala, here specifically R. madagascariensis. (a) Clonal group on formerly forested land. Leaves in the centre of the fan-shaped crown are young; new leaves emerge directly from their petioles, as shown in (b). (b) Emerging leaf in a furled state, opening gradually; the parent leaf is young and has a relatively smooth surface. (c) Older leaf with a strongly frayed lamina. (d) Inflorescence of a mature plant.

The combination of plant morphology, water-storage capacity and nectar production may benefit a range of taxa. Unfurling ravinala leaves harboured roosting groups of Myzopoda aurita bats in south-eastern Madagascar along transects located at land-use margins, predominantly banana and coffee plantations and degraded humid forests (Ralisata et al. Reference Ralisata, Rakotondravony and Racey2015). Geckos have been observed on ravinala stems in Mauritian forests (Harmon et al. Reference Harmon, Harmon and Jones2007), where ravinala – despite being invasive (Kueffer and Mauremootoo Reference Kueffer and Mauremootoo2004) – indirectly enhanced breeding success of the endangered Mauritian kestrel (Falco punctatus) by supporting prey availability (Carpouron et al. Reference Carpouron, Zuël, Monty and Florens2023). On Nosy Mangabe, black-and-white ruffed lemurs (Varecia variegata) fed regularly on ravinala nectar, while other lemurs and nectariniid birds visited flowers occasionally (Kress et al. Reference Kress, Schatz, Andrianifahanana and Morland1994); similar nectar use by bats and honeyeaters has been recorded in suburban gardens of Australia (Calley et al. Reference Calley, Braithwaite and Ladd1993).
However, the role of ravinala as a habitat plant on formerly forested land within the moist forest ecoregion of Madagascar remains uncertain. In such areas, where shortened fallow periods and/or uncontrolled fire prevent forest re-establishment (Joseph et al. Reference Joseph, Seymour and Rakotoarivelo2024; Styger et al. Reference Styger, Rakotondramasy, Pfeffer, Fernandes and Bates2007), ravinala is often abundant or even dominant and may therefore be of particular importance as a habitat plant. In north-eastern Madagascar, these stands characterised by open, ravinala-dominated canopy and abundant grasses are sometimes referred to as ravinala amin’ny tany hieka, meaning ‘ravinala savanna’. Beyond the absence of assessments of ravinala suitability as a habitat plant, little is known about the abundance and structural dimensions of ravinala in these areas.
Our study quantifies the density and structural characteristics of ravinala in a formerly forested landscape in north-eastern Madagascar and assesses their use by birds, herpetofauna and mammals. We hypothesised that ravinala provide important habitat for reptiles and amphibians. We expected reptile richness and encounter frequency to increase with ravinala size, reflecting greater availability of basking and perching sites, while canopy connectivity would be associated with larger shaded patches and thus favour amphibians in otherwise open, disturbed areas. We further hypothesised that ravinala host bird and mammal assemblages comparable to nearby small-statured trees and are visited at similar rates. Given the reported importance of ravinala nectar for these taxa, we expected visitation rates to increase during periods of nectar availability.
Materials and methods
Study area
The study area was selected based on preliminary field studies indicating a high prevalence of formerly forested land with abundant ravinala stands, allowing targeted assessment of ravinala as a habitat plant in this land-use context. The area comprises 2,500 ha and is located in the coastal part of north-eastern Madagascar (14°40′18″ S, 50°11′37″ E; Figure 2a), within the moist forest ecoregion (Vieilledent et al. Reference Vieilledent, Grinand, Rakotomalala, Ranaivosoa, Rakotoarijaona, Allnutt and Achard2018). The climate is tropical humid, with a mean annual precipitation of 2,481 mm and a mean annual temperature of 24.6°C (CHELSA; Karger et al. Reference Karger, Conrad, Böhner, Kawohl, Kreft, Soria-Auza, Zimmermann, Linder and Kessler2017). A rainy season occurs from November to April, frequently accompanied by cyclones, followed by a drier season from May to October. Elevation ranges from sea level to 311 m a.s.l. The dominant soil types are Haplic Ferralsols and Dystric Regosols (Jones et al. Reference Jones, Breuning-Madsen, Brossard, Dampha, Deckers, Dewitte, Gallali, Hallett, Jones, Kilasara, Le Roux, Micheli, Montanarella, Spaargaren, Thiombiano, Van Ranst, Yemefack and Zougmoré2013).
Study area and ravinala detected from satellite imagery. (a) Location of the study area in Madagascar. (b) Locations of terrestrial plots used for ravinala measurements, herpetofauna surveys and camera trapping, together with ravinala plants detected in the WorldView-2 image (orange dots). The masked corner in the north-east indicates the Indian Ocean; areas in the south-west were masked due to cloud cover in the available WorldView-2 image.

Figure 2. Long description
Panel A: A map of Madagascar showing the location of the study area in the SAVA region. The study area is marked with a star. Panel B: A detailed map of the study area showing the locations of terrestrial plots used for ravinala measurements, herpetofauna surveys, and camera trapping. Ravinala plants detected from satellite imagery are marked with orange dots. The map includes a compass rose for orientation and a scale bar for distance measurement. The Indian Ocean is indicated in the northeast corner, and areas in the southwest are masked due to cloud cover.
Slash-and-burn agriculture is widely practised in the region (Sims et al. Reference Sims, Stanimirova, Raichuk, Neumann, Richter, Follett, MacCarthy, Lister, Randle, Sloat, Esipova, Jupiter, Stanton, Morris, Slay, Purves and Harris2025), resulting in a mosaic of fallow land and regenerating vegetation. The prevailing land-use types include hillside and lowland paddy rice, vanilla agroforests and fallow land, often dominated by ravinala and the invasive grass Imperata cylindrica (L.) Raeusch. Secondary forests are fragmented and sparse.
Ravinala density
The density of ravinala plants across the entire study area (2500 ha) was visually assessed using a WorldView-2 satellite image with a spatial resolution of 50 cm, acquired in May 2022 (data provided by the European Space Agency). Ravinala was identified based on crown characteristics, including fan-shaped or narrow linear forms depending on viewing angle, and distinctive crown shading patterns. Detections were cross-checked using a Google Earth Pro image (©Google) dated March 2021. For this comparison, the point shapefile containing ravinala locations identified in the WorldView-2 image was converted into a ZIP-compressed Keyhole Markup Language file and imported into Google Earth Pro for visual inspection. Only ravinala plants visible in both images were retained.
The dominant ravinala species in the area, R. madagascariensis, typically forms clonal groups (Haevermans et al. Reference Haevermans, Hladik, Hladik, Razanatsoa, Haevermans, Jeannoda and Blanc2021). Due to the spatial resolution of the imagery, individual ramets within clonal groups could not be distinguished, and each group was therefore counted as a single plant. Small plants and plants located beneath tree canopies could not be detected, rendering the resulting density estimates conservative.
To assess maximum ravinala density specifically within ravinala-dominated land, we visited all such lands within the study area for which access was granted by landowners (n = 9; Figure 2b). The land parcels were selected as formerly forested, disturbed land with a clear predominance of ravinala in the canopy, based on consistent visual assessment prior to any quantitative measurements. We established one 50 m × 50 m plot in each land parcel. Landowners indicated the centre of each parcel, and plots were established at these locations. Distances between plots ranged from 487 to 1618 m (mean = 969 m). Within each plot, all ravinala plants were counted, again treating each clonal group as a single plant to ensure consistency with the satellite-based assessment. These terrestrial plots were also georeferenced and used to ground-truth satellite-based ravinala counts. Because individual ground coordinates of ravinala were not available, validation was conducted at the plot level rather than by matching individual plants.
Ravinala structure and stored water
Within the plots described above, all ravinala plants containing at least one adult ramet were numbered. Ramets were considered adult if pseudostem formation had begun. If fewer than 15 plants with adult ramets were present in a plot, all plants were included (three plots with n = 8, 11 and 14 plants, respectively); otherwise, 15 plants per plot were randomly selected. In total, 123 plants were sampled across all plots.
For each selected plant, species identity was determined using the identification key of Haevermans et al. (Reference Haevermans, Hladik, Hladik, Razanatsoa, Haevermans, Jeannoda and Blanc2021). The number of adult ramets and juveniles was recorded to estimate clonal group size. On the tallest adult ramet within each clonal group, we counted the number of leaves, measured diameter at breast height (DBH) using a measuring tape and recorded plant height using a Vertex III clinometer (Haglöf Sweden™).
In every third plant, free water stored in petiole bases was extracted by inserting a metal spile at multiple points per petiole. For water collection, all petioles of each sampled ravinala were emptied until no further water was released. Collected water was weighed using scales with a precision of 1 g. All structural measurements and water sampling were conducted in December 2025.
Biodiversity in ravinala
Herpetofauna surveys were conducted as unit-based searches centred on individual ravinala, concurrently with structural measurements and on the same 123 plants (focal ramets). Each sampling unit comprised (i) a fixed understorey plot with a radius of 2 m and (ii) the entire above-ground structure of the focal ramet, including stem, petioles and leaves. Searches continued until the entire unit had been thoroughly inspected rather than being constrained by time. Each ravinala plant was surveyed twice by the same team: once during daylight (07:00–17:00) and once at night (18:30–22:00), with at least one week between surveys.
All amphibians and reptiles encountered were identified to species level. Species names were verified using the Integrated Taxonomic Information System (ITIS 2025) and cross-checked with the IUCN Red List (2025). As individual identification was not possible, the number of encounters was used as a proxy for abundance (Dos Reis-Silva et al. Reference Dos Reis-Silva, Pizzigalli, Seck, Cabeza, Rainho, Rocha and Palmeirim2025; Komanduri et al. Reference Komanduri, Sreedharan and Vasudevan2023).
Birds and mammals were surveyed using camera traps installed in ravinala crowns (Figure 2b; Table S1). Camera trapping in open, sun-exposed crowns is constrained by frequent false triggers caused by wind-driven leaf movement and heated vegetation, which rapidly fill memory cards and drain batteries, limiting unattended deployment durations (Gillespie et al. Reference Gillespie, Brennan, Gentles, Hill, Low Choy, Mahney, Stevens and Stokeld2015; Glover-Kapfer et al. Reference Glover-Kapfer, Soto-Navarro and Wearn2019). Consequently, camera trapping was restricted to a single ravinala-dominated land where unrestricted access allowed regular servicing.
Because ravinala crowns are typically isolated and lack canopy connectivity, and because animal movement direction and behaviour were unknown, detection probability was expected to be low (Moore et al. Reference Moore, Soanes, Balbuena, Beirne, Bowler, Carrasco-Rueda, Cheyne, Coutant, Forget, Haysom, Houlihan, Olson, Lindshield, Martin, Tobler, Whitworth and Gregory2021). To mitigate this, we maximised the monitored perimeter by covering an area of 8 ha while deploying camera traps (n = 14) in a relatively dense spatial configuration, with a minimum inter-trap distance of 51 m and a mean distance of 67 m (Figure 2b). Camera locations were generated using the Create Random Points tool in ArcGIS Pro (Esri 2023).
In February 2024, three camera traps were lost due to an uncontrolled fire. Four additional traps were subsequently installed, increasing the total number of monitored ravinala plants to 18. Cameras were positioned within ravinala clonal groups and oriented towards at least one crown, with a distance of ≤3 m between camera and target crown. Monitoring commenced in November 2023. All cameras were Berger & Schröter Mini models (20 MP resolution) equipped with black LEDs and a 40° detection angle, using a passive infrared sensor and programmed to record three consecutive images per trigger with a five-second trigger interval.
Between January and August 2024, camera traps were additionally installed in the crowns of nearby trees with a DBH >7 cm that were closest to each camera-monitored ravinala (Table S2). Given the open canopy structure and scarcity of larger trees in ravinala-dominated land, tree counterparts were selected opportunistically, and distances between ravinala and trees could not be standardised. Suitable tree counterparts were available for 14 of the 18 monitored ravinala plants. Mean sampling effort amounted to 257 trap-days (SD = 67) for ravinala and 236 trap-days (SD = 7) for trees, yielding a total of 4195 camera-days for ravinala and 3238 camera-days for trees.
Mammals were identified to genus level and birds to species level. Species names were verified using ITIS (2025) and cross-checked against the IUCN Red List (2025).
Data analysis
Species richness of herpetofauna per ravinala was initially analysed using Poisson generalised linear mixed models (GLMMs) implemented in glmmTMB (Brooks et al. Reference Brooks, Kristensen, van Benthem, Magnusson, Berg, Nielsen, Skaug, Maechler and Bolker2017; McGillycuddy et al. Reference McGillycuddy, Warton, Popovic and Bolker2025) in R version 4.5.0 (R Core Team 2025). Due to underdispersion, the final model was refitted using a Conway–Maxwell–Poisson distribution. As effect estimates and directions were nearly identical between Poisson and COM-Poisson models, Poisson estimates are reported for ease of interpretation. The number of herpetofauna encounters per ravinala was modelled using Poisson GLMMs. P-values for class-specific contrasts were adjusted for multiple comparisons using Tukey’s method as implemented in the emmeans package (Lenth Reference Lenth2025). In preliminary analyses, we tested the effects of additional environmental variables on herpetofauna species richness and encounter frequency, namely air temperature, relative humidity and, for daytime samples, sun/cloud conditions during sampling. These variables did not improve model fit and were therefore not retained.
For birds and mammals, camera-trap records were considered independent events if captures of the same species occurred at least 30 minutes apart or if another species was recorded in the interval. Visitation rates were analysed using an exact Poisson test and generalised linear models (GLMs) with a negative binomial distribution and realised trap-days as offset to standardise sampling effort. Modelling was performed in glmmTMB (Brooks et al. Reference Brooks, Kristensen, van Benthem, Magnusson, Berg, Nielsen, Skaug, Maechler and Bolker2017, McGillycuddy et al. Reference McGillycuddy, Warton, Popovic and Bolker2025). Because visitation rates per individual bird species were low and insufficient for species-level modelling, birds were pooled and analysed as a single class in the camera-trap models. As observation periods at tree stations were generally shorter than those at ravinala stations (January–August vs November–August), a sensitivity analysis was conducted by refitting models without effort standardisation to assess whether results were driven by effort correction rather than biological differences between substrates. Later, we tested for the effect of nectar availability on visitation rates by including flowering season (flowering vs non-flowering period) as an explanatory variable in the models.
Model diagnostics were performed using DHARMa (Hartig Reference Hartig2024). Additional analyses utilised MuMIn (Barton Reference Barton2025), performance (Lüdecke et al. Reference Lüdecke, Ben-Shachar, Patil, Waggoner and Makowski2021) and vegan (Oksanen et al. Reference Oksanen, Simpson, Blanchet, Kindt, Legendre, Minchin, O’Hara, Solymos, Stevens, Szoecs, Wagner, Barbour, Bedward, Bolker, Borcard, Carvalho, Chirico, De Caceres, Durand, Evangelista, FitzJohn, Friendly, Furneaux, Hannigan, Hill, Lahti, McGlinn, Ouellette, Ribeiro Cunha, Smith, Stier, Ter Braak and Weedon2025). Figures were produced using ggplot2 (Wickham Reference Wickham2016).
Results
Ravinala density and structure
Satellite-based detection across the whole study area revealed a median ravinala density of 4 plants ha−1 (IQR = 7; Figure 2b). Although, a positive association between methods was strong (Spearman’s Rho = 0.88, p < 0.01), satellite-based detection noticeably underestimated ravinala abundance relative to terrestrial counts, with a median bias (satellite − terrestrial) of –84 plants ha−1 (IQR = 76; Figure S1). Terrestrial sampling in ravinala-dominated land yielded a substantially higher median density of 116 plants ha−1 (IQR = 88; Table 1). Of the terrestrially sampled ravinala, only one plant was identified as R. grandis, while the remaining plants (n = 122) belonged to R. madagascariensis.
Density and structural properties of ravinala measured in terrestrially sampled plots. The column Water adult (L) refers to free water stored in petiole bases

Table 1. Long description
A table comparing density and structural properties of ravinala plants. The table has 5 rows and 6 columns. Column headers are Density (plants ha⁻¹), Size of clonal group n adult ramets/ n sprout. juveniles, DBH adult (cm), Height adult (m), Leaves adult (n), and Water adult (L). Row labels are Min., Max., Median, and IQR. Row 1: Density, 32; Size of clonal group, 0/0; DBH adult, 17.9; Height adult, 4.2; Leaves adult, 4; Water adult, 0.46. Row 2: Density, 280; Size of clonal group, 10/18; DBH adult, 38.5; Height adult, 11.9; Leaves adult, 33; Water adult, 8.03. Row 3: Density, 116; Size of clonal group, 2/5; DBH adult, 23.8; Height adult, 7.3; Leaves adult, 15; Water adult, 2.68. Row 4: Density, 88; Size of clonal group, 2/4; DBH adult, 6.9; Height adult, 1.9; Leaves adult, 6; Water adult, 3.55.
Herpetofauna
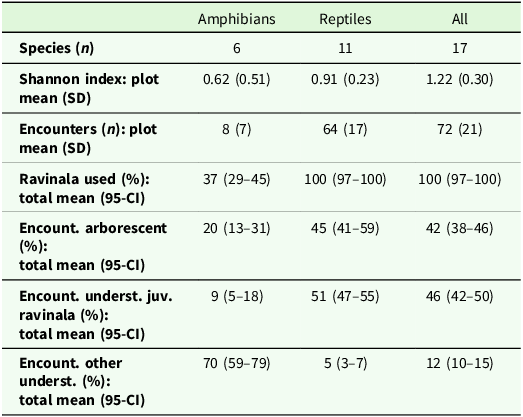
The inventory of herpetofauna resulted in 74 encounters of six amphibian species and 573 encounters of 11 reptile species (Figure 3). Species accumulation curves indicate that sampling effort was sufficient to characterise common species but did not reach saturation, specifically for reptiles (Figure S2). Cophyla occultans (9 encounters) was listed as Vulnerable and Stumpffia diutissima (38 encounters) as Critically Endangered on the IUCN Red List; 88% of all recorded species (93% of encounters) were listed as Least Concern (Table S3). All sampled units were used as habitat by herpetofauna. However, in contrast to reptiles, amphibians were rarely recorded in the arborescent compartments of ravinala and occurred predominantly in the understorey, where they were also largely absent from sprouting ravinala juveniles (Table 2).
Selected amphibian and reptile species recorded during data collection in ravinala-dominated fallow land. (a) Boophis tephraeomystax beneath the sheath margin of a ravinala petiole. (b) Heterixalus madagascariensis on a young ravinala leaf. (c) Geckolepis maculata sheltering beneath peeling pseudostem tissue. (d) Phelsuma laticauda and Phelsuma madagascariensis in the background basking on a ravinala. (e) Leioheterodon madagascariensis. (f) Subadult Lycodryas gaimardi. Images (e)–(f) © Florentine Romial.

Herpetofauna species richness and encounter distribution in ravinala. The row Ravinala used (%) indicates the proportion of sampled units used by amphibians and reptiles as habitat, either within arborescent compartments (roots, pseudostem, petioles and leaves) or in the understorey within a 2 m radius, including sprouting juvenile ravinala. The rows Encount. arborescent (%), Encount. underst. juv. ravinala (%) and Encount. other underst. (%) further partition encounter locations among these compartments

Table 2. Long description
A table with 7 rows and 3 columns comparing herpetofauna species richness and encounter distribution in ravinala. Column headers are Amphibians, Reptiles, and All. Row labels are Species (n), Shannon index: plot mean (SD), Encounters (n): plot mean (SD), Ravinala used (%): total mean (95-CI), Encount. arborescent (%): total mean (95-CI), Encount. underst. juv. ravinala (%): total mean (95-CI), and Encount. other underst. (%): total mean (95-CI). Row 1: Amphibians, 6; Reptiles, 11; All, 17. Row 2: Amphibians, 0.62 (0.51); Reptiles, 0.91 (0.23); All, 1.22 (0.30). Row 3: Amphibians, 8 (7); Reptiles, 64 (17); All, 72 (21). Row 4: Amphibians, 37 (29-45); Reptiles, 100 (97-100); All, 100 (97-100). Row 5: Amphibians, 20 (13-31); Reptiles, 45 (41-59); All, 42 (38-46). Row 6: Amphibians, 9 (5-18); Reptiles, 51 (47-55); All, 46 (42-50). Row 7: Amphibians, 70 (59-79); Reptiles, 5 (3-7); All, 12 (10-15).
The fitted GLMMs (Table S4, S5) indicated that amphibian species richness increased with ravinala group size (β = 0.07, SE = 0.03, p < 0.01) and was higher when the canopy of the focal ravinala was connected to another ravinala plant (β = 0.79, SE = 0.37, p = 0.03). However, class-specific pairwise contrasts revealed that the effect of canopy connectivity on amphibian species richness was marginal after adjustment for multiple comparisons (Figure 4a). Reptile species richness did not respond to either ravinala group size or canopy connectivity.
Species richness and encounter frequency of herpetofauna: (a) predicted species richness and (b) encounter frequency from GLMMs, shown on the response scale. Only explanatory variables with significant effects on either herpetofauna class in the fitted models (α = 0.05) are shown. Where an explanatory variable had no significant effect on a given class, this is indicated by dashed lines. Although the interaction between herpetofauna class and ravinala height was not supported, predicted relationships are shown separately for amphibians and reptiles for visual consistency across panels. The apparent separation of curves reflects class-specific baseline encounter rates (reptiles > amphibians) and the log-link back-transformation to the response scale, rather than different height effects between classes. P-values shown in the panels are derived from class-specific simple-effect tests based on estimated marginal means (emmeans). Full model results are provided in Table S5.

Long description
The image contains four panels with line graphs and scatter plots. Panel A shows predicted species richness of herpetofauna. The left graph in Panel A is a line graph with ravinala group size on the horizontal axis and predicted species richness on the vertical axis. The right graph in Panel A is a scatter plot with canopy connectivity on the horizontal axis and predicted species richness on the vertical axis. Panel B shows predicted encounters of herpetofauna. The left graph in Panel B is a line graph with ravinala group size on the horizontal axis and predicted encounters on the vertical axis. The middle graph in Panel B is a scatter plot with canopy connectivity on the horizontal axis and predicted encounters on the vertical axis. The right graph in Panel B is a line graph with ravinala height on the horizontal axis and predicted encounters on the vertical axis. The graphs compare reptiles and amphibians, with reptiles represented by green lines and dots, and amphibians by yellow lines and dots. The graphs show trends and relationships between the variables and the predicted species richness and encounter frequency.
A similar divergence between amphibians and reptiles was observed for encounter frequency. Amphibian encounter frequency increased with ravinala group size (β = 0.07, SE = 0.02, p < 0.01), whereas the corresponding effect for reptiles was close to zero (Figure 4b). Amphibian encounters were more than twice as frequent on plants connected to neighbouring ravinala (p = 0.02), while reptile encounters were significantly more frequent on isolated plants (p = 0.04), indicating contrasting responses of the two classes to structural connectivity. In both amphibians and reptiles, encounter frequency increased with ravinala height (β = 0.11, SE = 0.03, p < 0.001).
Mammals and birds
During the observation period, 39% (95% CI = 20–61) of camera traps installed in ravinala and 64% (95% CI = 39–84) of those installed in neighbouring trees recorded mammals and/or birds. Mammal species detected on either substrate were limited to dwarf lemurs of the genus Cheirogaleus and introduced rat species of the genus Rattus.
Dwarf lemurs (Cheirogaleus sp.) were always recorded singly in ravinala crowns, whereas up to three individuals were observed simultaneously in trees, often engaging in social behaviours (Figure S3). In 10 of 12 events, lemurs remained in ravinala crowns for less than one minute, with a maximum recorded duration of four minutes. In contrast, 29% of tree-based events exceeded one minute, with a maximum duration of 54 minutes.
Eight bird species were recorded in total. Four species were each observed once in ravinala, whereas in trees two species were recorded once and four species were recorded multiple times (Table S6). All recorded bird species were classified as Least Concern, including two endemic species, Coua cristata and Vanga curvirostris.
Visitation rates of mammals and birds were significantly lower in ravinala than in trees (ravinala/tree rate ratio = 0.11, SE = 0.08, p < 0.01). This pattern persisted in the sensitivity analysis excluding the time offset (Table S5) and was primarily driven by reduced visitation rates of lemurs and birds (birds: rate ratio = 0.10, SE = 0.11, p = 0.03; lemurs: rate ratio = 0.06, SE = 0.06, p < 0.001; Figure 5). Neither birds nor mammals increased their visitation of ravinala during periods of nectar availability.
Camera-trap visitation rates of birds and mammals in ravinala compared with trees expressed as rate ratios on a logarithmic scale, based on GLMs. P-values for birds and lemurs are derived from class-specific simple-effect tests based on estimated marginal means (emmeans). Full model results are provided in Table S5.

Discussion
In formerly forested land in north-eastern Madagascar, ravinala occurred at high densities. Using high-resolution satellite imagery, we identified a median density of four ravinala plants ha−1 across the entire study area (2,500 ha). A ground-based survey in ravinala-dominated land resulted in 116 plants ha−1.
The height of ravinala plants measured in this study was considerably lower than the mean height of ravinala reported from south-eastern Madagascar (7.3 vs 18.3 m; Ralisata et al. Reference Ralisata, Rakotondravony and Racey2015). This difference could reflect intensive local use of ravinala for construction, tool making and food (Figure S4). However, all but one sampled plant belonged to R. madagascariensis, a species that generally attains comparatively modest heights (Haevermans et al. Reference Haevermans, Hladik, Hladik, Razanatsoa, Haevermans, Jeannoda and Blanc2021). In this context, the local term ‘ravinala savanna’ aptly describes ravinala-dominated formerly forested land, which is characterised by frequent association with the C4 grass Imperata cylindrica, open canopy structure and relatively short vegetation, features commonly associated with savanna systems (Ratnam et al. Reference Ratnam, Bond, Fensham, Hoffmann, Archibald, Lehmann, Anderson, Higgins and Sankaran2011).
Free water stored in ravinala petiole bases averaged 2.7 L. Phenakospermum guyannense, another member of the Strelitziaceae with comparable morphology (Kress and Stone Reference Kress and Stone1993), is known to intercept substantial amounts of precipitation, although data on water storage in its petiole bases are lacking (Hölscher et al. Reference Hölscher, de Sá, Möller, Denich and Fölster1998). Water-filled tree holes (dendrotelmata) of comparable volume have been reported from lowland moist forest in Panama, where volumes ranged from <0.02 L to nearly 50 L (Yanoviak Reference Yanoviak1999). In contrast, water volumes in ravinala petiole bases in our study showed lower variability, ranging from 0.5 to 8.0 L.
Together, these results indicate that ravinala in formerly forested land of the study area is highly abundant, capable of storing substantial amounts of free water and may contribute to the persistence of open, savanna-like vegetation structure within an area that would otherwise be expected to support moist forest vegetation (Vieilledent et al. Reference Vieilledent, Grinand, Rakotomalala, Ranaivosoa, Rakotoarijaona, Allnutt and Achard2018).
Reptiles associated with ravinala were more species rich and more frequently encountered than amphibians. Structural properties of ravinala had little effect on reptiles; only ravinala height was positively associated with encounter frequency, most likely reflecting a simple space–use relationship. Reptiles (in particular, geckos) were shown to be abundant on ravinala elsewhere (Harmon et al. Reference Harmon, Harmon and Jones2007).
Amphibians in our sample were less species rich and frequent, although the Critically Endangered Stumpffia diutissima (IUCN 2025) was encountered 38 times. Lower amphibian diversity relative to reptiles is typical of transformed land cover but contrasts with old-growth forest (Fulgence et al. Reference Fulgence, Martin, Randriamanantena, Botra, Befidimanana, Osen, Wurz, Kreft, Andrianarimisa and Ratsoavina2022). Amphibians in our study occurred predominantly in the understorey surrounding focal ravinala plants and were only rarely recorded on adult ravinala structures or on sprouting juveniles. This spatial pattern suggests that ravinala itself provides limited habitat for amphibians in formerly forested land.
Ravinala-dominated formerly forested land is characterised by open canopy structure and consequently drier microclimatic conditions, whereas species-rich amphibian communities are typically associated with high humidity (Heinermann et al. Reference Heinermann, Rodríguez, Segev, Edmonds, Dolch and Vences2015). Our models indicated a positive effect of ravinala group size and canopy connectivity on amphibian species richness and encounter frequency. This likely reflects the dependency from humidity, as denser clonal groups and connected crowns can increase local shading and moisture retention. In contrast, free water stored in ravinala petiole bases is enclosed and does not directly provide aquatic or semi-aquatic habitat for amphibians, unlike the screw pine (Pandanus spp.), which has been shown to support amphibians in coastal rainforest in south-eastern Madagascar (Lehtinen Reference Lehtinen2002). Such enclosed water is not expected to substantially buffer microclimatic conditions, in contrast to water-filled tree holes that can reduce temperature and increase humidity (Kovács et al. Reference Kovács, Németh, Aszalós and Veres2024). Given the generally high sensitivity of amphibians to habitat degradation (Thompson and Donnelly Reference Thompson and Donnelly2018), their low representation in ravinala-dominated formerly forested land likely reflects limited habitat suitability rather than sampling constraints.
Dwarf lemurs (Cheirogaleus sp.) were the only native mammals detected by camera traps, and their visitation rates in ravinala were significantly lower than in trees. The presence of the lemur genus Cheirogaleus in the absence of other lemur species may indicate reduced habitat quality, as dwarf lemur populations, specifically Cheirogaleus major, have been shown elsewhere in Madagascar to increase under certain forms of habitat degradation, while many other lemur species decline (Narváez-Torres et al. Reference Narváez-Torres, Guthrie, Brichieri-Colombi, Razafindravelo, Jacobson, Tera, Rafidimanana, Rahasivelo, Petersen, Ramangason, Randall, McPherson, Frasier, Moehrenschlager, Holmes, Louis and Johnson2025). Although, as noted above, lemurs in our sample were identified to genus level only; therefore, we cannot with certainty assume that the findings of Narváez-Torres et al. (Reference Narváez-Torres, Guthrie, Brichieri-Colombi, Razafindravelo, Jacobson, Tera, Rafidimanana, Rahasivelo, Petersen, Ramangason, Randall, McPherson, Frasier, Moehrenschlager, Holmes, Louis and Johnson2025) apply to the Cheirogaleus sp. in our study area. Canopy openings can alter light and precipitation regimes and influence tree fruiting phenology and insect availability (Dunham et al. Reference Dunham, Razafindratsima, Rakotonirina and Wright2018; Gaoue et al. Reference Gaoue, Bassoki and Dassou2024), potentially favouring dwarf lemurs, which are primarily frugivorous but occasionally omnivorous (Geissman Reference Geissmann2003). Ravinala nectar did not appear to attract dwarf lemurs in our study area, as visitation rates did not increase during the flowering period, despite previous reports of occasional nectar foraging (Kress et al. Reference Kress, Schatz, Andrianifahanana and Morland1994) and despite more than half of the camera traps being oriented towards flowering ravinala plants which all flowered within the observation time.
Beyond food availability, tree cavities are essential for dwarf lemurs, which undergo obligate hibernation from June to October (Dausmann and Blanco Reference Dausmann, Blanco, Lehman, Radespiel and Zimmermann2016). The use of individual tree holes – a resource that ravinala lacks – is associated with more energy-efficient hibernation (Dausmann and Glos Reference Dausmann and Glos2015). Thus, although Cheirogaleus species can persist in disturbed habitats, continued declines in tree cover are likely to have severe consequences. Evidence from diademed sifakas (Propithecus diadema) in central Madagascar suggests that a tipping point may be reached when fragmented and disturbed landscapes no longer provide sufficient space and resources to sustain viable lemur populations (Irwin et al. Reference Irwin, Samonds, Raharison, Junge, Mahefarisoa, Rasambainarivo, Godfrey and Glander2019). Although lemur responses to disturbance are species-specific (Herrera et al. Reference Herrera, Wright, Lauterbur, Ratovonjanahary and Taylor2011, Schüßler et al. Reference Schüßler, Radespiel, Ratsimbazafy and Mantilla-Contreras2018), lemurs as a group are highly sensitive to habitat loss and degradation (Irwin et al. Reference Irwin, Wright, Birkinshaw, Fisher, Gardner, Glos, Goodman, Loiselle, Rabeson, Raharison, Raherilalao, Rakotondravony, Raselimanana, Ratsimbazafy, Sparks, Wilmé and Ganzhorn2010).
Our camera-trap survey was conducted within a single land parcel and with a limited number of stations, which may restrict the extent to which variability in mammal and bird visitation can be generalised across ravinala-dominated landscapes. Also, differences in detection probability between ravinala and trees cannot be excluded, as camera-trap detections are influenced by local viewshed obstruction and vegetation structure (Carswell et al. Reference Carswell, Avgar, Street, Boyle and Vander Wal2025; Moll et al. Reference Moll, Ortiz-Calo, Cepek, Lorch, Dennis, Robison and Montgomery2020). However, the smaller dimensions of ravinala and comparatively simple architecture likely resulted in a larger visible proportion of the plant per camera and reduced visual obstruction relative to more structurally complex tree crowns. This suggests that detectability may have been higher in ravinala. In addition, mammal detections were exclusively nocturnal, reducing potential bias from temperature-driven false triggers in the open ravinala canopy. Taken together, these considerations indicate that the lower visitation rates by birds and lemurs observed in ravinala may represent a conservative estimate of differences between substrates.
Bird diversity recorded by camera traps comprised eight species, which lies within the upper range reported for fallow land in north-eastern Madagascar (Martin et al. Reference Martin, Andriafanomezantsoa, Dröge, Osen, Rakotomalala, Wurz, Andrianarimisa and Kreft2021). However, only four species were recorded visiting ravinala, and visitation rates were significantly lower than in trees. In open, grassy habitats such as formerly forested fallows, tall vegetation can provide perching and foraging opportunities for birds (Fischer and Davis Reference Fischer and Davis2010). Compared with trees, however, ravinala lacks large branches and key microhabitat features such as cavities, crown deadwood and epiphytes (Larrieu et al. Reference Larrieu, Paillet, Winter, Bütler, Kraus, Krumm, Lachat, Michel, Regnery and Vandekerkhove2018, Nußer et al. Reference Nußer, Bianco, Kraus, Larrieu, Feldhaar, Schleuning and Müller2024). This structural simplicity likely limits its suitability for supporting diverse bird assemblages, as bird communities typically require greater vegetation complexity than ravinala can provide (Campos-Silva and Piratelli Reference Campos-Silva and Piratelli2021; Fischer and Davis Reference Fischer and Davis2010; Martin et al. Reference Martin, Andriafanomezantsoa, Dröge, Osen, Rakotomalala, Wurz, Andrianarimisa and Kreft2021; Verner and Larson Reference Verner and Larson1989).
Such vegetation complexity is largely attributable to crown properties of individual trees (Koller et al. Reference Koller, Kunz, Perles-Garcia and von Oheimb2025) and is known to promote biodiversity (Ishii et al. Reference Ishii, Tanabe and Hiura2004; Stein et al. Reference Stein, Gerstner and Kreft2014), particularly the diversity of endemic Malagasy species (Rajaonarimalala et al. Reference Rajaonarimalala, Korol, Andrianarimisa, Dröge, Fulgence, Grass, Kreft, Osen, Rakotomalala, Rakouth, Ranarijaona, Randriamanantena, Ratsoavina, Ravaomanarivo, Raveloaritiana, Schwab, Soazafy, Tscharntke, Wurz, Hölscher and Martin2024). The comparatively simple crown structure of ravinala therefore likely contributes to explaining its limited use by most animal groups considered in this study. As such it can hardly fulfil the role of so-called habitat trees, which disproportionately support biodiversity in otherwise simplified landscapes (Lindenmayer Reference Lindenmayer2017, Mölder et al. Reference Mölder, Schmidt, Plieninger and Meyer2020).
Conclusions
Formerly forested land in the study area is characterised by high ravinala density. Our results indicate that ravinala provides limited habitat value for most vertebrate groups in these landscapes, likely because it lacks key microhabitats and structural features that promote favourable microclimatic conditions and support activities such as nesting, sheltering and hibernation. Biodiversity in ravinala-dominated formerly forested land may therefore benefit from enrichment with trees, making these areas suitable targets for ecosystem restoration while retaining ravinala for its cultural importance and diverse utilitarian uses.
Supplementary material
The supplementary material for this article can be found at https://doi.org/10.1017/S0266467426100649.
Data availability statement
The data used in this study and all R-scripts to reproduce the results are available at Open Science Framework (https://doi.org/10.17605/osf.io/kqcm2).
Acknowledgements
We express our gratitude to the European Space Agency for providing satellite images and cordially thank Ankush Lohani, Florentine Romial, Arnold Tovohasina and Sylvanot Zafy for their indispensable help in data collection. This research was conducted under permit N°142/24/MEDD/SG/DGGE/DARNE/SCBE.Re, issued by the Direction des Aires Protégées, des Ressources Naturelles Renouvelables et des Écosystèmes, Repoblikan’i Madagasikara. This research received no specific grant from any funding agency, commercial or not-for-profit sectors.
Author contribution
YK and DH conceptualised the study. TRF and CM collected data supported by JPH, DAM and MRS. YK carried out analysis. DAM and MRS contributed to visualisation. YK and DH wrote the first draft. DH acquired funding and supervised the study. All authors contributed to the final manuscript.
Competing interests
The authors declare no conflicts of interest.






 Open access

