I. INTRODUCTION
Rare-earth based chromite perovskites RCrO3 (R = Y or La to Lu) are widely studied for the interesting fundamental science they offer and applications in various fields such as interconnect of solid oxide fuel cells, Reference Carini, Anderson, Sparlin and Nasrallah1–Reference Minh3 humidity sensors, Reference Nivot, Bernard, Lelievre, Haussome and Houivet4 and negative temperature coefficient thermistors. Reference Ngueteu Kamlo, Bernard, Lelievre and Houivet5 Several investigations on ortho-chromites reveal weak multiferroic (ferroelectric (FE) and weak ferromagnetic) features whose FE transition ranges from 470 to 523 K and magnetic order transition ranges from 115 to 290 K. Reference Serrao, Kundu, Krupanidhi, Waghmare and Rao6,Reference Bhadram, Rajeswaran, Sundaresan and Narayana7 The FE features in these chromites are expected to arise due to the local structural distortions present in the structure which break the spatial inversion symmetry and create a polar order. Reference Ramesha, Llobet, Proffen, Serrao and Rao8 Rajeswaran et al. Reference Rajeswaran, Khomskii, Zvezdin, Rao and Sundaresan9 showed that the presence of magnetic rare earth ion (R = Sm, Tm, Gd, and Er) and weak ferromagnetic nature (weak ferromagnetic interaction between R–Cr and antiferromagnetic interactions between Cr–Cr) of ‘Cr’ below Neel transition temperature could plausibly break the local symmetry and create a polar order in these materials. However, experimental investigations on certain nonmagnetic ions (R = Y or Bi or La) in the A-site orthochromites could also induce structural distortions giving rise to spin-phonon coupling below Neel temperature. Reference Sharma, Sahoo, Perez, Mukherjee, Gupta, Garg, Chatterjee and Katiyar10,Reference Tiwari, Dixit, Naik, Lawes and Rao11 Investigations on YCrO3 (YCO) reveal that it possesses a room temperature orthorhombic crystal structure with a FE Curie temperature (T C) of 473 K and an antiferromagnetic transition temperature of (Neel temperature, T N) about 140 K. Reference Serrao, Kundu, Krupanidhi, Waghmare and Rao6 The local monoclinic structure embedded in a global orthorhombic symmetry as proposed by Ramesha et al. Reference Ramesha, Llobet, Proffen, Serrao and Rao8 due to the ‘Cr’ displacement of 0.01 Å along the z-direction is responsible for the observed polar order present in the YCO. The macroscopic FE loop measurements Reference Serrao, Kundu, Krupanidhi, Waghmare and Rao6,Reference Seo and Son12 at room temperature and frequency dependent dielectric transition studies Reference Serrao, Kundu, Krupanidhi, Waghmare and Rao6,Reference Duran, Arevalo-Lopez, Castillo-Martinez, Garcia-Guaderrama, Moran, Cruz, Fernandez and Alario-Franco13,Reference Niitaka, Azuma, Takano, Nishibori, Takata and Sakata14 are in correlation with the existence of local structural distortions. Electron paramagnetic resonance across 300–510 K Reference Alvarez, Montiel, Cruz, Durán and Zamorano15,Reference Alvarez, Montiel, Cruz, Durán and Zamorano16 and low temperature phonon studies using Raman scattering Reference Sharma, Sahoo, Perez, Mukherjee, Gupta, Garg, Chatterjee and Katiyar10 reveal the presence of polar order in YCO. In addition, first principles studies Reference Serrao, Kundu, Krupanidhi, Waghmare and Rao6 suggest that the distortions related to the Y-site could lead to a weak FE/polar ordering in YCO. Even though local structural studies from neutron diffraction Reference Ramesha, Llobet, Proffen, Serrao and Rao8 support the polar order present in a YCO sample, the electrical characterization shows its polar nature is ambiguous due to the inherent conductive nature of chromates. Reference Rajeswaran, Khomskii, Zvezdin, Rao and Sundaresan9 Thus local structural distortions from neutron diffraction Reference Ramesha, Llobet, Proffen, Serrao and Rao8 and spin phonon coupling from low temperature Raman studies Reference Sharma, Sahoo, Perez, Mukherjee, Gupta, Garg, Chatterjee and Katiyar10 are more evident to understand the polar order in this compound. In this study, we explore the local structural distortions in YCO by focusing on the thermal behavior of Raman modes across the dielectric transition temperature. In particular, our experimental results and density functional theory (DFT) calculations show that the out of phase scissor mode (SM) with B3g(3) symmetry softens with the yttrium displacement and temperature.
II. EXPERIMENTAL
YCO was prepared by a sol–gel route Reference Saha, Chanda, Dutta and Sinha17 followed with slight changes of calcination (1123 K) and sintering (1373 K) for the phase formation and densification, respectively. The sintered pellets in the form of circular discs of diameter 6 and 1 mm thick were further electroded (silver paint) to carry out the dielectric measurements. The powder X-ray diffraction (XRD; PANalytical X'Pert Pro, FEI Company, Eindhoven, The Netherlands) data were recorded at different temperatures from 303 K to 573 K with Co Kα radiation (λ = 1.78901 Å). Raman spectrum was recorded at various temperatures from 303 to 623 K using a laser micro-Raman spectrometer (Senterra, Bruker Corporation, Karlsruhe, Germany) with an excitation source of 532 nm. The dielectric properties of YCO were measured by using a Wayne Kerr 6500B impedance analyzer (Wayne Kerr Electronics, West Sussex, United Kingdom) in the frequency range 500 Hz to 1 MHz, at various temperatures.
III. RESULTS AND DISCUSSION
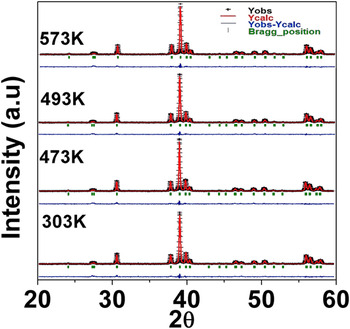
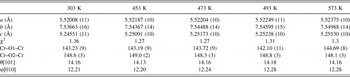
Rietveld refinements were performed using ‘Full proof’ software. Reference Rodrigues-Carvajal18 The refined patterns revealed that YCO exhibits a single phase with an orthorhombic Pnma space group in the measured temperature range 303–573 K (Fig. 1). The refinement data along with the octahedral tilt angles (or rotation) calculated in the [101] and [010] axes Reference Weber, Kreisel, Thomas, Newton, Sardar and Walton19 are provided in Table I. Our structural studies with temperature show that the changes in tilt angles associated with modification in the average bond angles Cr–O1–Cr (O1—apical oxygen) from 143.23° to 144.69°. This change in bond angles and tilt angles of the CrO6 octahedra is crucial for the structural transformation of YCO. Reference Zhou, Alonso, Pomjakushin, Goodenough, Ren, Yan and Cheng20 However, within the limitations of the conventional powder diffraction studies and the refinement studies, the minimal change suffered by the bond angles and tilt angles observed does not capture the local structural inhomogeneity across the phase transition temperature. Hence, the powder pattern corresponds to an average orthorhombic symmetry from 303 K to 573 K. Raman scattering studies, which are sensitive to such local structural distortions, were utilized to analyze the phonon modes with temperature.
Rietveld refinement on high temperature XRD patterns for YCrO3 recorded from 303 to 573 K.

Lattice parameters, bond angles obtained from Rietveld refinement, and tilt angles calculated from the atomic positions.

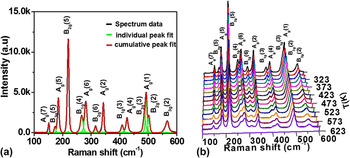
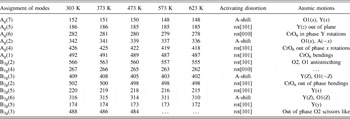
Conventionally, the structural distortions in pervoskites are attributed to various atomic phenomena like (i) rotation of CrO6 octahedra, (ii) displacement of cations, and (iii) Jahn–Teller (JT) distortion. Reference Weber, Kreisel, Thomas, Newton, Sardar and Walton19 Since the Cr3+ cation in YCO is a non-JT cation, Reference Weber, Kreisel, Thomas, Newton, Sardar and Walton19 the presence of such a distortion could be ignored. Thus, the Raman modes observed due to octahedra rotation/tilt or due to Y-cation shift with temperature could be the key to understand the structural distortions in YCO. The experimental analysis of the Raman spectrum obtained at different temperatures was performed using the “Fityk” software. Reference Wojdyr21 The spectrum reveals the presence of 14 modes out of 24 possible Raman modes for the Pnma space group, and these modes are fitted with the Voigt profile (see Fig. 2(a) for 303 K). The observed spectrum is in excellent agreement with the available literature. Reference Weber, Kreisel, Thomas, Newton, Sardar and Walton19,Reference Udagawa, Kohn, Koshizuka, Tsushima and Tsushima22–Reference Abrashev, Bäckström, Börjesson, Popov, Chakalov, Kolev, Meng and Iliev24 The normalized intensity (I/I max) of individual Raman spectrum recorded at temperatures ranging from 303 to 623 K is shown in Fig. 2(b). The temperature-dependent Raman studies show a reduction in the normalized intensity of certain modes like B1g(3), B2g(6), B2g(2), B1g(4), B3g(3), and B3g(5). However, Ag(2), Ag(4), Ag(1), B3g(2), B1g(4), B1g(3), B2g(5), B2g(6), and B3g(3) modes suffer a lower wave number shift with temperature which can be seen in Fig. 2(b) and the magnitude of shift can be observed from Table II.
(a) Raman spectrum at room temperature (303 K) fitted with a Voigt function using the Fityk software, (b) temperature dependence of Raman modes with normalized intensity I/I max from 303 to 623 K.

Raman modes of YCrO3 at different temperatures.

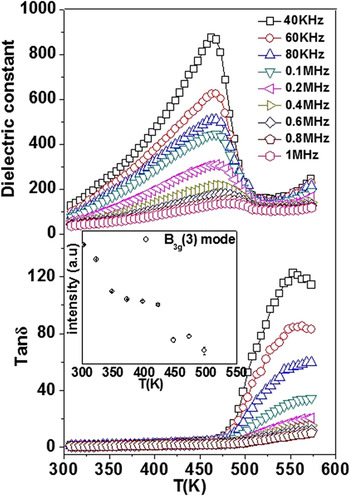
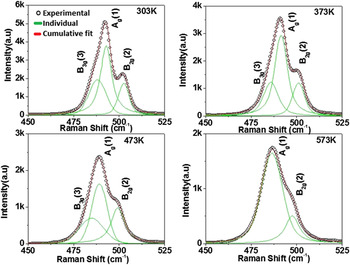
The dielectrical studies are carried out for YCO ceramics which exhibits a frequency dependent behavior with the T max shifting from 468 to 483 K within the measured frequency range (low frequencies are not shown here) from 40 kHz to 1 MHz (Fig. 3). From the previous studies on electrical measurements, it is observed that the dominance of conductivity in YCO leads to a non-FE conclusion. Reference Rajeswaran, Khomskii, Zvezdin, Rao and Sundaresan9 In certain materials, it is plausible for the inhomogeneous contribution of conducting grain and grain boundaries having the mixed effect of Maxwell Wagner (MW) and intrinsic dipolar effect Reference Catalan, O’Neill, Bowman and Gregg25 where the inherent nature is masked by the MW effect. Thus the ambiguity on local structural distortion and its reflection on dielectric phase transformation prevails. However, in the case of YCO, experimental studies like Raman were used instead of macroscopic electrical measurements such that it could reveal the local structural distortions. From Raman studies, it is observed that one of the Raman modes, i.e., B3g(3), shows softening features across the same temperature range where the dielectric transition was observed (inset of Fig. 3). It is worth mentioning that earlier studies have shown the out of phase SM B3g(3) to be responsible for the spin-phonon coupling below T N. Reference Sharma, Sahoo, Perez, Mukherjee, Gupta, Garg, Chatterjee and Katiyar10 Our study further shows that this mode completely disappears at higher temperatures. Due to the weak nature of this SM arising from the “out-of-phase O2 scissors-like motion”, the observed Raman intensities are weak. However, the close association of the SM with the CrO6 bending [Ag(1)] and the out-of-phase bending of the same [B2g(2)] could be observed from the fitting as shown in Fig. 4. But as we decrease the temperature, this SM mode is isolated from Ag(1) until room temperature. However, the observed effect was weak due to the presence of distortions at local scale, and as mentioned earlier the measurements of macroscopic polarization of YCO ceramics were always dominated by the conductive nature from our dielectric and previous reports in the literature. Reference Serrao, Kundu, Krupanidhi, Waghmare and Rao6,Reference Rajeswaran, Khomskii, Zvezdin, Rao and Sundaresan9 Hence, to get deeper insights into the microscopic origin and to understand the behavior of SM, we used DFT calculations using plane-wave pseudo potentials as implemented in the Quantum Espresso code. Reference Giannozzi, Baroni, Bonini, Calandra, Car, Cavazzoni, Ceresoli, Chiarotti, Cococcioni, Dabo, Dal Corso, de Gironcoli, Fabris, Fratesi, Gebauer, Gerstmann, Gougoussis, Kokalj, Lazzeri, Martin-Samos, Marzari, Mauri, Mazzarello, Paolini, Pasquarello, Paulatto, Sbraccia, Scandolo, Sclauzero, Seitsonen, Smogunov, Umari and Wentzcovitch26
Dielectric phase transition with temperature (inset) shows the intensity of the B3g(3) behavior with temperature.

Deconvolution of Raman modes at different temperatures through voigt fitting (black circles—experimental data, green—individual fit, and red—cumulative fit).

As YCO is known to be a G-type antiferromagnet, we performed spin dependent calculations enforcing antiferromagnetic interaction between the neighboring Cr3+ ions. All our calculations involved orthorhombic super cells containing 20 atoms and ultra-soft pseudopotentials within the generalized gradient approximation (GGA) for electron correlations were used. A plane wave cutoff of 25 Ry and a density cutoff of 240 Ry were used in our calculations, and the Brillouin zone integration was performed with a uniform 4 × 4 × 4 Monkhorst–Pack k-point grid. The system was completely relaxed with the unit cell parameters constrained to the experimental values at 303 Κ and the same was used even to structures corresponding to high temperature phase, since we did not see any significant changes in the lattice parameters in XRD over the entire temperature range that we have studied here. Our relaxed structures showed that the minimum energy configuration corresponds to the low-symmetry monoclinic structure and the antiferromagnetic state is favorable over the ferromagnetic state, consistent with the previous works. Reference Serrao, Kundu, Krupanidhi, Waghmare and Rao6,Reference Ray and Waghmare27 To compute phonon frequencies, previous studies have used a cubic super cell approach with the YCO unit cells doubled along the 〈111〉 direction. Reference Ray and Waghmare27 Such approach has the advantage of tremendously reducing the computational demand by effectively reducing the number of irreducible representations due to the higher cubic symmetry. However, in this present work, we have used an orthorhombic supercell containing four units of YCO and ensure the antiferromagnetic ordering of Cr3+ magnetic moments in our starting structures. Using an orthorhombic supercell also gives the advantage to obtain the phonon frequencies with the same symmetry as the experiment and facilitates direct comparison of the results.
As DFT is a ground state theory, we mimic the temperature effect by taking an orthorhombic supercell of YCO in which the Cr–O1–Cr and Cr–O2–Cr angles are fixed at 143.2 and 148.6° (consistent with the XRD experiments), and gradually distort it by either tilting the octahedra or by the Y-cation displacement. Further, we emphasize here that even though the displacement of Y cation can simulate the effect of temperature, it is difficult to quantify the exact value of temperature for a given displacement. However, a qualitative understanding of the B3g SM as the cation is displaced from its equilibrium position is possible. All our structures showed phonon instability close to −200 cm−1. It is worth mentioning that relaxing the structure takes the ground state of the system far from the experimentally observed bond angles and tilts which leads to the reduction of local symmetry to centrosymmetric 2/m from the actual mmm point group observed in our X-ray diffraction measurements. However, even in the relaxed structure, phonon instabilities are observed close to 100 cm−1. Since, our un-relaxed distorted structures are close to the experimental structures, we present our results for the same.
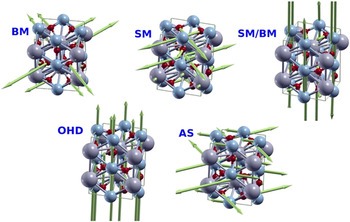
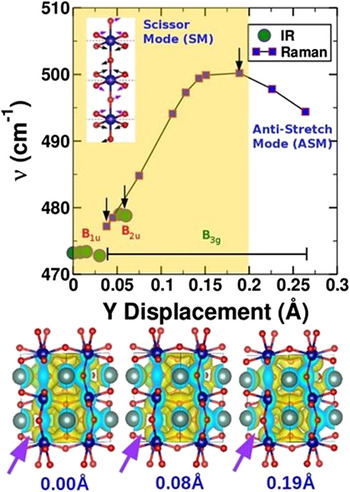
Raman frequencies computed for the octahedral distortion in the range 142°−143.3° for Cr–O1–Cr and keeping Cr–O2–Cr angle at 148.6° did not show any signature of out-of-phase SM but predominantly revealed a bending mode (BM). However, the displacement of Y cation with Cr–O1–Cr and Cr–O2–Cr angles frozen at 143.2 and 148.6°, respectively, showed very interesting features. It should be noted that the highly distorted and undistorted (zero displacement) systems correspond to the low and high temperature limits, respectively. Since we use an orthorhombic supercell containing 20 atoms, we have a total of 60 phonon modes out of which only 24 are Raman active corresponding to the D2h symmetry of the mmm point group. The spectrum of YCO shows a wide variety of phonon modes, which can be related to either stretching or bending modes. In the present discussion, we will be, however, focusing on the SM in which the planar oxygens of CrO6 octahedra move in the form of scissor action. Since the octahedra are tilted with respect to the crystallographic plane, we find several forms of SMs throughout the phonon spectrum of YCO; for example, (i) two in-plane oxygens, (ii) two out-of-plane oxygens, (iii) in-plane oxygens with 90° phase difference between neighboring octahedral, (iv) out-of-plane oxygens with 90° phase difference between neighboring octahedra, and so on. These modes either exist alone or in combination with the bending mode; the cation displacement or distortion of the octahedra and schematic of these modes are shown in Fig. 5. Since our Raman experiments showed disappearance of B3g SM, in this study we will be focusing on the SM in which the phase difference between the scissors on adjacent octahedra is 180°, along with CrO6 octahedral tilt (Fig. 6 inset). Since the octahedron is tilted, among the four planar oxygen atoms, we will have one pair of oxygen atoms above and another pair below the crystallographic plane (marked red dashed line in Fig. 6 inset) as compared to the un-tilted structure in which all the four atoms are in the same crystallographic plane. Thus, we see 180° rotation of scissors while going from one octahedron to another. In case of the highly symmetric undisplaced structure (above T c), we see that this SM corresponds to the B1u symmetry with a wave number of 473.2 cm−1 and is Raman inactive. As the Y ion is displaced, the SM converts into a BM with the same symmetry before it crosses scissor mode–bending mode (SM/BM) which has a B3g symmetry (please see Table SI provided in the Supplementary Material). The cross-over points where the SM becomes BM are marked as down arrows. Upon further displacement, the BM and SM/BM cross each other by swapping their symmetry leading to SM/BM and SM with symmetries B1u and B3g, respectively. As the Y cation is displaced further, the SM crosses B2u and B3u modes before it disappears by converting into the antistretching (AS) mode at the extreme of cation disorder (corresponding to low temperature). It should be noted here again that the SM converts into a BM when it crosses both B2u and B3u modes. We further looked at the corresponding electron densities of these structures and found that the Y displacement leads to a non-uniform charge delocalization between the upper and lower CrO6 octahedra (Fig. 6 bottom panel). This clearly reveals that the local structural distortions in YCO due to changes in the B3g(3) behavior across the dielectric transition could be the key to understand the origin of the polar nature of YCO. It is worth mentioning here that such temperature-dependent distortions and their effect on phonon behavior can as well be studied using ab-initio molecular dynamics simulations. However, a supercell approach containing multiple unit cells in each direction would be required for the accurate prediction of such properties and, we relegate such calculations to a future work.
Schematic of different modes AS—antistretching, OHD—octahedral displacement, BM—bending mode, and SM—scissors mode.

Behavior of the B3g SM with yttrium displacement in YCO as computed from DFT calculations. Y-cation displacements of 0.0 and 0.3 Å correspond to higher and lower limits on the temperature scale, respectively. Raman and IR active modes are shown, respectively, as blue squares and green circles. Also shown in the plot is the symmetry of the mode. The SM represents the B1u symmetry in a completely ordered structure and hence is not Raman active at high temperatures. At the extremum of disorder (very low temperatures), the mode converts into antistretch mode (ASM). The cross-over points between the SM with other phonon modes are marked as black arrows where the SM transforms into a BM. The inset shows the SM that is being characterized. The red dashed line represents a crystallographic plane to show oxygen atoms above/below the plane and arrows represent the direction of forces. The atoms with arrows marked in magenta are above the plane and those in black below the plane, leading to 180° phase shift. The lower panel shows the charge density isosurfaces for 0.0, 0.08, and 0.19 Å displacements. The magenta arrows show the change in charge delocalization between Y and one of the planar oxygen atoms as the Y cation is displaced.

IV. CONCLUSIONS
In summary, high temperature (303–573 K) Raman spectroscopy studies were performed to understand the local structural distortions with temperature in YCO. The out-of-phase SM with the B3g(3) symmetry showed an anomalous behavior observed with temperature. Our DFT calculations and experiments show that the out-of-phase SM with the B3g(3) symmetry softens, and the CrO6 rotation (or tilt) does not lead to any changes in the B3g(3) Raman mode. The disappearance of the Raman active B3g(3) mode above the dielectric transition temperature is due to the transformation of SM into Raman inactive mode of the B1u symmetry. This local symmetry change is expected to arise due to the Y cation displacement, leading to change in phonon modes. Our calculations also suggest that the isolated and anomalous behavior of this B3g(3) mode at lower temperatures could be due to the conversion of SM to AS mode at extreme Y cation displacement. The local nature of the distortion in the unit cell is reflected in the experimental Raman studies.
Supplementary Material
To view supplementary material for this article, please visit https://doi.org/10.1557/jmr.2017.5.
Supplementary information provides Table SI containing the detailed description of phonon modes with a function of Y displacement.
ACKNOWLEDGMENTS
Authors V.M. and R.R. would like to acknowledge MHRD, Govt of India and DST No. SERB/F/5142/2013-14/ for financial support to carry out the research. We also thank S. Gascoin for her help in XRD measurements. Partial support from LAFICS and CNRS is also acknowledged. We thank Asst. Prof. P. Padhan and Prof. J. Kreisel for helpful discussions. RRN thanks DST for financial support and computational facilities under TUE-CMS, J.C. Bose fellowship under the grant DST691 for the financial support, Prof. S. Ramasesha for the computing facilities and Dr. Anusooya Pati and Dr. Diptikanta swain for useful discussions.