Nomenclature
Roman letters
-
 $a$
-
Absorption coefficient, m-1
-
$D$
-
Effective diffusion coefficient, m2/s
-
$b_{nuc}^ * $
-
Normalised radical nuclei concentration, particles ×10-15/kg
-
${G_b}$
-
Generation of turbulence kinetic energy due to buoyancy, kg/(m·s3)
-
${G_k}$
-
Generation of turbulence kinetic energy due to the mean velocity gradients, kg/(m·s3)
-
$I$
-
Radiation intensity which depends on position (
$\vec r$
) and direction (
$\vec s$
), W/(m2·sr) -
$k$
-
Turbulent kinetic energy, m2/s2
-
$n$
-
Refractive index, sr-1/2
-
$p$
-
Pressure, Pa
-
${R_{soot}}$
-
Net rate of soot generation, kg/(m3·s)
-
$R_{nuc}^ * $
-
Normalised net rate of nuclei generation, particles ×10-15/(m3·s)
-
$S$
-
Strain rate tensor, s-1
-
$t$
-
Time, s
-
$T$
-
Temperature, K
-
$v$
-
Velocity, m/s
-
${Y_{NO}}$
-
NO mass fraction, kg/kg
-
${Y_{soot}}$
-
Soot mass fraction, kg/kg


Greek Letters
-
${\delta _{ij}}$
-
Kronecker delta function
-
$\varepsilon $
-
Turbulent dissipation rate, m2/s3
-
$\mu $
-
Dynamic viscosity, Pa·s
-
${\mu _t}$
-
Turbulent viscosity, Pa·s
-
$\rho $
-
Density, kg/m3
-
$\sigma $
-
Stefan-Boltzmann constant, =5.669×10⁻⁸W/(m2·K4)
-
${\sigma _k}$
-
Turbulent Prandtl numbers for
$k$
-
${\sigma _{nuc}}$
-
Turbulent Prandtl number of nuclei transport
-
${\sigma _s}$
-
Scattering coefficient, m-1
-
${\sigma _{soot}}$
-
Turbulent Prandtl number for soot transport
-
${\sigma _\varepsilon }$
-
Turbulent Prandtl numbers for
$\varepsilon $
-
$\Phi $
-
Phase function
-
${\Omega ^{'}}$
-
Solid angle, sr


Sub-Superscripts
-
${\rm{ - }}$
-
Favre mean (density-averaged) variable
-
$ \to $
-
Vector
-
$3$
-
Diffuser inlet section
-
$4$
-
Flame tube outlet section


1.0 Introduction
The thrust-to-weight ratio is a critical performance metric for aero-engines. The primary methods for enhancing the thrust-to-weight ratio of an aero-engine involve increasing specific thrust and reducing engine weight. Increasing specific thrust necessitates enhancing the combustor’s temperature-rise capability. An increase in the combustor’s temperature rise leads to a substantial increase in the total fuel-to-air ratio (FAR). A direct consequence of a high FAR is the increase in the equivalence ratio in the primary combustion zone. To reduce visible smoke emissions, the average equivalence ratio in this zone must be kept below 1.4, which increases the airflow in the primary combustion zone [Reference Kress, Taylor and Dodds1]. Increased airflow in the primary combustion zone reduces the equivalence ratio under both high-load and low-load conditions, leading to higher air velocity. Consequently, this worsens the lean blow-out performance of the combustion chamber [Reference Donald and Clifford2] and compromises critical functions such as start-up and high-altitude reignition [Reference Bahr3]. In summary, as the FAR increases, the design of future high-temperature rise (HTR) combustion chambers must not only meet the requirements for suppressing visible smoke under high load conditions but also ensure lean blow-out performance under low load conditions.
In addition, due to the combustion organisation requirements of high FARs in HTR combustion chambers, more air is involved in the combustion process, which inevitably reduces the amount of air available for dilution and flame tube cooling [Reference Jin4]. However, the reduced dilution air leads to a deterioration in the temperature distribution quality at the combustion chamber outlet, and the reduced cooling air for the flame tube poses a significant challenge to its cooling, as HTR corresponds to high thermal load on the flame tube [Reference Hou5, Reference Lin, Xu and Liu6]. In summary, the design of future HTR combustion chambers must not only achieve higher quality temperature distribution at the outlet but also adopt more effective flame tube cooling methods.
Staged partitioning compound combustion is recognised as a crucial direction for addressing challenges based on relevant domestic and international literature. Central staged combustion and multi-swirl fuel-rich dome have been proven feasible in various studies [Reference Kress, Taylor and Dodds1, Reference Donald and Clifford2, Reference Mongia7–Reference Mongia12]. Therefore, this study applies the principles of central staged combustion and multi-swirl fuel-rich dome to the design of the new HTR combustion chamber. Furthermore, the diffuser component design employs an annular curved-wall expanding-angle flow-facing design method [Reference Wang13] that minimises total pressure loss and facilitates manufacturing. The design of the primary and dilution hole components adopts an inverted right-angled trapezoidal cylindrical structure that enhances the jet penetration depth and improves the capabilities of the primary and dilution holes. This structure is a simplified version of the intake scoop-type structure [Reference Wang14]. The flame tube cooling hole component design employs a multi-inclined hole cooling method [Reference Lin, Xu and Liu6] that significantly improves the cooling effect. The converging section of the flame tube uses a convex arc flow-facing design method [Reference Wang15] suitable for increased combustion air and dome height. Ultimately, this new HTR combustion chamber achieves the design requirement of a more uniform outlet temperature distribution on the basis of increased combustion chamber outlet temperature.
2.0 Research gaps and contributions
In HTR combustion chambers, the dome structure plays a crucial role in the flow field and combustion within the chamber. As a result, scholars both domestically and internationally have focused on the investigation of swirler characteristic parameters, including non-structural parameters such as rotational direction combinations and structural parameters like swirl angle, blade number, inner-to-outer radius ratio and swirler stage number. A literature review revealed that research on swirler stage number is rare, while studies on other swirler characteristic parameters are more abundant. For example, Weiwei Gao et al. [Reference Gao, Li and Gao16] investigated the effects of different rotational direction combinations and swirl angles in a triple-stage swirler on the combustion performance of a central staged combustion chamber. Xinxian Dang et al. [Reference Dang, Zhao and Xu17] studied the impact of swirl number changes in a double-stage axial swirler on the airflow structure and aerodynamic characteristics within a model annular combustor, by adjusting the blade installation angle in both cold and hot conditions. Reddy et al. [Reference Reddy, Reddy and Varaprasad18] investigated the effect of swirl number on the recirculation zone at the combustion chamber head by adjusting the swirler blade angles. Khandelwal et al. [Reference Khandelwal, Lili and Sethi19] examined the effects of different blade angles and blade numbers on swirler performance. However, for HTR combustion chambers, especially for HTR central staged combustion chambers, the influence of swirler stage number is critically important.
In view of the combustion organisation requirements of the central staged combustor, which requires the staging of both air and fuel, the number of swirler stages should be at least two. Furthermore, when the number of swirler stages reaches four, the swirling airflow and fuel distribution control become more complex. Issues such as airflow interference and uneven fuel distribution are more likely to occur, subsequently affecting overall performance. Moreover, due to the limited space at the head of the combustion chamber, researchers rarely employ swirlers with four or more stages when exploring the performance of HTR central staged main combustors. This paper systematically investigates the performance differences of multi-swirl fuel-rich dome designs with varying swirler stages (i.e. double-stage and triple-stage swirlers) in the combustion chamber, thus filling a gap in this area of research.
For a higher FAR with a designed value of 0.037, this paper innovatively integrates novel methods (including the design of annular curved-wall expanding-angle flow-facing and convex-arc flow-facing) and advanced structures (including the inverted right-angled trapezoid cylindrical structure and multi-inclined cooling holes) with the staged-partitioning compound combustion concept (including central staged combustion and multi-swirl fuel-rich dome), and designs a new HTR central-staged main combustor. While ensuring the consistency of the structural dimensions of components including the diffuser, casing, cowl, combustor liner and various holes, numerical simulations of this new HTR combustor with different multi-swirl fuel-rich dome schemes are conducted under two operating conditions of takeoff and idle. By analysing the performance differences between the two schemes, the optimal multi-swirl fuel-rich dome design was selected to meet the requirements of the HTR combustor. This solution effectively suppresses visible smoke at high-load conditions while ensuring lean blowout performance at low-load conditions. Additionally, it achieves superior outlet temperature distribution quality and a more efficient flame tube cooling method, providing valuable insights for the design of future combustors with higher FARs.
3.0 Methodology
3.1 Numerical model
3.1.1 Reynolds-averaged Navier-Stokes method
This study employs ANSYS Fluent software to conduct three-dimensional numerical simulations of the two HTR combustor designs. Essentially, all flow phenomena of Newtonian fluids adhere to the governing laws defined by the Navier-Stokes (N-S) equations [Reference Wang20]. For multi-species flow systems involved in combustion, the conservation of mass is divided into the total mass conservation and the individual species mass conservation [Reference Huang, Lin and Fan21]. The Reynolds-averaged Navier-Stokes (RANS) approach is adopted to time-average the N-S equations, whereby the instantaneous flow field is decomposed into the sum of mean and fluctuating quantities. The time-averaged N-S equations are expressed as:
 \begin{align}\frac{\partial }{{\partial {x_j}}}\left( {\rho {u_i}{u_j}} \right) = - \frac{{\partial p}}{{\partial {x_i}}} + \frac{\partial }{{\partial {x_j}}}\left[ {\mu \left( {\frac{{\partial {u_i}}}{{\partial {x_j}}} + \frac{{\partial {u_j}}}{{\partial {x_i}}} - \frac{2}{3}{\delta _{ij}}\frac{{\partial {u_k}}}{{\partial {x_k}}}} \right)} \right] + \frac{\partial }{{\partial {x_j}}}\left( { - \rho \overline {u_i^{'}u_j^{'}} } \right) \end{align}
called RANS equations. Compared with the original N-S equations, the RANS equations introduce a Reynolds stress term
 $ - \rho \overline {u_i^{'}u_j^{'}} $
. Typically, Boussinesq’s hypothesis is applied to establish a relationship between
 $ - \rho \overline {u_i^{'}u_j^{'}} $
and the mean velocity gradients. This transformation turns the problem of resolving
 $ - \rho \overline {u_i^{'}u_j^{'}} $
into the determination of turbulent viscosity
 ${\mu _t}$
. Furthermore,
 ${\mu _t}$
can be obtained by solving for the turbulence kinetic energy
 $k$
and the turbulence dissipation rate
 $\varepsilon $
. At the same time, the transport equations for
 $k$
and
 $\varepsilon $
are also solved to close the RANS equations. Specifically, the specific expression of Boussinesq’s hypothesis is as follows [Reference Hinze22]:
 \begin{align} - \rho \overline {u_i^{'}u_j^{'}} = {\mu _t}\left( {\frac{{\partial {u_i}}}{{\partial {x_j}}} + \frac{{\partial {u_j}}}{{\partial {x_i}}}} \right) - \frac{2}{3}\rho k{\delta _{ij}} \end{align}
3.1.2 Turbulence model
In this study, the Realisable k-ε (RKE) two-equation turbulence model, derived based on the Boussinesq’s hypothesis and suitable for strong swirling flow, was employed in Fluent calculations. The modeled transport equations for
 $k$
and
 $\varepsilon $
in the RKE model are [Reference Wang, Li and Lin23]
 \begin{align}\frac{{\partial \left( {\rho k{u_j}} \right)}}{{\partial {x_j}}} = \frac{\partial }{{\partial {x_j}}}\left[ {\left( {\mu + \frac{{{\mu _t}}}{{{\sigma _k}}}} \right)\frac{{\partial k}}{{\partial {x_j}}}} \right] + {G_k} + {G_b} - \rho \varepsilon \end{align}
and
 \begin{align}\frac{{\partial \left( {\rho \varepsilon {u_j}} \right)}}{{\partial {x_j}}} = \frac{\partial }{{\partial {x_j}}}\left[ {\left( {\mu + \frac{{{\mu _t}}}{{{\sigma _\varepsilon }}}} \right)\frac{{\partial \varepsilon }}{{\partial {x_j}}}} \right] + \rho {C_1}S\varepsilon - \rho {C_2}\frac{{{\varepsilon ^2}}}{{k + \sqrt {v\varepsilon } }} \end{align}
3.1.3 Discrete phase model and combustion model
This study utilises the Discrete Phase Model (DPM) for simulating fuel spray, employing the concept of parcels and the algorithm of O’Rourke [Reference O’Rourke24] for collision and aggregation processes. The fragmentation process incorporates the K-H/R-T (Kelvin-Helmholtz/Rayleigh-Taylor) [Reference Beale and Reitz25, Reference Patterson and Reitz26] model. The DPM uses the Euler-Lagrangian method to simulate the interaction between the liquid phase and the gas phase [Reference Wang, Li and Lin23]. This model is based on two crucial postulates: first, the density of the discrete phase particles is substantially larger than that of the continuous phase; second, the interaction among particles can be disregarded. By defining the initial particle size distribution at the nozzle outlet, the DPM can significantly reduce the enormous computational burden caused by simulating two-phase flows, while effectively simulating the size, distribution and evaporation of liquid droplets in the downstream flow core region of the nozzle. The DPM model settings of the two combustion chambers are shown in Fig. 1. For the pilot-stage injection, a uniform droplet diameter of 0.04 mm was employed, while the main-stage injection utilised a slightly finer droplet size of 0.03 mm, both following a uniform distribution to simplify computational demands. Additionally, the vaporisation temperature was defined as 341 K, and the boiling point was set to 477 K. To capture pressure-temperature coupling effects, the model activated both Pressure Dependent Boiling and Temperature Dependent Latent Heat.
DPM model settings of two combustion chambers.

Since fuel and air enter the reaction zone in separate phases, characteristic of non-premixed diffusion combustion, this study employs a non-premixed probability density function (PDF) combustion model based on chemical equilibrium assumptions. This model simplifies the thermochemical process of fuel combustion to a mixing problem involving fuel, oxidiser and intermediate species. Notably, it requires solving only the mixture fraction transport equation rather than individual species transport equations to determine thermochemical states. Instantaneous parameters including species mass fractions and temperature are uniquely determined by the mixture fraction [Reference Wang, Li and Lin23, Reference Zhou27]. The entire reaction system includes 11 species, namely C12H23, CH4, CO, CO2, H2O(g), H2O(l), H2, O2, N2, C(s) and OH.
3.1.4 Radiation model
The discrete ordinates (DO) model is chosen for radiation calculation in this paper, and the radiation model requires solving the radiation transfer equation (RTE). The RTE for an absorbing, emitting and scattering medium at position
 $\vec r$
in the direction
 $\vec s$
is:
 \begin{align}\frac{{dI\left( {\vec r,\vec s} \right)}}{{ds}} + \left( {a + {\sigma _s}} \right)I\left( {\vec r,\vec s} \right) = a{n^2}\frac{{\sigma {T^4}}}{\pi } + \frac{{{\sigma _s}}}{{4\pi }}\int_0^{4\pi } I \left( {\vec r,{{\vec s}^{'}}} \right)\Phi \left( {\vec s \cdot {{\vec s}^{'}}} \right)d{\Omega ^{'}} \end{align}
where
 $\vec r$
= position vector,
 $\vec s$
= direction vector,
 ${\vec s^{'}}$
= scattering direction vector,
 $s$
= path length. The DO model considers the RTE in the direction
 $\vec s$
as a field equation. Thus, Equation (5) is written as
 \begin{align}\nabla \cdot \left( {I\left( {\vec r,\vec s} \right)\vec s} \right) + \left( {a + {\sigma _s}} \right)I\left( {\vec r,\vec s} \right) = a{n^2}\frac{{\sigma {T^4}}}{\pi } + \frac{{{\sigma _s}}}{{4\pi }}\int_0^{4\pi } I \left( {\vec r,{{\vec s}^{'}}} \right)\Phi \left( {\vec s \cdot {{\vec s}^{'}}} \right)d{\Omega ^{'}} \end{align}
The DO model settings in this paper are shown in Fig. 2. Theta (polar angle) and Phi (azimuthal angle) are divided into two divisions each. This ensures sufficient directional coverage while avoiding excessive computational cost from higher divisions (e.g. 4 × 4). The single directional bin per division (Theta pixels = 1, Phi pixels = 1) simplifies spatial integration under the assumption of uniform radiative intensity within each angular sector.
DO model settings.

3.1.5 Emission models
Currently, it is generally believed that there are three main mechanisms for the formation of NOx in combustion: thermal, prompt and fuel. Among them, fuel-NOx refers to the oxidation reaction of nitrogen compounds in the fuel during the combustion process, resulting in the generation of NOx. In this paper, aviation kerosene is used as the fuel, with the molecular formula C12H23, meaning there are no nitrogen compounds in the fuel. Therefore, NOx emissions are modeled using the thermal and prompt NOx models [Reference Wang, Li and Lin28]. For thermal and prompt NOx mechanisms, only the NO species transport equation is needed:
 \begin{align}\nabla \cdot \left( {\rho \vec v{Y_{NO}}} \right) = \nabla \cdot \left( {\rho D\nabla {Y_{NO}}} \right) + {S_{NO}} \end{align}
The source term
 ${S_{NO}}$
is to be determined next for different NOx mechanisms. The formation of thermal NOx is determined by a set of highly temperature-dependent chemical reactions known as the extended Zeldovich mechanism [Reference Wang29]. Prompt NOx is mainly generated in the fuel-rich zone with high hydrocarbon content and low oxygen concentration [Reference Wang, Li and Lin23].
Soot emissions are modeled using a two-step model [Reference Wang, Li and Lin23], where the stoichiometry for fuel combustion, with the fuel being C12H23, is set to 3.4012. In the one-step Khan and Greeves model [Reference Khan, Greeves, Afgan and Beer30], ANSYS Fluent solves a single transport equation for the soot mass fraction:
 \begin{align}\nabla \cdot \left( {\rho \vec v{Y_{soot}}} \right) = \nabla \cdot \left( {\frac{{{\mu _t}}}{{{\sigma _{soot}}}}\nabla {Y_{soot}}} \right) + {R_{soot}} \end{align}
The two-step Tesner model [Reference Tesner, Snegiriova and Knorre31] predicts the generation of radical nuclei and then computes the formation of soot on these nuclei. ANSYS Fluent therefore solves transport equations for two scalar quantities: the soot mass fraction (Equation (8)) and normalised radical nuclei concentration:
 \begin{align}\nabla \cdot \left( {\rho \vec vb_{nuc}^ * } \right) = \nabla \cdot \left( {\frac{{{\mu _t}}}{{{\sigma _{nuc}}}}\nabla b_{nuc}^ * } \right) + R_{nuc}^ * \end{align}
To enhance clarity, a structured flowchart of the numerical models described in Section 3.1 is presented in Fig. 3.
Flow chart of numerical models.

3.2 Structural and aerodynamic design of combustor components
3.2.1 Key parameters of both combustors
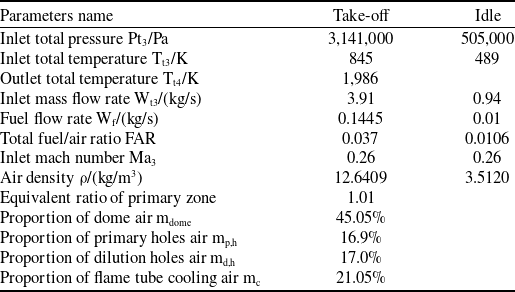
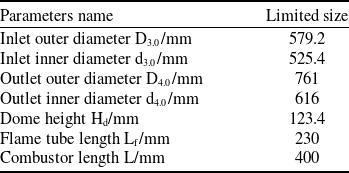
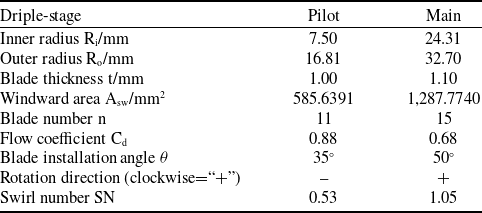
This paper investigates two HTR centre-staged combustion chambers with different multi-swirl rich-fuel dome designs, differing only in the structure of the swirler components, while the other components remain consistent. The HTR combustion chambers in this paper are all designed as annular combustion chambers, each with 20 domes. The study focuses on a single-dome combustion chamber, which differs from conventional combustion chambers in that it allows more air to enter from the dome, thereby increasing the proportion of combustion air. Tables 1 and 2 present the aerodynamic and structural parameters of the single-dome HTR centre-staged combustion chamber, respectively [Reference Wang, Li and Lin23, Reference Wang32].
3.2.2 Structural models of both combustors
The structures of the HTR triple-swirler and double-swirler combustion chambers are illustrated in Fig. 4. In both cases, the flame tube is cooled by effusion cooling [Reference Lin, Xu and Liu6], with a hole diameter of 0.7 mm and an inclination angle of 22°. The holes are arranged in a pattern of elongated rhombuses, with the flow hole spacing,
 $s$
, equal to the lateral hole row spacing,
 $p$
, as shown in Fig. 5. The upper wall of the flame tube is designed with 44 rows, each row containing 24 uniformly distributed holes, while the lower wall is designed with 47 rows, each row containing 16 uniformly distributed holes. Compared with conventional slot-type film cooling, the cooling effect of the effusion cooling is significantly improved, and it can save 40% of the cooling air volume [Reference Ballal and Lefebver33]. Moreover, the temperature gradient of the combustor liner wall with this cooling method is small, which is beneficial for extending the lifespan of the combustor liner [Reference Colladay34].
The dome cooling adopts the straight-hole impingement cooling method [Reference Wang32], as shown in Fig. 6. The hole pattern consists of double rows arranged in a concentric circular pattern intersecting in the circumferential direction, with 72 uniformly distributed holes in each row. The adjacent holes are spaced at a circumferential angle of 2.5°, and the cooling hole diameter is 0.8626 mm.
Aerodynamic parameters of single-dome HTR combustor

Structural limit size of single-dome HTR combustor

Structural models of two HTR central staged combustors.

Schematic diagram of cooling hole arrangement of flame tube.

Arrangement of cooling holes in the dome.

The primary and dilution holes employ an ‘inverted right-angled trapezoidal cylindrical structure’, as illustrated in Fig. 7. This structure represents a simplified modification of the intake scoop-type configuration [Reference Wang14], which extends a specified distance into the combustor liner, enhancing the penetration depth of transverse jets. It aids in truncating the recirculation zone by the transverse jets of the primary holes and contributes to the formation of a combined structure with the swirl flow at the dome to create the recirculation zone. Simultaneously, it contributes to the effective adjustment of the temperature distribution at the combustion chamber outlet by the transverse jets of the dilution holes, suitable for scenarios involving increased combustion air and increased dome height. As shown in Fig. 8, in the single-dome combustion chamber, both the primary and dilution holes are four in number, with two on the upper wall and two on the lower wall, and a hole diameter of 13 mm. The primary and dilution holes are arranged in a circumferentially uniform, staggered pattern along the single side wall of the combustor liner. On the same cross-section, the upper and lower walls also exhibit this staggered arrangement, as illustrated in Fig. 8 [Reference Wang32].
Structure of primary and dilution holes.

Circumferential distribution of primary and dilution holes.

The diffuser of the combustion chamber designed in this paper adopts the annular curved-wall expanding-angle flow-facing design method with small total pressure loss and easy processing, as shown in Fig. 9 [Reference Wang13]. The key to this method is that both the inlet and outlet sections of the pre-diffuser are perpendicular to the direction of the airflow, and the average radius of the inlet of the cowl and the centre streamline of the outlet airflow of the pre-diffuser are both located on the central axis of the combustion chamber, ensuring smooth air intake for the cowl. This method is simple and quick to design, with its two-dimensional geometric structure consisting of straight-line segments and circular-arc segments, making it easy to process. In addition, the sudden expansion diffuser designed using this method will not produce separation vortices in the pre-diffuser section as shown in Fig. 10, resulting in low total pressure loss coefficient (TPLC) and high static pressure recovery coefficient.
Annular curved-wall expanding-angle flow-facing design method.

Annular straight-wall expanding-angle axisymmetric design method.

The converging section of the flame tube in the combustion chamber designed in this paper adopts the’“convex arc flow-facing design’ scheme [Reference Wang15] suitable for increasing the combustion air, as shown in Fig. 11. The increase in dome height can easily lead to the presence of inflection points on the upper wall curve of the flame tube designed using the Vitosinski Law or constant velocity gradient law, as shown at point P in Fig. 12, which can easily cause deformation. It has been verified that the convex arc flow-facing design scheme results in higher combustion efficiency, lower pollution emissions, a more uniform outlet flow field, better quality of outlet temperature distribution and is easier to process and design, with better durability.
Convex arc flow-facing design method of flame tube convergence section.

Comparison of two design laws in convergent sections with upper wall surface curves.

3.2.3 Swirler structure and air distribution
In conventional combustors, the air-liquid ratio (ALR) of the swirl cup decreases as the total FAR increases, as illustrated in Fig. 13 [Reference Lin, Lin and Zhang35]. When the total FAR is 0.037 or greater, the ALR falls below the optimal atomisation threshold. Furthermore, experimental findings regarding swirl cup atomisation indicate that an ALR exceeding 3∼4 can satisfy the criteria for effective atomisation at the design point [Reference Lefebvre36], aligning with the conclusion drawn in Fig. 13. Consequently, the conventional combustor’s swirl cup structure fails to meet the design specifications when the total FAR is 0.037.
Relation between the total FAR of the normal combustor and the ALR of the dome swirl cup.

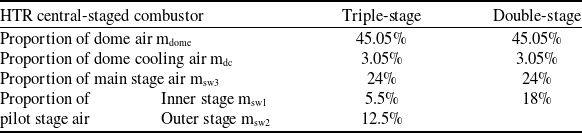
Two centre-staged combustion chambers, applying the partitioning combustion theory, have been designed: the HTR triple-swirler and double-swirler combustion chambers, as illustrated in Fig. 14(a) and (b), respectively. The pilot stage of the triple-stage swirler is composed of two-stage axial swirlers, while the pilot stage of the double-stage swirler consists of one-stage axial swirler, i.e. the pilot stage eliminates the venturi tube structure. The dome air volume allocation of the two different HTR centre-staged combustors is presented in Table 3.
Air distribution at the dome of the both combustors

Structure of both triple-stage and double-stage swirlers.

Both the triple-swirler and double-swirler combustion chambers are equipped with two stages of fuel injection. Taking the triple-stage swirler as an example, as shown in Fig. 15, the pilot combustion stage fuel nozzles all adopt dual-orifice centrifugal nozzles. Specially, they are supplied by the secondary fuel circuit at low operating conditions and by the primary fuel circuit or both the primary and secondary fuel circuits simultaneously at high operating conditions, with a spray cone angle of 90°. The main combustion stage fuel nozzles all adopt air-atomising direct injection nozzles, with 15 nozzles uniformly distributed along the circumference. Each nozzle is located between adjacent blades of the main combustion stage swirler, with an injection angle of 90°, effectively utilising multi-point injection and air-atomising nozzles to improve exhaust smoke [Reference Zhang, Zhang and Xu37].
Main and pilot stage nozzles of swirler and partition schematic.

At low operating conditions, only the pilot combustion stage nozzles supply fuel, forming a locally rich fuel combustion zone in the primary zone, addressing the issue of lean blowoff and ensuring combustion stability [Reference Liu, Lin and Yuan38]. At high operating conditions, both the main and pilot combustion stage nozzles supply fuel simultaneously, with a dome equivalence ratio of less than 1.4, meeting the requirement to suppress visible smoke.
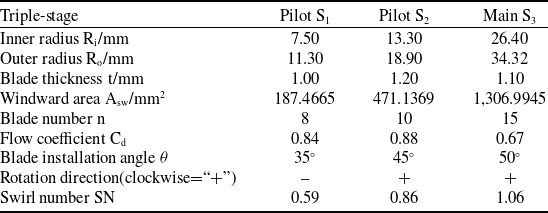
Structural parameters of triple-stage swirler

Structural parameters of double-stage swirler

The swirl number (SN) of an axial swirler is defined by the following equation:
 \begin{align}SN = \frac{2}{3}\left[ {\frac{{1 - {{\left( {\frac{{{R_i}}}{{{R_o}}}} \right)}^3}}}{{1 - {{\left( {\frac{{{R_i}}}{{{R_o}}}} \right)}^2}}}} \right]\tan \theta \end{align}
In preliminary calculations, the TPLC for the flame tube component in the designed combustion chamber was found to be 3.5%. Initial values of the flow coefficient for each stage of swirlers were set to 0.84.
The formula for windward area is as follows:
 \begin{align}{A_{sw}} = \pi \left( {{R_o}^2 - {R_i}^2} \right) - nt\left( {{R_o} - {R_i}} \right)/\cos \theta \end{align}
and if there is no extension at the outlet of swirler, the exit geometric flow area can be expressed by the following formula:
 \begin{align}{A_s} = {A_{sw}} \cdot \cos \theta \end{align}
and the formula for mass flow is as follows:
 \begin{align}m = {C_d}\sqrt {2\rho \Delta P} {A_s} \end{align}
In the above equations,
 ${R_o}$
represents the outer radius of the swirler,
 ${R_i}$
represents the inner radius of the swirler,
 $n$
represents the number of blades,
 $t$
denotes the blade thickness,
 $\theta $
denotes the blade installation angle and
 ${C_d}$
denotes the flow coefficient.
Based on the Equations (10) to (13), the structural parameters of the triple-stage and double-stage swirlers were ultimately determined through multiple iterations, as shown in Tables 4 and 5.
Fuel ratio of the pilot combustion stage fuel nozzle is [Reference Bahr3]
 \begin{align}\frac{{\phi * {f_{idle}}}}{{{f_{SLTO}}}} \end{align}
where
 $\phi $
represents the scaling factor,
 ${f_{idle}}$
and
 ${f_{SLTO}}$
represent the FARs under the idle and sea-level take-off (SLTO) conditions, respectively. It is calculated that the fuel ratios for the main stage and the pilot stage are 70% and 30%, respectively.
To enhance clarity, the component designs described in Section 3.2 are systematically presented in a structured flowchart (Fig. 16).
Structural and aerodynamic design of combustor components.

4.0 Grids meshing and boundary conditions
4.1 Geometric model and grid meshing
This study utilised software, including NX and ICEM CFD, to conduct structural design and mesh generation for two types of HTR central staged combustion chambers. The computational domain includes a swirler, a pre-diffuser, inner and outer bifurcated channels and a flame tube. The combustor geometry presents significant challenges, including dense effusion cooling holes, intricate multi-stage swirler internal passages, and a convex arc flame tube convergent section. Tetrahedral meshes were selected for their superior adaptability to non-manifold topologies, sharp corners and small-scale features, eliminating the need for manual blocking/sweeping workflows that risk human error. Considering the complexity of the combustion chamber structure and the limitations of the working computer’s performance, according to the structural characteristics and topological features of different regions, a domain decomposition strategy was adopted, which is convenient for searching and error correction. Taking the HTR triple-swirler combustion chamber as an example, the periodic boundaries on both sides of the computational domain were removed for the convenience of observation. As shown in Fig. 17(a), it is the domain decomposition carried out through the interface pair, and Fig. 17(b) shows the correspondingly generated grid. Figure 18 shows the grids on the periodic boundaries of the two combustion chambers, and it can be seen that they are basically completely consistent. The circled part in Fig. 18(a) is magnified to obtain Fig. 19, which shows the grids of the cooling holes of the combustor liner, the cooling holes of the dome, and the area near the boundary of the dome wall surface. In view of the fact that the structures of only the swirler components in the two HTR combustion chambers are inconsistent, the grids of the swirler components are separately compared and displayed, as shown in Fig. 20. In this paper, the quality index in the ICEM CFD software is selected as the grid quality evaluation index. As shown in Fig. 21, the global grid quality is greater than 0.3, which meets the requirements.
Structural partitioning and corresponding grid generation.

Grid display on the periodic boundary of two combustion chambers.

GCI values for TPLC across the combustor

Enlarged diagram of the circled part.

Grid display of swirler components in two combustion chambers.

Global grid quality in computational domain.

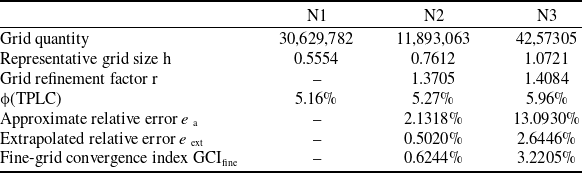
The simulations in this paper were performed on a workstation equipped with an AMD EPYC 7742 64-core processor, 256 GB DDR4 RAM, and an NVIDIA Quadro P2200 GPU. The hardware configuration ensured efficient parallel computation for large-scale meshes and multi-physics coupling, while the GPU was primarily utilised for post-processing visualisation. In this paper, the Grid Convergence Index (GCI) [Reference Celik, Ghia and Roache39] is selected to conduct the grid independence verification. Specifically, as shown in Table 6, they are the GCI values for TPLC across the combustor. It can be seen from Table 6 that the number of grids in Group N2 is 61.2% less than that in Group N1, the computational cost is greatly reduced, and the GCIfine is 0.6244%, which meets the standard.
In this paper, three schemes with different numbers of grids in Table 6 were adopted. Figure 22 shows the comparison of the radial distribution of the axial velocity at the centre of the recirculation zone of the three schemes in the cold state. As can be seen from Fig. 22, the degree of recirculation at the centre of the recirculation zone increases with the increase of the grid density. The circumferential average axial velocity of the finest grid (N1) scheme at this position is -3.8 m/s, the circumferential average axial velocity of the N2 scheme is -3.4 m/s, and that of the N3 scheme is -1.1 m/s. Therefore, considering the computational cost and accuracy requirements comprehensively, the N2 scheme is more feasible. That is, grid independence is achieved when the velocity distribution shows negligible variation with further grid refinement.
4.2 Boundary conditions and solution methods
In numerical calculations, air is treated as an incompressible ideal fluid. The inlet section of the combustor adopts the mass-flow-inlet boundary condition, while the outlet section of the combustor is set as the outflow boundary condition. The lateral walls throughout the fluid domain of the single-dome combustion chamber are all subjected to rotational periodic boundary conditions, with the reference pressure point positioned at the centre of the inlet section of the combustor. Both the outlets of the two turbine cooling air and the casing and diffuser walls are set as adiabatic no-slip walls, while the other walls are set as radiating walls. The external emissivity is set to 0.8, and the internal emissivity is set to 0.7. Specifically, the external radiation temperature is set to the design point temperature of 845 K. The intake flow rates of the dome (including all stages of swirlers and head cooling holes) and flame tube walls (including the primary holes, dilution holes, and flame tube effusion cooling holes) are obtained through flow coupling calculations. Table 7 shows the specific settings of the boundary conditions in Fluent.
Comprehensive table of boundary conditions

Comparison of the axial velocity distributions among the three sets of schemes.

The solver employs the SIMPLE (semi-implicit method for pressure-linked equations) [Reference Wang40] method for pressure-velocity coupling. For spatial discretisation of the governing equations, the gradient is computed using the Green-Gauss cell-based method, and pressure interpolation is performed using the standard method. For the remaining governing equations, including momentum and energy, a second-order upwind differencing scheme is applied.
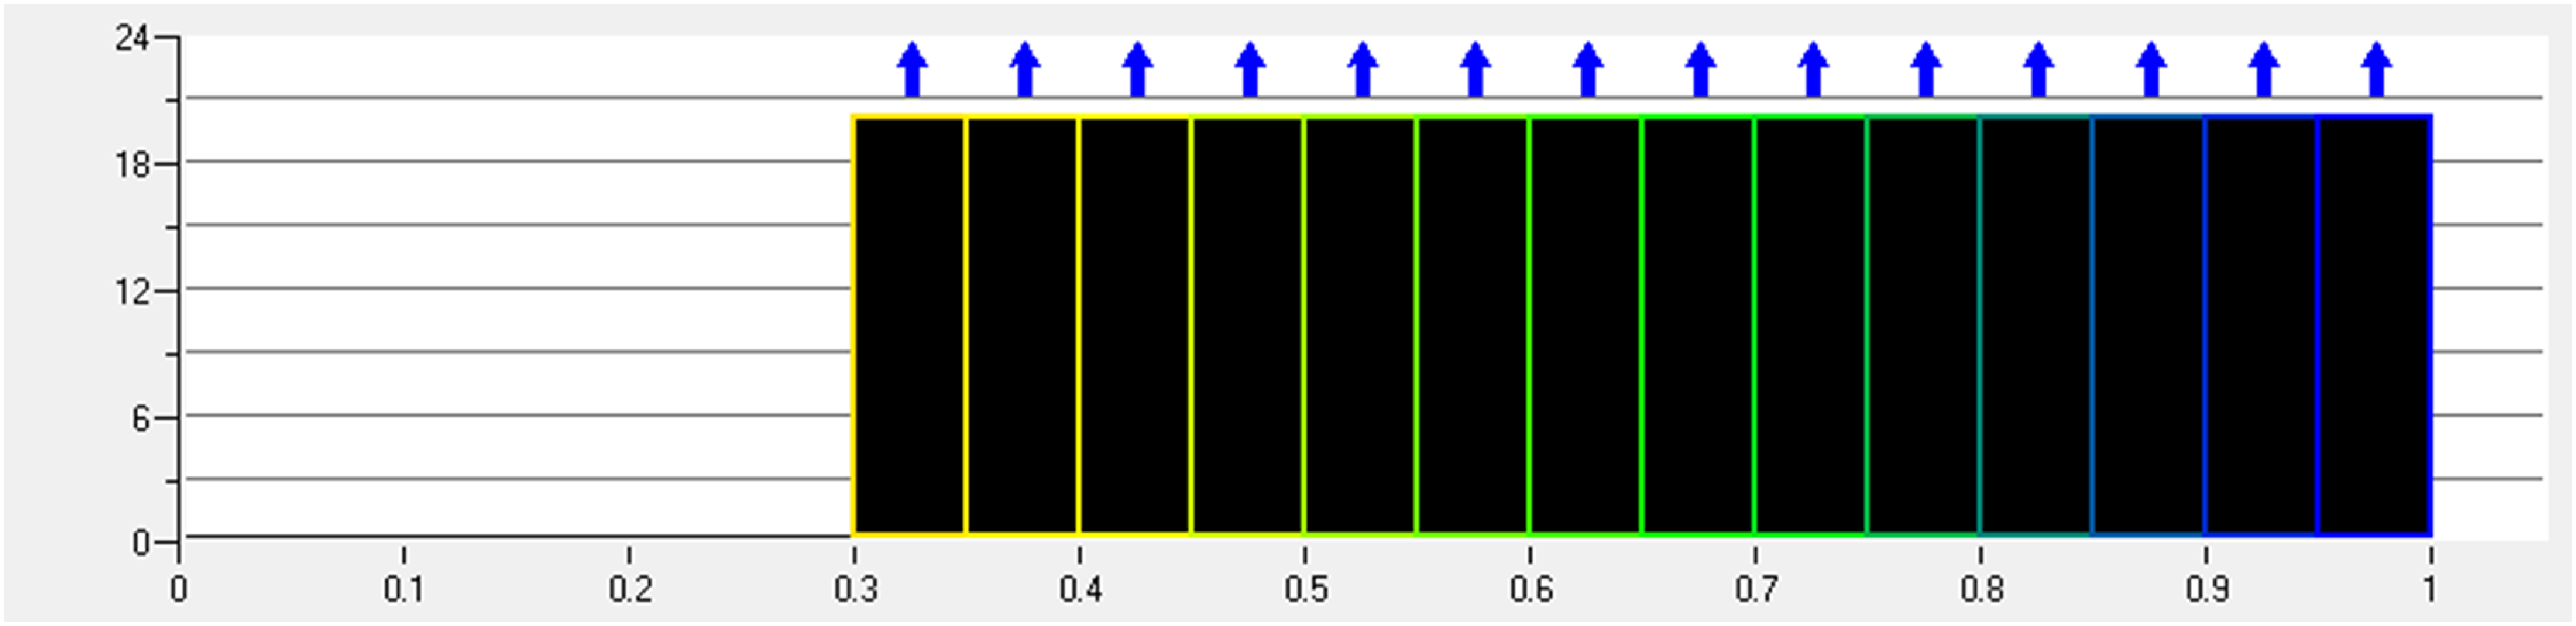
During computation, the residuals of monitored data and key flow field information vary with iteration steps. Monitored data include the average velocity at the centre of the recirculation zone, mean and maximum temperatures at the flame tube outlet and average total pressure. The convergence criteria for various residuals are shown in Fig. 23, and the monitored data variation within 100 iterations to be within 1%.
Convergence criterion of each residual.

4.3 Simulation accuracy evaluation
Targeting a single annular HTR main combustion chamber [Reference Gao, Li and Gao16, Reference Gao41–Reference Shang, Gao and Guo45], as shown in Fig. 24, similar to the one in this paper and previously studied by our research group, we used the same mathematical model as the one designed in this paper to perform steady-state simulations of the three-dimensional turbulent two-phase reaction flow with backflow. Additionally, we compared the simulation results of this combustion chamber with corresponding experimental performance data.
Modeling of single annular HTR main combustion chamber [Reference Gao41].

As shown in Fig. 25, the comparison between the simulation results and the experimental results of the influence of the inlet Mach number of the combustion chamber on the total pressure recovery coefficient at cold state reveals that the total pressure recovery coefficient decreases with the increase of the inlet Mach number. The trends of the two are consistent and similar, but the simulated value is slightly lower than the experimental value, differing by approximately 1.4% at the design point.
Effect of inlet Mach number on the total pressure recovery coefficient [Reference Gao41].

Combustion efficiency
 ${\eta _c}$
for the full annular combustor was measured using a gas analysis system, and the impact of the universal criterion
 $\theta $
on
 ${\eta _c}$
is illustrated in Fig. 26. The definition formula for the universal criterion of combustion efficiency is as follows:
 \begin{align}\theta = \frac{{{P_{t3}}^{1.75}{{\rm{e}}^{\frac{{{T_{t3}}}}{{300}}}}}}{{{W_{{\rm{a}}3}}}} \end{align}
Universal characteristic curve of combustion efficiency [Reference Gao41].

Figure 26 shows that combustion efficiency
 ${\eta _c}$
increases with the universal criterion
 $\theta $
. When the universal criterion
 $\theta $
exceeds 0.8, combustion efficiency
 ${\eta _c}$
approaches 100%. At the design point of the combustor (
 $\theta $
=2.388), Fig. 26 indicates that the experimental combustion efficiency is nearly 100%, while the simulation shows 99.80%. This indicates good agreement between numerical calculations and experimental results. Therefore, for higher inlet parameters (pressure, temperature, etc.), the non-premixed PDF combustion model yields reliable combustion efficiency in numerical calculations.
Figure 27 shows the outlet temperature distribution characteristics obtained from component tests. Here,
 ${S_{OTDF}}$
represents the severity index of the combustion chamber operating point. The overall temperature distribution factor (OTDF), referred to as the hot spot indicator, is an indicator of the outlet temperature quality. OTDF is the ratio of the difference between the maximum temperature
 ${T_{4max}}$
at the combustor outlet and the average value
 ${T_{4ave}}$
to the temperature rise (
 ${T_{4ave}} - {T_{3ave}}$
) in the combustor. Additionally, the OTDF value in Fig. 27 represents the average in the single-dome sector region. The expressions for
 ${S_{OTDF}}$
and OTDF are as follows:
 \begin{align}{S_{OTDF}} = {\left( {\frac{{{T_{t3}}}}{{828.9}}} \right)^{ - 1.1}}{\left( {\frac{{\Delta {T_{4 - 3}}}}{{943.3}}} \right)^{ - 0.3}}{\left( {\frac{{{W_{3c}}\sqrt {{T_{t3}}} }}{{458.3{P_{t3}}}}} \right)^{ - 0.5}} \end{align}
and
 \begin{align}OTDF = \frac{{{T_{4max}} - {T_{4ave}}}}{{{T_{4ave}} - {T_{3ave}}}} \end{align}
Effect of severity index SOTDF on OTDF value [Reference Gao41].

In Equation (16),
 $\Delta {T_{4 - 3}}$
represents the temperature rise across the combustion chamber (
 ${T_{4ave}} - {T_{3ave}}$
), and
 ${W_{3c}}$
denotes the available air quantity for the entire annular main combustion chamber. Since the turbine cooling air does not participate in combustion, the available air quantity is defined as the difference between the air flow rate at the combustion chamber inlet and the turbine cooling air flow rate.
At the design condition of the combustor (SOTDF = 0.97), Fig. 27 shows that the experimental OTDF value was 0.16, while the simulated OTDF value was 0.168. The numerically calculated OTDF value is evidently close to the experimental value from the component test.
Figure 28 compares the average radial temperature distribution factor (RTDF) curves obtained from numerical simulation and component experiments. RTDF is the ratio of the difference between the radially averaged outlet temperature distribution value
 ${T_{4avc}}$
of the combustion chamber along the circumference and the average gas temperature
 ${T_{4ave}}$
at the outlet, to the difference between the average gas temperatures at the inlet and outlet. This can be expressed as:
 \begin{align}RTDF = \frac{{{T_{4avc}} - {T_{4ave}}}}{{{T_{4ave}} - {T_{3ave}}}} \end{align}
and the RTDF value is determined as the peak calculated value along the radial height on the RTDF curve. Figure 28 shows that the simulated RTDF curve closely matches the experimental results, except for a notable deviation near the flame tube wall. This difference is likely due to sidewall radiation and heat conduction affecting the thermocouple during the experiment, resulting in an underestimated experimental value.
Comparison of the nondimensional radial temperature distribution curves on the outlet of the combustor [Reference Gao41].

Overall, the comparison between experimental and simulation data suggests that the simulated results have a certain level of credibility. The mathematical models selected in this paper can be effectively used for combustor design and predicting combustion performance. References (Reference Li, Shang and Cheng46, Reference Li, Cheng and Shang47) confirmed that using thermal and prompt NOx emission models is suitable for predicting NOx emissions in the combustion chamber, allowing for comparisons of NOx emission levels under various types of combustion chambers and operating conditions.
5.0 Calculation results analysis
5.1 Total pressure loss coefficient
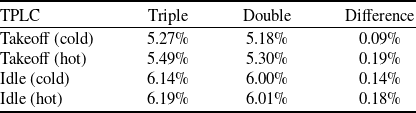
Table 8 shows the calculated TPLC values for the triple-swirler and double-swirler HTR central staged combustors under various operating conditions in both cold and hot states. Figure 29 illustrates the establishment of 10 cross-sections with a 20 mm spacing between adjacent points, taking the central axis of the flame tube as the X-axis and the intersection point of the swirler outlet cross-section with the central axis of the flame tube as the zero point. Due to the inclination of the combustion chamber, the initial seven cross-sections before the dilution holes are oriented perpendicular to the central axis of the flame tube, while the final three cross-sections are perpendicular to the central axis of the annular combustor. In the calculations, the outlet cross-section of the flame tube is considered as the 11th cross-section. The total pressure’s calculated value is derived from the mass-weighted average of the surface integral on each cross-section. Figures 30 and 31, respectively, depict the comparison of total pressure variations between the triple-swirler and double-swirler combustors under takeoff and idle conditions.
According to Table 8, the TPLCs for both combustors are less than 6% under takeoff conditions and less than 7% under idle conditions. However, under idle conditions, the TPLC is greater than that under takeoff conditions. This is because the inlet Mach number,
 $Ma$
, of the combustor changes little with the engine conditions, and the primary factor causing the variation in TPLC is the Reynolds number,
 $Re$
. An increase in
 $Re$
leads to a decrease in TPLC, and since the air flow, pressure and temperature vary under different conditions,
 $Re$
changes accordingly. Furthermore, the TPLC during combustion is greater than that without combustion. This is because, apart from the fact that the total pressure loss of the diffuser is essentially the same, the total pressure loss during the hot state of the flame tube exceeds the total pressure loss during the cold state by an additional heating total pressure loss.
TPLCs for cold and hot fields

Selection of cross sections.

Table 8 shows that the TPLC of the triple-swirler combustor is greater than that of the double-swirler combustor under both take-off and idle conditions, regardless of whether it is in a cold or hot state. This difference is attributed to the triple-swirler combustor having an additional stage of swirler at the dome, which enhances the shearing and atomisation processes, resulting in a higher degree of fuel-air mixture and thus a greater total pressure loss from turbulent mixing. Additionally, the difference in TPLCs between the two combustors is greater in the hot state than in the cold state under the same operating condition. This is due to the significant increase in flow velocity and turbulence intensity downstream of the flame front, leading to an amplification of the turbulent mixing loss in the original cold-state total pressure loss due to combustion heating.
Comparison of total pressure between triple-swirler and double-swirler combustors under takeoff conditions.

Figures 30 and 31 demonstrate that the total pressure along the flow path inside the flame tube of the triple-swirler combustor is consistently lower than that of the double-swirler combustor, irrespective of whether it is under takeoff or idle conditions. Moreover, the difference in total pressure between the two combustors is more significant for the takeoff condition than for the idle condition.
Comparison of total pressure between triple-swirler and double-swirler combustors under idle conditions.

5.2 Velocity distribution and back-flow region
Figure 32 shows the velocity streamline maps at the centre section of the HTR triple-swirler and double-swirler combustors under take-off and idle conditions. Moreover, Fig. 32 shows that in the triple-swirler combustor, the entire airflow from the first swirler of the pilot combustion stage and most of the airflow from the second swirler form the recirculation zone. A smaller portion of the airflow from the second swirler of the pilot combustion stage and the entire airflow from the swirler of the main combustion stage flow downstream next to the recirculation zone. In the double-swirler combustor, most of the airflow from the pilot combustion stage swirler forms the recirculation zone. A smaller portion of the airflow from the pilot combustion stage swirler and the entire airflow from the main combustion stage swirler flow downstream next to the recirculation zone. In conclusion, both combustors have two separate flow streams within the primary zone. The inner stream is the recirculation flow, forming the recirculation zone, and the outer stream is the circumferential flow, surrounding the recirculation flow. Additionally, both combustors form a stable swirling cup recirculation zone, but the upper and lower vortices are not symmetrical. This asymmetry is caused by the circumferential uniform cross arrangement of the primary holes on the upper and lower walls of the flame tube, leading to different circumferential positions where the transverse jet interrupts the recirculation zone. Furthermore, both combustors form a central recirculation zone with recirculation and circumferential flow, and corner recirculation zones between the dome and the flame tube wall. The high-temperature flue gas in the corner recirculation zones preheats the gas mixture and acts as a stable ignition source, ensuring combustion stability. Additionally, the high velocity gradient and turbulence intensity at the interface of the corner recirculation zone and the circumferential flow enhance the thorough mixing of the fuel-air mixture.
Velocity flow diagrams of two combustion chambers under different operating conditions.

Under take-off conditions, a vertical section P is taken at the centre of the recirculation zone in the combustion chamber perpendicular to the central axis of the flame tube. Taking the triple-swirler combustor as an example, as shown in Fig. 33, section P intersects with the central axis L of the flame tube at point O, which is located 3/4 along the axial position from the pilot stage nozzle to the primary holes. The velocity distribution on vertical section P of both triple-swirler and double-swirler combustors is shown in Fig. 34, with the curve of absolute velocity variation along the radial height after circumferential averaging depicted in Fig. 35. Figures 34 and 35 show that the radial height of the recirculation zone in the triple-swirler combustor is greater, and the radial velocity distribution is fuller and more symmetrical. Figure 36(a) and (b) depict the 3D shapes of the recirculation zones in both types of combustors under take-off conditions, with the left images being front views and the right images being right-side views from the outflow direction. The contours of the recirculation zones on the central section in Figs 36(a) and (b) are compared in Fig. 37. Figure 36(a) and (b) show that the 3D shapes of the recirculation zones in both the triple-swirler and double-swirler combustors are overall torch-shaped. At the top of the torch, there are three indentations resembling a half-closed hand with four fingers together, marked as ‘1’, ‘2’, and ‘3’ in Fig. 36(a). This is caused by the inconsistent circumferential positions of the transverse jets from the primary holes on the upper and lower walls of the flame tube, which cut off the recirculation zone. By comparison, the indentations ‘2’ and ‘3’ in the triple-swirler combustor are deeper than those in the double-swirler combustor, while indentation ‘1’ is shallower. This difference is due to the different pilot stage structures in the two types of combustors. Further comparison of Figs 36 and 37 reveals that, in both axial length and radial height, the central recirculation zone of the triple-swirler combustor is larger than that of the double-swirler combustor. Additionally, the torch-shaped flare angle of the central recirculation zone in the triple-swirler combustor is greater. Overall, the central recirculation zone in the triple-swirler combustor is fuller and more symmetrical compared to that in the double-swirler combustor. The reason for this, as shown in Tables 4 and 5, is that the swirl numbers of both the inner and outer swirlers in the pilot stage of the triple-swirler combustor are greater than those in the double-swirler combustor. Consequently, the tangential velocity and pressure gradient in the pilot stage swirl of the triple-swirler combustor are greater. From the perspective of recirculation generated by swirls, it is evident that the airflow rotation in the pilot stage of the triple-swirler combustor is relatively stronger and extends radially deeper, making it easier to generate a fuller and more symmetrical recirculation zone.
Velocity distribution of triple-swirler combustor under takeoff conditions.

Comparison of velocity distribution on vertical section P under takeoff conditions.

Comparison of mean radial velocity distribution in the centre section of back-flow region under takeoff conditions.

Comparison of the three-dimensional morphology of the back-flow region of two combustion chambers under takeoff conditions.

Comparison of back-flow region in the centre section under takeoff conditions.

5.3 Fuel and temperature distribution on the central section
The uniform and rapid mixing of fuel and air is crucial for achieving efficient and stable combustion. Figures 38 and 39 compare the fuel distribution in the central section of the two types of combustors under take-off and idle conditions, respectively. As shown in Figs 38 and 39, the fuel-air mixing process in the triple-swirler combustor is faster and more uniform than in the double-swirler combustor, regardless of take-off or idle conditions. This is because the pilot stage fuel in the triple-swirler combustor is better atomised by the shearing action of two counter-rotating swirls. The main stage fuel is enveloped by two co-rotating swirls, with the outer swirl of the pilot stage and the main stage swirl rotating in the same direction. This not only strengthens the flow field in the primary zone and improves combustion stability but also enhances the atomisation of the main stage fuel and the mixture of fuel with air. A high-speed shear layer is formed at the lip of the main stage nozzle to further atomise the fuel.
Comparison of fuel distribution under takeoff conditions.

Comparison of fuel distribution under idle conditions.

To characterise the effectiveness of fuel-air mixing, this paper uses the sectional fuel content (i.e. fuel proportion) as an indicator for quantitative analysis. Considering that the atomisation and mixing of fuel by high-pressure air in the combustion chamber mainly occur in the three-dimensional space within the primary zone, this study creates 15 characteristic vertical sections perpendicular to the central axis of the flame tube. Here, the central axis of the flame tube is designated as the X-axis, with the swirler inlet section as the origin. The position of each characteristic section on the X-axis is marked in Fig. 40, and the calculated values are obtained by mass-weighted averaging of the surface integral for each characteristic cross-section. Figure 41(a) and (b) show the comparison of fuel content variations along the primary zone between the triple-swirler and double-swirler combustors under take-off and idle conditions, respectively. From Fig. 41, it can be seen that under both take-off and idle conditions, the fuel content difference between the two combustors is significant in the space between the Venturi tube outlet (Section 5) and the swirler outlet (Section 8). This is because this space is where the three-swirler axial swirl has the greatest impact on fuel atomisation. The maximum fuel content difference under take-off conditions is 1.026%, while under idle conditions, it is 0.4880%.
Selection of characteristic cross sections.

Comparison of fuel content for different sections.

Under take-off conditions, both the main and pilot stages supply fuel, whereas under idle conditions, only the pilot stage supplies fuel. To facilitate separate analysis, the residence time of fuel particles (i.e. atomisation and evaporation time) near the main and pilot stage nozzles was calculated. Figures 42 and 43 show the comparison of fuel particle residence times near the main and pilot stage nozzles in the triple-swirler and double-swirler combustors under take-off and idle conditions, respectively. When the fuel particle residence time in the figures reaches its maximum, the fuel particle diameter is zero, indicating that the fuel has completely evaporated and the fuel-air mixture is homogeneous. Before this point, the fuel-air mixture is biphasic, containing unevaporated fuel droplets. The quality (homogeneity) of the formed mixture significantly affects combustion. Therefore, the figures include sectional planes to represent positions, with the section numbers corresponding to those in Fig. 40.
Comparison of the residence time of fuel particles in two combustors under takeoff conditions.

Comparison of the residence time of fuel particles in two combustors under idle conditions.

Based on the analysis from Figs 42 and 43, consistent with the above discussion, it is observed that under take-off and idle conditions, the triple-swirler combustor exhibits faster atomisation and evaporation of fuel in both the main and pilot stages. Specifically, from Fig. 42, under take-off conditions, the atomisation and evaporation time of fuel in the main stage of the triple-swirler combustor is only 0.002 ms shorter compared to the double-swirler combustor, and both are mostly evaporated between characteristic Sections 9 and 10. In contrast, the atomisation and evaporation time of fuel in the pilot stage of the triple-swirler combustor is 0.041 ms shorter than in the double-swirler combustor. Moreover, in the triple-swirler combustor, fuel in the pilot stage evaporates completely between characteristic Sections 9 and 10, while in the double-swirler combustor, it evaporates between Sections 8 and 9. This indicates that fuel particles from the pilot stage nozzle in the triple-swirler combustor travel closer to the recirculation zone within the primary zone. This phenomenon is attributed to the presence of a Venturi tube in the pilot stage of the triple-swirler combustor, which restricts the movement trajectory of the fuel mist after injection, causing the shape of the fuel mist in the pilot stage to shrink. This results in a decrease in the spray cone angle during the spraying process, leading to an increase in the axial velocity of the moving fuel mist particles. Consequently, fuel particles from the pilot stage nozzle in the triple-swirler combustor travel farther, thereby avoiding high-temperature erosion of the nozzle. From Fig. 43, under idle conditions, it is noted that the atomisation and evaporation time of fuel in the pilot stage of the double-swirler combustor is 0.10 ms longer compared to the triple-swirler combustor. Additionally, more fuel particles from the pilot stage in the double-swirler combustor move beyond characteristic Section 12. This longer duration is due to the single-stage swirl atomisation of fuel in the pilot stage of the double-swirler combustor, resulting in a longer atomisation time and further travel of fuel particles. In summary, the comparison of atomisation and evaporation of fuel in the pilot stage between the triple-swirler and double-swirler combustors under take-off and idle conditions reveals that under take-off conditions, where fuel atomisation and evaporation are faster, the main factor influencing the distance of mist movement is the increased axial velocity under high-load conditions. Conversely, under idle conditions where relative airflow is lower, atomisation and evaporation are slower, leading to longer mist travel distances. Here, the swirl structure of the pilot stage under low-load conditions primarily influences the distance of mist movement.
The central cross-sectional temperature distribution of the HTR triple-swirler and double-swirler combustors under take-off and idle conditions is shown in Fig. 44. From the comparison of Figs 44(a) and (b), it can be seen that under take-off conditions, due to air and fuel staging, combustion in the primary zones of both HTR combustors is clearly stratified. The outer layer of the flame is the main combustion stage flame, and the inner layer is the pilot stage flame. The main combustion stage flame is ignited by the pilot stage, resulting in rapid and reliable ignition, and a relatively uniform combustion temperature. From the comparison of Figs 44(c) and (d), it can be seen that under idle conditions, only the pilot stage nozzles supply fuel in both combustors. The flames exhibit a ‘wing’ shape, with high-temperature regions concentrated in a small, locally fuel-rich combustion area. This flame configuration ensures good lean blowout performance and high-altitude reignition capability. This is because under idle conditions, the equivalence ratio of the recirculation airflow is relatively rich, and the surrounding circumferential airflow does not quench the recirculation combustion. Thus, the primary combustion zone achieves an ‘overall lean’ but ‘locally rich’ effect, effectively solving the lean blowout problem under idle conditions [Reference Liu, Suo and Liang48].
Measurement results of high temperature combustion zone

Comparison of temperature distribution contour maps in the centre section of two combustors under different operating conditions.

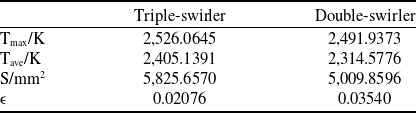
By comparing Figs 44(a) and (b), it can be seen that under take-off conditions, the temperature in the primary combustion zone of the triple-swirler combustor is more uniform and covers a wider range than that of the double-swirler combustor. To facilitate the quantification of this difference between the two combustors, this paper creatively defines a uniformity index
 $\varepsilon $
for the temperature uniformity in the primary combustion zone, referencing other uniformity indices. This index is defined as the ratio of the amount by which the maximum temperature
 ${T_{\max }}$
in the combustion area exceeds the average temperature
 ${T_{ave}}$
to the area
 $S$
of the combustion zone. The expression is as follows:
 \begin{align}\varepsilon = \frac{{{T_{\max }} - {T_{ave}}}}{S} \end{align}
The measurement results of the high-temperature combustion area in the primary combustion zone are shown in Table 9.
Comparison of total temperatures along the flow field in two combustors under different operating conditions.

Analysis of Table 9 reveals that the uniformity index of the double-swirler combustor is 1.7 times that of the triple-swirler combustor. According to the definition of the uniformity index, the smaller the
 $\varepsilon $
, the more uniform the temperature distribution. Therefore, the temperature distribution in the high-temperature combustion area of the primary combustion zone of the triple-swirler combustor is more uniform. The reason is that the pilot-stage fuel in the triple-swirler combustor is atomised more effectively by two-stage counter-rotating swirling flows, while the main-stage fuel is enveloped by two-stage co-rotating swirling flows, enhancing the flow field in the primary combustion zone and improving the mixing of main-stage fuel and air. As shown in Fig. 38, under takeoff conditions, the mixing process of fuel and air in the triple-swirler combustor is faster and more uniform than in the double-swirler combustor. This means that the primary combustion zone of the triple-swirler combustor is closer to the stoichiometric ratio, which is more conducive to high-temperature combustion. Additionally, as discussed in Section 5.1, the total pressure in the recirculation zone of the triple-swirler combustor is lower than that in the double-swirler combustor, resulting in a larger pressure differential and more thorough fuel-air mixing. Furthermore, as shown in Section 5.2, the recirculation zone of the triple-swirler combustor is fuller and more symmetrical than that of the double-swirler combustor, providing a practical foundation for stable high-temperature combustion in the primary combustion zone.
By comparing Fig. 44 (c) and (d), it can be seen that under idle conditions, the “wing” shape of the triple-swirl combustion chamber is more symmetrical compared to the double-swirl combustion chamber, with a larger expansion angle and a larger high-temperature region. This is because during idle conditions, only the pilot-stage nozzles supply fuel, and in the triple-swirl combustion chamber, the pilot-stage fuel is atomised by two stages of counter-rotating swirling flows, whereas in the double-swirl combustion chamber, pilot-stage fuel is atomised with assistance from a single-stage swirling flow, resulting in higher fuel atomisation quality in the triple-swirler combustion chamber.
As shown in the selected cross-section in Fig. 29, Fig. 45 compares the average temperature variation curves along the flow path inside the flame tube of two combustion chambers during takeoff and idle conditions. By comparing Figs 45(a) and (b), it can be observed that regardless of takeoff or idle conditions, the total temperature along the flow path inside the flame tube of the triple-swirler combustion chamber is consistently higher than that of the double-swirler combustion chamber. The temperature difference between them is relatively large in the recirculation zone and becomes minimal after the dilution holes. It can be seen that the difference in the number of swirl flows in the pilot stage significantly affects combustion in the recirculation region but has minimal impact on combustion in the dilution zone, due to the pilot-stage swirl being used to form the traditional swirl cup recirculation region. Furthermore, by further analysing Fig. 45, it is found that the total temperature difference in the recirculation region of the two combustion chambers during takeoff conditions is greater than during idle conditions. It is evident that the larger the operating conditions, the greater the total temperature difference in the recirculation region caused by the different number of pilot-stage swirl flows. This is because the larger the operating conditions, the higher the characteristic flow velocity, resulting in more intense turbulent mixing closely related to combustion.
5.4 Outlet temperature and combustion efficiency
The contour maps of the flame tube outlet temperature distribution for HTR triple-swirler and double-swirler combustion chambers under takeoff and idle conditions are shown in Fig. 46. From Fig. 46, it can be observed that regardless of takeoff or idle conditions, the outlet section temperature distribution shapes of the triple-swirler and double-swirler combustion chambers exhibit significant differences, particularly in the circumferential and radial positions of the high-temperature regions.
Outlet temperature distribution contour maps of the two combustors under different operating conditions.

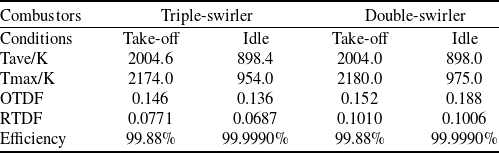
Quantify the temperature distribution differences shown in Fig. 46 using the RTDF curve and OTDF indices, as shown in Fig. 47 and Table 10. In addition, Table 10 includes the overall performance indicator of combustion efficiency. For aviation kerosene combustion, the combustion efficiency is approximated by the following expression:
 \begin{align}{\eta _B} = \frac{{C{O_2} + 0.531CO - 0.319C{H_4} - 0.397{H_2}}}{{C{O_2} + CO + UHC}} \end{align}
where, the values of each component are given in volume percentage. UHC refers to the unburned hydrocarbons in the combustion products, excluding CH4. Since the combustion calculation adopts an 11-component model for non-premixed PDF combustion, the UHC mentioned here represents C12H23.
From Fig. 47, it can be observed that under both takeoff and idle conditions, the RTDF shape of the outlet section of the triple-swirler combustion chamber is smoother compared to the double-swirler combustion chamber, more closely approximating the ideal distribution. This is because in the triple-swirler combustion chamber, the radial distribution of high-temperature regions at the outlet section is more uniform, whereas in the double-swirler combustion chamber, high-temperature regions are predominantly distributed in the upper half. Therefore, the RTDF curve of the outlet section of the double-swirler combustion chamber exhibits a single-sided peak as shown in Fig. 47, regardless of whether it is under takeoff or idle conditions.
Temperature index and combustion efficiency of flame tube outlet section

Comparison of RTDF curves under different operating conditions.

According to Table 10, under both takeoff and idle conditions, the OTDF and RTDF values of the triple-swirler combustion chamber are lower than those of the double-swirler combustion chamber, indicating that the triple-swirler combustion chamber has a higher quality of outlet temperature distribution. This is because the triple-swirler combustion chamber exhibits better atomisation, higher pressure differentials, and more thorough mixing of fuel and air. However, the combustion efficiency of the outlet section is considered equal for both combustion chambers under both takeoff and idle conditions, indicating that the difference in the number of swirl flows in the pilot stage has little impact on the combustion efficiency of the outlet section under the premise of forming a stable swirl cup back-flow region.
As shown in the selected cross-section in Fig. 29, Figs 48(a) and (b) compare the variation curves of combustion efficiency along the flow path inside the flame tube of the two combustion chambers under takeoff and idle conditions, respectively. From Fig. 48, under takeoff conditions, along the gas flow path inside the flame tube, the combustion efficiency of the triple-swirler combustion chamber is higher than that of the double-swirler combustion chamber. However, the difference between them gradually narrows, and after the dilution holes, their combustion efficiency values are nearly equal, which is relatively consistent with the calculation results of the total temperature along the flow path in Fig. 45(a). Under idle conditions, except at the exit section of the swirler where the combustion efficiency of the triple-swirler combustion chamber is significantly higher than that of the double-swirler combustion chamber, starting from the backflow region downstream of the swirler, along the gas flow path inside the flame tube, the difference in combustion efficiency between the two combustion chambers is minimal, and their combustion efficiency values can be considered equal. The significant difference in combustion efficiency values between the two combustors at the outlet section of the swirler under idle conditions is due to the fact that the fuel atomisation process mainly occurs near the outlet section of the swirler. Therefore, the differences in atomisation effects caused by different pilot stage swirler structures are more pronounced near the swirler outlet.
5.5 Outlet pollutant emissions analysis
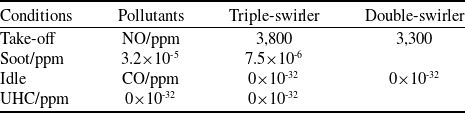
The main pollutants emitted by aircraft gas turbines include carbon monoxide (CO), unburned hydrocarbons (UHC), soot, and nitrogen oxides (NOx). At high power states, high temperatures in the primary zone lead to significant emissions of NOx and soot, while at low power states, lower temperatures result in substantial emissions of CO and UHC. Therefore, this study primarily calculates the emissions of NOx and soot during takeoff conditions and CO and UHC during idle conditions, as shown in Table 11. In this paper, ppm denotes measurements expressed in parts per million.
Calculation results of pollutant emission at the outlet section of flame tube

Comparison of combustion efficiency along the flow field in two combustors under different operating conditions.

Since the Fluent software employs the non-premixed PDF combustion model with an 11-species composition, the formula for calculating UHC is as follows:
 \begin{align}UHC/{\rm{ppm}} = \frac{{{C_{12}}{H_{23}} + C{H_4}}}{{1 - {H_2}O}} \times {10^6} \end{align}
where the values of each component are in terms of mole fractions. In addition, the calculation formulas for the ppm values of NO, soot and CO [Reference Wang15] are as follows:
 \begin{align}NOx/\left( {ppm} \right) = \frac{{mole{f_{NOx}} \times {{10}^6}}}{{1 - mole{f_{{H_2}O}}}} \end{align}
 \begin{align}Soot/\left( {ppm} \right) = \frac{{mole{f_{Soot}} \times {{10}^6}}}{{1 - mole{f_{{H_2}O}}}} \end{align}
and
 \begin{align}CO/\left( {ppm} \right) = \frac{{mole{f_{CO}} \times {{10}^6}}}{{1 - mole{f_{{H_2}O}}}} \end{align}
where molefNOx is the molar fraction of nitrogen oxides, molefH2O is the molar fraction of gaseous water, molefsoot is the molar fraction of soot, and molefCO is the molar fraction of carbon monoxide.
5.5.1 Emissions analysis of NOx
This paper utilised Fluent’s built-in NOx generation model to calculate the production of thermal NOx and prompt NOx. Thermal NOx is predominantly generated when temperatures exceed 1,850 K, whereas prompt NOx is generated significantly at lower temperatures and higher concentrations of mixture [Reference Yang, Zhang and Guo49]. Under takeoff conditions, the comparison of NOx mass fraction distribution between triple-swirler and double-swirler combustion chambers is shown in Fig. 49.
Comparison of NOx mass fraction distributions at the takeoff condition.

As depicted in Fig. 49, under takeoff conditions, the distribution of NOx in both triple-swirler and double-swirler combustors conforms to the corresponding temperature field distributions shown in Figs 44(a) and (b) of Section 5.3.
From the comparison of (a) and (b) in Figs 44 and 49, it can be seen that the generation of NOx in the main stage combustion region formed by circumferential gas flow is relatively low. Figure 49 mainly presents the distribution of NOx in the recirculating gas combustion region. This is because the circumferential gas is located on the periphery of the recirculation zone, and the gas flow velocity is fast with a short residence time, lacking the conditions for the generation of prompt NOx. In addition, the main stage circumferential flow combustion region is a premixed combustion, resulting in a lower generation of thermal NOx due to lower and uniform combustion temperatures.
From Fig. 49, it is evident that NOx emissions along the flow field within the flame tube are significantly higher in the triple-swirler combustion chamber compared to the double-swirler chamber. Furthermore, as indicated in Table 11, at the flame tube outlet, the NOx emission from the triple-swirler combustion chamber exceeds that from the double-swirler chamber. This is attributed to temperatures in the primary zones of both chambers exceeding 1,850 K under takeoff conditions, with the maximum total temperature in the triple-swirler primary zone reaching up to 2,526 K, and in the double-swirler primary zone reaching up to 2,492 K. It is evident that both chambers primarily generate thermal NOx, and the production and generation rate of thermal NOx exponentially increase with temperature. As shown in the comparison of Figs 45(a) and (b) from Section 4.3, the temperature in the primary zone of the triple-swirler combustion chamber is higher than that of the double-swirler combustion chamber, thus resulting in the observed differences in NOx emissions as depicted in the figures and tables.
5.5.2 Emissions analysis of soot
Under takeoff conditions, the soot mass fraction distribution for the triple-swirler and double-swirler combustion chambers is compared in Fig. 50. To highlight the color differences for better observation, the blue background (i.e. 0 value) in Fig. 50 is replaced with green. As seen in Fig. 50, under takeoff conditions, soot in both the triple-swirler and double-swirler combustion chambers is primarily generated in the recirculation zone near the pilot-stage fuel nozzle, forming a wing shape. This wing-shaped region is characterised by high temperatures, rich fuel and low oxygen. The shape and size of the wing-shaped regions are similar in both combustion chambers, but the triple-swirler chamber has a larger and more uniformly filled wing angle, with significantly higher soot production compared to the double-swirler chamber. Additionally, since soot particles undergo further combustion through supplementary airflow after the primary hole, reacting to form CO or CO2, the soot emissions at the flame tube outlet section are very low for both combustion chambers.
Comparison of Soot mass fraction distribution under takeoff conditions.

The generation of soot in the primary combustion zone is mainly related to local over-richness and excessively high temperatures. The triple-swirler combustion chamber has an additional outer swirler in the pilot stage compared to the double-swirler chamber, resulting in better atomisation quality of the main and pilot stage fuel. From this perspective, the soot generation in the recirculation zone of the double-swirler chamber should be greater than that in the triple-swirler chamber. However, as shown in Fig. 50, the soot generation in the recirculation zone of the triple-swirler chamber is significantly higher than that in the double-swirler chamber, and the temperature in the primary zone of the triple-swirler chamber is higher than that in the double-swirler chamber. This indicates that, for these two types of combustion chambers, excessively high temperatures in the primary zone have a greater impact on soot generation than atomisation quality.
5.5.3 Emissions analysis of CO and UHC
Under idle conditions, the comparison of CO and UHC mass fraction distributions on the central cross-sections of triple-swirler and double-swirler combustion chambers are shown in Figs 51 and 52, respectively. To enhance visibility, the background color in Figs 51 and 52, originally blue (representing zero values), has been replaced with green. From Fig. 51, it is evident that under idle conditions, the CO mass distribution in both triple-swirler and double-swirler combustion chambers is relatively symmetrical, but the shapes of the distribution areas are distinctly different. In the triple-swirler combustion chamber, the distribution shape resembles a bird spreading its wings in flight, while in the double-swirler combustion chamber, it resembles a straight goat’s horn. Both chambers generate more CO in the rich fuel combustion regions, consistent with the distribution of high-temperature areas shown in Figs 44(c) and (d) of Section 5.3. This is due to the interruption of CO2 formation from CO due to oxygen-deficient rich fuel conditions, and the decomposition of CO2 into CO during high-temperature combustion.
Comparison of CO mass fraction distribution under idle conditions.

From Fig. 51, it is evident that under idle conditions, CO generation in the wing-shaped high-temperature area of the triple-swirler combustion chamber is significantly lower than that in the double-swirler combustion chamber. This is because the fuel in the pilot stage of the triple-swirler combustion chamber undergoes shearing atomisation with two-stage counter-rotating swirls, while in the double-swirler combustion chamber, fuel is atomised with only one-stage swirl assistance, resulting in longer evaporation time for fuel particles in the latter, which reduces the time available for reactions converting CO to CO2. Additionally, under idle conditions, the overall equivalence ratio in the primary combustion zone of both HTR combustion chambers is lower. According to Fig. 31, the total pressure in the primary zone of the double-swirler combustion chamber is higher than that in the triple-swirler combustion chamber. Based on literature review, at lower equivalence ratios in the primary zone, an increase in pressure accelerates the conversion of CO to CO2. Therefore, from a pressure perspective, it is inferred that CO generation in the double-swirler combustion chamber should be lower than that in the triple-swirler combustion chamber. In conclusion, for both types of HTR combustion chambers in this paper, under idle conditions, the impact of atomisation quality on CO emissions outweighs the impact of pressure.
As observed from Fig. 52, under idle conditions, the distribution of UHC mass fraction in both triple-swirler and double-swirler combustion chambers is similar to that of CO. This similarity arises because the factors influencing UHC generation are identical to those influencing CO.
Comparison of UHC mass fraction distribution under idle conditions.

According to Table 11, at idle conditions, the molar fractions of CO and UHC at the flame tube outlet section of both triple-swirler and double-swirler combustion chambers are 0×10-38, which represents the calculation limit of Fluent software. This indicates that the emissions of CO and UHC at the exits of both HTR combustion chambers are extremely low under idle conditions. This is because CO generated in the primary combustion zone enters the secondary combustion zone along the flow path and participates in combustion, subsequently reacting to form CO2.
6.0 Futuristic applications
6.1 Future work
6.1.1 Multi-swirler configuration optimisation
Our findings suggest that increasing swirler stages (e.g. triple-swirler) enhances fuel-air mixing uniformity, outlet temperature distribution quality, and combustion stability. Future studies could explore:
-
(1) Novel swirler combinations: Hybrid axial-radial or four-stage swirlers to optimise airflow organisation under ultra-high FARs (FAR > 0.04).
-
(2) Asymmetric swirler arrangements: Addressing non-uniform cooling challenges in HTR combustors.
6.1.2 Advanced structural parameter studies
Beyond swirler stages, future work could focus on:
-
(1) Swirler blade angle optimisation: Balancing turbulence intensity and pressure loss through inner/outer blade angle adjustments.
-
(2) Fuel nozzle integration: Designing airblast or hybrid nozzles to enhance atomisation at high FAR.
6.1.3 Multi-physics coupling analysis
High-temperature combustion involves complex interactions between turbulence, evaporation, radiation and chemistry. Future efforts could integrate:
-
(1) Large eddy simulation (LES): Investigating transient vortex dynamics and flame stabilisation mechanisms.
-
(2) Machine learning-assisted optimisation: Rapid identification of optimal swirler geometries under multi-objective constraints (emissions, efficiency, durability).
6.1.4 Extended operating condition validation
While this study focused on takeoff and idle conditions, future extensions could include:
-
(1) High-altitude relight and transient conditions: Evaluating combustion stability under extreme operational envelopes.
-
(2) Alternative fuel compatibility: Testing hydrogen or sustainable aviation fuel (SAF) adaptability for decarbonisation goals.
6.2 Practical applications
6.2.1 Next-generation high thrust-to-weight ratio engines
The triple-swirler’s superior outlet temperature distribution quality (OTDF < 0.15) and lean blowout resistance at low power make it ideal for:
-
(1) Military engines: Enabling stable combustion in variable-cycle engines with FAR > 0.04 and temperature rise > 1,600 K.
-
(2) Hypersonic propulsion: Supporting scramjet-mode combustion with rapid mixing and flame anchoring.
6.2.2 Low-emission combustor design
The triple-swirler’s faster mixing reduces CO/UHC emissions at idle, while symmetric fuel-rich zones mitigate soot formation, aligning with the evolving requirements of ICAO CAEP/9 and anticipated future emission standards. Applications include:
-
(1) Staged combustion systems: Integrating triple-swirlers with RQL or lean-burn configurations for NOx reduction.
-
(2) Additive manufacturing: 3D-printed swirlers with internal cooling channels for high-heat-flux durability.
6.2.3 Adaptive cooling and durability enhancements
Validated designs such as multi-inclined-hole cooling and convex-arc flame tubes could scale to:
-
(1) Ceramic matrix composite (CMC) combustors: Reducing cooling air demand while maintaining wall temperatures < 1,300 K.
-
(2) Digital twin platforms: Coupling CFD with real-time sensor data to predict thermal fatigue and optimise cooling.
6.2.4 Industrial gas turbine applications
The multi-swirler fuel-rich dome concept can be adapted for:
-
(1) Power generation turbines: Improving hydrogen combustion efficiency and turndown ratio.
-
(2) Carbon capture systems: Enhancing flame stability in oxy-fuel combustion with exhaust gas recirculation.
This study bridges a critical gap in swirler-stage optimisation for high-temperature rise combustors. The triple-swirler’s advantages in mixing, temperature uniformity and low-power emissions offer actionable insights for next-generation designs. Future efforts will integrate these findings with emerging technologies (e.g. AI-driven optimisation, additive manufacturing) to address evolving demands in aerospace propulsion and sustainable energy.
7.0 Conclusion
This paper employs the RANS method to conduct three-dimensional numerical simulations of the flow and combustion in HTR triple-swirler and double-swirler combustion chambers with a total FAR of 0.037. It compares and analyses the performance of these two combustion chambers under takeoff and idle conditions. The conclusions are as follows:
-
(1) Under takeoff and idle conditions, the total pressure along the flow path within the triple-swirler combustion chamber is consistently lower than that in the double-swirler combustion chamber. Moreover, under the same conditions, the difference in total pressure loss coefficients between the two chambers is greater in the hot state than in the cold state.
-
(2) In terms of axial length, radial height and torch angle, the recirculation zone in the triple-swirler combustion chamber is larger than that in the double-swirler combustion chamber, indicating that the recirculation zone in the triple-swirler chamber is more full and symmetrical.
-
(3) Under takeoff and idle conditions, the fuel-air mixing process in the triple-swirler combustion chamber is faster and more uniform, with a higher total temperature along the flow path in the flame tube. Additionally, the temperature distribution in the primary combustion zone of the triple-swirler combustion chamber is more uniform during takeoff conditions, and the rich fuel combustion region is more symmetrical under idle conditions.
-
(4) Under takeoff and idle conditions, the OTDF and RTDF values at the outlet of the triple-swirler combustion chamber are superior, with the RTDF shape closer to the ideal distribution. However, the combustion efficiency at the exits of both chambers remains the same under both conditions.
-
(5) Under takeoff conditions, the NOx and Soot emissions along the flow path in the triple-swirler combustion chamber are significantly higher than those in the double-swirler combustion chamber. Under idle conditions, the generation of CO and UHC in the rich fuel combustion region of the triple-swirler combustion chamber is significantly lower than that in the double-swirler combustion chamber, although the CO and UHC emissions at the exits of both chambers are almost negligible.
Funding
National Science and Technology Major Project (J2019-III-0002-0045), National Science and Technology Major Project (J2017-III-0002-0026), National Science and Technology Major Project (J2017-III-0006-0031).
Declaration of interests
The authors declare that they have no known competing financial interests or personal relationships that could have appeared to influence the work reported in this paper.
The authors declare the following financial interests/personal relationships which may be considered as potential competing interests.
Author contributions
Duo Wang (first author): Conceptualisation, methodology, writing-original draft, investigation
Feng Li (corresponding author): Formal analysis, funding acquisition, resources, supervision, project administration
Hongjun Lin: Investigation, validation, data curation
Yunchuan Tan: Writing-review and editing, visualisation, software