



Introduction
Wheat (Triticum aestivum L.) is one of the world's three most widely grown crops, cultivated on an estimated 220 million ha of cropland annually. It provides 20% of the world's caloric demands (Hawkesford, Reference Hawkesford2014). Demand for wheat grain is projected to increase as the global population increases to reach 9.7 billion by 2050 (Desa, Reference Desa2019). To achieve high grain yield gains, the use of nitrogen fertilizer as the main nutrient limiting growth is critical. However, it has been estimated that globally only 33% of applied nitrogen fertilizer is recovered in the grain (Raun and Johnson, Reference Raun and Johnson1999).
Improving physiological traits that have a significant impact on wheat yield is critical for fulfilling future grain demand (Wu et al., Reference Wu, Hammer, Doherty, von Caemmerer and Farquhar2019). Biomass is a key selection trait for yield improvement in wheat (Sharma, Reference Sharma1993; Aisawi et al., Reference Aisawi, Reynolds, Singh and Foulkes2015). A primary determinant of biomass is the rate of leaf photosynthesis over the growing season (Parry et al., Reference Parry, Reynolds, Salvucci, Raines, Andralojc, Zhu, Price, Condon and Furbank2011). During grain filling in wheat, the dry matter of the plants is mostly derived by photosynthetic carbon assimilation of flag leaves (Fan et al., Reference Fan, Liu, Zhao, Ma and Li2019). The genetic progress in grain yield in China was mainly attributed to the maintenance of higher flag-leaf photosynthetic capacity during the reproductive growth stage leading to greater biomass accumulation (Li et al., Reference Li, Li, Liu, Liu, Lu and Shao2022). Amongst 15 wheat genotypes grown in the UK post-anthesis flag-leaf photosynthesis rate was positively correlated with grain yield (Gaju et al., Reference Gaju, DeSilva, Carvalho, Hawkesford, Griffiths, Greenland and Foulkes2016). Similarly, amongst 30 Indian spring wheat genotypes a positive association was observed between post-anthesis flag-leaf photosynthetic rate and grain yield (Nehe et al., Reference Nehe, Misra, Murchie, Chinnathambi, Singh Tyagi and Foulkes2020) in field experiments in India. Furthermore, proof-of-concept tests with crop model species have demonstrated that targeted intervention and modulation of photosynthetic processes can increase biomass and yield (Kromdijk et al., Reference Kromdijk, Głowacka, Leonelli, Gabilly, Iwai, Niyogi and Long2016; Hubbart et al., Reference Hubbart, Smillie, Heatley, Swarup, Foo, Zhao and Murchie2018). A general expectation would be that improving leaf photosynthesis traits potentially enhances biomass production at all stages of development.
N is translocated from the canopy to the grains during grain filling which results in a reduction in both photosynthetic capacity and the ability of roots to further uptake N as canopy senescence progresses (Thomas and Howarth, Reference Thomas and Howarth2000). Reduced green canopy area and photosynthetic capacity with senescence reduce biomass and consequently grain yield (Subedi et al., Reference Subedi, Gregory, Summerfield and Gooding1998). Maintaining a relatively high flag-leaf photosynthesis rate during the reproductive stage is vital to yield improvement in wheat (Carmo-Silva et al., Reference Carmo-Silva, Andralojc, Scales, Driever, Mead, Lawson, Raines and Parry2017). Hence, a key determinant of photosynthetic capacity and grain yield is the timing of the onset of flag-leaf senescence (Gaju et al., Reference Gaju, Allard, Martre, Snape, Heumez, LeGouis, Moreau, Bogard, Griffiths, Orford and Foulkes2011; Borrill et al., Reference Borrill, Fahy, Smith and Uauy2015). One approach would be to delay senescence and prolong grain filling duration, i.e. the stay-green trait.
Wheat landrace collections contain wider genetic diversity than most breeding programmes, which include adaptation to harsh environmental conditions. A landrace has been defined as a traditional cultivar with a high capacity to tolerate biotic and abiotic stresses, resulting in high yield stability and intermediate yield level under a low input agricultural system (Zeven, Reference Zeven1998). Under low N availability, wheat landraces and old cultivars with a taller growth habit and lower harvest index were shown to absorb and translocate more nitrogen into the grain than modern cultivars, probably due to greater pre-anthesis N uptake (Jaradat, Reference Jaradat2013). There is evidence that the root size of landraces is larger than modern cultivars and that N-uptake efficiency may be improved compared with modern cultivars particularly under low N conditions (Waines and Ehdaie, Reference Waines and Ehdaie2007; Kareem, Reference Kareem2021; Kareem et al., Reference Kareem, Hawkesford, DeSilva, Weerasinghe, Wells, Pound, Atkinson and Foulkes2022). Lines of a bread wheat nested association mapping (NAM) panel comprised of bi-parental segregating single-seed descent populations from crosses between spring wheat cultivar Paragon and landraces from the A.E. Watkins collection were shown to have novel variation for rooting traits and N uptake compared to the elite bread wheat parent Paragon (Kareem et al., Reference Kareem, Hawkesford, DeSilva, Weerasinghe, Wells, Pound, Atkinson and Foulkes2022).
This study aimed to quantify novel genetic variation in hexaploid wheat for grain yield, above-ground dry matter, nitrogen-use efficiency (NUE; grain yield dry matter/available N (soil mineral N plus the applied fertilizer N)) and associated leaf photosynthesis traits under moderate N availability in a panel of spring wheat germplasm comprising: (i) modern UK spring wheat cultivar (Paragon), (ii) single seed descent (SSD) lines of Paragon × landraces, (iii) SSD lines of Paragon × elite CIMMYT spring wheat line Pfau and (iv) elite MAGIC lines, in field experiments in two seasons in the UK. The hypotheses examined were that: (i) genetic variation in flag-leaf photosynthesis traits is associated with above-ground dry matter and (ii) there is higher expression of flag-leaf photosynthesis traits and biomass in landrace derivatives than elite bread wheat genotypes.
Materials and methods
Experimental design, site and plot management
Two field experiments were carried out at the University of Nottingham farm at Bunny Park, Nottinghamshire, UK (latitude: 52° 51′ 45″ N longitude: 1° 7′ 30.6″ W) in 2017 and 2017–2018. Sixteen bread wheat hexaploid genotypes were used in the experiments (Table 1). Nine single-seed descent lines were developed from crosses between semi-dwarf (Rht8) spring wheat cultivar Paragon and landraces from the A.E. Watkins collection. Three single-seed decent lines were developed from a cross between Paragon and CIMMYT Mexican spring wheat Pfau. In addition, there were three wheat lines from a Multiparent Advanced Genetic Inter Cross (MAGIC) population. The Paragon × landrace lines and the Paragon × Pfau lines were developed by single seed descent (SSD) by the John Innes Centre, UK. The MAGIC population was created through the systematic inter-crossing of eight elite UK wheat varieties at NIAB, Cambridge (Mackay et al., Reference Mackay, Bansept-Basler, Barber, Bentley, Cockram, Gosman, Greenland, Horsnell, Rose, O'Sullivan and Howell2014). The eight founder cultivars (Alchemy, Brompton, Claire, Hereward, Rialto, Robigus, Soissons, Xi19) were subjected to intercrossing for three generations; progeny from these eight-way families were then selfed through SSD. As one of the founders (Xi19) is a vernalization-insensitive facultative type, it was expected that a proportion of MAGIC progenies would show spring growth habit. These were selected by growing the whole population in non-vernalizing glasshouse conditions and discarding lines that did not head. Three spring MAGIC lines were used in this study. The landrace lines of the A.E. Watkins Collection were acquired during the 1930s from local markets in 32 countries in Asia, Europe and Africa, representing a snapshot of genetic diversity present before the onset of modern breeding practices (Wingen et al., Reference Wingen, Orford, Goram, Leverington-Waite, Bilham, Patsiou, Ambrose, Dicks and Griffiths2014). Paragon is a UK spring bread wheat cultivar bred by RAGT Seeds Ltd (CSW 1742/19/6/68 × [Axona × Tonic]) first listed on the UK Recommended List in 1999. The 16 genotypes were selected to show a restricted range in anthesis date but contrasting above-ground biomass from a previous field experiment in 2016.
Wheat genotypes used in the field experiments

The sowing dates of the field experiments were 27 March 2017 and 30 Oct 2017. The plot size was 1.0 × 1.2 m; there were six rows per plot 20 cm apart. The plot size was relatively small, but a similar plot size has been used in recent field studies investigating genetic associations between leaf photosynthesis traits and biomass in wheat, e.g. Gaju et al. (Reference Gaju, DeSilva, Carvalho, Hawkesford, Griffiths, Greenland and Foulkes2016). The amount of N fertilizer was calculated to supply a total from soil N supply and fertilizer N of 175 kg N/ha. In 2017, 30 kg N/ha was applied on 16 March 2017 and in 2018 120 kg N/ha. The fertilizer N was applied as two splits (60 + 60) kg N/ha in 2018 with the first application on 26 March and the second on 26 April 2018. All N fertilizer was applied as granules of ammonium nitrate (34.5% N). The soil N content to 90 cm soil depth was 134 kg N/ha in 2017 and 67 kg N/ha in 2018. The genotypes were sown in the experiments using a completely randomized block design with three replicates.
The soil type was sandy loam and the seed rate was 350/m2 in each experiment. Herbicides and fungicides were applied as necessary to minimize the effects on weeds and diseases. A plant growth regulator was applied in the 2017–2018 experiment only as chlormequat at GS31.
Crop measurements
Crop development
Regular monitoring of crop growth stages was done in each plot for the 16 genotypes using the Zadoks scale (Zadoks et al., Reference Zadoks, Chang and Konzak1974). In both years, anthesis date GS61 was recorded when 50% of the fertile shoots carried visible anthers. The date of physiological maturity GS89 (50% yellow peduncle and leaf lamina fully senesced) was recorded when 50% of the fertile shoots were at that stage. Plots were assessed once or twice a week depending on the crop growth stage.
Flag leaf photosynthetic rate (A max) and stomatal conductance (g s).
Light-saturated photosynthetic rate (A max) and stomatal conductance (g s) were measured using a Li-Cor LI-6400XT Portable Photosynthesis System (Lincoln, NE, USA). In 2017, three readings and per plot and in 2018 two readings per plot were taken on three/two randomly selected fertile shoots, respectively, in two replicates. The instrument was calibrated for humidity at 50–60% relative humidity and the settings for the readings were: photosynthetically active radiation (PAR) 2000 μmol/m2/s, sample chamber CO2 concentration 400 μmol/mol and flow rate 500 μmol/s. The measurements were taken between 11.00 and 15.00 between flag-leaf emergence and mid-grain filling in each year. In both 2017 and 2018, measurements were taken on three dates during each season: 15 June, 21 June and 13 July 2017 and 29 May, 12 June and 21 June 2018.
Flag-leaf chlorophyll content
In 2018, the relative chlorophyll content of the flag leaf was measured using a hand-held Soil Plant Analysis Development meter (SPAD 502, Minolta, Japan) as an indicator of the relative chlorophyll content avoiding the leaf midrib. On each assessment date, three measurements were taken per flag-leaf (basal, middle and apical) on three randomly selected flag leaves per plot in two replicates. Measurements were taken on 12 and 21 June.
Flag-leaf senescence
In each experiment for all genotypes, senescence kinetics of the flag leaf were assessed visually every seven days after anthesis GS61 until full leaf senescence by recording the percentage green area senesced using a standard diagnostic key based on a scale of 0 (100% green) to 10 (fully senesced, 0% green) (Gaju et al., Reference Gaju, Allard, Martre, Snape, Heumez, LeGouis, Moreau, Bogard, Griffiths, Orford and Foulkes2011). The visual senescence score was plotted against thermal time (base temperature 0°C) at anthesis (GS61) using a modified version of the logistic equation with four parameters (Eqn (1)).

where Y is the senescence score, A is the initial senescence score at anthesis (GS61), C is the difference between A and the final senescence score (asymptote), B is the maximum rate (slope), M is the time when the senesce rate is at its maximum and X is the accumulated thermal time (base temp. 0°C) after anthesis in degree-days (°Cd).
Harvest measurements
At physiological maturity before machine harvesting, a 0.5 m row length was sampled in all plots avoiding outer rows by cutting plants at ground level. In the laboratory, the roots of samples were removed. Each sample was then divided into fertile shoots (those with an ear containing at least one grain) and infertile shoots. The fertile shoots were divided into ears, leaf lamina and leaf sheath and stem. All samples were dried at 70°C for 48 h and the weight was recorded. The ears were threshed using a Wintersteiger LD180 thresher (Wintersteiger, Austria) and the grain was counted on a seed counter (Contador) (Pfeuffer, Germany). The threshed grain was dried at 70°C for 48 h, and the dry weight was recorded. Above-ground dry matter was calculated by dividing the final machine-harvested grain yield expressed at 100% DM by the harvest index (proportion of aboveground dry matter in the grain). The weight of the grain from the 0.5 m row was added to the weight of the grain from the machine-harvested grain of the plot to calculate the final machine-harvested grain yield per unit area. The grains/m2 was calculated by dividing the grain yield by the 1000-grain weight (TGW). Plant height was measured before harvest from ground level to the tip of the ear, excluding awns, using a ruler on three randomly selected fertile shoots per plot in three replicates.
Plant N analysis, NUE and its components
The nitrogen concentration of the straw and grain at maturity was measured using the Dumas method. The harvested samples were milled using a laboratory micro-plant grinding machine. Then 5–6 mg of milled samples was weighed and encapsulated in tin capsules. The encapsulated samples were placed into a Fisons NA-2000 elemental analyser (Fisons, Ipswich, UK) calibrated against atropine standard (N content = 4.6%) to analyse N%. The N-uptake efficiency (NUpE) and N-utilization efficiency (NUtE) were calculated as follows:


where AGNH is the above-ground N at harvest and available N is the soil mineral N plus the applied fertilizer N.
Statistical analysis
Analysis of variance (ANOVA) procedures for a complete randomized block design were used to analyse genotype effects in individual experiments using GenStat version 19 (www.genstat.com; VSN International Ltd, Hemel Hempsted, UK), assuming replicates were random effects and genotype fixed effects. A restricted maximum likelihood (REML) mixed linear model was applied to analyse genotype effects across experiments and the interaction with the year fitting genotype and year × genotype as fixed effects and year and replicates within a year as random effects using GenStat version 19. Broad-sense heritability (H2) for a given trait across seasons (2017 and 2017–2018) was calculated as described in Eqn (4):

where $\sigma _{\rm g}^2$ and $\sigma _{\rm e}^2$
 are the genotypic and environmental variance and $\sigma _{{\rm ge}}^2$
 is the genotype × environment interaction. The number of environments and number of replications are represented by e and r, respectively.
Results
Growing conditions in experiments
The average temperature during the season was higher in 2017 (13.3°C) than in 2017–2018 (10.3°C). During onset of stem extension to anthesis (GS31–GS61) average temperature was 2.8°C cooler in 2018 (12.6°C) than in 2017 (15.4°C) (Supplementary Table S1). The 2017–2018 season was brighter than 2017 during grain filling with solar radiation for GS61–GS89 of 494 MJ/m2 in 2017 and 576.1 MJ/m2 in 2018. In contrast, during stem extension the 2017 season was brighter than 2017–2018 with solar radiation for GS31–GS61 of 421 and 406 MJ/m2, respectively. Total rainfall was higher from sowing to harvest in 2017–2018 (428 mm) than in 2017 (328 mm). During GS31–GS61, rainfall was higher in 2017–2018 (60.8 mm) than 2017 (51.4 mm), while during GS61–GS89 it was higher in 2017 (104 mm) than in 2018 (0.4 mm).
Plant height and anthesis date
Averaging across years, genotypes ranged in height from 63.5 to 110 cm (P < 0.001) (Table 2) and in anthesis date (AD) from 152 to 163 DAS (P < 0.001). There was year × genotype interaction for plant height (P < 0.001). There was a trend for a positive association between grain yield and anthesis date (R 2 = 0.21, P = 0.069; Fig. 1a) and a negative association between grain yield and plant height (R 2 = 0.38, P = 0.02; Fig. 1b). Nine SSD landrace-derived lines were taller than Paragon and no lines were shorter (P < 0.05). Two SSD landrace-derived lines reached anthesis later than Paragon and seven earlier. Broad-sense heritability (H2) was high for plant height and anthesis date (0.94 and 0.91, respectively). The genotype means for individual years are shown in Supplementary Table S2.
Plant height and days to anthesis (GS61) for the 16 wheat genotypes
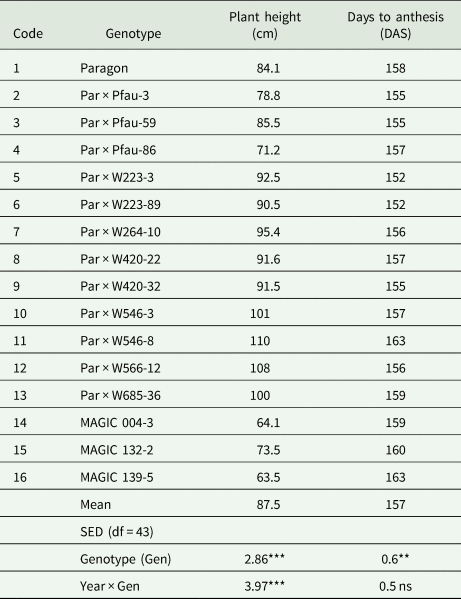
Values represent means in 2017 and 2017–18.
* P < 0.05; ** P < 0.01; *** P < 0.001. † P < 0.10 Genotype (G), SED, Standard error of the difference of the means; DAS, days after sowing.
Linear regression of grain yield (100% DM) on (a) anthesis date (days after sowing, DAS); (b) plant height (cm); (c) above-ground dry matter; (d) harvest index (HI) (e) grains per m2 and (f) thousand grain weight for 16 wheat genotypes (Paragon wheat cultivar ■; single seed descent (SSD) elite derivative ▴; MAGIC lines ♦ and single seed descent landrace derivative •) Values represent means in 2017 and 2017–2018.

Grain yield, above-ground dry matter, and yield components
Averaging across years, grain yield for genotypes ranged from 536 to 923 g/m2 (P < 0.001) and AGDM from 1133 to 1802 g/m2 (P < 0.05). For TGW, genotypes ranged from 31.4 to 42.2 g (P < 0.001) (Table 3). There was a positive association between grain yield and above-ground dry matter (R 2 = 0.61, P < 0.001; Fig. 1c). The year × genotype interaction was not significant for GY, AGDM and TGW. For GY none of the SSD landrace-derived lines were greater than Paragon while seven SSD landrace-derived lines showed transgressive segregation over Paragon for TGW. One SSD landrace-derived line had higher AGDM than Paragon (P < 0.05). Broad-sense heritability (H2) for GY, AGDM and TGW was 0.88, 0.84 and 0.85, respectively. The genotype means for individual years are shown in Supplementary Table S3.
Grain yield (GY), above-ground dry matter (AGDM), grains per m2, grains per ear, thousand-grain weight (TGW), N uptake, N-utilization efficiency (NUtE), and the onset of flag-leaf post-anthesis senescence (SENONSET) in 16 wheat genotypes (including (Paragon wheat cultivar; single seed descent elite derivatives; MAGIC lines and single seed descent landrace derivatives)
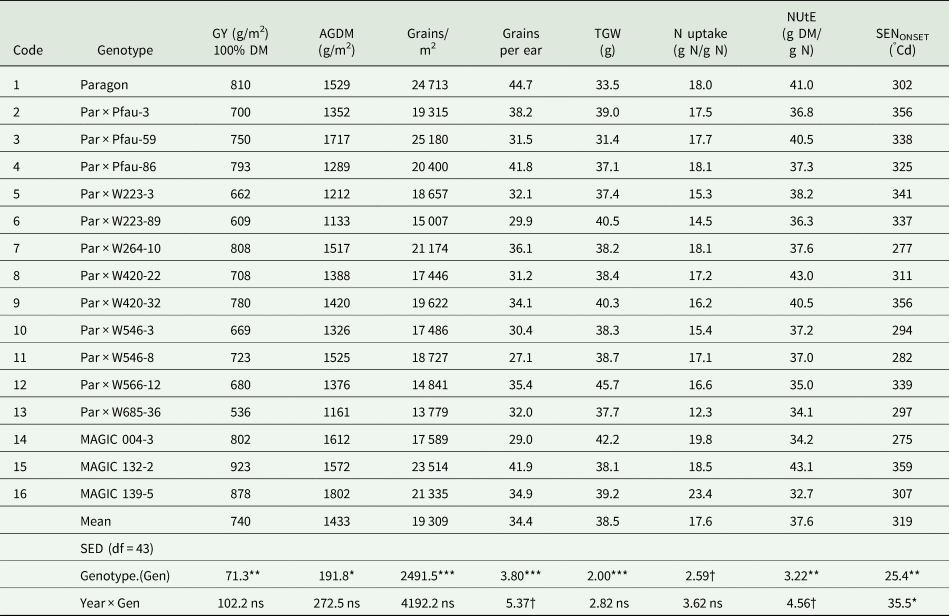
Values represent means in 2017 and 2017–18.
* P < 0.05; ** P < 0.01; *** P < 0.001 and † P < 0.10 . SED, standard error of difference of the means.
Averaging across years, grains/m2 ranged from 13 779 to 25 108 (P < 0.001) and grains per ear from 27.1 to 44.7 (P < 0.001) (Table 3). Overall, there was a strong positive association between grain yield and grains/m2 (R 2 = 0.58, P < 0.001; Fig. 1e) and grains per ear (data not shown). No SSD landrace-derived lines showed transgressive segregation over Paragon for grains/m2 or grains per ear (Table 3). Broad-sense heritability (H2) for grains/m2 and grains per ear was 0.84 and 0.78, respectively.
N-uptake and N-utilization efficiency
Averaging across years, N-uptake ranged among genotypes from 12.3 to 23.4 g N/m2 (P = 0.07, Table 3). For N-utilization efficiency, genotypes ranged from 32.7 to 43.1 g DM/g N (P = 0.48, Table 3). Overall, there was a positive association between grain yield and N uptake (R 2 = 0.78, P < 0.001; Fig. 2a) but no association with NUtE. The year × genotype interaction showed a trend for significance for NUtE (P = 0.06), but was not significant for N uptake. Broad-sense heritability (H2) was 0.77 and 0.63 for N uptake and NUtE, respectively. The genotype means for individual years are shown in Supplementary Table 3.
Linear regression of grain yield on (a) N-uptake and (b) N-utilization efficiency for 16 wheat genotypes. Values are means of 2017 and 2017–18) (Paragon wheat cultivar ■; single seed descent (SSD) elite derivative ▴; MAGIC lines ♦ and single seed descent (SSD) landrace derivative •). For genotype codes see Table 1.

Flag-leaf A max, stomatal conductance g s, and relative chlorophyll content
In 2017, flag-leaf photosynthesis rate ranged amongst genotypes from 21.6 to 28.7 μmol/m2/s pre-anthesis (P = 0.04) and 9.0–17.4 (P × W566-12) μmol/m2/s post-anthesis (P = 0.006, Table 4). No line showed transgressive segregation greater than Paragon for pre-anthesis flag-leaf A max, while two SSD landrace-derived lines (P × W566-12, P × W264-10) were higher than Paragon for post-anthesis flag-leaf A max (P < 0.001). There was no significant correlation among genotypes between grain yield or above-ground dry matter and pre-anthesis A max or post-anthesis A max. Pre-anthesis flag-leaf stomatal conductance varied amongst genotypes in the range 0.22–0.51 mol/m2/s (P < 0.001) and post-anthesis 0.08–0.27 mol/m2/s (P < 0.001, Table 4). For stomatal conductance post-anthesis, three SSD landrace-derived lines (P × W223-3, P × W264-10, P × W566-12) were higher compared to Paragon (P < 0.05) lines. There was a positive correlation between grain yield and post-anthesis flag-leaf stomatal conductance (r = 0.53, P = 0.032, data not shown).
Flag-leaf photosynthetic rate (A max), stomatal conductance (g s) at pre-anthesis and post-anthesis of 16 genotypes (Paragon wheat cultivar; single seed descent (SSD) elite derivatives; MAGIC lines and SSD landrace derivatives) in 2017 and 2017–18
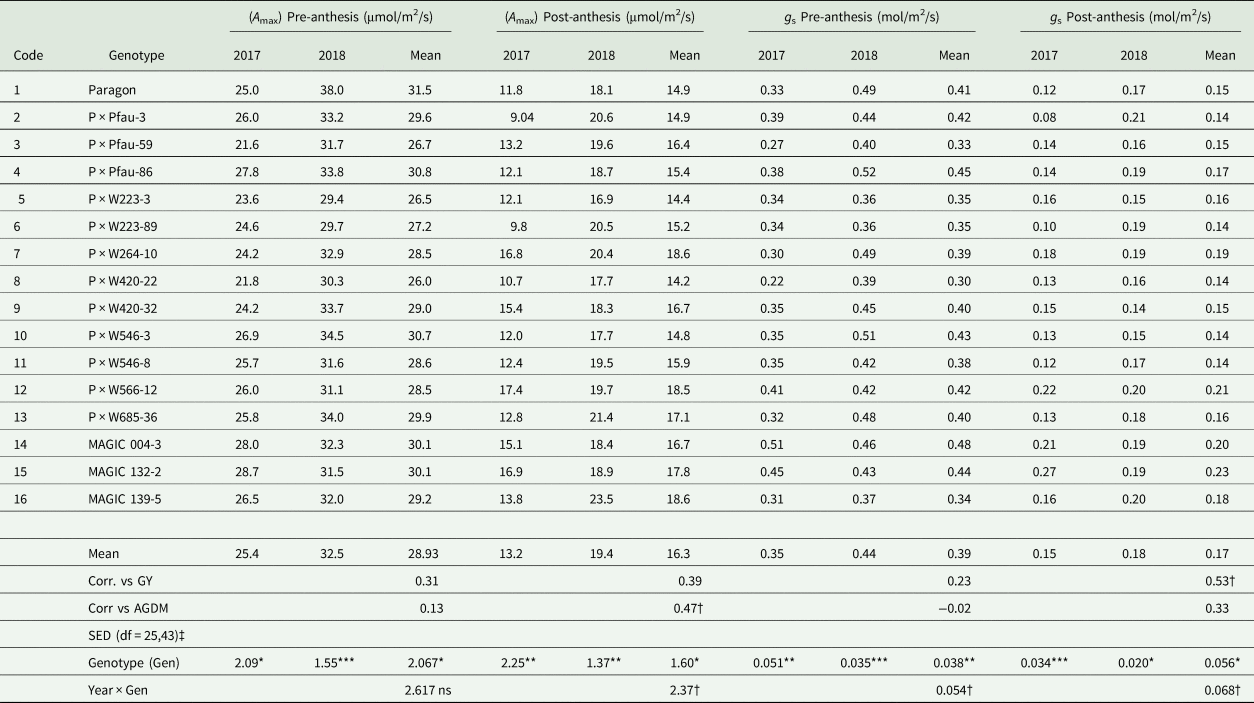
* P < 0.05; ** P < 0.01; *** P < 0.001 and † P < 0.10. SED, standard error of difference of the means. ‡ Degrees of freedom = df. SED. for individual season = 24, SED for cross-season = 43.
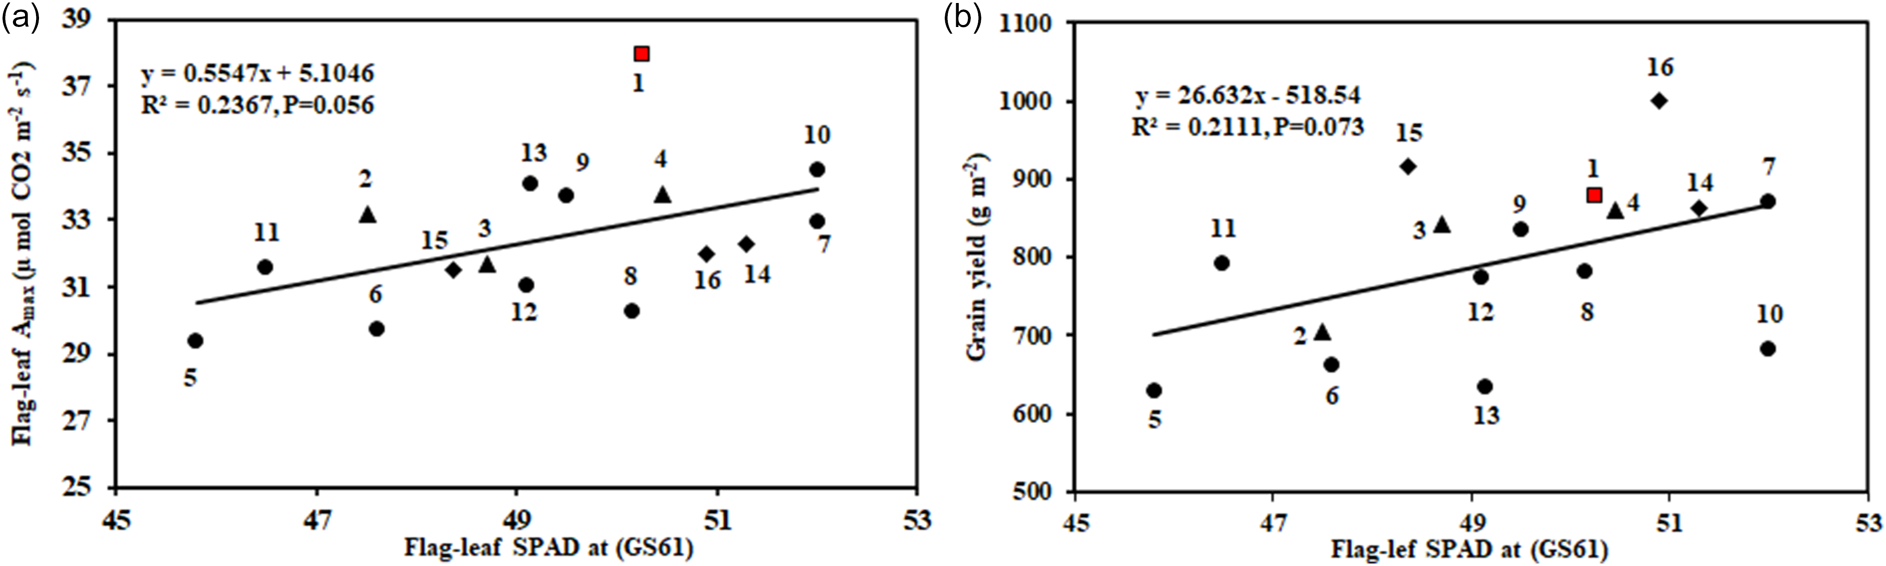
In 2018, pre-anthesis flag-leaf photosynthesis rate ranged amongst genotypes from 29.4 to 38.0 μ mol/m2/s (P < 0.001) and post-anthesis from 16.9 to 23.5 μ mol/m2/s (P = 0.002, Table 4). No line showed transgressive segregation above Paragon for pre-anthesis flag-leaf A max, while one SSD landrace-derived line (PxW685-36) was higher than Paragon for post-anthesis A max (P < 0.05). There was a trend for a positive correlation amongst genotypes between post-anthesis A max and above-ground dry matter (r = 0.45, P = 0.078, data not shown). Pre-anthesis flag-leaf stomatal conductance varied amongst genotypes from 0.36 to 0.52 mol/m2/s (P < 0.001) and post-anthesis from 0.14 to 0.21 mol/m2 s−1 (P = 0.028, Table 4). There was a trend for a positive correlation between flag-leaf relative chlorophyll content at anthesis amongst the 16 genotypes and each of pre-anthesis flag-leaf A max (R 2 = 0.23, P = 0.056, Fig. 3a) and grain yield (R 2 = 0.21, P = 0.073, Fig. 3b).
Linear regression of (a) flag-leaf (A max) pre-anthesis on flag-leaf relative chlorophyll content (SPAD) at anthesis (GS61) and (b) grain yield on flag-leaf relative chlorophyll content (SPAD) at anthesis (GS61) for 16 wheat genotypes (Paragon wheat cultivar ■; 3 single seed descent (SSD) elite lines ▴; 3 MAGIC lines ♦ and 9 SSD) landrace derivatives •). (Value represents means of 2017–2018). For genotype codes see Table 1.
Averaging across seasons, flag-leaf photosynthesis rate ranged amongst genotypes from 26.0 to 31.5 μmol/m2/s pre-anthesis (P < 0.05) and 14.2–18.6 μmol/m2/s post-anthesis (P < 0.05, Table 4). Two SSD landrace-derived lines (P × W264-10, P × W566-12) were greater than Paragon for post-anthesis A max (P < 0.001). There was a trend for a positive linear relationship amongst genotypes between post-anthesis flag-leaf A max and above-ground dry matter (r = 0.47, P = 0.06, Table 4). Flag-leaf stomatal conductance varied amongst genotypes in the range 0.31–0.49 mol/m2 s−1 pre-anthesis (P < 0.01) and 0.14–0.23 mol/m2/s post-anthesis (P < 0.01, Table 4). Two SSD landrace-derived lines (P × W264-10, P × W566-12) showed transgressive segregation above Paragon for post-anthesis g s. There was a positive correlation between post-anthesis g s and grain yield (r = 0.53, P = 0.02, Table 4). Broad-sense heritability (H2) for pre- and post-photosynthesis rate was 0.75 and 0.67, respectively, and for pre- and post-stomatal conductance was 0.75 and 0.70, respectively. These high heritabilities are consistent with the finding that the year × genotype effect was not significant for either flag-leaf A max or stomatal conductance pre- or post-anthesis.
Flag-leaf senescence
In 2017, genotypes differed in the onset of flag-leaf senescence (SENONSET) from 206 to 380 °Cd post-anthesis (P = 0.04; Fig. 4). In 2018, genotypes ranged from 279 to 38 2°Cd (P = 0.002). Five SSD landrace-derived lines showed transgressive segregation for delayed SENONSET compared to Paragon (P < 0.05) in 2018. Averaging across years, genotypes varied in onset of flag-leaf senescence from 277 to 359 °Cd (P < 0.01; Table 3).
Linear regression of (a) grain yield (g/m2) on flag-leaf visual senescence onset (SENONSET, °Cd) in 2017; (b) grain yield (g/m2) on flag-leaf visual senescence onset (SENONSET, °Cd) in 2018; and (c) grain yield (g/m2) on flag-leaf visual senescence onset (SENONSET, °Cd) in 2017–2018; for 16 wheat genotypes (Paragon wheat cultivar ■; 3 single seed descent elite derivatives ▴; 3 MAGIC lines ♦ and 9 single seed descent landrace derivatives).

There was no significant positive association between SENONSET and grain yield per unit area in 2017 or in 2017–2018 or for the average across seasons (Fig. 4). Broad-sense heritability (H2) was 0.68 for the onset of post-anthesis senescence. The year and year × genotype interaction for SENONSET was significant (P = 0.02 and P = 0.004, respectively).
Discussion
Genetic variation in yield and NUE
The plant height of Paragon (84 cm) was shorter than all the SSD landrace-derived lines; Paragon is a modern semi-dwarf (Rht8) cultivar. Reduced height in modern wheat leads to an increase in dry matter partitioning to the grain with decreased competition from the stem resulting in greater spike growth, more grains per ear and higher HI, while in taller landraces relatively more biomass is allocated to the stem (Abeledo et al., Reference Abeledo, Calderini, Slafer, Eds Slafer, Molina-Cano, Savin, Araus and Romagosa2002; Reynolds et al., Reference Reynolds, Foulkes, Slafer, Berry, Parry, Snape and Angus2009). The introduction of semi-dwarfing genes has significantly increased harvest index and lodging resistance, thus increasing wheat grain yield (Foulkes et al., Reference Foulkes, Slafer, Davies, Berry, Sylvester-Bradley, Martre, Calderini, Griffiths and Reynolds2011). As expected in the present experiments there was a negative association between plant height and grain yield, and the landrace-derived lines produced lower yield than the elite bread wheat cultivar Paragon.
Typically for UK spring wheat 120 kg/ha fertilizer N is applied with the soil mineral N providing about a further 80 kg N/ha, i.e. a total N supply of ca. 200 kg/ha. In the present experiment, a moderate N stress was imposed by providing a total N supply of 175 kg/ha, which may represent how UK farmers grow wheat in the future with environmental and economic drivers to reduce N fertilizer use. Overall, grain yield increased from 6.84 t/ha in 2017 to 7.95 t/ha in 2018; the higher yield in 2018 was associated with an autumn rather than a spring sowing date resulting in a longer growing season. The lack of a season × genotype effect for grain yield, biomass, N uptake and NUE may reflect that in the second season (harvest 2018) very dry conditions prevailed post-anthesis (rainfall 0.4 mm compared to 103.8 mm in the second season (harvest 2018). This likely restricted the yield of some of the higher yield potential lines in this season. In particular, the restricted yield for the higher yield potential MAGIC lines may have acted to lower the G × E. In addition, of the 16 genotypes in the study, one was Paragon and 12 were SSD lines derived from Paragon crosses (Paragon crossed with either landraces or CIMMYT spring wheat Pfau). This may also have acted to restrict the G × E to some extent for grain yield.
Overall, the duration from sowing to anthesis was shorter for the SSD-derived landrace lines than Paragon. Across all 16 genotypes there was a trend for a positive association between anthesis date and grain yield associated with later lines producing more grains/m2 in the longer pre-anthesis phase and greater ear growth at anthesis. This agrees with the study of Gaju et al. (Reference Gaju, Allard, Martre, Snape, Heumez, LeGouis, Moreau, Bogard, Griffiths, Orford and Foulkes2011) who reported a significant positive association between anthesis date and grain yield in 16 UK and French cultivars in field experiments in France and the UK under high N and low N conditions. A later anthesis date was associated with increases in both HI and biomass, but the proportionally larger effect was for biomass in our experiments.
In the present study, there was a strong positive association between biomass and grain yield among the genotypes. The modern UK cultivar Paragon yielded higher than the SSD landrace-derived lines as expected. There were only a few cases where biomass and/or N uptake was increased in the landrace-derived lines compared to Paragon in individual experiments; this contrasts with previous findings in the literature, e.g. Gaju et al. (Reference Gaju, DeSilva, Carvalho, Hawkesford, Griffiths, Greenland and Foulkes2016). Averaging across years, no landrace-derived line had significantly higher biomass or N uptake compared to Paragon. There was trend for higher biomass for the three MAGIC lines compared to Paragon. However, these three MAGIC lines were selected as spring types from a complex pedigree tracing seven elite winter cultivars and one elite facultative cultivar (Xi19). As such, they are likely to be very distinct from other spring genotypes, as they are essentially winter types in all but growth habit. Gaju et al. (Reference Gaju, DeSilva, Carvalho, Hawkesford, Griffiths, Greenland and Foulkes2016) reported higher biomass for five wheat landraces under low N conditions in field experiments compared to Paragon, but not under high N conditions as mentioned above. With regard to yield components, there was a significant positive association among the genotypes between grain yield and grains/m2 but no association with grain weight. Since grains/m2 is determined by anthesis it can be concluded that grain yield was principally related to pre-anthesis processes: i.e. radiation capture, radiation-use efficiency, or spike dry matter partitioning.
Genetic variation in photosynthesis traits
In wheat crops sink limitation or co-limitation (by source and sink) of grain yield is typically reported in the absence of post-anthesis stresses (Acreche and Slafer, Reference Acreche and Slafer2009), indicating that no association between flag-leaf visual senescence and grain yield might be expected under moderate N limitation. In the present experiments, the overall association between onset of flag-leaf senescence and grain yield was not significant. Furthermore, the single seed descent landrace lines had low HI and hence grain growth would be expected to be sink-limited. In 2018, five SSD landrace-derived lines showed transgressive segregation for delayed onset of senescence compared to Paragon. Averaging across years, one SSD landrace-derived line (PxW420-32) showed delayed onset of senescence compared to Paragon. However, the lack of association between stay-green traits and grain yield suggested that yield of the lines was sink limited in the present experiments. Therefore, grain yield was likely associated with pre-anthesis traits affecting spike growth at anthesis and grain/m2. The mechanisms causing the genetic variation in flag-leaf SENONSET may be associated with later N remobilization and/or greater post-anthesis nitrogen uptake (Gaju et al., Reference Gaju, Allard, Martre, Snape, Heumez, LeGouis, Moreau, Bogard, Griffiths, Orford and Foulkes2011). Deeper roots could promote post-anthesis N uptake (Foulkes et al., Reference Foulkes, Hawkesford, Barraclough, Holdsworth, Kerr and Shewry2009).
Significant genetic variation was identified in pre-anthesis and post-anthesis flag-leaf photosynthesis rate. In the experiments, SSD landrace-derived lines generally had lower pre-anthesis A max compared to Paragon. This agrees with the field study of Gaju et al. (Reference Gaju, DeSilva, Carvalho, Hawkesford, Griffiths, Greenland and Foulkes2016). The MAGIC lines showed a trend for higher post-anthesis A max compared to other genotypes. Higher flag-leaf A max for Paragon and MAGIC lines compared to the SSD landrace-derived lines was related to higher flag-leaf relative chlorophyll content, indicative of higher leaf N content and Rubisco content. Genotypic variation in leaf photosynthetic efficiency can be exploited by integration into breeding programmes aimed at improving biomass and grain yield (Fischer and Edmeades, Reference Fischer and Edmeades2010; Lawson et al., Reference Lawson, Kramer and Raines2012). In our study, under moderate N supply genetic variation in post-anthesis flag-leaf A max was positively correlated with biomass, indicating it could be a useful breeding trait to improve wheat biomass and grain yield. Gaju et al. (Reference Gaju, DeSilva, Carvalho, Hawkesford, Griffiths, Greenland and Foulkes2016) reported for 15 genotypes, comprising five landraces, five UK modern cultivars and five synthetic-derived hexaploid wheat lines, a strong positive association between pre-anthesis flag-leaf photosynthetic rate A max and grain yield under optimal conditions. Similar results were reported by Fischer et al. (Reference Fischer, Rees, Sayre, Lu, Condon and Saavedra1998) in field-grown wheat under irrigated conditions in Mexico, where pre-anthesis flag-leaf photosynthesis rate was positively associated with grain yield amongst eight spring wheat cultivars. Also, positive association was reported between post-anthesis flag-leaf photosynthetic rate and biomass for 30 wheat cultivars under high N conditions for spring wheat in India by Nehe et al. (Reference Nehe, Misra, Murchie, Chinnathambi, Singh Tyagi and Foulkes2020). It is possible in our study that higher grain sink strength was causing the higher post-anthesis A max through upregulation of leaf photosynthesis rate (Murchie et al., 2023). In the present study, flag-leaf chlorophyll content (SPAD) at anthesis was positively associated with pre-anthesis flag-leaf A max. Similar results were reported by Xiao et al. (Reference Xiao, Qian, Wu, Liu, Xia, Ji and He2012), who found positive association between leaf chlorophyll content and leaf A max in winter wheat cultivars in China under field conditions.
Improving leaf photosynthetic rate has the potential to increase grain yield per unit N input and, therefore, may have a major influence on NUE. Pre-anthesis flag-leaf A max for the modern UK cultivar Paragon was higher at 31.5 μmol/m2/s compared to the average value for the SSD landraces at 28.3 μmol/m2/s. This suggested that plant breeding has likely improved flag-leaf A max and that continued improvement in pre-anthesis A max is an important breeding target for raising grain yield in wheat under UK conditions. This finding agrees with Gaju et al. (Reference Gaju, DeSilva, Carvalho, Hawkesford, Griffiths, Greenland and Foulkes2016), who reported pre-anthesis A max for modern cultivars was 25.2 μmol/m2/s compared to the mean for five landraces at 20.1 μmol/m2/s.
Implications for breeders
Improving photosynthesis is one of the potential strategies for increasing crop production to meet rising food demands (Long et al., Reference Long, Marshall-Colon and Zhu2015; Ort et al., Reference Ort, Merchant, Alric, Barkan, Blankenship, Bock, Croce, Hanson, Hibberd and Long2015; Wu et al., Reference Wu, Hammer, Doherty, von Caemmerer and Farquhar2019). The three MAGIC lines tested are essentially winter wheat genotypes carrying introgressions from one founder which conveys spring growth habit. The high performance of these lines suggests that genetic variation from elite winter types can be used for spring wheat improvement without compromising spring habit phenology. The positive correlation between post-anthesis leaf A max and biomass indicated promise for inclusion of leaf A max in models to predict crop biomass in wheat breeding. Because the leaf gas-exchange measurements are not high-throughput, screening for these traits may require the use of remote sensing techniques, e.g. leaf or canopy spectral reflectance (Zazueta-Robles et al., Reference Zazueta-Robles, Molero, Pinto, Foulkes, Reynolds and Murchie2021) to predict leaf photosynthesis traits, non-photochemical quenching and senescence from which to build predictive models of biomass. Traditional crop phenotyping methods for biomass are labour-intensive, time-consuming and often destructive to plants (Chen et al., Reference Chen, Neumann, Friedel, Kilian, Chen, Altmann and Klukas2014). Thus, these techniques are hard to deploy in the field, especially in breeding programmes where hundreds of plots are grown in close proximity. To improve throughput of canopy spectral reflectance measurements and reduced diurnal variation over the time-course of measurements one strategy may be the use of unmanned aerial vehicles (UAVs) (Araus and Cairns, Reference Araus and Cairns2014; Kyratzis et al., Reference Kyratzis, Skarlatos, Menexes, Vamvakousis and Katsiotis2017). Present results show that flag-lead A max is a key trait linked to biomass accumulation and yield, but the measurement of leaf and/or canopy photosynthesis has been limited to date in large-scale physiological breeding. Recently, high-throughput plant phenotyping approaches deploying spectral reflectance indices, including water indices, normalized difference vegetation index and enhanced vegetation index, were also used in field-grown wheat to predict genetic radiation-use efficiency with up to 70% accuracy compared with ground-truth data (Robles-Zazueta et al., Reference Robles-Zazueta, Molero, Pinto, Foulkes, Reynolds and Murchie2021). Such canopy vegetation indices will be instrumental to explain canopy photosynthetic processes and potentially predict RUE and biomass in different crops or ecosystems. In addition, further studies are required combining genetics and physiology to identify the location of QTLs for leaf/canopy photosynthesis and senescence-related traits linked to biomass and NUE as well as QTL interactions with N availability.
Conclusion
The current results show there was a trend for a positive correlation among the wheat genotypes between post-anthesis flag-leaf photosynthesis rate and biomass. Two landrace derivatives showed higher post-anthesis flag-leaf photosynthesis rate and stomatal conductance than their elite parent Paragon. Our results indicate that introgression of traits from wider germplasm into elite UK modern wheat germplasm offers scope to raise flag-leaf photosynthetic rate and biomass.
Supplementary material
The supplementary material for this article can be found at https://doi.org/10.1017/S002185962400056X
Acknowledgements
We thank John Alcock and Matt Tovey at University of Nottingham for their assistance with managing the field experiments. We also thank Andrew Mead and Suzanne Clark of Rothamsted Research, UK for their advice with the statistical analysis.We also thank CIMMYT for use of the Paragon × Pfau SSD lines.
Author contributions
MJF, MJH, SG and PH conceived and designed the study. SK, JD and MW conducted the data gathering. SK and MJF performed statistical analyses. MJF and SK wrote the article. MJH, SG and PH edited the article.
Funding statement
This work was supported by the United Kingdom Biotechnology and Biological Sciences Research Council [grant number BB/N013360/1]. The work was also supported by strategic funding Rothamsted Research and the John Innes Centre receive from the Biotechnology and Biological Sciences Research Council (BBSRC) and we acknowledge support from the Delivering Sustainable Wheat (BB/X011003/1) Institute Strategic Programme. We also thank the Merit Scholarship Programme for funding the PhD studentship of Shadia Kareem.
Competing interests
The authors declare there are no conflicts of interest.
Ethical standards
Not applicable.



