A prominent conception of representative democracy, dating back to at least James Madison, holds that periodic voting promotes political accountability (Madison [1788] Reference Madison1966). This “electoral connection” (Mayhew Reference Mayhew1987) encourages representatives to serve their constituents for fear of being ousted on election day. Prior empirical research on whether such a connection exists falls into two categories. First, do representatives shirk in their final term in office (when the electoral connection is absent)? Second, do representatives shirk when elections are distant in time (when the electoral connection is weakened)?
In this paper, we shine new light on these questions using a new measure of constituency services as well as a new quasi-experimental research design. Addressing constituency requests is a central activity for most elected officials (Cain, Ferejohn and Fiorina Reference Cain, Ferejohn and Fiorina1987; Mayhew Reference Mayhew1987; Fiorina Reference Fiorina1989, Chapter 7; King Reference King1991).Footnote 1 Yet, relatively few studies assess whether electoral incentives improve constituency responsiveness—or, conversely, whether a weaker electoral connection causes politicians to shirk on this activity.Footnote 2 We therefore collect data on more than 15 million service requests placed by residents in New York City (NYC) and San Francisco (SF). We then link these data with the election districts of local city councilors to study how response times to service requests are shaped by councilors’ electoral incentives.
To do this, we first take advantage of an unusual policy change in NYC, where city councilors voted in 2008 to extend their own term limits from two to three terms. This policy change allows us to implement a difference-in-differences (DiD) strategy, comparing changes to response times in districts with newly eligible councilors to changes in districts represented by first-term councilors, who were always eligible for reelection. This strategy eliminates many confounders that could bias the relationship between electoral incentives and incumbent effort, such as cross-sectional quality differences between politicians (due to skill or experience) and time shocks that affect responsiveness among all representatives. The results from this analysis indicate that elections substantially improve constituency responsiveness.
To further assess the importance of elections, and to extend our analysis beyond NYC, we also analyze whether incumbents are less responsive earlier in their terms when voters direct less attention to politics (Huber, Hill and Lenz Reference Huber, Hill and Lenz2012; Lenz and Healy Reference Lenz and Healy2014). Term limits and staggered elections mean that incumbents within the same city run for reelection at different times. Thus, we compare changes to responsiveness among reelection-seeking incumbents to changes among incumbents who either have a reelection bid at a later time or are ineligible to seek reelection. We find that, while constituency responsiveness improves in all districts as elections approach, it improves much more rapidly in districts represented by reelection-seeking incumbents. The flip side of this finding, of course, is that incumbents exert relatively less effort earlier in their terms.
In addition to providing placebo tests to shore up the validity of our research design, we address two alternative interpretations of these results. First, we show that the results do not reflect effort reallocation from or to legislative activity (e.g., introducing or sponsoring ordinances or resolutions). We find that incumbents’ efforts on legislation remained constant even as they were becoming more responsive to demands for constituency services. Second, we do not find that constituents submitted more (or fewer) requests in districts where councilors became eligible for a third term. Our results are driven by the supply of constituency service, not changes in demand for councilors’ time.
Our findings support the conception of representative democracy articulated by Madison. They also bolster prominent political economy models on elections (Nordhaus Reference Nordhaus1975; Tufte Reference Tufte1978; Rogoff Reference Rogoff1990; Przeworski, Stokes and Manin Reference Przeworski, Stokes and Manin1999; Besley Reference Besley2006; Alt, Bueno de Mesquita and Rose Reference Alt, Bueno de Mesquita and Rose2011; Dewan and Shepsle Reference Dewan and Shepsle2011). Despite elegant predictions, these models have been refuted (e.g., Lott and Bronars Reference Lott and Bronars1993; Rowley, Schneider and Tollison Reference Rowley, Schneider and Tollison1993; Carson et al. Reference Carson, Crespin, Jenkins and Vander Wielen2004; Besley Reference Besley2006; Keele, Malhotra and McCubbins Reference Keele, Malhotra and McCubbins2013) almost as many times as they have been supported (e.g., Besley and Case Reference Besley and Case1995; Figlio Reference Figlio1995; Rothenberg and Sanders Reference Rothenberg and Sanders2000; Snyder and Ting Reference Snyder and Ting2003; Alt, Bueno de Mesquita and Rose Reference Alt, Bueno de Mesquita and Rose2011; Cummins Reference Cummins2012).Footnote 3 If we look more specifically at constituency services, however, this paper contributes to a growing consensus that elections meaningfully shape how politicians interact with voter requests (Carey, Niemi and Powell Reference Carey, Niemi and Powell1998; Carey et al. Reference Carey, Niemi, Powell and Moncrief2006), at least in a system in which the precise identity of the submitter of the request is unknown. In short, our evidence from two major US cities suggest that models of representative democracy are correct in predicting both that elections discipline politicians and that they create cycles in incumbent responsiveness.
Elections and shirking: theoretical and empirical background
A large literature in political science shows how the electoral connection—which normally forces politicians to exert costly efforts on behalf of constituents—can be severed or attenuated. First, incumbents entering their last terms in office no longer need to worry about voters punishing them at the polls for their (in)actions (e.g., Besley and Case Reference Besley and Case1995; Figlio Reference Figlio1995; Rothenberg and Sanders Reference Rothenberg and Sanders2000). Second, when elections are distant in time, voters pay less attention to their representative’s activities. It is in the immediate run-up to elections that voters direct their attention to politics and, in so doing, discipline politicians (e.g., Nordhaus Reference Nordhaus1975; Tufte Reference Tufte1978; Huber and Gordon Reference Huber and Gordon2004; Shepsle et al. Reference Shepsle, Van Houweling, Abrams and Hanson2009).Footnote 4
These ideas are consistent with a simple maximization problem, in which incumbents weigh the cost of effort (e.g., on bills or constituency service) against the electoral payoff. For ineligible incumbents, there is no electoral payoff, so they do not exert themselves to win over voters; by contrast, those seeking reelection expend effort to shore up their electoral prospects. This generates the first prediction we test in this paper—namely, term limits reduce incumbent effort.Footnote 5
Now suppose that the returns to effort for those eligible to seek reelection increase as the next election approaches. Past research has offered two related reasons for this. First, if retrospective voters suffer from recency bias (e.g., Huber, Hill and Lenz Reference Huber, Hill and Lenz2012; Lenz and Healy Reference Lenz and Healy2014), incumbents concentrate efforts just before their reelection contests—the period that weighs most heavily on voters’ minds when they cast their votes (Nordhaus Reference Nordhaus1975; Tufte Reference Tufte1978; Shepsle et al. Reference Shepsle, Van Houweling, Abrams and Hanson2009). Second, even if voting is prospective rather than retrospective, reelection-seeking incumbents may ramp up their efforts as elections approach to signal their competence (e.g., Rogoff Reference Rogoff1990). These two strands of the literature both imply that the optimal level of effort for eligible incumbents increases as elections approach. Thus, eligible incumbents should increase their effort levels over the course of their terms (while effort among ineligible incumbents should remain constant).Footnote 6
Empirical challenges
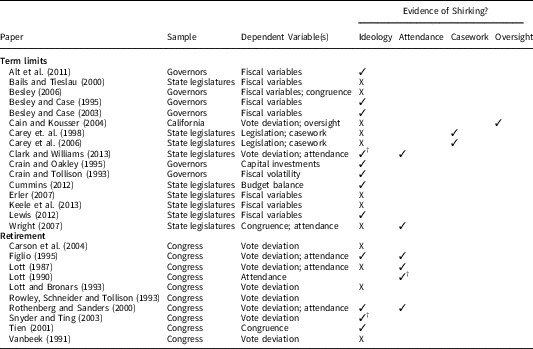
Despite the clarity of these two predictions, one can find empirical studies that claim to support and refute both of them. Table A1 provides evidence for this. This table summarizes 26 studies of last-term shirking in the United States.Footnote 7 Of these studies, half find evidence of shirking while the other half find no or inconclusive evidence.
Table A1 highlights three ways in which empirical studies can be extended to potentially resolve or clarify these mixed results. First, past research has focused on “ideological shirking,” analyzing politicians’ voting records and policy outcomes while in office. Constituency services—one of the most common activities in the daily lives of representatives (Cain, Ferejohn and Fiorina Reference Cain, Ferejohn and Fiorina1987; Mayhew Reference Mayhew1987; Fiorina Reference Fiorina1989; Chapter 7)—have received less attention. Our review revealed two studies of this activity (Carey, Niemi and Powell Reference Carey, Niemi and Powell1998; Carey et al. Reference Carey, Niemi, Powell and Moncrief2006), both of which use measures of constituency services that were self-reported by state legislators.
Second, most studies of shirking focus on only one incumbent activity. Doing so makes it difficult to distinguish between two different outcomes: a shirking incumbent and an incumbent who is reallocating effort across activities. For example, if a last-term incumbent decides to devote ten fewer hours per week to legislation but allocates 20 additional hours per week to casework, a study focusing on legislation may wrongly conclude that the incumbent shirked in her last term. To reduce the possibility that such reallocation could be driving our results, this paper analyzes legislative activity in addition to constituency services. We acknowledge that these activities do not capture all ways in which representatives serve constituents; as Lott (Reference Lott1990, 133) points out, there are “as many [potential measures of effort] as there are outputs that a politician produces.” We present the analysis of legislative action as a suggestive test of (no) reallocation across two important duties.
Third, some research on shirking has relied on cross-sectional comparisons of legislators that are or are not in their last terms in office. Omitted variables that are difficult to measure, such as motivation or quality, may threaten causal inference in such studies. Our design extends more recent work that exploits panel data on officials’ behavior (e.g., Bails and Tieslau Reference Bails and Tieslau2000; Besley and Case Reference Besley and Case1995; Besley and Case Reference Besley and Case2003; Snyder and Ting Reference Snyder and Ting2003; Besley Reference Besley2006; Erler Reference Erler2007; Alt, Bueno deMesquita and Rose Reference Alt, Bueno de Mesquita and Rose2011; Keele, Malhotra and McCubbins Reference Keele, Malhotra and McCubbins2013). These studies compare changes to behavior over time, reducing confounding due to fixed incumbent characteristics. They also avoid selection concerns associated with retirement decisions by restricting comparisons to incumbents whose election eligibility is mandated by law rather than chosen.Footnote 8 We attempt to build on such studies by studying councilors who serve within the same city and deal with similar constituency requests.
Measuring constituency responsiveness in US cities
We collect detailed data on service requests in NYC and SF. These cities log information on each service request filed by residents via 3-1-1, a system recently implemented in many major US cities to redirect non-emergency requests from 9-1-1 and to centralize hotlines maintained by individual city agencies. The NYC database has around 14 million observations going back to 2004; the SF database, around one million observations going back to 2008.Footnote 9
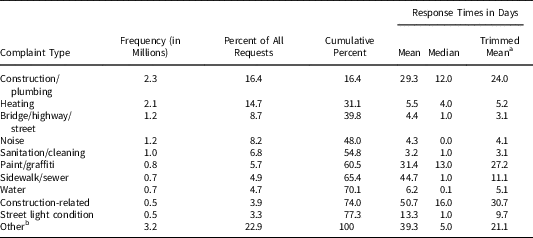
Three aspects of these data allow us to measure local responsiveness to constituency concerns. First, we use the dates a request was opened and closed to measure response times.Footnote 10 We discuss what it means for a request to be opened and closed below. Second, we use the reported location of each request to match it with a council district boundary. Both NYC and SF have single-member districts (51 in NYC and 11 in SF), meaning that requests and council members are uniquely matched. Third, the data contain information about request type (e.g., public housing request, pothole, abandoned vehicle), which allow us to account for different response times to different types of requests in our analysis. The most frequent request types in the NYC database (2004–2013), alongside response time statistics, are displayed in Table 1.Footnote 11
Summary Statistics for the Most Frequent Request Types in New York City (2004–2013)

Note: aExcludes response times above the 99th percentile.
b Includes 88 complaint types, which we keep as separate categories in the analysis.
How city councilors impact service responsiveness
We interviewed 3-1-1 representatives, heads of city agencies, and councilor staff to better understand how service requests are handled by city bureaucracies and to what extent councilors intervene to impact service responsiveness.Footnote 12 Based on these interviews, Table SI.1 provides an outline of how requests are handled from the time they are submitted by a resident until they are closed by agency staff. A request has been opened when all the intake information about the request has been logged and it has been assigned to an agency. An agency will close the request after resolving it (which may require rerouting it to a different agency) or after determining that no action is necessary. Agency workers will physically inspect all reported issues to determine what type of work is needed.Footnote 13
Our interviews highlighted the important role individual agencies play in the 3-1-1 system. 3-1-1 provides a centralized and standardized way for requests to be submitted to various agencies. Once there, agencies are responsible for resolving requests and can prioritize across different requests as they see fit. Thus, it is not surprising that council staff say they regularly turn to agencies to address concerns about service responsiveness in their district. This happens both at a small and a large scale. At a smaller scale, all city council offices we talked to help residents with individual service requests. (Well-staffed offices have a “constituency services” team devoted just to this.) Often, this involves helping the resident file a 3-1-1 request. The councilor office will then follow up with agency intergovernmental liaisons or other agency staff to make sure city workers respond to the request as quickly as possible. Council staff said they are in contact with agencies on a daily basis. For example, a council member concerned about over-development regularly monitors and responds to constituency concerns filed via 3-1-1 or the Department of Buildings. This type of action shows that councilors are highly motivated and able to help residents with service issues.
Our interviews also revealed two ways in which council offices can impact response times at a larger scale. First, they inform and pressure agencies to take action based on broader issues within the district. Several district offices said the council member or an office representative meets frequently with agency commissioners or intergovernmental liaisons. For example, a staff member, speaking of sanitation and transportation issues in the district, told us “[our district representative] discusses the specific issues that constituents have so that they [i.e., the agencies] are aware of them and so that they can take appropriate measures.” Second, they work with other city council officers to form task forces and to take legislative action. For example, a representative from a city council office said that, when they notice that an issue is prevalent, they have a meeting with other councilors, especially councilors that represent similar districts. If they reach consensus, they may launch a task force consisting of central city council administrators, agency representatives, and city council members.
Although we cannot directly quantify the effectiveness of these particular actions in terms of response times, the interviews highlight plausible mechanisms for how elections influence local responsiveness. When councilors are no longer eligible to seek reelection, or when elections are distant in time, councilors are less motivated—and they allocate less time and staff resources—to pressure agencies to impact response times in their district.
Lastly, this discussion may raise the question of why agency commissioners and staff heed the demands of city politicians in the first place. First, the monitoring problems found in many principal–agent relationships are limited in our case. This is because the data collected by the 3-1-1 system can be used to monitor response times at the council district level. City councilors told us they use these data, as well as reports released by the city, to track responsiveness in their district.Footnote 14 Second, council staff report building professional and personal relationship with agency staff. Whether because of social or quid pro quo benefits, such relationships could be used to get agencies to reallocate resources when necessary. Third, if agency commissioners care about their budgets, then they should strive to do well by elected officials, who approve the city budget, including funding for both the 3-1-1 program and city agencies. Allocations to these agencies are not guaranteed year-to-year. For example, between fiscal year 2007 and 2010, the Department of Public Works in SF saw its annual general fund allocation drop from nearly $27.9–13.4 millions (San Francisco Department of Public Works 2010).
Effects of reelection eligibility on constituency responsiveness
To estimate a causal effect of reelection eligibility on politicians’ efforts, we take advantage of the term-limit extension instituted by Mayor Bloomberg and the New York City Council on October 23, 2008. The extension enabled the mayor and city councilors to run for three rather than two four-year terms in office. But it did not affect every city councilor equally.Footnote 15 A subset of councilors (14 of 51) were in their first term of office at the time of the decision, and would have been eligible for another term regardless. Another group of incumbents suddenly went from being term-limited to eligible for reelection in the next cycle of elections held in November, 2009.Footnote 16
We implement a DiD design. The treatment group consists of incumbents who were termed out before the October 23, 2008 decision but ran for a third term after the decision. This group has 29 incumbents, as not all of the 37 newly eligible councilors took advantage of the extension.Footnote 17 Our control group is incumbents who were allowed to seek reelection both before and after the decision. We estimate the DiD using the following model with councilor and period fixed effects:
 $$y_{{idt}} {\equals}\alpha _{d} {\plus}\delta _{t} {\plus}\beta D_{{dt}} {\plus}\gamma _{{\rm type}} {\plus}{\epsilon}_{{idt}} ,$$
where i indexes complaint; d, city council district; and t, day. The outcome variable is the number of days it took to resolve the complaint. D dt is an indicator equal to 1 for treated city council districts after the term-limit extension and 0 otherwise. The parameter associated with this variable, β, is of key interest. A negative estimate of β would indicate that response times dropped—improved—in treatment districts relative to control districts after the term-limit extension. The model includes fixed effects for council district (α d) and every day in the time-series (δ t). Because response times vary by the type of request—as Table 1 makes clear—we also include fixed effects for complaint type (γ type). In all analyses, we cluster the standard errors on councilor.
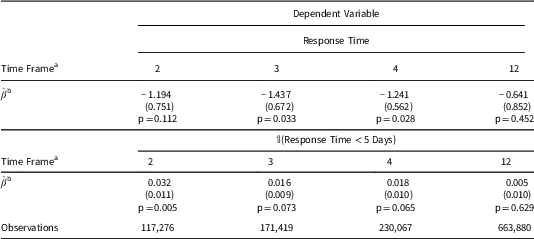
Table 2 presents the results, showing that responsiveness in treated districts improved significantly relative to control areas after the term-limit extension. Using different time windows on either side of the extension (two to four weeks), we find that  $$\hat{\beta }$$
is negative in all cases.Footnote 18 Response times decreased by 1.2–1.4 days, or 4 percent, in treated districts after the term-limit extension (p<0.05 for the three- or four-week time windows; p=0.11 for the two-week window).Footnote 19 Compared to events known to severely hamper city services, these response time changes are meaningful. For example, the January 20–23, 2005 blizzard, which dropped over a foot of snow in NYC, resulted in a 7 percent increase in response times to service requests opened in the time window of the blizzard, and labor day weekends on average result in an 8 percent increase in response times.
Effect of Term Extension on Constituency Services

Note: The average response time fell by more than one day in treated districts.
Standard errors clustered on districts in parentheses.
a Weeks on either side of the extension used to estimate Equation 1.
b Difference-in-differences estimator (see Equation 1).
These results are robust to an alternative modeling strategy. We transform the dependent variable, coding a new binary outcome equal to 1 if a complaint was resolved within five days and 0 otherwise. We then substitute this new outcome variable on the left-hand-side of Equation 1 and estimate linear probability models. The bottom-half of Table 2 includes the results from this specification. The probability that a complaint was resolved within five days increased by 2–3 percentage points in those districts affected by the term-limit extension, as compared to control areas. This should alleviate the concern that large outliers—requests resolved long after the policy change—are unduly influencing the results.
In the final column of Table 2, we include the results using a 12-week window around the policy change. The effect attenuates: the coefficient declines by a factor of between 2 and 5. Two sources of attenuation are consistent with our argument. First, our later results on election timing suggest that our control group (first-term councilors) may have been improving more rapidly in the pre-treatment period. Second, in response to the policy change, treated councilors ramped up efforts and reduced response times relative to controls, which generated an initial dip in response times in the post-treatment period relative to control. Yet, as time passed, all councilors-seeking reelection—both treated and control—converged to a similar level; these councilors did, after all, hold the same office and face the same electoral incentives.Footnote 20 Both dynamics are consistent with our account and would lead to an attenuation of our negative effect as we expand the window around the policy change.
Identification
To interpret the estimates presented above causally, the parallel trends assumption must hold. That is, in the absence of the term-limit extension, treatment, and control districts must have followed the same trend in responsiveness.Footnote 21
Going into our analyses, we had two potential concerns about this assumption. First, treated and control councilors could have different pre-treatment trends due to the upcoming election, which took place in November 2009. For example, reelection eligible incumbents (the control group) could be ramping up their efforts in anticipation of the election, relative to ineligible incumbents.Footnote 22 Second, given that city councilors approved the extension, it is possible that they could have anticipated that it would pass. If so, treated incumbents may have ramped up their efforts with constituency services before October 23, when the extension was formally approved in City Hall.Footnote 23
We evaluate the plausibility of the parallel trends assumption in a set of “placebo” tests. We substitute the actual date of passage with a set of earlier, fake dates. We then reestimate the DiD using these new time windows. If these estimates fail to statistically differentiate between treatment and control districts, then we have evidence of parallel pre-treatment trends, which in turn would make us more confident that treatment and control districts would have followed parallel trends in the absence of the term-limit extension.
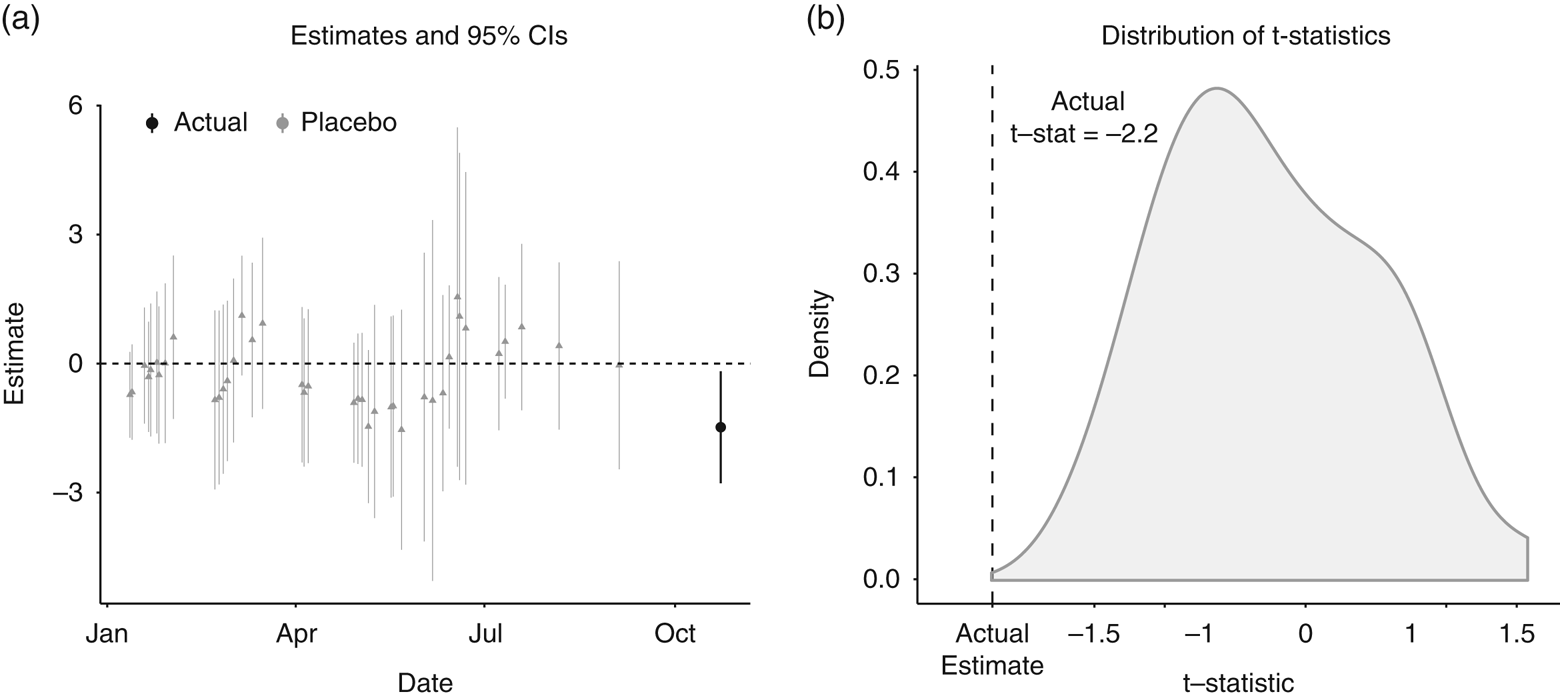
Figure 1(a) displays the placebo estimates and their 95 percent confidence intervals. (They are based on 40 randomly drawn dates from January 1, 2008 to September 11, 2008, six weeks prior to the actual term-limit extension.) The estimate from the actual term-limit extension is the right-most, black point. As is apparent in Figure 1(b), the t-statistic of our actual estimate is more negative than all of the placebo estimates; our actual result is the only coefficient significant at the 5 percent -level. Based on these placebo tests, there is no evidence of diverging pre-treatment trends, shoring up the parallel trends assumption.
Placebo estimates of response time by treatment status. Note: Placebo tests indicate that divergent pre-treatment trends do not explain the effect. CI=confidence interval.

Estimates with 95 percent CIs from 40 placebo dates drawn at random from January 1, 2008 to September 11, 2008. The actual term-limit extension was on October 23 and is the right-most, black point. Each estimate uses three weeks of data on either side of each placebo date; thus, dates that fall in the six weeks between September 12 and October 22 are ineligible for inclusion (as these dates would necessitate the inclusion of post-October 23 data, contaminating the placebo tests). On the right, we show the distribution of t-statistics from these estimates; our actual result is indicated by the dashed line.
Effects of Election Timing on Constituency Responsiveness
Do elections also affect when incumbents exert effort? We use data from two elections to answer this question: the New York City Council Elections of 2005, and the analogous San Francisco Board of Supervisor Elections of 2010.
Empirical strategy
We compare incumbents who are seeking reelection (treated) with incumbents who cannot seek reelection due to term limits or staggered elections (control). In NYC, which has term-limits but no staggered elections, 44 of 51 incumbents ran for reelection in 2005. In SF, which has term-limits and staggered elections (half of the Board is elected every two years in alternating elections), one incumbent sought reelection in 2010. We pool data across the two elections; SI 9 presents the results for the two elections separately.
We evaluate whether response times fall more precipitously as elections approach in districts where incumbents are eligible to stand for reelection, relative to districts represented by an ineligible councilor. To do this, we estimate the trends in response times for both groups after accounting for level differences across districts, the nature of the complaint, and the day of the week on which a complaint was filed. Our empirical model is
 $$y_{{idt}} {\equals}\alpha _{d} {\plus}\delta t{\plus}\beta (D_{d} \cdot t){\plus}\gamma _{{\rm type}} {\plus}\phi _{{\rm day}} {\plus}{\varepsilon}_{{\rm idt}} ,$$
where i indexes complaints, d city council district, and t represents days before the relevant election date. D d is an indicator for treated city council districts (i.e., those with an eligible incumbent). We include fixed effects for districts, request type, and the day of the week on which the complaint was made, and cluster the standard errors at the council district. To analyze legislative efforts, we use the same specification without the fixed effects for complaint type (γ type) or the day of the week (ϕ day).
We again label the quantity of interest as β.Footnote 24 The key identifying assumption is that eligible and ineligible incumbents would have followed parallel trends in response times absent elections. A negative estimate indicates more sharply declining response times among treated incumbents (i.e., increased effort) relative to control incumbents.
Results
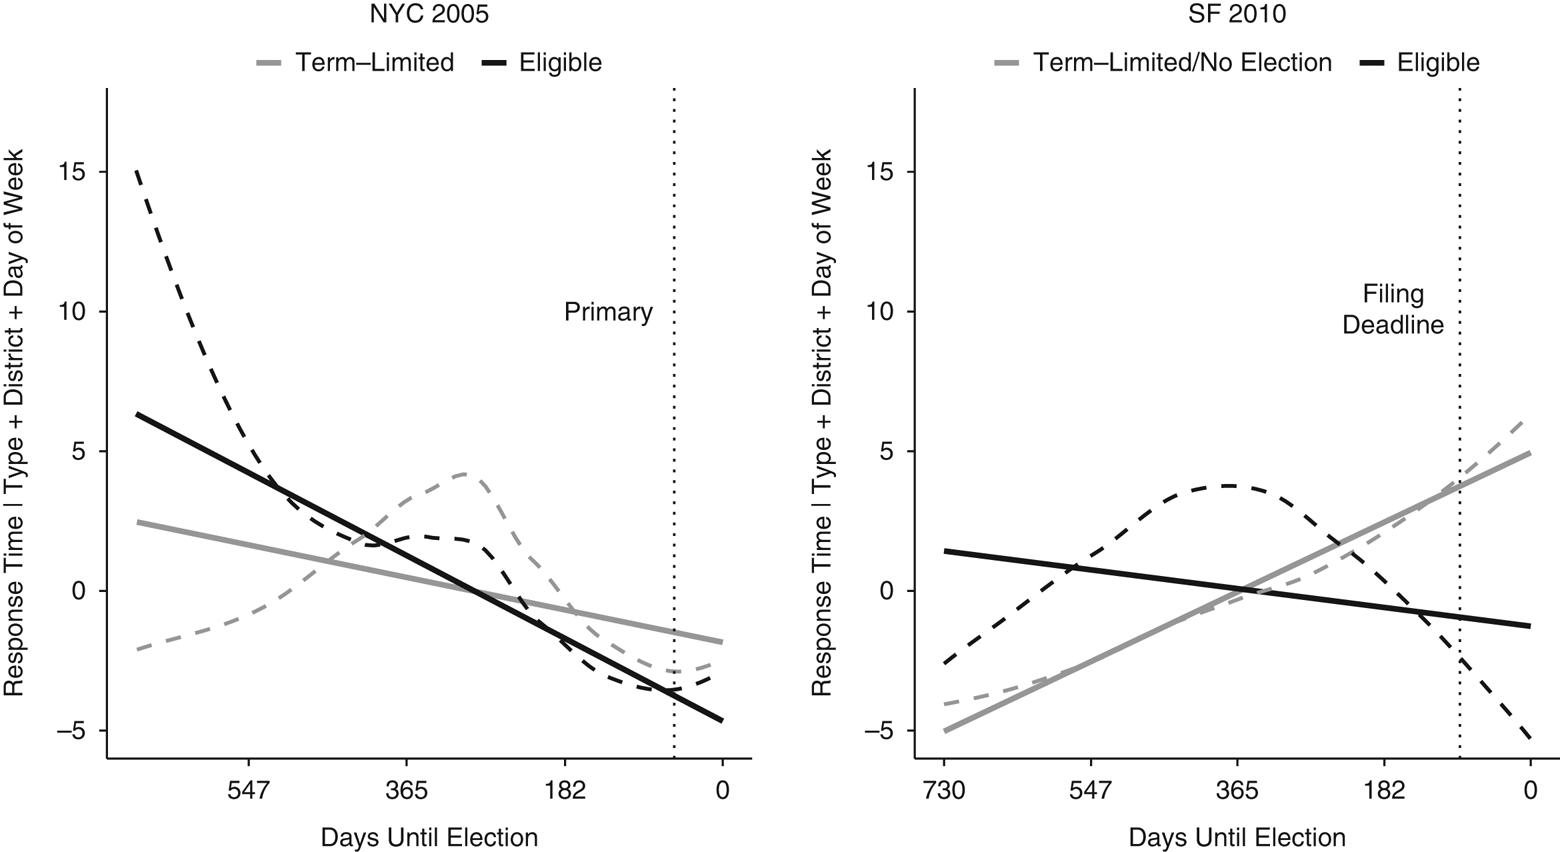
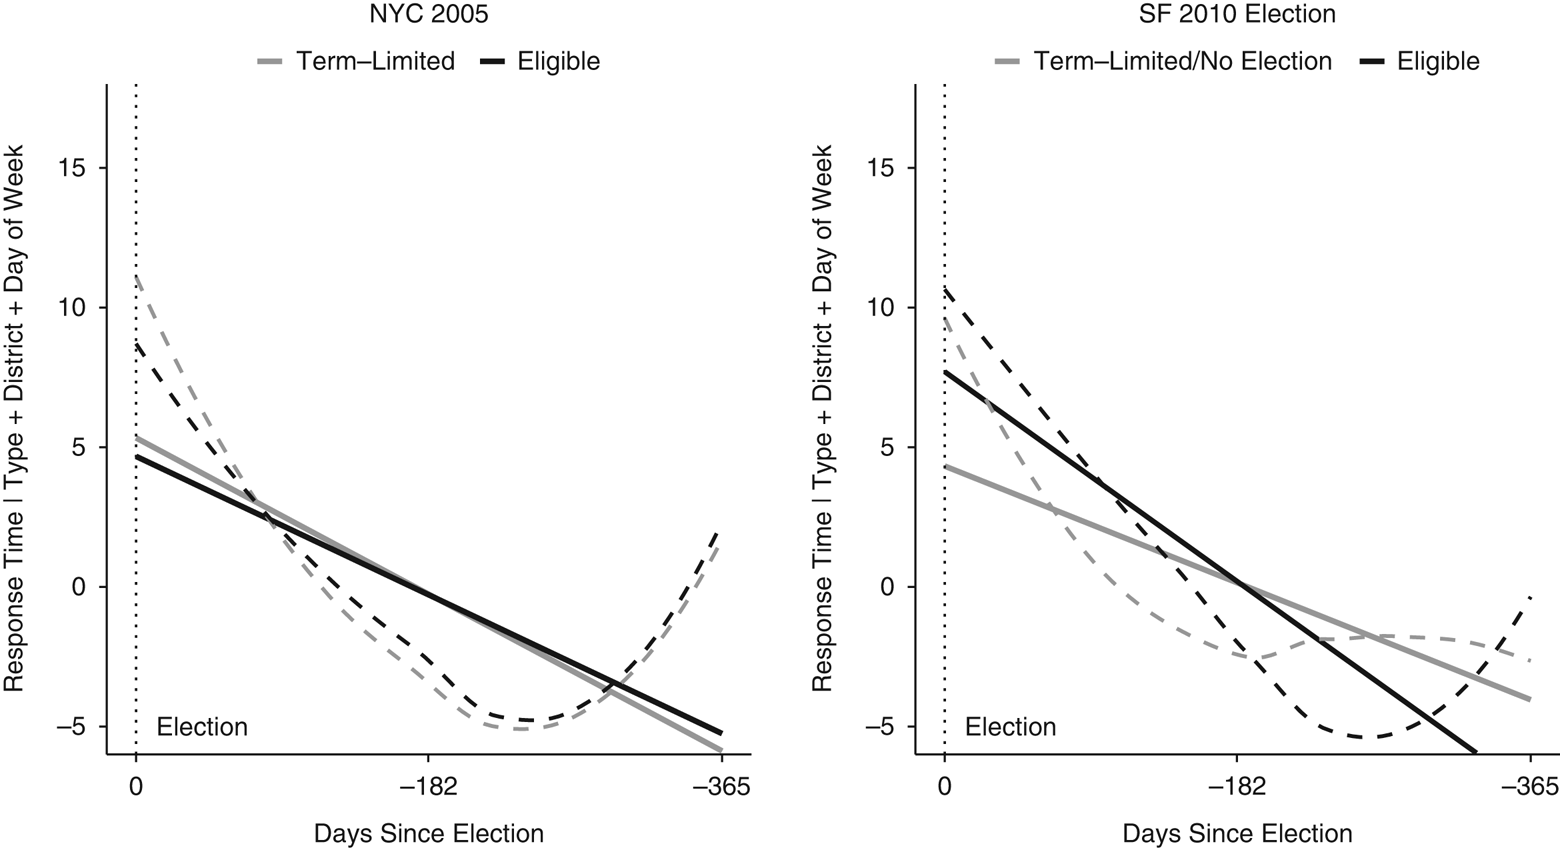
In Figure 2, we explore whether the timing of elections affects responsiveness to 3-1-1 requests using a non-parametric approach that allows for non-linear trends. In both NYC and SF, it appears that response times to service requests declined more rapidly in treated districts than in control districts. (Before creating this plot, we first partial out the variation in response times explained by the complaint type, council district, and day of the week on which the complaint was made.) The SF figure (right) is particularly striking: roughly one year prior to the election, response times fell off sharply in the treated district, while they continued to increase in districts with ineligible incumbents. In NYC (left), response times appear to be declining almost monotonically in treated districts, while in control districts, response times continue to increase through the winter months of 2005. This figure demonstrates that our findings persist, even if we allow for flexibly estimated time-trends.Footnote 25
Response times prior to the election by treatment status. Note: Response times fall faster in districts with eligible incumbents up to primary election or filing deadline. Solid lines are linear trends; dashed lines are loess smoothers. NYC=New York City; SF=San Francisco.

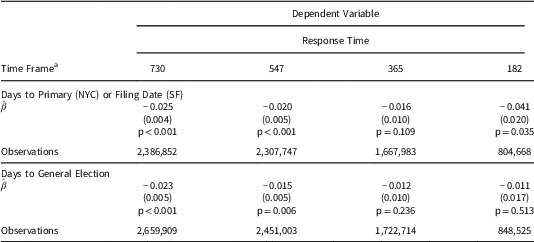
In Table 3, we present the results from estimating Equation 2 using the primary and general election dates.Footnote 26 We prefer to use the date of the primary, as incumbents’ electoral threats diminish sharply after these political events. In all but Staten Island (where Republicans dominate), Democratic primary winners in NYC went on to win their general election contests in landslides. In SF, the eligible incumbent was assured of running unopposed after the candidate filing deadline.
Estimates of Differential Time-Trends in Constituency Services (β in Equation 2)

Note: The linear trend in responsiveness falls significantly faster where incumbents can run for reelection.
Standard errors clustered on districts in parentheses.
NYC=New York City; SF=San Francisco.
a Maximum number of days before election used to estimate Equation 2.
We also split the results by the number of days before the election we use to estimate Equation 2, corresponding to 2, 1.5, 1, and 0.5 years.Footnote 27 The estimates of β are negative in all models, indicating that response times declined more rapidly in districts with an eligible incumbent. The finding does attenuate when we use the period six months before the general election. At least thirty percent of this period occurs after primary elections, after which the electoral returns to amplified effort for eligible incumbents may sharply diminish.
To interpret the substantive effect of the estimates, note that they represent the implied effect for one service request as we move one day closer to the election. The estimates from column 1 imply that moving six months closer to the election corresponds to a four-day reduction in response times in treated districts relative to control. These effects are larger than the change in response times induced by the January 2005 blizzard in NYC or by labor day weekends, events that substantially affect service delivery.
We analyze the elections separately in SI 9, and one aspect of the SF election is worth highlighting. The estimates are more negative when the control group is term-limited incumbents rather than incumbents facing no election in 2010 (due to staggered elections). Theories of election cycles imply that incumbents facing reelection—even if that contest will not occur for two more years—should be more concerned about public service responsiveness than term-limited incumbents. Voters may be particularly attuned to the responsiveness of their elected officials during election times, whether or not their supervisor is seeking reelection. Thus, from the perspective of an incumbent seeking reelection in two years, improved performance during this time period may be an opportunity to persuade future supporters at a moment when supervisors’ efforts are particularly salient.Footnote 28
If these differences are driven by reelection incentives, then they should disappear after the election. As Figure 3 illustrates, the trends in our treated and control districts appear very similar in the year after the election. In SI 8 we perform a series of placebo tests using data from the post-election period, and these results also suggest that trends in responsiveness do not diverge after the elections. When election contests are not imminent, response times follow similar trends in our treated and control districts.Footnote 29
Response times by treatment status after the election. Note: After the election, response times do not fall faster in the districts of previously eligible councilors. Solid lines are linear trends; dashed lines are loess smoothers. NYC=New York City; SF=San Francisco.

As an additional falsification test, we look at the November 2009 NYC city council election—a contest in which all incumbents were eligible to run by virtue of the term-limit extension. With no variation in eligibility, we expect to find similar trends in responsiveness among first and second-term incumbents. Reassuringly, our estimates of β in this context are precisely estimated zeros (see Table SI.7). This provides additional evidence that variation in election eligibility explains our findings.
Reallocation from legislative activity?
To assess whether improved response times to constituency services come at the expense of legislative action, we also collected data on city councilors’ legislative activity. The data for NYC come from the city’s Legislative Research Center, which compiles all of the legislation introduced in each city council meeting, including information on which councilors sponsored or co-sponsored the actions.Footnote 30 We collect similar data for SF. In November 2009, the SF Board of Supervisors started to publish information about which supervisors sponsored particular ordinances, resolutions, and requests for hearings at each Supervisor meeting.Footnote 31
These data sources allow us to generate panel data on legislative activity for every city councilor and supervisor in NYC and SF. For both cities, we code our outcome variable as the number of local laws and resolutions sponsored or co-sponsored by a council member at each meeting. As councilors are better able to control when a bill is introduced than when it is eventually passed, we use the date of the council meeting in which the legislation was introduced and not the date of its eventual passage or dismissal.
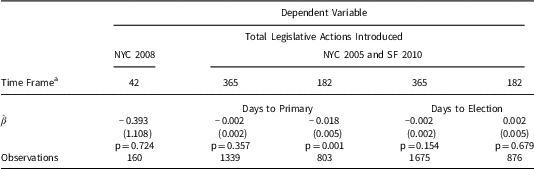
We find no consistent evidence that the term-limit extension or approaching elections change legislative effort. Using Equation (1) for column 1 and Equation (2) for columns 2–5 (omitting fixed effects for complaint type and the day of the week), the estimates are small in magnitude and typically indistinguishable from zero. The one significant coefficient in column 3 implies that eligible incumbents (co)sponsored three fewer actions in the six months prior to the primary date. During that period, the average eligible incumbent sponsored over 65 sixty actions (SD=40); this effect represents a less than five percent change in their overall activity. These findings suggest that incumbents were not cutting back on legislative effort as they ramped up their work on constituency services (Table 4).Footnote 32
Estimates of Changes in Legislative Activity

Note: Eligible incumbents do not meaningfully reduce their legislative efforts.
Standard errors clustered on districts in parentheses.
NYC=New York City; SF=San Francisco.
a Days before election used to estimate model.
Discussion and conclusion
This paper considers a long-standing question in political science about how elections shape the work that representatives do while in office. Analyzing 15 million service requests from NYC and SF, we find that city councilors’ electoral incentives are a robust predictor of responsiveness to constituents’ concerns. Elections encourage overall improvements to constituency responsiveness, consistent with many models of representative democracy. Elections also induce cycles in responsiveness: incumbents ramp up their efforts as elections approach, suggesting increased effort to signal their competence to voters just before they head to the polls.
These findings contribute to the empirical literature on US local politics. Despite Progressive Era municipal reforms that limited the influence of party machines (Bernard and Rice Reference Bernard and Rice1975; Bridges Reference Bridges1997; Anzia Reference Anzia2012), politics still fundamentally shapes local service provision. For example, polarized political preferences (Alesina, Baqir and Easterly Reference Alesina, Baqir and Easterly1999), the racial identities of politicians and constituents (Hajnal and Trounstine Reference Hajnal and Trounstine2005), and variation in local institutions (Hajnal Reference Hajnal2009) all influence how local governments distribute services. We extend this scholarship by showing how local elections shape the allocation of municipal services within cities over the course of campaigns.
While we are cognizant of the important differences between city and state or congressional offices, our findings also bolster past studies that suggest that state and congressional incumbents-seeking reelection devote more effort to constituency services (e.g., Carey et al. Reference Carey, Niemi, Powell and Moncrief2006). Though evidence of ideological shirking among retiring or ineligible incumbents is mixed (see Table A1), there is greater agreement among the small set of studies that focus on casework or constituency services as an outcome.
Lastly, what are the normative implications of our findings? In Madison’s ([1788] Reference Madison1966) propitious view of representative democracy, elections discipline politicians should they fail to serve voters’ interests. However, our results could also be indicative of pandering (Canes-Wrone, Herron and Shotts Reference Canes-Wrone, Herron and Shotts2001) or responsiveness to a subset of constituents (Sances Reference Sances2016), rather than diligent effort to serve all residents. Two pieces of evidence leave us more hopeful. First, we do not find that incumbents reallocate effort away from legislative activity towards constituency service requests. Election incentives appear to increase overall effort; eligible incumbents are not obviously pandering by focusing only on voters’ short-term interest. Second, we do not find that our effects are driven by increased responsiveness in neighborhoods with a particular racial composition (see SI 10); in fact, we find no consistent evidence that our effects are moderated by race.Footnote 33 Despite many disaffected voters, an electoral connection persists.
Supplementary Material
To view supplementary material for this article, please visit https://doi.org/10.1017/psrm.2018.46
Acknowledgments
The authors are grateful to Michael Bechtel, Gary Cox, Nick Eubank, Francisco Garfias, Justin Grimmer, Jens Hainmueller, David Hausmann, Clayton Nall, Julia Payson, and participants of Stanford’s American Politics Workshop for comments on earlier drafts. D.C. acknowledges the support of the Stanford Graduate Fellowship.
Appendix 1: Summary of Existing Literature on Last-Term Shirking
We conducted a survey of work on last-term shirking in the United States by collecting articles from 1990 and onward from Google Scholar. We started with results returned from key word searches, choosing articles that clearly studied the effect of term limits or retirement on an outcome that captures incumbent effort. We followed the current literature in defining incumbent effort broadly, for example, including fiscal outcomes that may not be directly attributable to politicians. We identified additional studies by following up on citations in the articles that were initially returned in our search. This procedure resulted in a total of 26 articles on the topic.
Table A1 summarizes these articles. They focus on governors, state legislators, and members of congress. Studies of governors and state legislators analyze the effect of term limits on shirking, while studies of members of congress analyze the effect of retirement. The studies in the table also differ with respect to their dependent variable and, hence, the type of shirking they consider. Most studies analyze ideological shirking—that is, whether the voting record or fiscal policies put in place by last-term incumbents differ from their previous records or their constituents’ preferences. Six studies analyze legislative attendance rates, two studies consider casework/constituency services, and one study looks at agency oversight.
Appendix 2: Summary Statistics
Recent Empirical Investigations of Last-Term Shirking in the United States

Summary Statistics for New York City Service Request Data, 10/23/2007–10/23/2009

Summary Statistics for New York City, 1/1/2004–11/08/2005

Summary Statistics for San Francisco, 11/02/2008–11/02/2010