

1. INTRODUCTION
In 1868, a Belgian textile worker, Frederic S., married a one-year-younger factory worker, Mathilde. After marriage they moved to a house close to their parents and set up a household of their own. Thus far, this couple's life accords with the life many youngsters led in nineteenth-century Europe. However, one feature made them distinctly different from the average married couple. Frederic was born deaf. Getting married and establishing a self-sufficient household were integral parts of everyday living in eighteenth and nineteenth-century Europe. To what extent could a (hearing) disability interrupt or delay this general path in life? In this article, we explore the marriage characteristics of deaf people in the eighteenth- and nineteenth-century province of East Flanders in what is now Belgium, by examining their marital chances and partner choice. The distinctiveness of the marriage pattern of the East-Flemish deaf population is assessed on the one hand by means of a comparison with a non-disabled control group of siblings, and on the other hand by means of a geographical comparison with a group of deaf persons living in the nineteenth-century Sundsvall region of Sweden.
The marital behaviour of past populations has received ample attention from historians. A myriad of both macro- and micro-level studies, national, regional and local histories, with a focus on either key moments in history (such as wartime) or long-term developments, has shed light on intimate aspects of men's and women's lives in the past – from sexual behaviour to love and marriage.Footnote 1 However, not all sections of society have received equal attention. In part, this has been the result of problems in finding adequate source materials. With few chances to trace disabled individuals through the records, historians have largely refrained from inquiring into the opportunities for disabled individuals in this area.
Several scholars have studied the marriage opportunities of disabled men and women in present-day societies. In their research into the lives of women with disabilities, psychology professors Michelle Fine and Adrienne Asch describe how the opportunities of women with disabilities ‘to be nurtured and to nurture, to be lovers and be loved, to be mothers if they desire’ are severely constrained.Footnote 2 Paula A. Franklin also has reported that disabled persons are more likely to marry later and more likely to be divorced.Footnote 3 Lisa Schur, Douglas Kruse and Peter Blanck in their research into the economic, political and social inclusion of people with disabilities discuss how the higher likelihood of living alone among people with disabilities reflects their lower chances of being married.Footnote 4 Sally Sainsbury in Deaf Worlds interviewed over 170 deaf persons living in twentieth-century England and found that a minority of them (36 per cent) were or had been married.Footnote 5 There have been few comparable studies into the marriage opportunities of disabled men and women in the past. In fact, disabled people's everyday lives have rarely been the topic of historical research as most historical approaches to disability have focused on the development of special education and institutions for the disabled.Footnote 6 As a result, disability history has often been reduced to either biographical histories that tell the stories of non-disabled benefactors and what they have done for – or to – people with disabilities, or to studies of social structures in which the disabled are presented as one single, clearly defined group in contrast to an able majority.Footnote 7 Taking into account the experiences of disabled persons has been identified as one of the greatest challenges for disability historians today.Footnote 8
This article has taken up this challenge with social demographic research into the marriage perspectives of deaf people living in the province of East Flanders throughout the late eighteenth and nineteenth centuries. In the field of disability history, the life course approach is largely uncharted territory, probably due to the limited opportunities for identifying disabled individuals in historical sources and the time-consuming nature of the method. Nonetheless, the methodology, which implies that a group of people (a cohort) is followed throughout their lives, offers interesting opportunities for historical disability research and fits the purpose of this research perfectly. Life course analysis allows us to distinguish patterns and ‘average’ marriage trajectories, while not losing track of more individual responses to impairment.
Three research questions constitute the basis of this study. First, did deaf people marry less and/or later than non-disabled persons? From the eighteenth century onwards, East Flanders (as the rest of Northwest Europe) was marked by a high average age at first marriage and a high proportion of permanent singles. This restrictive marriage pattern was the result of the survival of an agrarian tradition that considered the ability to establish oneself autonomously and provide an income as prerequisites for marriage. In the course of the nineteenth century, the continuing fragmentation of farmland, resulting in ever smaller plots with insufficient yields, and the failure of the home-based linen industry in combination with continued population growth, led to an even more restricted attitude towards marriage and children. The already high average age at first marriage further increased to 29 years for men and 27 years for women, and the proportion of men and women who never married increased to an average of one in four shortly after the middle of the nineteenth century.Footnote 9 Higher celibacy rates and ages at marriage for deaf persons may indicate even more difficulties on the marriage market for people with disabilities. Second, whom did deaf individuals marry, and do spouses' characteristics point to a more vulnerable position on the marriage market? As marriage was often inextricably linked to intergenerational transmission of wealth, choosing a marriage partner was a crucial issue in which love was not the primary consideration. In higher-class families especially, marriage strategies were closely tied to more general family strategies regarding social reproduction. Despite differences across social groups, nineteenth-century communities were generally characterised by strongly homogeneous first marriages, implying high uniformity in age, geographical origin and socio-economic status among the couples.Footnote 10 Greater diversity among deaf couples may therefore point to less equal marriages and a weaker bargaining position of deaf men and women on the marriage market. Third and most interesting, to what extent were the marriage chances of deaf people determined by the presence of their impairment alone or did other characteristics, such as gender, socio-economic status and living environment also play their part? By using event history analysis, the statistical analysis on which most quantitative life course analyses are based, the present study provides a first indication of the extent and manner in which impairment interfered with a person's marriage chances.
The first and second research questions involve the comparison of a group of deaf and non-deaf persons from the same generation. Deciding on a representative control group required some consideration. When randomly choosing people one runs the risk of making a distorted selection, which is difficult to compare with the cohort of deaf persons – for example because the control group consists of people from a different strata of society. To avoid this risk, we have chosen to select one of the siblings of each East-Flemish deaf person. As siblings grew up in the same environment as the deaf research individuals, the effect of different early life characteristics potentially influencing future life trajectories is minimised, which increases the comparability of the deaf and non-deaf cohort. Tackling the third research question, we take into account the impact of not only demographic characteristics such as gender, socio-economic status and birth date, but also explore the similarities and dissimilarities in the marriage behaviour of deaf people across regions. As histories of disability so far have rarely taken on a cross-disability perspective, or a cross-regional approach, we have little knowledge of the similarities and differences in the experience of disability in the past. Our comparison between a group of Belgian and Swedish deaf people from the same generations is a first and unique exploratory attempt to question the generality of ‘the deaf experience’ and allows us to obtain a diversified image of disability experiences. As the East-Flemish database compiled by Sofie De Veirman and the dataset collected by Helena Haage and Lotta Vikström from the Demographic Data Base (DDB) at Umeå University are the only historical databases available for disability life course research, the geographical comparison in this research is partly determined by source-related issues. However, socio-economic similarities between the province of East Flanders and the Sundsvall region make the areas particularly interesting for comparison. During the course of the nineteenth century, both East Flanders and the Sundsvall region developed from largely agricultural districts (in the case of Sundsvall a forested region) to areas characterised by industrial settings.Footnote 11 These economic developments changed the social structure of both regions in a similar way. A growing number of youngsters migrated to rural and urban areas as part of their ‘life cycle service’, the number of small-scale business entrepreneurs and white-collar workers expanded, as did the demand for unskilled labourers in industry and urban commerce, resulting in a growing wage-earning working class. By comparing these two regions with similar macro-level conditions, different results in marriage opportunities can shed light on the more intangible factors influencing marriage, such as prevailing attitudes towards access to marriage and the nature of marriage among the deaf.
2. AN INQUIRY INTO THE LIVES OF DEAF MEN AND WOMEN
This research aims to broaden our understanding of the impact that disability had on marriage opportunities by focusing on deaf persons, a group that has received a great deal of attention in the literature. As Jan Branson and Don Miller put it: ‘deaf people have been and continue to be the focus of intensive academic, educational, and medical attention and debate’. Indeed, by the end of the eighteenth century, schools for the deaf were established throughout Europe, and the first important publications on deafness appeared in print.Footnote 12 Beginning in the 1830s, national censuses collected information on the size of the deaf population in Belgium and their level of education. This interest among contemporary researchers, as well as the medical, governmental and religious authorities of the past, probably derives from historical ambivalence regarding both the intelligence and humanity of deaf people. Paul C. Higgins traces this to the debate in Antiquity on what it meant to be human. Early Greek philosophers put forward the idea that thinking cannot develop without language, language cannot develop without speech, and speech cannot develop without hearing.Footnote 13 Branson and Miller also describe how the belief that the power of speech ultimately set mankind apart from the animals played a vital part in the marginalisation of deaf people. Deaf people were therefore assumed to be incapable of human understanding, even ‘mindless’.Footnote 14 Towards the end of the seventeenth century, these assumptions gave way gradually and deaf people began to be viewed as an unfortunate and dependent group of people, perhaps not entirely incapable of thought, but lamentable nonetheless.Footnote 15
From an analytical point of view, the deaf constitute an easily identifiable research group. Today, different types of physical and intellectual impairments each have their own terminology and definitions. Until the twentieth century, however, expressions such as ‘cripple’ and ‘idiot’ were used to cover a wide range of physical and intellectual disabilities. Although the expression ‘deaf and dumb’ is no longer in use, the early distinction of deafness in historical sources enables us to identify deaf people throughout time and across regions. The decision to use a deaf population to study the marriage opportunities of disabled people in the eighteenth and nineteenth centuries is not meant to imply that all disabilities were equivalent. Deaf people had to overcome different barriers, such as communication difficulties, than those faced by people with other types of impairments. Moreover, this research does not aspire to provide a comprehensive history of the deaf; rather, it is an attempt to show how a (hearing) impairment could shape people's lives in different ways, dependent upon the context in which they lived.
3. A DIFFICULT ROAD TO MARRIAGE
Deafness could have affected a person's marriage opportunities in different ways. On the one hand, it may have constituted a direct obstacle. As deaf individuals were restricted in their communication with the majority of hearing men and women, they may have encountered difficulties in establishing personal relationships with future spouses. Especially before the nineteenth century, before the establishment of Belgian deaf schools and with them the spread of literacy among the deaf, opportunities for communication between deaf individuals and hearing people were presumably limited. As such, it may have been more feasible for deaf people to make contact with other deaf people. They could communicate through sign language and they shared the same experiences of being ‘different’ from hearing persons. Moreover, the development of deaf schools and clubs during the nineteenth century provided opportunities for deaf men and women to meet. In fact, in the course of the nineteenth century, in parallel with the development of a blossoming Deaf [sic] community,Footnote 16 some educators became increasingly concerned that the number of deaf people was growing as a result of their segregation and inclination towards marrying other deaf people. In 1883, the American inventor Alexander Graham Bell presented his paper ‘Memoir upon the formation of a deaf variety of the human race’ to the American Academy of Science. To Bell, Deaf culture posed a major threat to society, and marriage was the topic of his closest attention. According to Bell, ‘If the laws of heredity that are known to hold in the case of animals also apply to man, the intermarriage of the congenitally deaf-mutes through a number of successive generations should result in the formation of a deaf variety of the human race.'Footnote 17 Although ultimately none of the laws advocated by Bell was implemented, his writings encouraged people to draw links between marriage customs and a healthy population. The fear of degeneration and the discourse of eugenics, aiming at ‘the eradication or suppression of tainted or inferior human stock’,Footnote 18 spread to the European continent as well. In Europe, the eugenics movement distanced itself from the more radical measures put forward by American eugenicists. Nonetheless, similar ideas gave way to changing cultural attitudes towards people with a disability, including deaf people.Footnote 19 Several Belgian newspaper articles, some dating as early as the 1860s, discuss the undesirability and consequences of deaf marriages. For example, on the occasion of a marriage between two deaf-mutes in Liège in October 1868, L'Echo du Parlement raised the question of whether deaf intermarriages should be forbidden as many believed that ‘qu'elles ne peuvent avoir pour fruits que des êtres incomplets comme les parents qui les procréent’ (‘they can only have offspring who are as incomplete as the parents who procreate them’).Footnote 20 The same belief in evolutionary progress incited teachers of the deaf at the end of the century to forbid deaf pupils to use sign language and to condemn intermarriage. Twentieth-century testimonies illustrate the continuing attempts made by deaf schools to prevent deaf girls and boys from coming into contact with each other. One deaf woman, who attended a Belgian deaf school from 1937 to 1947, describes how the girls in the institute were not allowed to meet deaf boys, or even talk about them as it was considered ‘a mortal sin’. Others express how girls and boys were strictly separated. They were not allowed to talk or they would be punished. In a similar account, ex-students attest that they were discouraged by their teachers from joining a deaf society to avoid coming exclusively into contact with other deaf persons.Footnote 21 On the other hand, deafness may have limited the marriage chances of deaf persons in an indirect way. According to Margaret Winzer, a lack of occupational stability and mobility among the disabled translated into straitened resources that made marriage unaffordable for them.Footnote 22 Previous research by De Veirman has shown that many deaf persons were employed in low-skilled jobs, especially in the eighteenth century, and that many of them were unemployed, to an increasing extent in the nineteenth century.Footnote 23 Individuals with uncertain resources may have been less attractive partners and therefore less successful on the marriage market. This was especially true for men, who were expected to assume the role of the main breadwinner within the family.
4. SOURCES AND DATA
Disability historians usually rely on documents from institutions for disabled persons, who generally had neither the means nor opportunity to document their own lives. Although of great value, these sources have three major drawbacks. First, they are written from the ‘top-down’, outsiders' perspective of professionals and philanthropists. Second, they rarely contain personal details. And third, they only pertain to the institution's residents, and are thus not representative of the disabled population in general. The latter two issues are of particular concern here because quantitative analysis not only depends upon sufficient data, but it requires the delineation of subject pools that are both consistent and comparable. Nor are the most commonly employed sources in population studies – birth, marriage and death records – entirely up to the task; while often available as early as the sixteenth century, they do not include information on impairments. Fortunately, the province of East Flanders possesses four unique sources that not only identify deaf people from 1748 onward, but also contain sufficient information to allow for cross-referencing with vital records such as parish and civil registers:Footnote 24
(1) Conscription as a means of systematic military recruitment was introduced in East Flanders in 1796. Sufficient conscrits to meet the army's quota were drawn from an annual lottery of all men twenty years of age. A medical examination was performed on all entrants, and men suffering from a range of acknowledged conditions, including deafness, were permanently exempted from military service and the grounds for their dispensation registered.
(2) From the 1830s onward, Belgium's central government conducted regular censuses to assess the size of both the deaf and blind populations. In East Flanders, the census of 1858 was supplemented by richly detailed reports pertaining to 50 deaf individuals living there at the time.
(3) In 1820, the first Belgian school for deaf girls, the ‘Institut des sourdes-muettes’, was established in Ghent by Father Jozef Triest. From the very start, its administration kept a detailed matriculation list of the pupils, who hailed from all levels of society.
(4) In 1821, a roll entitled ‘The state of all deaf-mutes living in East Flanders’ was drawn up, probably at the request of the provincial government. However, neither the initiator nor its motives are recorded. It names around 200 deaf persons, and includes information about their age, residence and ‘state of being’ – whether he or she was an orphan, attended a deaf school, had other family members with an impairment, was indigent, etc.
All congenitally deaf men and women, for whom date and place of birth were known, who were born within the province of East Flanders, before 1810 or between 1830 and 1860 were selected. Their life courses were then reconstructed from birth until death using civil records (birth, marriage and death certificates) and population registers. The present study is based on a group of 294 deaf men and women, born between 1748 and 1860, who lived at least until the age of 16 years.Footnote 25
To ascertain the extent to which deaf men and women could equally participate in the eighteenth- and nineteenth-century marriage market compared to non-deaf men and women, each East-Flemish deaf person was paired with a sibling of the same sex and the closest in age in order to form a balanced and representative control group of individuals raised under similar circumstances.Footnote 26 In cases where only one child was born or had survived, the sibling of another deaf subject of similar age, living in the same or a similar municipality, was selected. Based on the above selection process, a control group of 278 non-disabled men and women, who lived at least until the age of 16, was compiled. The life course reconstruction of the control group was performed in a similar way to the deaf research group.
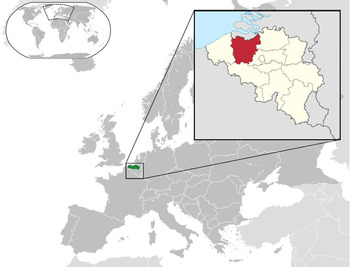
Map of East Flanders province in Belgium. Source: LOKSTAT, History department, Ghent University (2016).

The Demographic Data Base (Umeå University) consists of Swedish life course biographies, residence and migration histories covering the eighteenth and nineteenth centuries, by linking all digitised records for each individual from parish registers. Important for historical disability research is the digitisation of catechetical examination records. First stated in the Church law of 1686, parish ministers were supposed to annually verify the parishioners' knowledge of the catechism and their reading ability. Simultaneously the minister reported features such as impairments (lytesmarkeringar) indicating that a person was disabled. Based on the digitisation of these annotations and a demarcation of time and place, 46 individuals labelled ‘deaf’ or ‘deaf-mute’ were found within the Sundsvall region.Footnote 27 These 46 individuals were all born between 1800 and 1859.
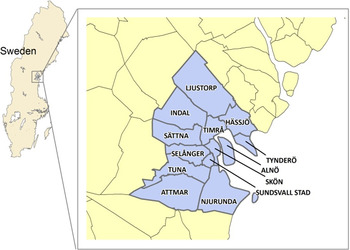
Map of the Sundsvall region in Sweden. Source: Demographic Data Base (DDB), Umeå University (2016).

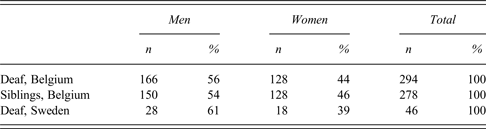
The comparison between East Flanders and the Sundsvall region is somewhat hindered by a difference in definition and categorisation of hearing impaired individuals. Whereas the East-Flemish dataset consists only of deaf-mute individuals, thus people deaf from or shortly after birth, exposing them to a potential disability impact from early in life, the Swedish dataset is less selective. Swedish ministers could attach the label ‘deaf’ to both deaf-mute and deaf parishioners, implying that deafness may have occurred later in life and was therefore less of an impairment. To mitigate this problem somewhat, only individuals labelled ‘deaf’ before the average age of marriage are considered in the comparison.Footnote 28 Potential higher marriage rates among the Swedish deaf may be partially explained by this difference in definition. A second minor issue relates to the time interval during which the individuals are under observation in both datasets. The East-Flemish individuals under study are followed from birth until death (84 per cent) or when they leave the province (16 per cent).Footnote 29 The Swedish individuals are followed starting from an age ranging from 15 to 35 years until they married, died, migrated out of the region, or when they reached the age of 50 years – which is generally acknowledged as the end of marriageable age. Table 1 represents the number of East-Flemish deaf individuals, in comparison to their non-disabled siblings and the Swedish deaf. Men are overrepresented in all study groups, as historical sources favour the identification of male persons.
Research individuals, by gender and research group
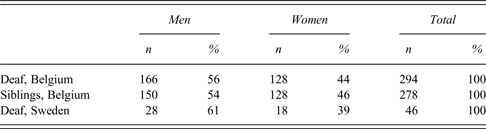
Source: Digitised parish registers Demographic Data Base (DDB), Umeå University and digitised parish and civil records (De Veirman).
5. MARRIAGE CHARACTERISTICS OF THE DEAF
5.1 Marriage opportunities in numbers: frequencies and means
Difficulties in the marriage market can manifest themselves in a lower number of deaf individuals who married (frequency), a higher average age at marriage and a higher number of deaf individuals who married an ‘unequal’ partner with regard to age, socio-economic status and geographical origin. These three aspects of marriage are the focal point in this section.Footnote 30
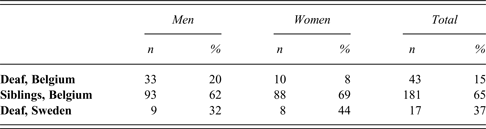
The frequency of marriage per gender within the three study groups is shown in Table 2. Entering marriage was not the obvious path for deaf persons, as only 15 per cent of the East-Flemish deaf men and women married. This average conceals a large gender difference: while about one in five deaf men married, only about one in ten of the women did so. This suggests that whereas female spouses could more easily overcome the deafness of their husbands, male spouses were less willing to settle down with a deaf woman. Deaf women, more than deaf men, were thus associated with the inability to be a partner and parent. The marriage rates of the siblings, on the other hand, fluctuate between 62 and 69 per cent and in this group women were more often married. Marriage rates in the Sundsvall region were markedly higher than in the province of East Flanders, with almost 40 per cent of the Swedish deaf marrying. This finding suggests that the marriage conditions for deaf people were more favourable in Sweden, especially for deaf women.Footnote 31
Frequency of marriage while under observation, by gender and research group
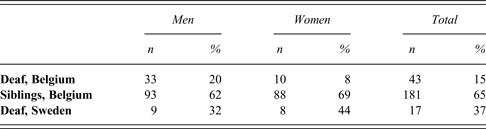
Source: Digitised parish registers DDB, Umeå University and digitised parish and civil records (De Veirman).
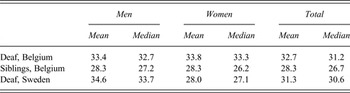
The difficulties deaf individuals encountered in entering marital life are also manifested in a higher age at marriage. Table 3 shows the mean and median age at first marriage, for men and women in the two study areas.
Age at first marriage, by gender and research group

Source: Digitised parish registers DDB, Umeå University and digitised parish and civil records (De Veirman).
On average, the deaf born in East Flanders were 32.7 years old at first marriage, well above the average sibling age of 28.3 years. Thus not only did deaf people have more difficulties in entering marriage compared to non-deaf persons, they were also much older when they eventually did. In line with their lower marriage rates, deaf women married at the oldest age, although the difference with the deaf men was only a matter of months. The comparison with the Swedish deaf shows that deaf men in both regions married at a comparable, older age – well above the respective regional averages. However, Swedish women, in line with their better marriage prospects, married at an average age of 28 years, comparable to non-deaf women.
5.2 Characteristics of the spouses
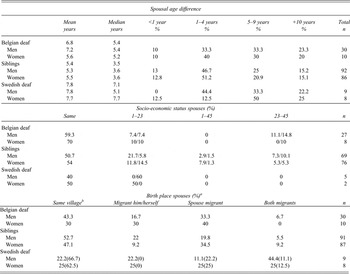
Marriages in the eighteenth and nineteenth centuries were characterised by a high degree of homogeneity or endogamy, implying that men and women were mainly engaged in ‘equal’ marriages. Marriages are considered equal when they involve age peers with a similar socio-professional and geographical background. Social endogamy entails that the research individuals looked for a spouse within their own social class, based on the status of both parental households. As the social class of many of the spouses could not be retrieved from the marriage certificates, comparing social class is impossible in this research. However, based on the occupations at marriage of the spouses themselves, we examine the extent of socio-professional endogamy. We assume that individuals on the marriage market attempt to marry a spouse with attractive socio-economic resources. Therefore, highly-skilled marriage candidates selected among themselves, while the least attractive candidates had to rely on one another. When a person married a spouse with a higher socio-economic status (SES), they were engaged in upward mobility. The concept of downward mobility implies that a person married a person with a lower SES. By means of the SOCPO (hierarchy of social power) classification scheme, we have assigned each research person and spouse a SES based on their occupation at marriage. Men and women could be classified into three categories of SES: unskilled (code 1); semi-skilled (code 23); and middle-class (code 45).Footnote 32 In the analysis, we make a distinction between individuals marrying within the same SES (thus 1–1, 23–23 and 45–45), and those marrying outside their SES (thus 1–23, 1–45 and 23–45). For the individuals marrying outside their SES, we distinguish between those marrying up (percentage on the left in the second panel of Table 4) and those marrying down (percentage on the right). Geographical endogamy implies that individuals married a spouse from the same area. According to Christiaan Vandenbroeke, in the nineteenth century two in three couples consisted of persons born in the same municipality.Footnote 33 Geographical endogamy was the result of limited mobility and arose from a wish to engage in a social endogamous marriage: if one married a partner whose family was well-known, there would be fewer surprises with regard to the family-in-law's status and reputation.Footnote 34 Instead of focusing on the distance between the birthplaces of the two spouses, we compare the birthplaces to the place of marriage. In this way, the analysis can also provide insight into how likely it was for individuals to marry after migration or how keen people were to marry a non-native spouse.Footnote 35 We classified the couples according to four types of marriage, those in which: (1) both spouses were native to the place of marriage (Same village); (2) the research individual had migrated to the place of marriage (migrant him/herself); (3) the spouse was a migrant to the place of marriage (spouse migrant); and (4) both spouses were migrants (both migrants). Finally, age endogamy means that spouses were about the same age. Age endogamy has been considered an indication of the equality of a relationship. A large age difference is assumed to point to an economic contract and denotes a patriarchal system, while a small difference is seen to reflect a more romantic relationship as age peers have more in common, for example, values and life experiences.Footnote 36 In the analysis, we calculated the mean and median age differences between spouses and divided the population into categories with an age difference smaller than 1 year, between 2 and 4 years, between 5 and 9 years, and 10 years and over.
Marriage homogamy by age, socio-economic status and geographic origin

a The places of residence before marriage are also considered in the Swedish cohort (in brackets).
b The term ‘village’ refers to a municipality in Belgium and to a parish (consisting of multiple municipalities) in Sweden.
Source: Digitised parish registers DDB, Umeå University and digitised parish and civil records (De Veirman).
In light of the marriage difficulties of the deaf, we assume a weaker position, resulting in a larger age gap, greater probability of marrying someone from a lower socio-economic group and of having to search for a suitable spouse within a larger geographical radius. Table 4 shows the homogeneity of the spouses regarding their age, socio-economic status and geographical origin. As age at marriage, occupation and birthplace are not known for all research individuals and/or spouses, the population size can deviate from the total number of 43 Belgian and 17 Swedish deaf marriages and 181 hearing marriages (see Table 2). Population sizes are particularly low in the analysis of socio-professional endogamy, mainly due to the high proportion of female spouses without a registered occupation. If the occupation of one or both of the spouses was unknown, the couple was not taken into consideration in the analysis.Footnote 37
Starting by looking at the age gap, we find an average age difference of respectively 7.2 and 5.6 years between the Belgian deaf men and deaf women and their spouses (first panel of Table 4). In the sibling cohort, the age difference with the spouses was respectively 5.3 and 5.5 years. These averages show that the age difference between deaf men and their spouses was generally higher than that for hearing men. The difference was smaller between the deaf and hearing women, but the median still reveals a difference of about 1.6 years between them. The larger age difference between the deaf and their spouses is also apparent in the four categories of age difference. About 56 per cent of the deaf men and 50 per cent of the deaf women married a spouse who was more than five years older or younger. In the sibling population, fewer individuals married such a spouse – respectively about 40 and 36 per cent of the brothers and sisters. Smaller age differences are interpreted as the outcome of a more romantic partner choice between spouses who share the same life experiences.Footnote 38 Starting from this observation, the larger age gap in the deaf marriages suggests that the deaf and their spouses were less equal and that partner choice was perhaps less the result of romantic love. A comparison with the Swedish deaf men and women points to an even larger age gap for the Swedish women, as they differed on average 7.7 years from their husbands. Between the Swedish and Belgian deaf men, differences are limited. Both groups married a woman with an age difference of on average about seven years (with a median difference of five years).
The second panel of Table 4 examines socio-professional endogamy based on the socio-economic status of the brides and grooms. The majority of the deaf and hearing population married a spouse with the same socio-economic status.Footnote 39 Respectively, 59 and 70 per cent of the deaf men and women married an equal spouse, compared to 51 and 54 per cent of the non-deaf brothers and sisters. In the marriages with a different socio-economic status, we find no evidence of a distinct downward marriage pattern among the deaf. About 22 per cent of the deaf men and 20 per cent of the deaf women in the Belgian group married a spouse with a lower SES (summing across the percentages on the right-hand side of columns 3–5). This is comparable to the percentages for the sibling population, of whom 17 per cent of the brothers and 21 per cent of the sisters married down. In other words, deaf individuals were not under substantially more pressure to lower their standards and marry a person with lower socio-economic status than their hearing siblings. However, it does seem that deaf men and women were less successful in marrying a spouse with a higher SES. Only about 18 per cent of the deaf men and 10 per cent of the deaf women married up. In contrast, in the sibling cohorts about 32 per cent of the men and 25 per cent of the women married a more highly qualified spouse. In the Swedish research group, two of five deaf men married within their socio-economic group and three married downwards to an unskilled woman. One deaf woman had a ‘socially equal’ husband, the other married upwards to a semi-skilled worker. The number of individuals with the required information is too small to make a reliable comparison with the Belgian case.
The third panel of Table 4 compares the birthplace of both spouses to the place of marriage. The majority of the deaf men and siblings (43, 53 and 47 per cent) married a spouse in the town where they were both born. This was not the case for deaf women. Only about one-third of the deaf women were engaged in a native (or same village) marriage, with a husband who may have been around since childhood. When comparing the ‘migrant marriages’, we find that more deaf persons married a spouse who had migrated to their birthplace: respectively about 33 and 40 per cent of the deaf men and women married a migrant spouse. When the spouse migrated to the hometown of the deaf person is unknown. A spouse may have migrated years, weeks or days before the marriage to the place of marriage. In this regard, it should be mentioned that until the twentieth century it was common practice for a couple to marry in the bride's place of birth (in both East Flanders as the Sundsvall region). As a result, the high number of deaf women (and hearing women for that matter) marrying a migrant spouse might only be a reflection of this tradition. However, this does not explain the higher percentage of deaf men marrying a migrant spouse. For deaf men, the percentages may indicate that they were more eligible among women who, as migrants, experienced difficulties on the marriage market as they were less socially embedded within the community. Respectively 17 and 22 per cent of the deaf and hearing men married in a town other than their place of birth (they were themselves migrants). Again, the custom of marrying in the bride's hometown may explain these percentages. However, 30 per cent of the deaf women were themselves migrants compared to a mere 9 per cent in the female sibling cohort. Deaf women did apparently marry more often after migration. This observation may indicate that more deaf women needed to search for a spouse outside the borders of their hometown. On the other hand, the percentage can be a reflection of higher migration rates among deaf women, which in turn increased the opportunities for deaf women to meet and marry a husband from outside their hometown. The fact that many deaf women left their hometown to be educated in the city of Ghent seems herein of crucial importance. Indeed, a closer look at the deaf migrant spouses shows that all of them married in the city of Ghent with a husband born in Ghent.Footnote 40 In both the deaf and sibling populations it was uncommon for both spouses to be migrants. This is consistent with previous studies that have shown that migrants encountered more difficulties on the marriage market.Footnote 41 With the exception of a higher percentage of marriages in which both spouses were migrants, the Swedish deaf men and women show a similar pattern of geographical endogamy to the Belgian deaf. Swedish deaf men and women also tended to marry a spouse who lived in the same parish (67 and 63 per cent).
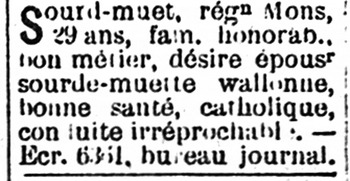
Finally, with regard to the profile of the spouses we explore the occurrence of so-called intermarriages. As mentioned above, by the end of the nineteenth century the intermarriage of deaf men and women was being debated at an international level, as part of a growing eugenics movement.Footnote 42 But how many deaf persons did in fact marry a deaf (or otherwise disabled) spouse? In a few East-Flemish marriage certificates the town clerk did mention the presence of a sign language interpreter to facilitate communication with one or both deaf spouses. Occasionally impairments were recorded in population registers.Footnote 43 However, in the majority of the life trajectories, sources that identified spouses as deaf or otherwise impaired – or most certainly non-disabled – were scarce. As a result, we could only determine the ‘disability status’ of both spouses in 18 of the 43 East-Flemish deaf marriages. Of those 18 marriages, 7 marriages were contracted between 2 deaf persons. Three of the married Swedish deaf individuals married a spouse who was also deaf. The seven East-Flemish intermarriages took place between 1875 and 1913, a period in which the Deaf community was in full development. All marriages took place in the city of Ghent, a city that provided both deaf schools and clubs. Three research individuals were born in Ghent and the other four came to Ghent to attend a deaf school and stayed on in the city. Similarly, four of the spouses were born in Ghent, while the four others were born outside Ghent. However, all spouses were residing in Ghent at the time of marriage. All the spouses were able to sign their marriage certificate, suggesting they too had enjoyed an education in the city. This assumption is backed up by the occupations of the spouses: shoemakers, tailors and seamstresses – occupations typical for the vocational training provided by the deaf schools. For the majority of the deaf spouses it is unknown whether they married a person who was deaf as well. Nonetheless, in the absence of deaf schools and considering the low number of deaf individuals in East Flanders (1 in 2391 inhabitants in 1835)Footnote 44 it seems unlikely that deaf individuals, especially those born in the late eighteenth and early nineteenth centuries could meet and marry other deaf individuals in the local area. Thus most married deaf individuals presumably married a hearing person.Footnote 45 In the course of the second half of the nineteenth century, opportunities for deaf men and women to meet increased. That it remained difficult for deaf individuals to find a deaf spouse, however, is suggested by a ‘wanted’ advertisement published in the newspaper La Libre Belgique in 1922. In the advertisement a 29-year-old deaf man from an ‘honourable family’ and with a ‘good occupation’ expresses his wish to find a nice deaf-mute bride ‘in good health, Catholic, and with impeccable behaviour’ (Figure 3).
‘Wanted’ advertisement in La Libre Belgique, 8 September 1922. Source: Brussels, Royal Library Belgium, newspaper collection.

5.3 Measuring the impact of a hearing impairment
Were the low marriage rates of deaf individuals solely the result of their disability, or did other factors also act as a barrier to marriage? We assume that success on the marriage market may have been influenced not only by the presence of a disability, but also by the interaction of disability with characteristics such as gender, living environment, birth date, socio-economic status and birth order. To investigate the magnitude and significance of these different factors with regard to the probability of marriage, an analytical or explanatory model is required. We have chosen to apply event history analysis methods, specifically Cox regression models. Event history analysis has increasingly become the preferred method for longitudinal analysis of demographic events due to its attractive statistical properties.Footnote 46 Cox regression models control for explanatory variables, besides the presence of a disability, which potentially influenced marriage opportunities within the given historical context. Estimations of marriage chances are shown as hazard ratios that indicate the probability of experiencing a marriage during the observation time. The hazard ratio of the reference group or category is one (1.00). If the risk ratio of a given category is lower than 1.00, this indicates a lower risk of marrying compared to the reference group. The p-value indicates the statistical significance of the hazard ratios. Statistical significance is the probability that the effect of a covariate is not the result of chance. We flag three significance levels: 10 per cent (<0.100), 5 per cent (<0.050) and 1 per cent (<0.010) level.Footnote 47
All East-Flemish individuals enter our study at birth; the Swedish individuals are followed starting from the moment they enter observation in the parish registers, at an age ranging from 15 to 35 years. We right-censored the individuals at the age of 50 years – which is generally acknowledged as the end of marriageable age – or when they left observation before that age as a result of death or out-migration. The differences in the ages at which the individuals enter the study (left truncation) and in the lengths of observation render time to event an inappropriate time scale. For this reason, we use age as the time scale in the Cox regression models. In the multivariate analysis, we take into account the following covariates:
– Gender: The most obvious variable to take into account is gender. Our previous analyses revealed important differences in the marriage prospects of deaf men and women. In the Cox regression models, men are considered the reference group. We have also chosen to design separate models for women and men. As we believe there were differences in marriage prospects for men and women which were unrelated to the presence of a disability, we consider it a more fruitful approach to compare deaf women with hearing women and deaf men with hearing men, instead of making comparisons across both genders.
– Place of residence: With regard to living environment, we distinguish between urban (reference) and rural municipalities.Footnote 48 We assume that the size of the community may have influenced the sense of isolation (lower in a close-knit country village) and the opportunities to both meet other deaf people and develop literacy skills, enabling more profound communication (more numerous in an urban setting).Footnote 49 Within the Flemish dataset, municipalities were considered urban when the population exceeded 5,000 individuals (11 cities). In the Swedish dataset, the town of Sundsvall is considered the only urban setting.
– Birth cohort: Thus far we have not taken into account potential changes in marriage characteristics through time. Yet, many scholars have portrayed the nineteenth century as the period in which the attitudes towards and the living conditions of people with disabilities underwent important changes. Under the influence of industrialisation and medicalisation processes, the social position of people with a disability is assumed to have deteriorated, causing more disabled people to live a segregated existence.Footnote 50 This social segregation may have found expression in the increasing difficulties of deaf men and women in making contact with potential spouses. To account for this possible deterioration, the research population is divided into a pre-industrial (reference) and an industrialising cohort. Taking into account different onset times of industrialisation, the pre-industrial cohort for East Flanders consists of individuals born between 1748 and 1810. The Swedish counterpart consists of individuals born between 1800 and 1829. Individuals born between 1830 and 1860 in both countries are considered to have lived in an industrialising context.Footnote 51
– Socio-economic status: the fourth group of variables examines the effect of socio-economic status, based on the highest rated occupation of the father.Footnote 52 Based on a modification of the SOCPO scheme, a distinction is made between research individuals born in a family with a father belonging to the group of: (1) unskilled workers (reference); (2) semi-skilled and skilled workers; and (3) middle-class and elite workers.Footnote 53 Getting married implied that one had the necessary resources to set up an independent household. These resources varied according to occupational group. In line with previous studies, we assume lower marriage opportunities for sons and daughters of farmers and the elite (third category) due to more restrictive inheritance regulations.Footnote 54
– Parity: the presence of siblings determines a person's birth rank, which has been proven to influence an individual's marriage chances.Footnote 55 In this study three categories of birth rank are created: (1) firstborn child; (2) second and third born children; and (3) fourth and higher birth rank. Marriage chances are assumed to be most favourable for firstborn children.
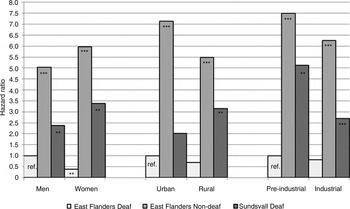
Figure 4 displays hazard ratios of the probability of marrying for the three research groups (East-Flemish deaf and siblings, and deaf persons living in the Sundsvall region) based on three Cox regression models in which we control separately for gender, place of residence and birth cohort. The higher the bars, the higher the chance of getting married during the time of observation. The significance of the hazard ratios is indicated by asterisks (see notes below Figure 4).
Propensity to marry, by gender, place of residence and birth cohort. Notes: * p: < 0.1; ** p: < 0.05; *** p: < 0.001. Source: Digitised parish registers DDB, Umeå University and digitised parish and civil records (De Veirman).

Across all covariates deaf men and women born in East Flanders (light grey bars) had the lowest propensity to marry. Distinguishing between men and women, we find that East-Flemish deaf women married 62 per cent less than deaf men did. The difference in success on the marriage market was particularly striking between deaf women and their hearing sisters as the latter were almost 16 times more likely to marry. In comparison, the hearing brothers were ‘only’ five times more likely to marry than the deaf men. Deaf men and women living in the Sundsvall region were respectively 2.4 and 9 times more likely to enter marriage than East-Flemish deaf men and women. The higher chances for marriage for Swedish deaf women (compared to Swedish deaf men) can possibly be explained by the male surplus in the Sundsvall region at the time, due to higher numbers of male immigrants. Faced with a shortage of potential brides, men may have been more willing to marry deaf women. Comparing the hazard ratios in urban and rural places of residence, we find that in East Flanders marriage propensity was the highest in urban regions. Deaf persons living in the countryside married 30 per cent less than those living in the cities (although this finding is not statistically significant). A possible explanation for the higher marriage propensity among the urban deaf is that a larger number of deaf individuals lived in the city.Footnote 56 Several factors may account for a higher representation of disabled persons in cities. On the one hand, it may have been the result of a wider range of special schools and non-educational institutions in urban areas. Indeed, deaf schools and clubs were principally located in cities. These institutions probably attracted many deaf people to the city and may have acted as important meeting places for future spouses. On the other hand, the higher urban representation may also be related to a higher likelihood of injury in an urban working environment. Although deaf-muteness can hardly be considered a work accident, a higher representation of people with different types of disabilities in the cities may have led to a higher acceptance of deaf people as well, and accordingly better chances on the marriage market. We find little evidence of this urban advantage in the Swedish research group. In the Sundsvall region, marriage chances were the highest in the countryside (1.5 times higher compared to urban deaf). Finally, in all of the studied groups, marriage chances deteriorated in the industrial period. In comparison to their industrial counterparts, the East-Flemish deaf people and siblings were each 1.2 times more likely to marry in the pre-industrial period (although again this finding is not statistically significant). The assumption that marriage opportunities deteriorated for people with disabilities in particular is not confirmed as the hearing siblings experienced a similar weakening on the industrial marriage market. In the industrial period, the difference in marriage propensity between the East-Flemish and Sundsvall deaf declined from a five times higher chance in the Sundsvall region to a ‘mere’ three times higher chance. This decreasing difference arises from an even stronger deterioration in marriage propensity for the Swedish deaf (two times less likely in the industrial period).
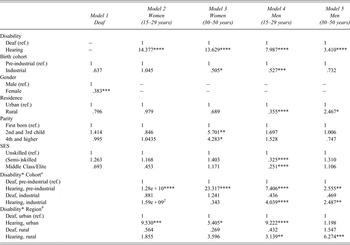
To control for the impact of gender, place of residence and birth cohort at the same time, we now turn to Cox regression models. In these models, socio-economic status and parity are also included as covariates. We have designed five models according to disability and gender (Table 5). The Swedish deaf population is not included in these Cox models due to the small sample size. When modeling a Cox regression (or proportional hazards regression) a key assumption is proportional hazards, that is, the relative effects of the risk factors for different strata (for example, men and women) are constant over the follow up time period. The proportionality assumption for each individual covariate was tested by means of scaled Schoenfeld residuals tests. The testing revealed that the proportionality assumption was invalid for the covariates ‘research group’ (deaf-hearing) and ‘region’ in the East-Flemish male sample. We resolved the proportionality problem by estimating separate models for Belgian men younger and older than 30 years (age at which the hazard lines converged). The repetition of the tests indicated that ‘region’ was no longer non-proportional in these models. In the female sample we found no evidence of non-proportionality. Nevertheless, similar to the male models, we estimated two models for East-Flemish women: one for women younger and one for women older than 30 years. This age split is also substantively appropriate in terms of the average age at first marriage.
Cox regression on the propensity to marry: one model (1) showing Belgian deaf individuals, four models showing Belgian women (2 and 3) and men (4 and 5) respectively

Notes: * p: < 0.1; ** p: < 0.05; *** p: < 0.01; **** p: < 0.001.
a Interaction variables are entered one-by-one within the corresponding model. Only the hazard ratios of the interactions are mentioned.
b The extremely large hazard ratios can be explained by the very small number of deaf women marrying before the age of 30 years (none in the pre-industrial cohort, five in the industrial cohort).
Source: Digitised parish registers DDB, Umeå University and digitised parish and civil records (De Veirman).
The hazard ratios in model 1 confirm our findings above that in the East-Flemish deaf population marriage difficulties were greatest for women, people born in the mid-nineteenth century and those born in a rural area. Parity did not significantly influence the marriage chances of the deaf, but suggests that the propensity to marry was higher for second and third born children. This observation contradicts our expectation that firstborn children had better chances of marriage. Perhaps the presence of older siblings was beneficial to the marriage opportunities of a deaf person as older siblings could introduce them to friends and in-laws. Such an expansion of the social networks of deaf persons may have increased their opportunities of finding a suitable spouse. In line with our assumptions, marriage prospects were worse for deaf people born in a middle-class family (although this finding is not statistically significant). Comparing young East-Flemish deaf women to their non-disabled sisters (model 2), we find that hearing women were 14 times more likely to marry before their thirtieth birthday than their deaf sisters. After the age of 30 (model 3), the difference between deaf and hearing women only slightly decreased. Model 3 also reveals a significant effect of parity and birth cohort: being the second or younger child had a significant positive effect on a woman's marriage propensity. Women born in the second half of the nineteenth century, on the other hand, experienced substantially more difficulty in entering marriage compared to those born in the period before. However, when we interact birth cohort with disability, we find that the negative effect of industrialisation only applied to non-disabled women. In contrast, in the course of the nineteenth century, marriage chances improved for deaf women older than 30 years (although not significantly). The selection of women in the admission list of the deaf school (all born in the industrialising cohort) might explain this anomaly. Because of this source selection, the dataset contains a larger group of educated women in the second time period, thus a larger number of women with better developed communication and social skills, which probably enhanced their marriage chances. Both hearing sisters born in a rural and urban municipality had higher chances of marrying than did the deaf women born in the city. The lower hazard ratio for deaf women born in the countryside indicates a negative impact of growing up in a rural setting on the marriage chances of the deaf women. More research is needed, however, as the results are not significant.
In models 4 and 5, comparing the East-Flemish deaf and hearing men, the presence of a disability emerges again as a significant characteristic. Though less considerable than in the female population, the hearing brothers still had an 8 times higher propensity to marry before the age of 30 (model 4) and almost 3.5 times higher after the age of 30 (model 5). The smaller difference between the deaf men and their brothers in model 5 is related to the average ages at marriage of both groups. More deaf men married after their thirtieth birthday, while only a minority of hearing brothers had yet to enter a first marriage after that age. The respective increase and decrease in the marriage frequencies of the two groups resulted in a smaller difference in the likelihood of marriage in model 5. Men younger than 30 were significantly impacted upon by their birthplace, in favour of cities, and socio-economic background. The higher a man's socio-economic background the lower his chance of marriage, suggesting that wealth and property hampered the search (or reduced the need) for a suitable spouse. Moreover, birth cohort had a significant effect on the probability of marriage. Men born in the industrial cohort had an approximately 47 per cent lower propensity (hazard ratio 0.527) to marry compared to the pre-industrial cohort. Indeed, the interaction model indicates that industrialisation had a negative impact upon both deaf and hearing young men (although only significant for the hearing brothers). After the age of 30, birth cohort and socio-economic status lost their importance. The impact of a person's socio-economic background probably diminished as he became older. For the men over 30, it may be more revealing to test the impact of their own socio-economic status (based on their highest ranked occupation instead of that of their father). Region continues to be important, but surprisingly, in the opposite direction. After the age of 30 years, the chances of a man getting married were greater when living in a rural setting.
6. CONCLUSIONS
Although getting married was the common path in life for most youngsters in eighteenth- and nineteenth-century Europe, for most deaf people it was not. The observation that an auditory disability limited a person's marriage opportunities in the past, as in the present, might come as no surprise. However, the present exploratory study provides a first indication of the extent and manner in which impairment interfered with a person's marriage chances.
Until recently, little was known about the marriage opportunities of disabled individuals in past societies. Historical sources allowing identification of the disabled are rare, and combining sources to gain insight into disabled individuals' life trajectories is indeed a time-consuming task. In this study, we used a set of unique sources to identify a large sample of deaf persons, born in different generations and regions, from all socio-economic groups and both genders. The life courses of these deaf men and women were subsequently reconstructed from birth (or immigration) until death (or outmigration) through linkage with historical demographic sources such as parish and civil registers and population registers. In the field of disability history, this type of life course approach is largely uncharted territory. Nonetheless, as this study aims to show, the methodology in combination with event history analysis offers interesting opportunities for historical disability research.
This study showed that, throughout the end of the eighteenth and into the nineteenth centuries, deaf individuals encountered more difficulties in finding a marriage partner compared to individuals without a disability. Whereas more than two-thirds of the hearing siblings entered marriage, fewer than one in five East-Flemish deaf persons followed this traditional path of life. The number of deaf persons marrying was low, and those who did marry did so at a considerably older age. Moreover, deaf men and women were more often married to a partner much different in age and fewer of them were able to marry a spouse from a higher socio-economic background. The higher percentages of deaf marriages involving migration illustrate both the greater necessity for deaf people to search for a spouse outside their hometown and their higher eligibility among migrants who were less socially embedded. Cox regression models confirmed that the presence of an auditory impairment significantly affected a person's chances of marrying. Yet, by introducing covariates such as gender, birth cohort and living environment, we obtained a more diversified image of disability experiences and demonstrated that certain personal and environmental characteristics could contribute or otherwise compromise the marriage opportunities for deaf people. In this regard, we showed that being deaf and a woman was particularly damaging to a person's chances of marrying in East Flanders. Likewise, the prospect of marriage grew more difficult for deaf men in the course of the nineteenth century, in contrast to deaf women who experienced an improvement. Generally, deaf persons living in the East-Flemish countryside, who were firstborn children from a middle-class father, had the worst marriage perspectives. The explorative comparison with a group of Swedish deaf persons indicated that the idea of a universal disability experience is too simplistic. Throughout the nineteenth century, Swedish deaf individuals, both men and women, appear to have been better placed in the marriage market, as their chances of finding a suitable spouse were significantly higher. However, the Swedish deaf suffered more from the consequences of nineteenth-century developments, and starting in the mid-nineteenth century marriage propensity took a downward plunge. In East Flanders, marriage rates were already very low well before industrialisation, making the impact of nineteenth-century modernisation perhaps less pervasive.
Although some characteristics seem to have been either more advantageous or detrimental to the marriage opportunities of a deaf person, the generally low marriage rates nevertheless indicate that it was difficult to overcome the restrictions that an impairment imposed on a person's marriage opportunities. On an individual level, deaf individuals were undoubtedly disadvantaged by their difficulties in communicating with the hearing. This barrier between the deaf and hearing may have encouraged deaf individuals to look for a spouse who was deaf as well. However, several structural factors complicated this search. The number of deaf individuals was low and they were spread over a large area. Before the establishment of deaf schools and the development of a deaf community with their own clubs, newspapers, etc., activities for deaf people were limited and opportunities to meet other deaf individuals were scarce. Although the situation improved in the course of the nineteenth century, the increased residential segregation that came with the increased institutionalisation of deaf people made marriage less of an option. On a group level, deaf people may have avoided or were forced to refrain from marriage because of the negative attitudes in their environment. In this regard, we have mentioned how the ideas of eugenics in the nineteenth century started debates about the hereditariness of deafness.
The present research has contributed to historical disability research by providing quantitative evidence of how having a disability affected individuals marriage chances. By further unravelling the lives and stories of the disabled, future disability research can give them their rightful, visible place in history.Footnote 57
ACKNOWLEDGEMENTS
This study and the findings on deaf people from nineteenth-century Sweden are conducted in collaboration with a project that has received funding from the European Research Council (ERC) under the European Union's Horizon 2020 research and innovation programme (grant agreement No. 647125), headed by Lotta Vikström, ERC Consolidator Grant, ‘DISLIFE Liveable disabilities: Life courses and opportunity structures across time’.