I. INTRODUCTION
Recently, a two-dimensional X-ray diffraction (XRD) technique, called the cosα method (Taira et al., Reference Taira, Tanaka and Yamasaki1978) has enjoyed widespread commercial application. Although the cosα method can calculate the stress of a specimen from an entire Debye–Scherrer ring (D–S ring), the accuracy is significantly degraded if the grain size is relatively coarse and a sufficient number of grains are not available in the X-ray irradiation area. In such cases, the D–S ring becomes grainy and the cosα method becomes inaccurate (Sasaki et al., Reference Sasaki, Hirose and Yasukawa1997) even if the specimen is under a plane stress condition. With the sin2 ψ method (for example see Noyan and Cohen, Reference Noyan and Cohen1987), a commonly used conventional XRD method, the oscillation of the X-ray incident angle has been used to measure the stress of a coarse-grained specimen. Maruyama proposed using the X-ray incident angle oscillation with the cosα method (Maruyama).
The authors, previously proposed a generalization of the cosα method based on Fourier analysis (Miyazaki and Sasaki, Reference Miyazaki and Sasaki2014), and demonstrated that it could determine the stress of a carbon steel specimen. The purpose of the present study is to demonstrate that the X-ray incident angle oscillation improves the stress measurement of this method when measuring a coarse-grained specimen. Additionally, a primitive compensation for the X-ray incident angle oscillation is proposed.
II. PRINCIPLE
A. Fourier analysis of the D–S ring
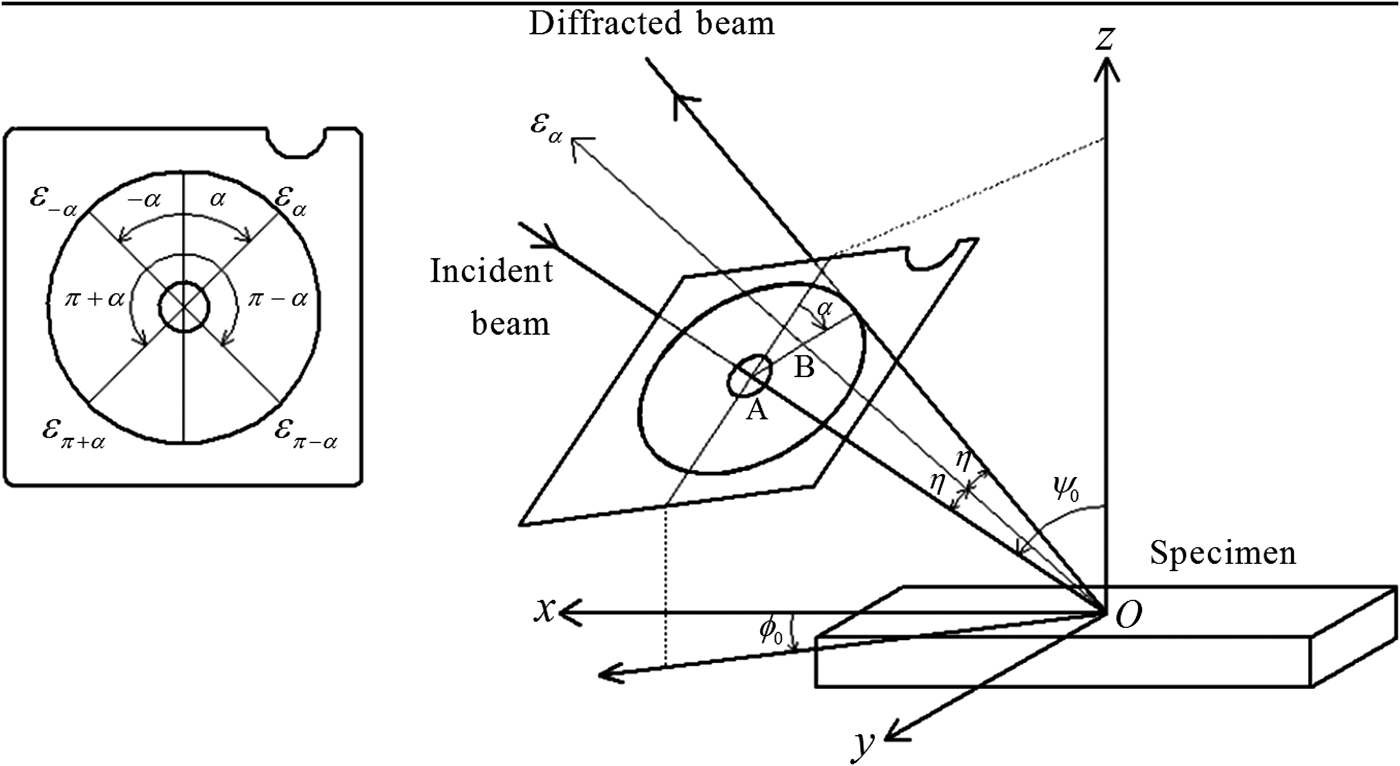
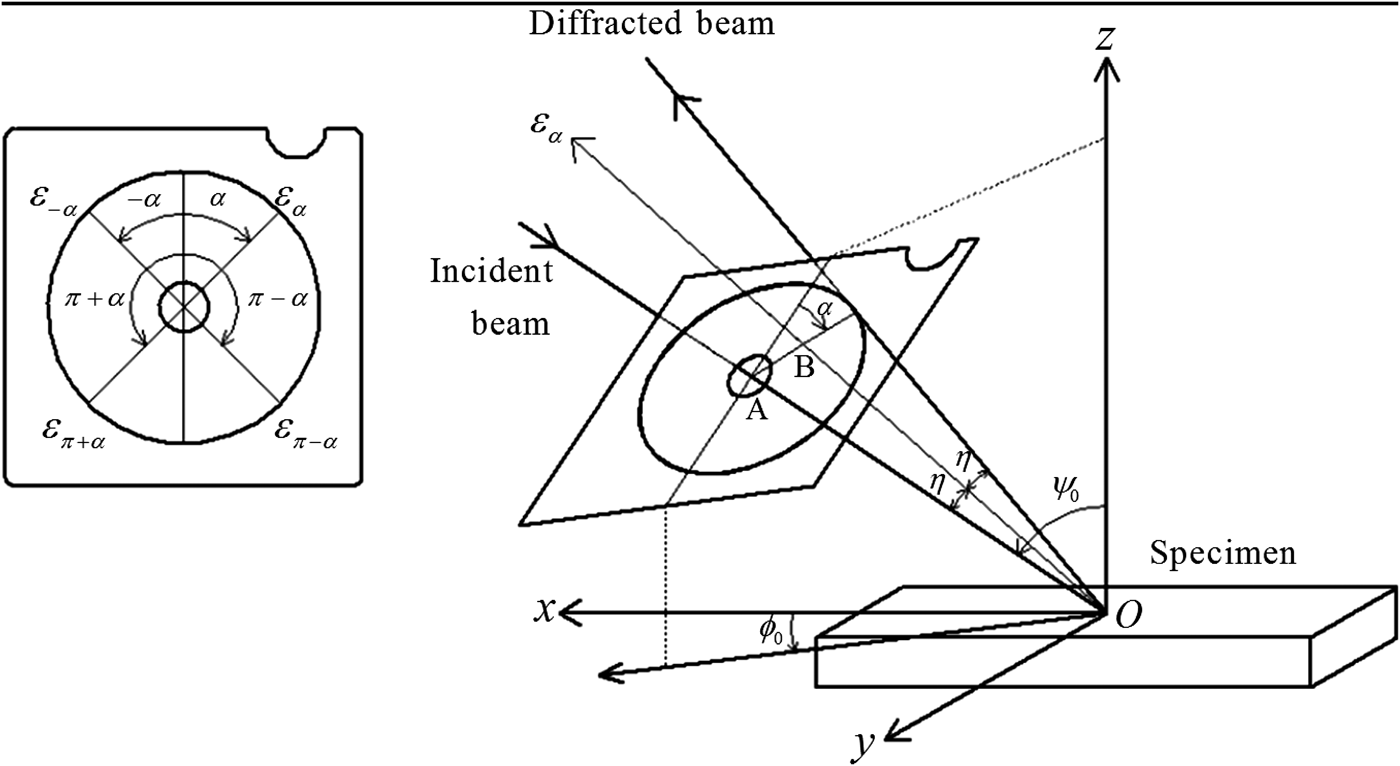
In this section, the stress measurement from a D–S ring is briefly summarized. The arrangement of the stress measurement as laid out by Miyazaki and Sasaki (Reference Miyazaki and Sasaki2014) is shown in Figure 1. If the specimen is under the plane stress, the normal strain along the direction of the circumference angle α of the D–S ring is
 $$\varepsilon (\alpha )\, = \,{a_0} + {a_1}\cos \alpha + {b_1}\sin \alpha + {a_2}\cos 2\alpha + {b_2}\sin 2\alpha $$
Arrangement of the stress measurement [from Miyazaki and Sasaki (Reference Miyazaki and Sasaki2014)].
The constant term a 0 does not affect the following discussion and is thus omitted. From here, we refer to Eq. (1) as the “plane stress approximation”. Each coefficient of Eq. (1) is related to the stress of the specimen using Young's modulus E and Poisson's ratio v as
 $$\eqalign{& {a_1} = - \displaystyle{{1 + \nu} \over {2E}}\sin 2\eta \sin 2{\psi _0} \cdot {\sigma _x} \cr & {b_1} = \displaystyle{{1 + \nu} \over E}\sin 2\eta \sin {\psi _0} \cdot {\tau _{xy}} \cr & {a_2} = \displaystyle{{1 + \nu} \over {2E}}{\sin ^2}\eta ({\cos ^2}{\psi _0}{\sigma _x} - {\sigma _y}) \cr & {b_2} = - \displaystyle{{1 + \nu} \over {2E}}{\sin ^2}\eta \cos {\psi _0} \cdot {\tau _{xy}}} $$
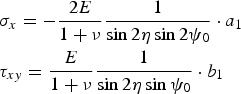
where η is the complement of the diffraction angle θ (η = π/2−θ), ψ 0 is the angle between the sample surface normal and the X-ray incident angle, and, σ x , σy, and τ xy are the longitudinal stress, the lateral stress, and the shear stress, respectively. Please note that ψ 0 differs from ψ which traditionally represents the inclination angle of the specimen surface normal with respect to the diffraction vector (For example, see Figure 1 in Welzel et al., Reference Welzel, Ligot, Lamparter, Vermeulen and Mittermeijer2005). To simplify, we call ψ 0 as “X-ray incident angle” or “incident angle” in the following discussion. The stress of the specimen can be calculated from Eq. (2).
For example,
 $$\eqalign{& {\sigma _x} = - \displaystyle{{2E} \over {1 + \nu}} \displaystyle{1 \over {\sin 2\eta \sin 2{\psi _0}}} \cdot {a_1} \cr & {\tau _{xy}} = \displaystyle{E \over {1 + \nu}} \displaystyle{1 \over {\sin 2\eta \sin {\psi _0}}} \cdot {b_1}} $$
The reader may think that our method is similar to the φ-integral method (Lode and Peiter, Reference Lode and Peiter1981). A good summary can be found in Welzel et al. (Reference Welzel, Ligot, Lamparter, Vermeulen and Mittermeijer2005). However, the authors consider that the two methods to be entirely different (Miyazaki and Sasaki, Reference Miyazaki and Sasaki2015).
B. Oscillation of the X-ray incident angle
Even if the specimen is under plane stress in the macroscopic scale (>~mm), the residual stress varies over the grain scale. Consequently, the D–S ring becomes rough and ε(α) becomes as
 $$\eqalign{\varepsilon (\alpha ) = & {a_0} + {a_1}\cos \alpha + {b_1}\sin \alpha + {a_2}\cos 2\alpha + {b_2}\sin 2\alpha \cr & + \delta \varepsilon (\alpha )}$$
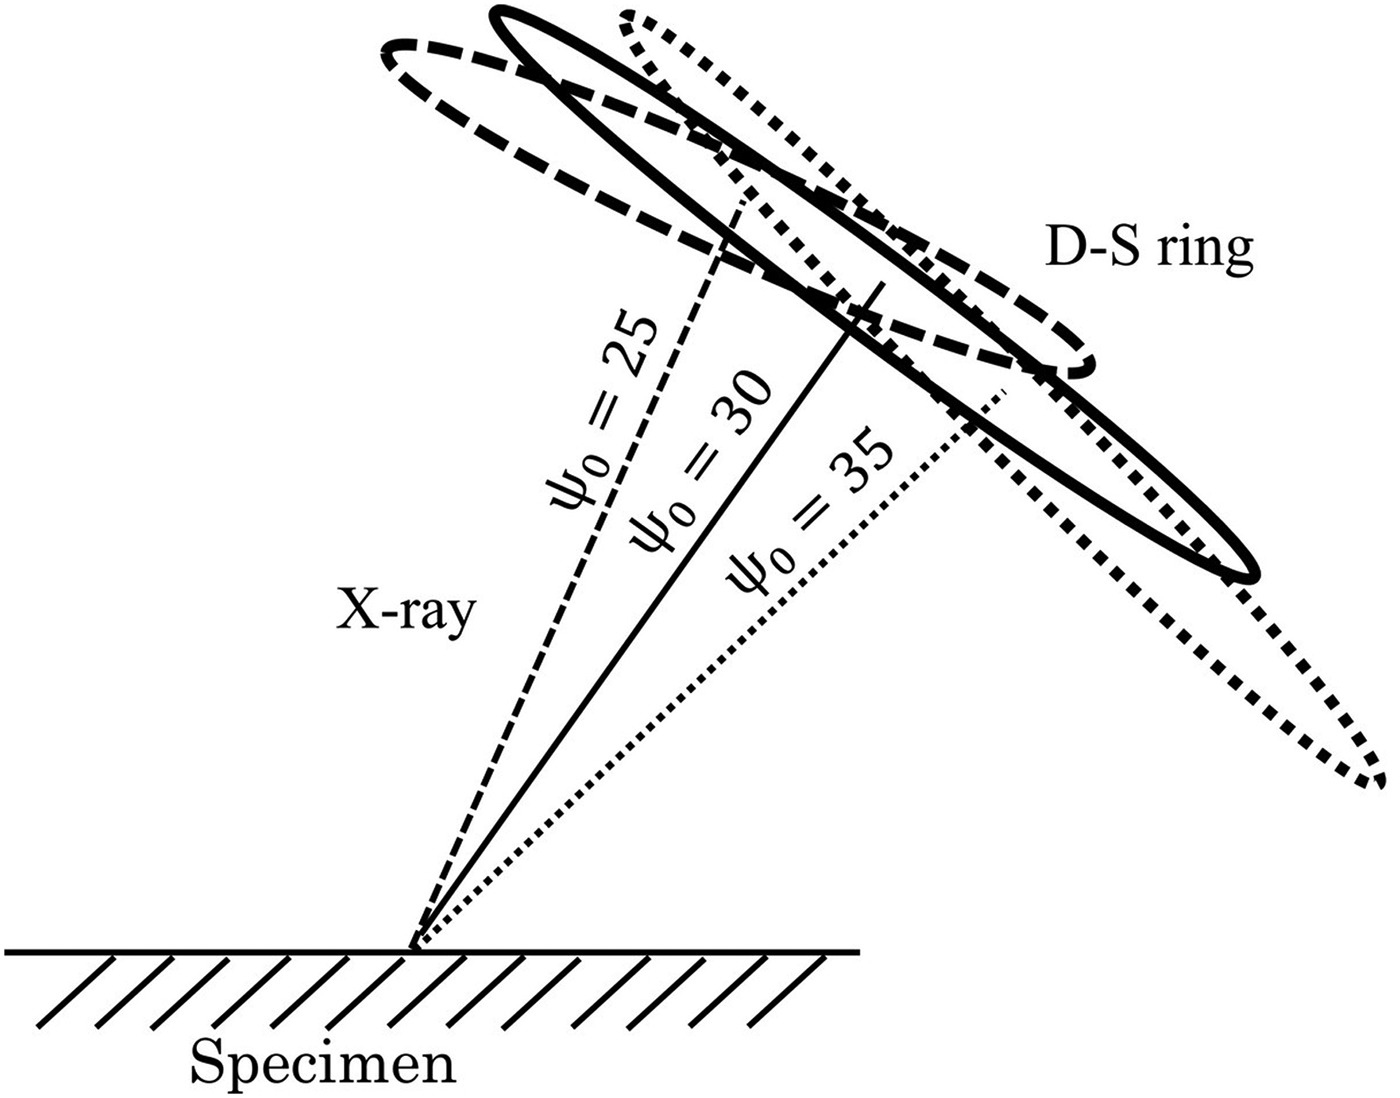
where δε(α) represents the effect of the residual stress over the grain scale and contains higher order components (cos3α, sin3α, cos4α, sin4α, and so on). For most applications, it is desirable to know the macroscopic plane stress values of the specimen and δε(α) can be regarded as the measurement noise. In order to reduce the influence of δε(α) on the cosα method, Maruyama proposed oscillating the X-ray incident angle ψ 0 (Maruyama) (Figure 2). In this study, we report on the effect of ψ 0 oscillation with the Fourier series analysis proposed by Miyazaki and Sasaki (Reference Miyazaki and Sasaki2014).
Schematic of the X-ray incident angle oscillation.
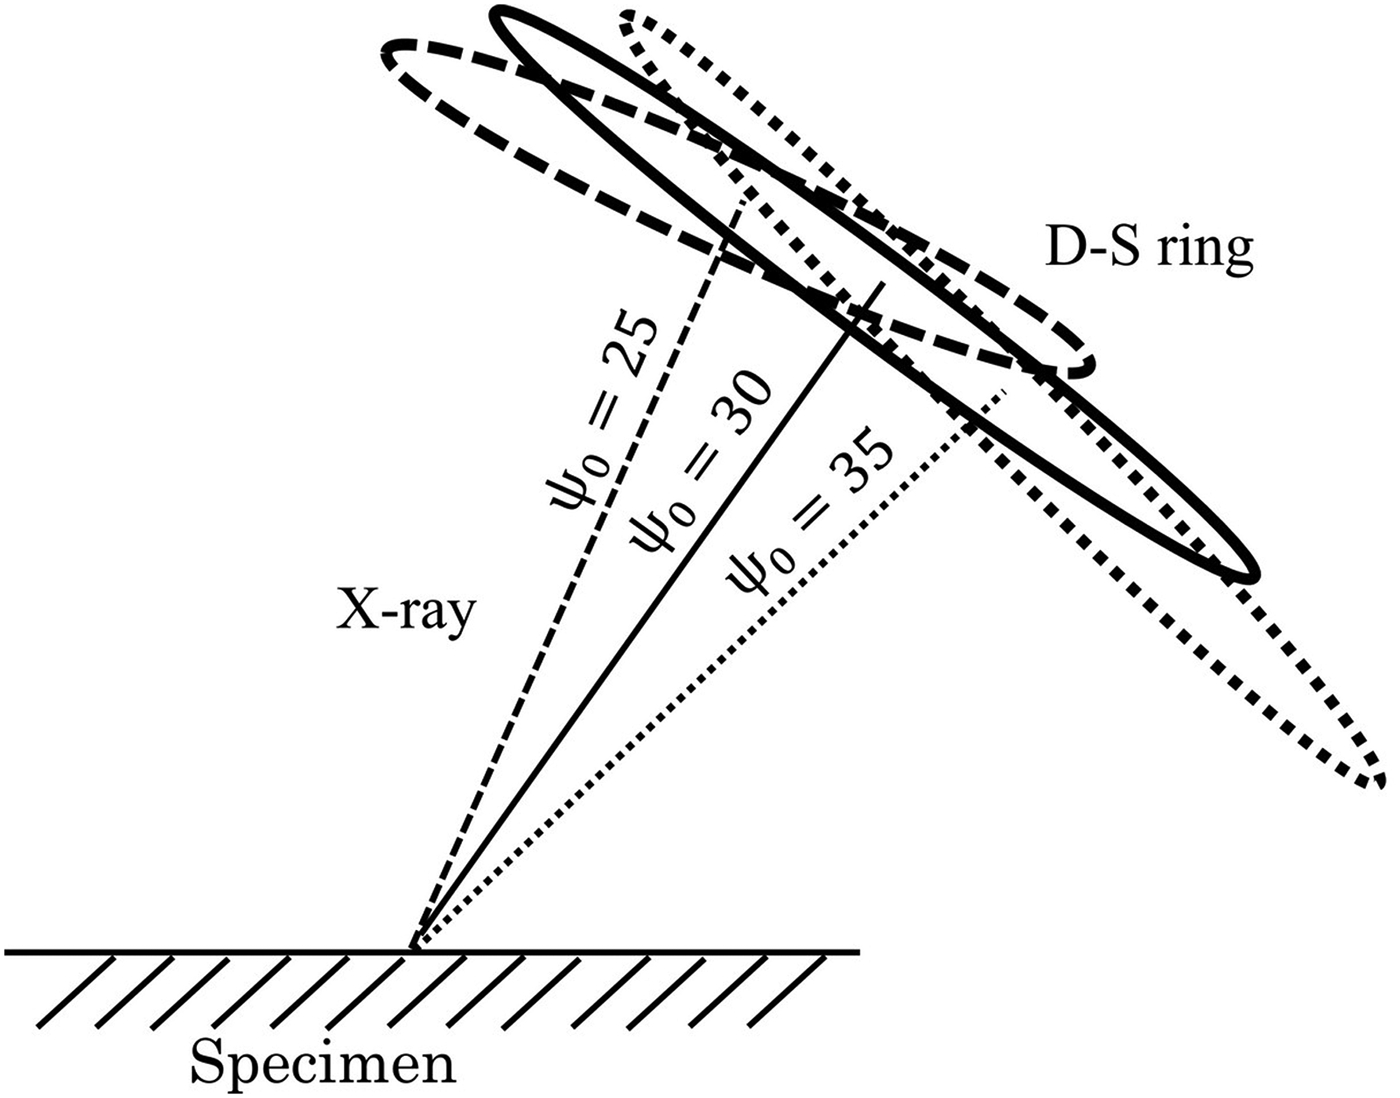
The Fourier coefficients of Eq. (2) depend on ψ 0, so it is necessary to compensate for the effect of the incident angle oscillation. In the following, we consider the compensation for the simplest case.
When the incident angle is ψ (this ψ is the angle between the sample surface normal and the X-ray incident angle), Eq. (2) can be modified as
 $$\eqalign{\varepsilon (\alpha, \psi ) = & {a_1}(\psi )\cos \alpha + {b_1}(\psi )\sin \alpha + {a_2}(\psi )\cos 2\alpha \cr & + {b_2}(\psi )\sin 2\alpha}$$
where a 1(ψ) to b 2(ψ) are the functions of ψ. From Eq. (2), a 1(ψ) to b 2(ψ) can be described as
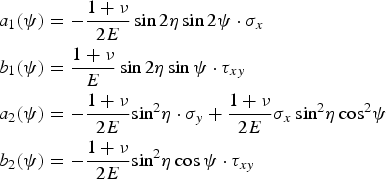 $$\eqalign{& {a_1}(\psi ) = - \displaystyle{{1 + \nu} \over {2E}}\sin 2\eta \sin 2\psi \cdot {\sigma _x} \cr & {b_1}(\psi ) = \displaystyle{{1 + \nu} \over E}\sin 2\eta \sin \psi \cdot {\tau _{xy}} \cr & {a_2}(\psi ) = - \displaystyle{{1 + \nu} \over {2E}}{\sin ^2}\eta \cdot {\sigma _y} + \displaystyle{{1 + \nu} \over {2E}}{\sigma _x}\, {\sin ^2}\eta\, {\cos ^2} \psi \cr & {b_2}(\psi ) = - \displaystyle{{1 + \nu} \over {2E}}{\sin ^2}\eta \cos \psi \cdot {\tau _{xy}}} $$
Next, we consider the effect of the ψ oscillation on ε(α). In order to simplify, we assume that when ψ moves from ψ 0 − δ to ψ 0 + δ, the D–S ring is observed as the simple average on ψ as
 $$\bar \varepsilon (\alpha ) = \displaystyle{1 \over {2\delta}} \int_{{\psi _0} - \delta} ^{{\psi _0} + \delta} {\varepsilon (\alpha, \psi )d} \psi $$
with this assumption, Eq. (5) becomes
 $$\bar \varepsilon (\alpha ) = {\bar a_1}\cos \alpha + {\bar b_1}\sin \alpha + {\bar a_2}\cos 2\alpha + {\bar b_2}\sin 2\alpha $$
where
 $$\bar x = \displaystyle{1 \over {2\delta}} \int_{{\psi _0} - \delta} ^{{\psi _0} + \delta} {x(\psi )d} \psi \quad (x = {a_1},\,{b_1},\,{a_2}\,{\rm and}\,{b_2})$$
Applying Eq. (9) to Eq. (6) and developing up to δ 2 terms, we obtain
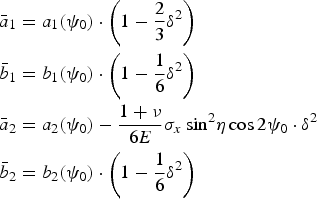 $$\eqalign{& {{\bar a}_1} = {a_1}({\psi _0}) \cdot \left( {1 - \displaystyle{2 \over 3}{\delta ^2}} \right) \cr & {{\bar b}_1} = {b_1}({\psi _0}) \cdot \left( {1 - \displaystyle{1 \over 6}{\delta ^2}} \right) \cr & {{\bar a}_2} = {a_2}({\psi _0}) - \displaystyle{{1 + \nu} \over {6E}}{\sigma _x}\, {\sin ^2}\eta \cos 2{\psi _0} \cdot {\delta ^2} \cr & {{\bar b}_2} = {b_2}({\psi _0}) \cdot \left( {1 - \displaystyle{1 \over 6}{\delta ^2}} \right)} $$
Consequently, when applying the incident angle oscillation, compensations according to Eq. (10) are required.
For example, Eq. (3) becomes
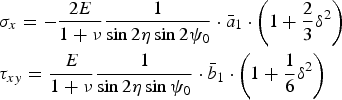 $$\eqalign{& {\sigma _x} = - \displaystyle{{2E} \over {1 + \nu}} \displaystyle{1 \over {\sin 2\eta \sin 2{\psi _0}}} \cdot {{\bar a}_1} \cdot \left( {1 + \displaystyle{2 \over 3}{\delta ^2}} \right) \cr & {\tau _{xy}} = \displaystyle{E \over {1 + \nu}} \displaystyle{1 \over {\sin 2\eta \sin {\psi _0}}} \cdot {{\bar b}_1} \cdot \left( {1 + \displaystyle{1 \over 6}{\delta ^2}} \right)} $$
when δ = 5°, the compensation of σ x is ~0.5% and when δ = 10°, the compensation of σ x and τ xy are ~2% and ~0.5%, respectively.
III. EXPERIMENT
We tested the proposed technique with a carbon steel specimen. The specimen was made of JIS-S40C and measured 150 mm long, 20 mm wide and 3 mm thick. In order to remove the residual stress, the specimen was annealed for 20 min at 600 °C in an Ar atmosphere. Figure 3 shows a micrograph of the specimen, where the grain size is approximately 10 μm. A 20 mm × 20 mm area was electropolished 150 μm deep to remove the effect of surface processing. The following X-ray measurements were then applied to this part.
Micrograph of the specimen (JIS-S40C).

Prior to the measurement with the new method, we applied four-point bending tests and measured X-ray stress by means of the sin2 ψ method with a Rigaku MSF-2M stress analyzer using 211 reflection of CrKα line. From the measurement, we determined the X-ray elastic constant of the specimen as
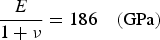 $$\displaystyle{E \over {1 + \nu}} = 186\quad ({\rm GPa})$$
In addition, we confirmed that the shear stress of the specimen was
 $${\tau _{xy}}\sim 0$$
We applied a four-point bending test on the specimen while measuring the D–S ring with a μ-X360 X-ray stress measurement instrument provided by Pulstec Industrial (Pulstec). The characteristic X-ray used, CrKα, was irradiated through a 1-mmϕ collimator. Throughout the study, the distance between the specimen and the imaging detector was approximately 39 mm and the radius of each D–S ring was approximately 17 mm. Obtained D–S rings were treated by standard processing with the instrument software. Other measurement conditions were set according to Miyazaki and Sasaki (Reference Miyazaki and Sasaki2014).
In order to apply the incident angle oscillation, we oscillated the μ-X360 with a gonio stage provided by Pulstec Industrial. Figure 4 shows the entire measurement system. In the following experiment, the center of the X-ray incident angle was set to ψ 0 = 25° and ±5° or ±10° oscillations were applied. The X-ray exposure time was 30 s throughout this study and the ψ was moved so as to satisfy the assumption of Eq. (8).
X-ray stress analyzer and the gonio stage.

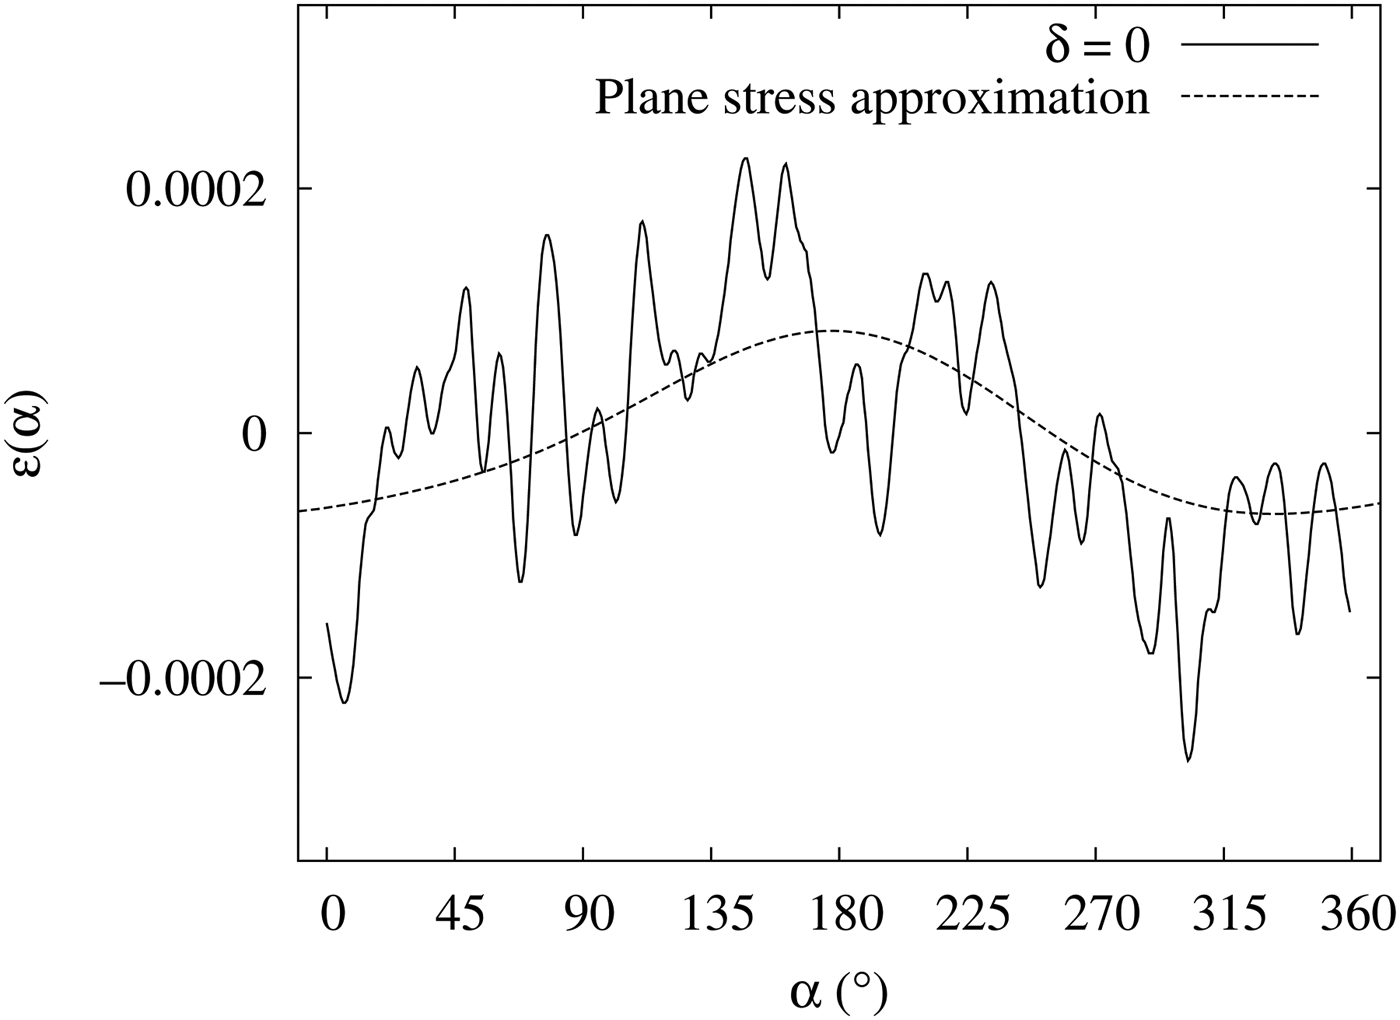
Figure 5(a) shows an example of a D–S ring obtained without the oscillation. From this D–S ring, ε(α)was obtained (Figure 6). In this example, stress of approximately 160 MPa was applied to the specimen. Compared with the plane stress assumption (dashed line, described later), ε(α) in the figure contains relatively large δε(α), and the estimations of the macro stress values are likely to have a large number of errors.
Examples of measured D–S rings (stress applied ~160 MPa). (a) Without the incident angle oscillation. (b) With ±10° oscillation.

ε(α) from the D–S ring of Figure 5 (solid line) and the plane stress approximation (dashed line).

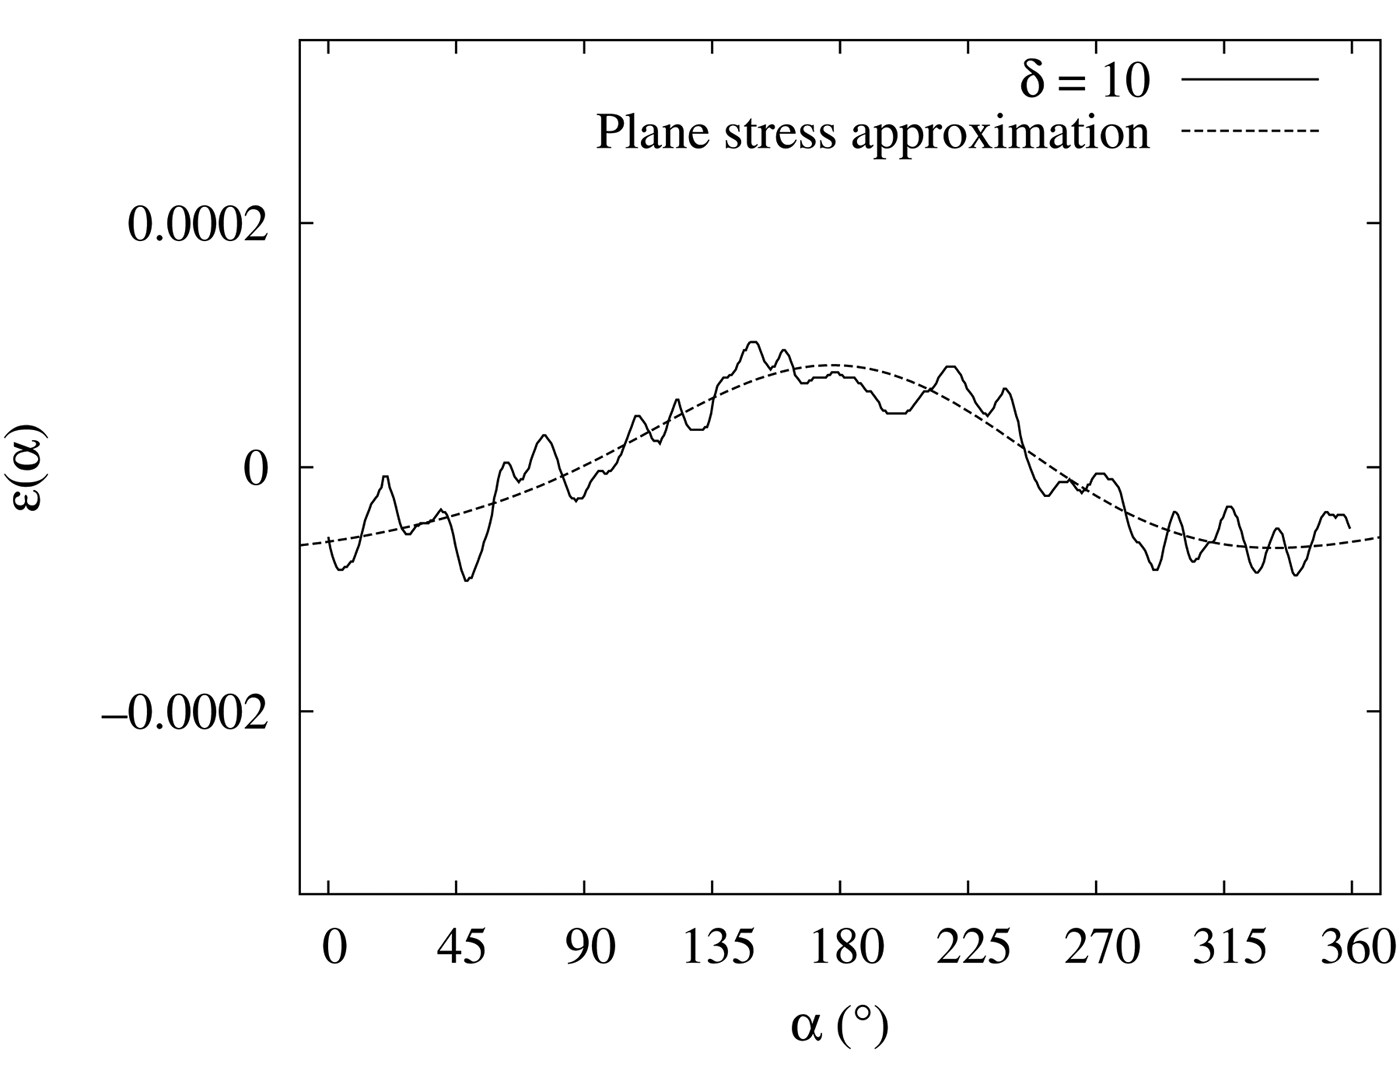
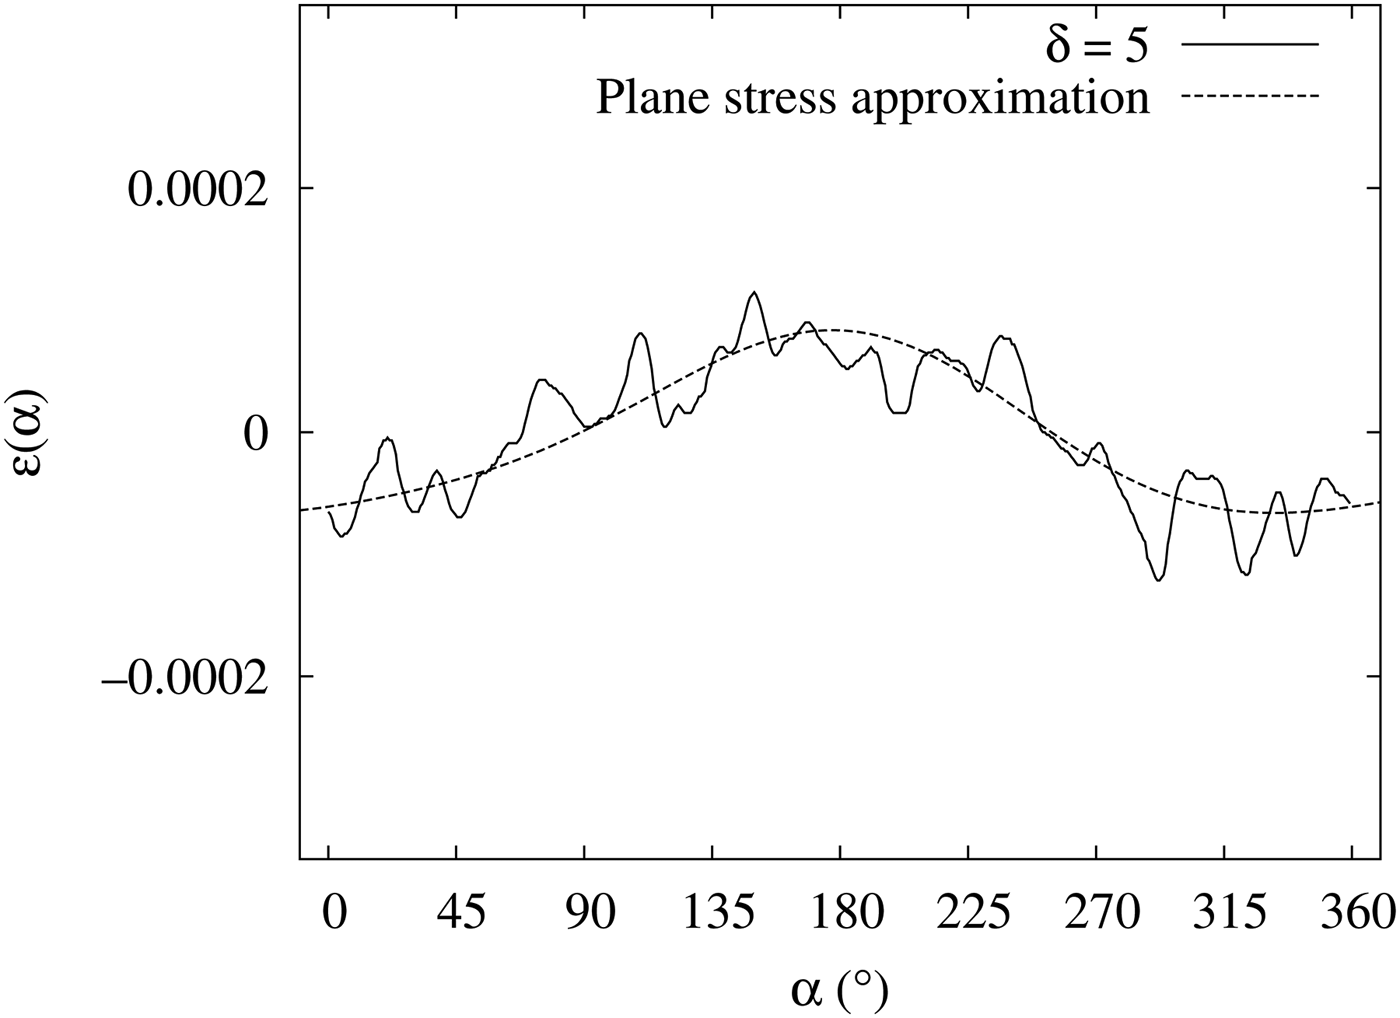
Next, we applied the incident angle oscillation [Figure 5(b) shows an example of D–S ring] and obtained ε(α) (Figures 7 and 8). The oscillation angles δ were ±5° (Figure 7) and ±10° (Figure 8). From these figures, we can state that the incident angle oscillation reduces the effect of δε(α). These effects made little difference for δ = ±5° and δ = ±10°.
ε(α) with ±5° incident angle oscillation (solid line) and the plane stress approximation (dashed line) (stress applied ~160 MPa).
ε(α) with ±10° incident angle oscillation (solid line) and the plane stress approximation (dashed line) (stress applied ~160 MPa).
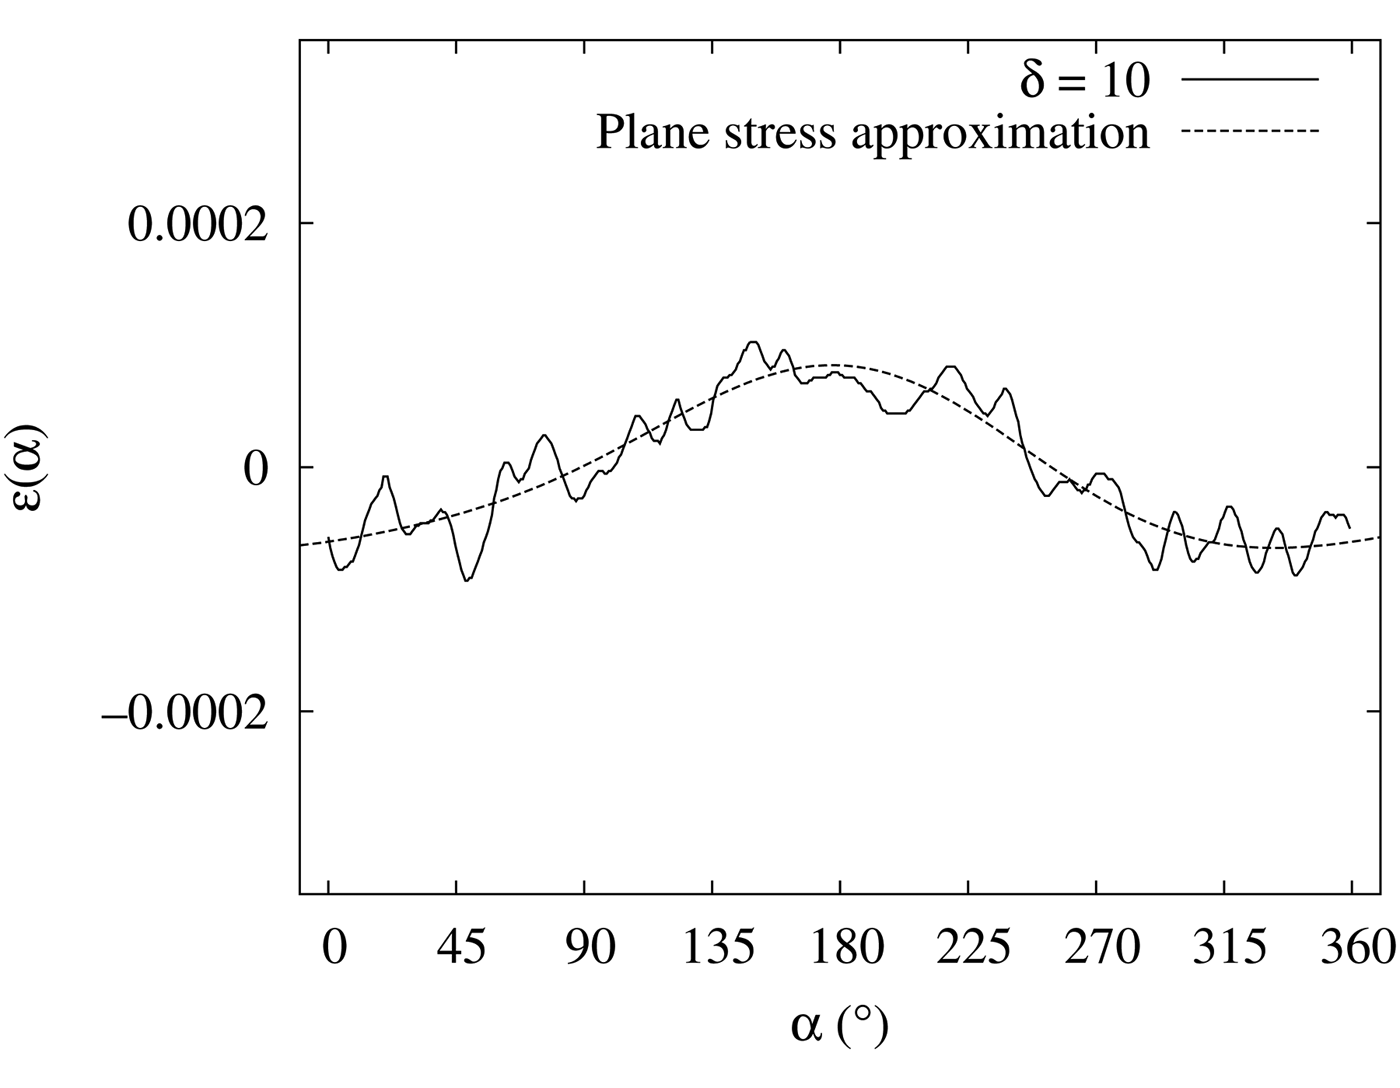
We assumed that the ε(α) of Figure 8 was a good approximation of the macro stress of the specimen and calculated the Fourier coefficients
 ${\bar a_1}$
,
 ${\bar b_1}$
,
 ${\bar a_2}$
, and
 ${\bar b_2}$
. We applied the compensation of Eq. (10) and obtained the plane stress approximation as
 $$\eqalign{\varepsilon (\alpha ) = & {a_1}({\psi _0})\cos \alpha + {b_1}({\psi _0})\sin \alpha + {a_2}({\psi _0})\cos 2\alpha + {b_2}({\psi _0}) \cr & \times \sin 2\alpha}$$
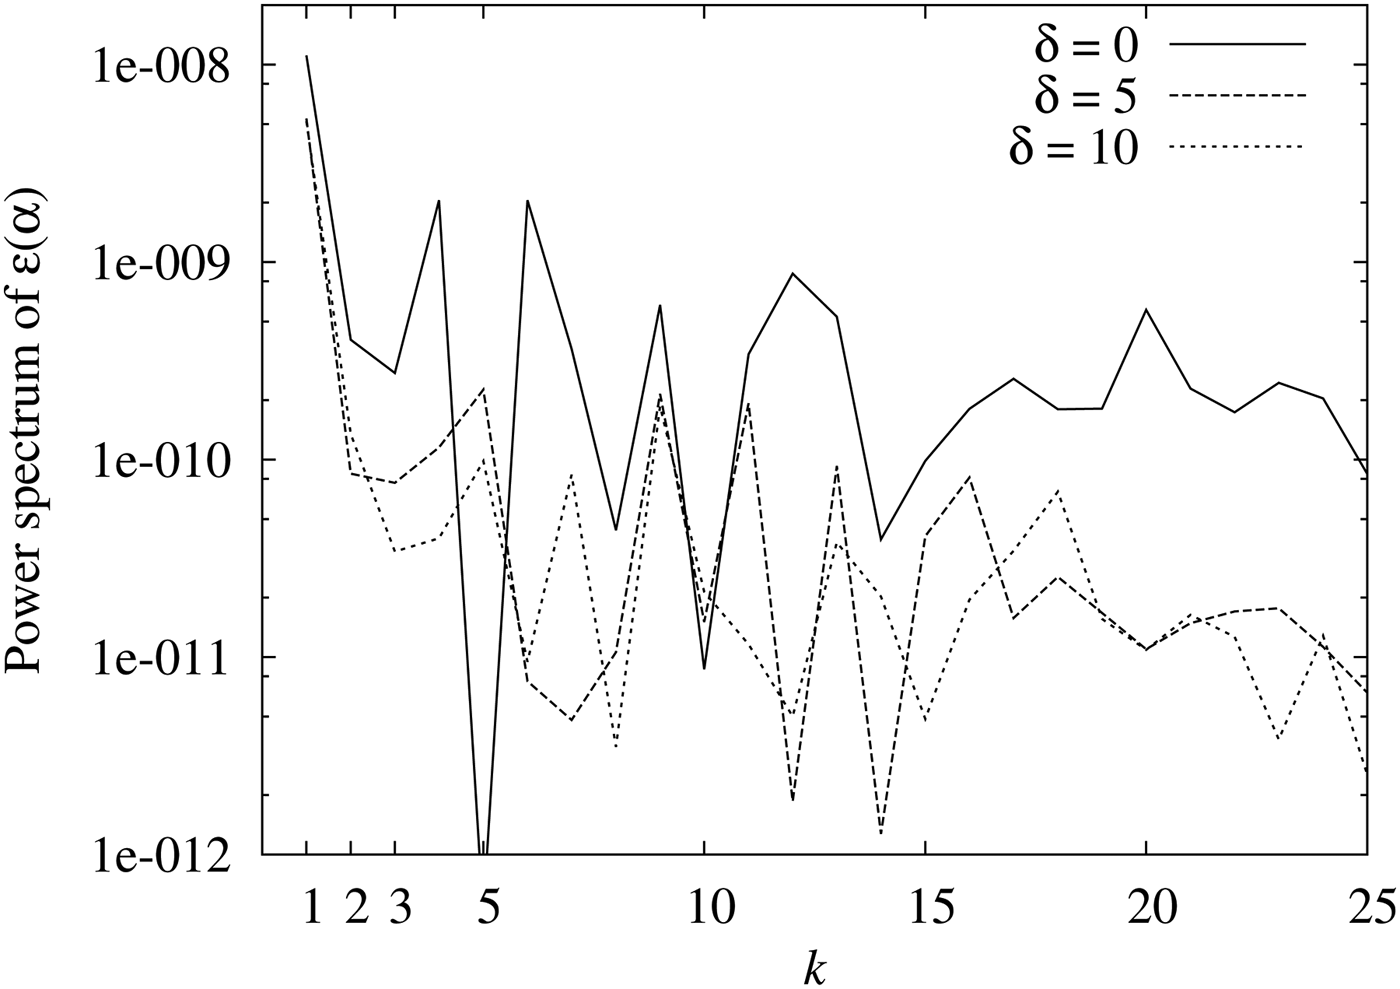
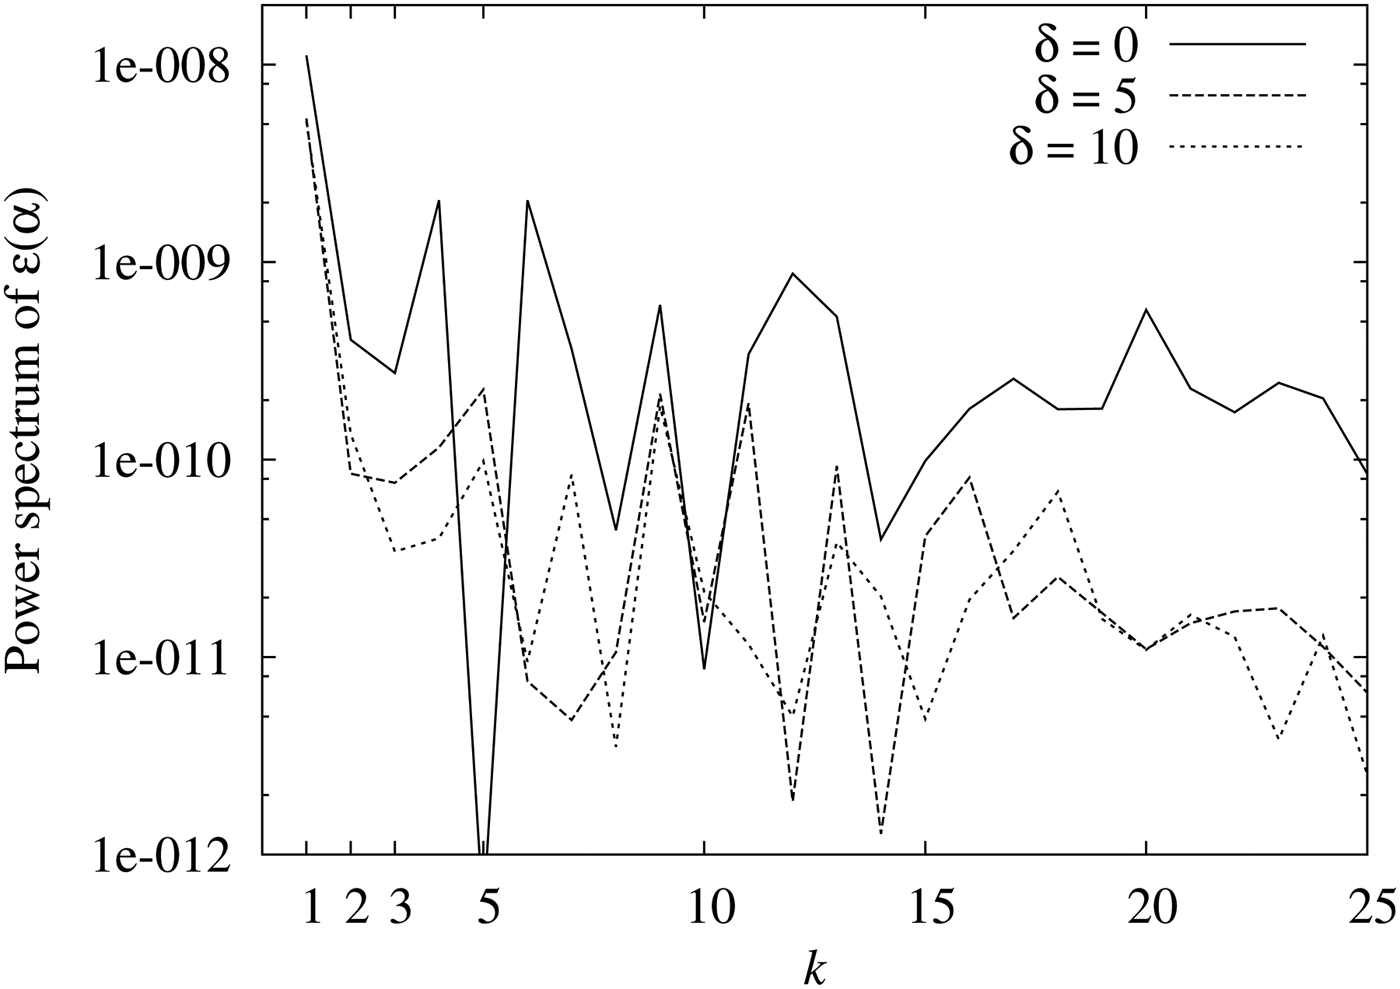
In order to examine the effect of the incident angle oscillation, we calculated the power spectrum of ε(α) (Figure 9). In this plot, the horizontal axis represents k from the Fourier series of ε(α)
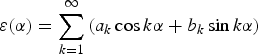 $$\varepsilon (\alpha ) = \sum\limits_{k = 1}^\infty {\left( {{a_k}\cos k\alpha + {b_k}\sin k\alpha} \right)} $$
Power spectrum of ε(α) (stress applied ~160 MPa). Without the incident angle oscillation (δ = 0), with ±5° oscillation (δ = 5), and with ±10° oscillation (δ = 10).
The vertical axis represents the power spectrum of ε(α):
 $$E(k) = a_k^2 + b_k^2 $$
The plane stress components appear only at k = 1, 2, and k ≥ 3 components are produced by δε(α). From Figure 9, it can be observed that the incident angle oscillation reduces the power spectrum at k ≥ 3. This is because the oscillation reduces the effect of δε(α). Moreover, E(1) and E(2) are also affected by δε(α). Consequently, the macro stress values estimated without the ψ oscillation contain a relatively large number of errors because of δε(α).
It is also possible to estimate the error of the stress because of δε(α). From Figure 9, it can be seen that the non-plane-stress components of E(k) have a small dependence on k and can be regarded as white noise. Therefore, the errors of the plane stress components a 1–b 2 by the δε(α) can be estimated as
 $$\delta {a_1}\sim \delta {b_1}\sim \delta {a_2}\sim \delta {b_2}\sim \sqrt {\displaystyle{{E(3)} \over 2}} \sim \sqrt {\displaystyle{{E(4)} \over 2}} \cdots $$
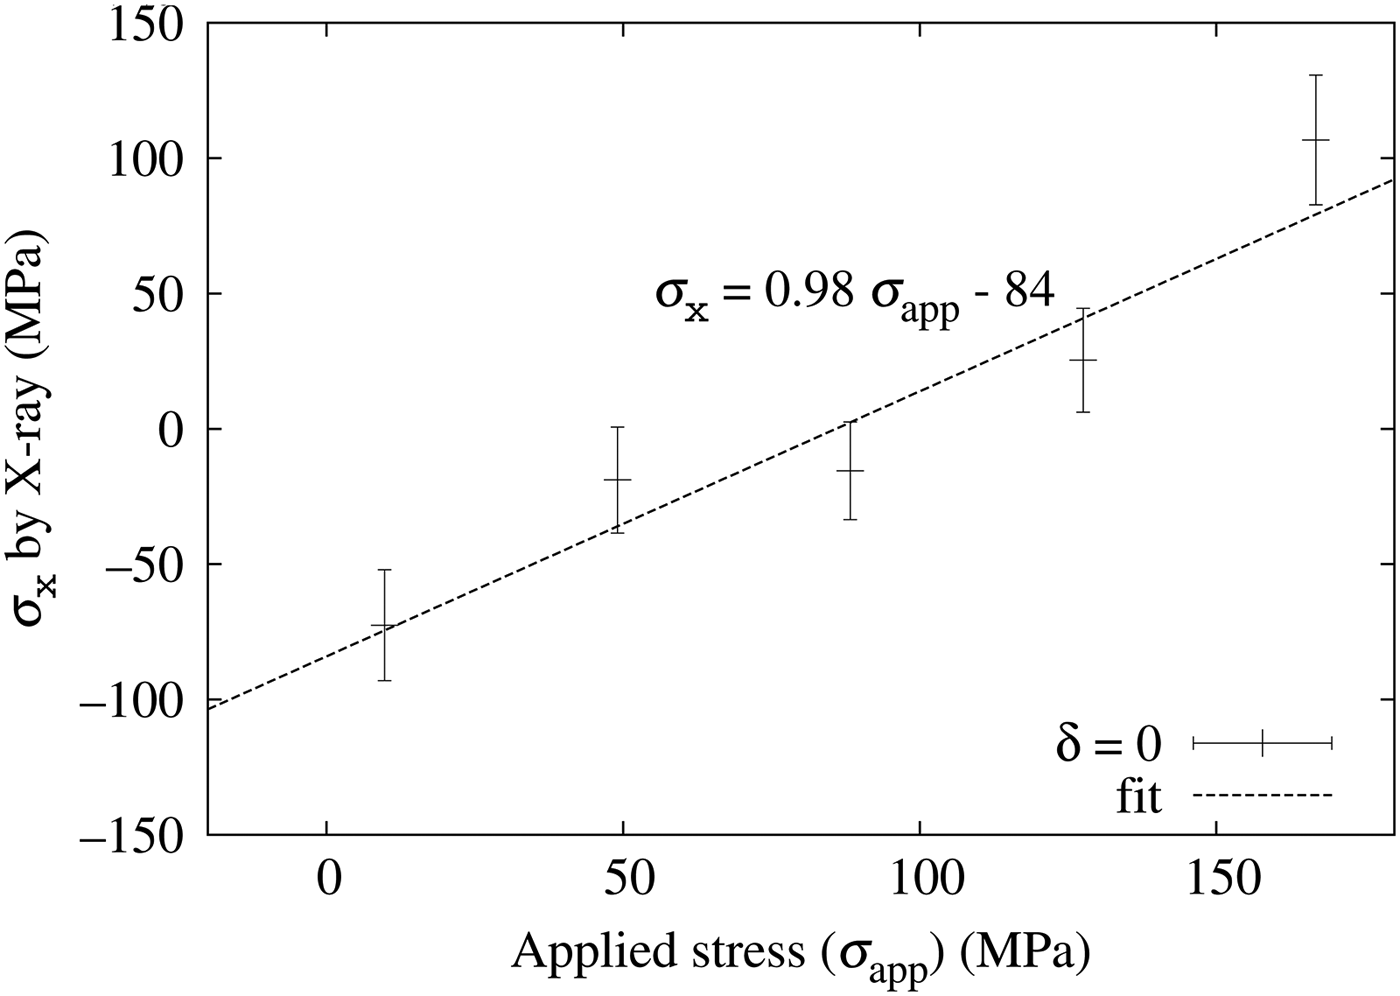
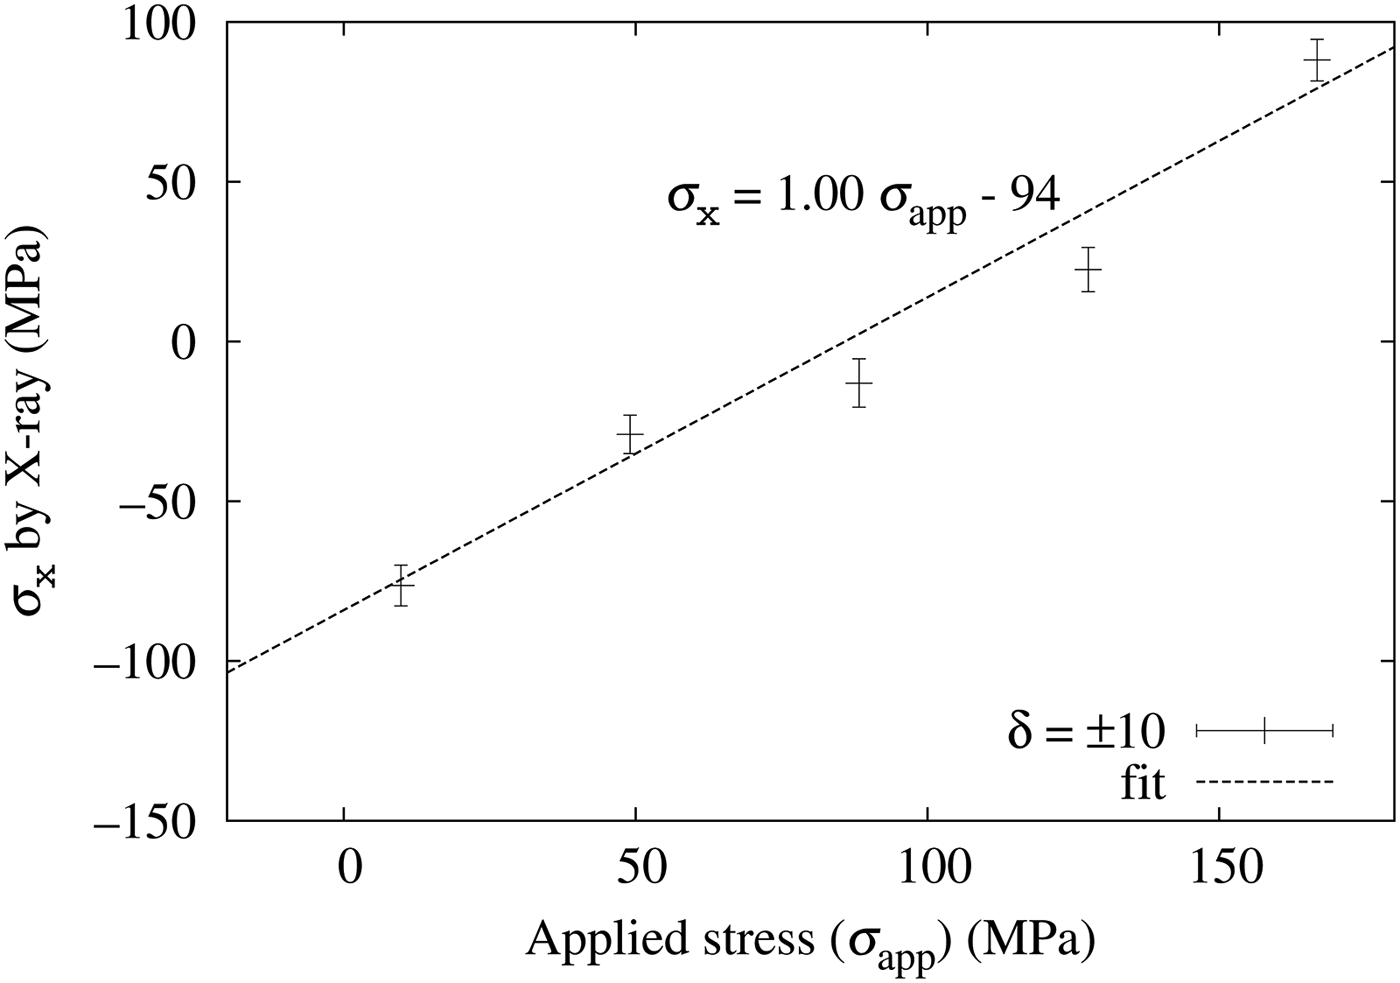
Next, we measured D–S rings with and without the incident angle oscillation while applying a four-point bending test to the specimen. Figure 10 shows the result without the incident angle oscillation and Figure 11 that with ±10° oscillation. In both figures, the horizontal axis shows the applied mechanical stress and the vertical axis shows the stress by X-ray [Eq. (3)]. The errors of a 1 and b 1 (discussed later) are calculated using the average of E (3)~E (5) and Eq. (13) as
 $$\delta {a_1}\sim \delta {b_1}\sim \sqrt {\displaystyle{{E(3) + E(4) + E(5)} \over 2\times 3}} $$
Stress applied with a four-point bending test (horizontal axis) and the X-ray measured stress σ x without the incident angle oscillation (vertical axis).

Stress applied with a four-point bending test (horizontal axis) and the X-ray measured stress σ x with ±10° incident angle oscillation (vertical axis).
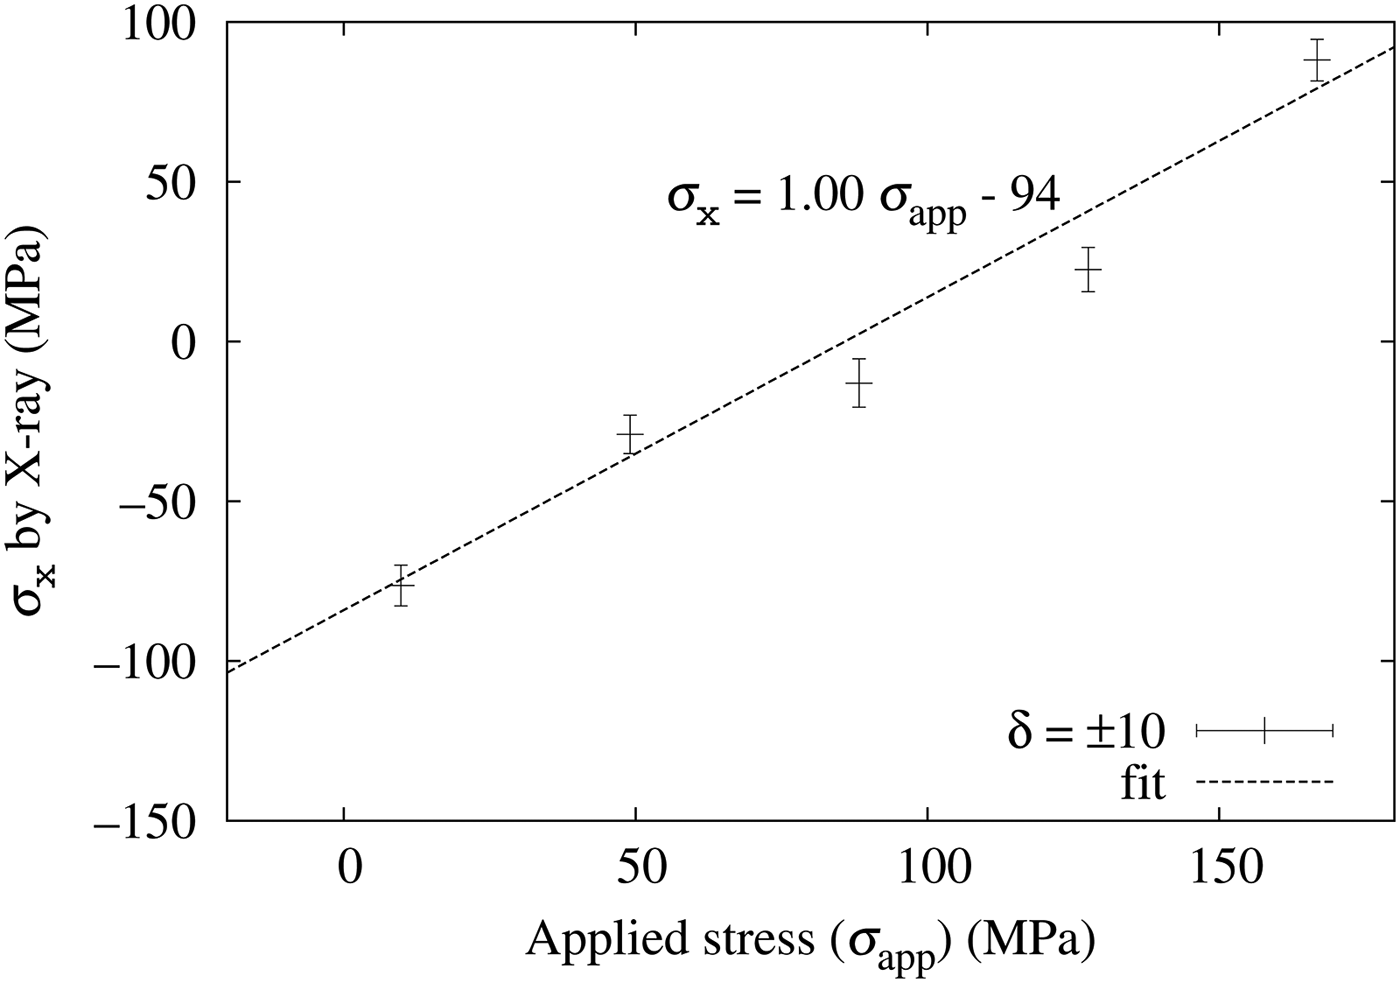
In both figures, the X-ray measured stresses are proportional to the mechanically applied stress and the proportional coefficients are close to 1.0 (0.98 and 1.00, respectively). The error bars are smaller with the incident angle oscillation and the fitted lines are within a 95% confidence range from the measured σ x .
Figure 12 shows the X-ray measured τ xy calculated from b 1 using Eq. (3). The horizontal axis shows the mechanically applied stress to the specimen. The solid error bars represent τ xy from the measurement without the incident angle oscillation and the dashed error bars represent those with ±10° oscillation. The averaged τ xy were
 $${\tau _{xy}} = 54\quad ({\rm MPa})\,(\hbox{without oscillation})\; $$
 $$\quad {\tau _{xy}} = 10 \quad ({\rm MPa})\; ({\rm with} \pm 10^{\circ}\ {\rm oscillation})$$
Stress applied with a four-point bending test (horizontal axis) and the X-ray measured shear stress τ xy . Without the incident angle oscillation (δ = 0) and with ±10° oscillation (δ = 10).
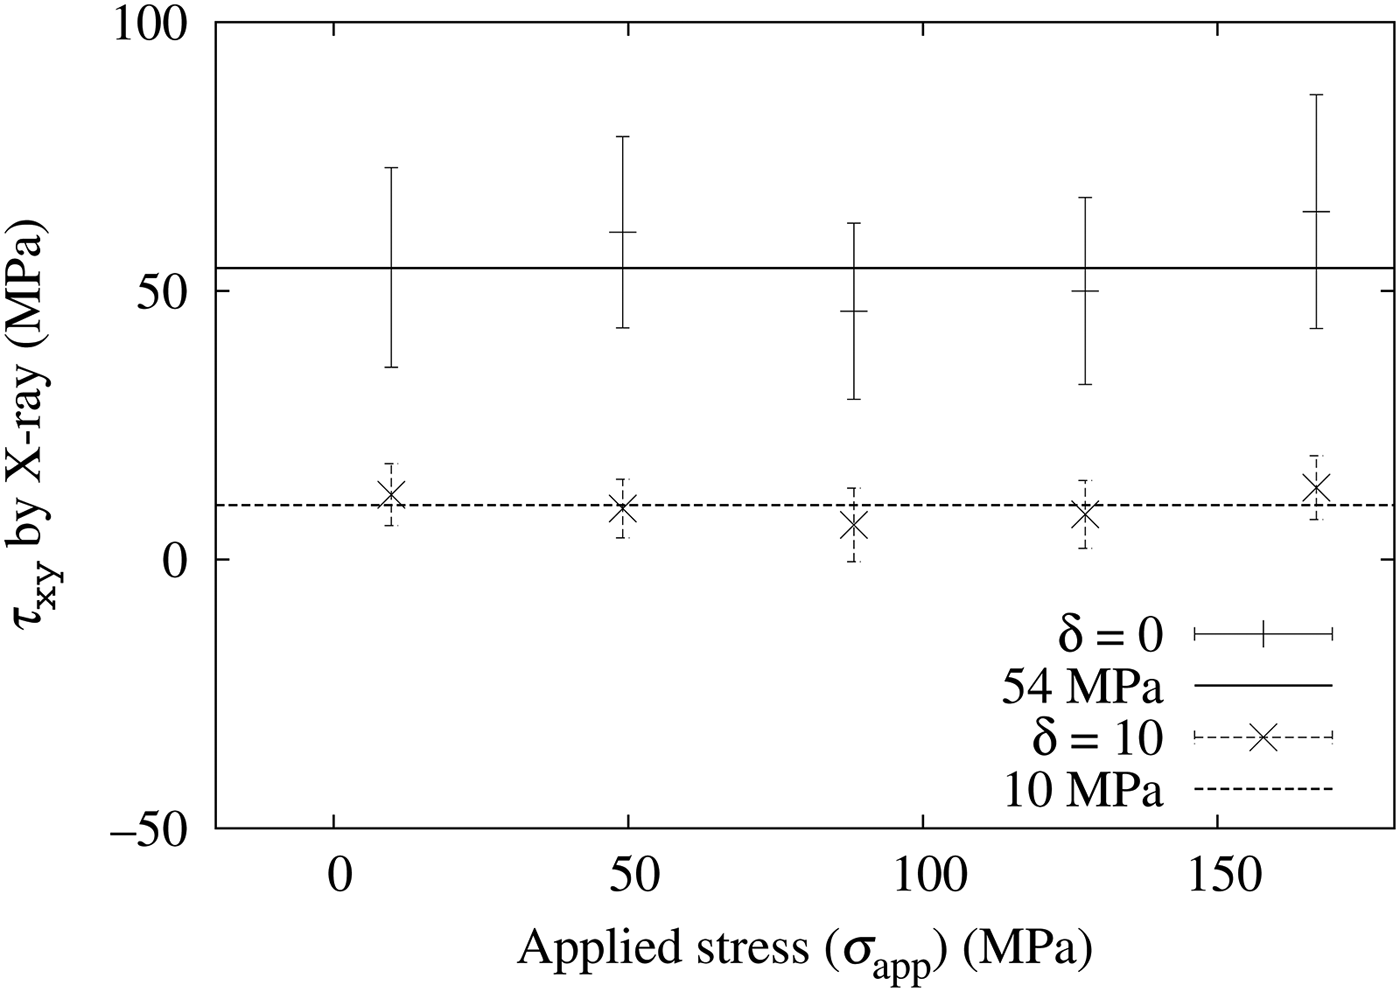
A comparison with Eq. (12) leads us to conclude that the incident angle oscillation of XRD system provides more accurate value.
In this study, the τ xy value was improved by the ψ oscillation while the improvement of the σ x value was not clear. This is because the δε(α) of this experiment contains more of a sinα component than a cosα component.
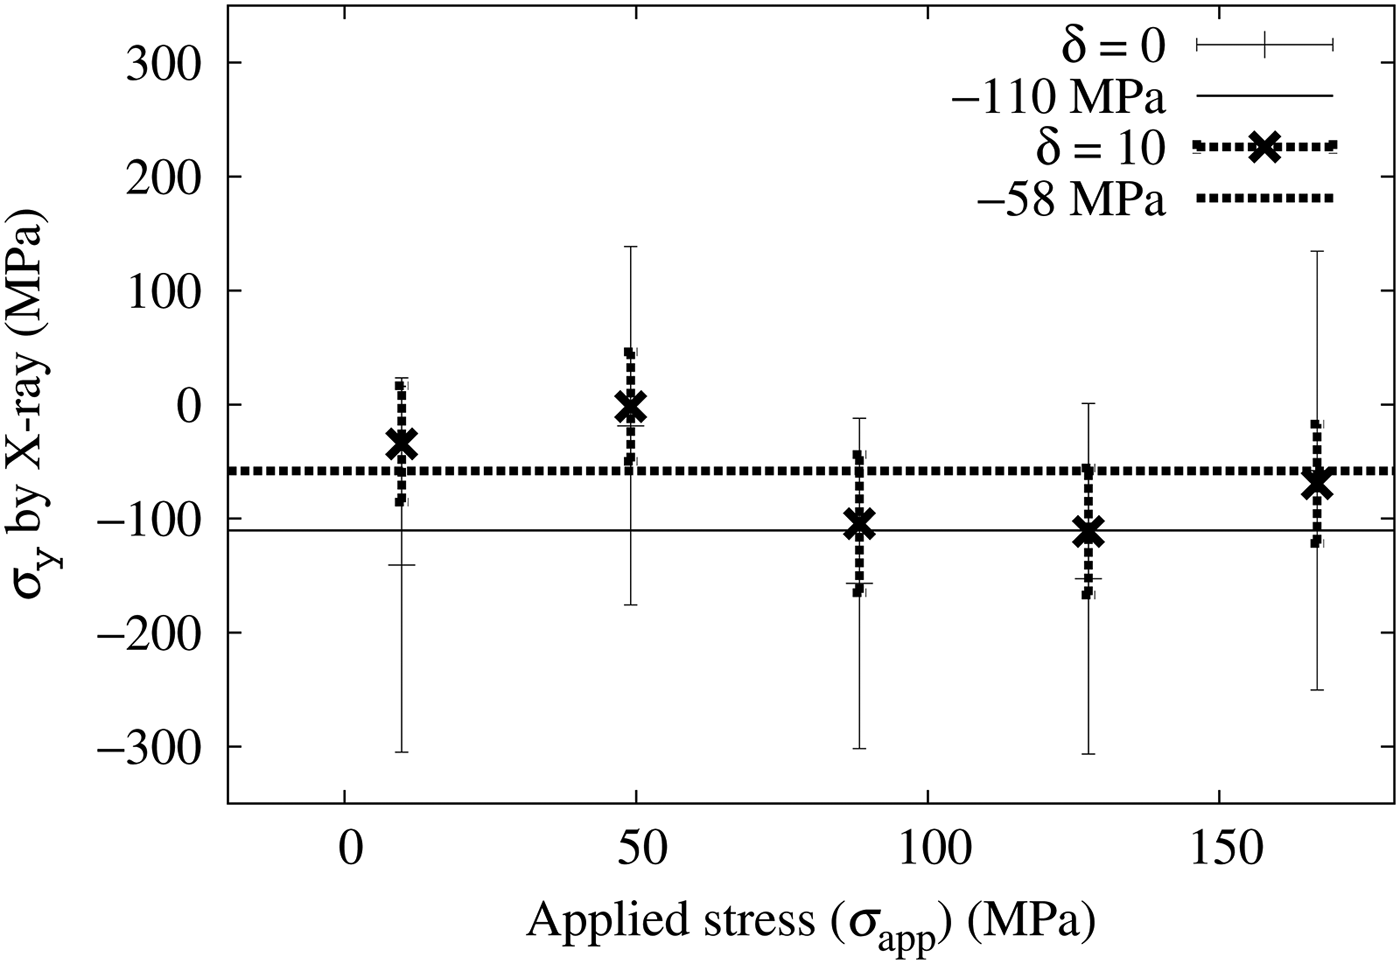
Figure 13 shows the X-ray measured σ y calculated from a 1 and a 2 using Eq. (2). The horizontal axis shows the mechanically applied stress to the specimen. The solid error bars represent σ y from the measurement without the incident angle oscillation and the dashed error bars represent those with ±10° oscillation. Eq. (10) was used to compensate the oscillation. The averaged σ y were
 $${\sigma _y} = - 110 \quad ({\rm MPa})\,\; (\hbox{without oscillation})$$
 $${\sigma _y} = - 58 \quad ({\rm MPa})\; ({\rm with} \pm 10^{\circ} {\rm oscillation})$$
Stress applied with a four-point bending test (horizontal axis) and the X-ray measured stress σ y . Without the incident angle oscillation (δ = 0) and with ±10° oscillation (δ = 10).
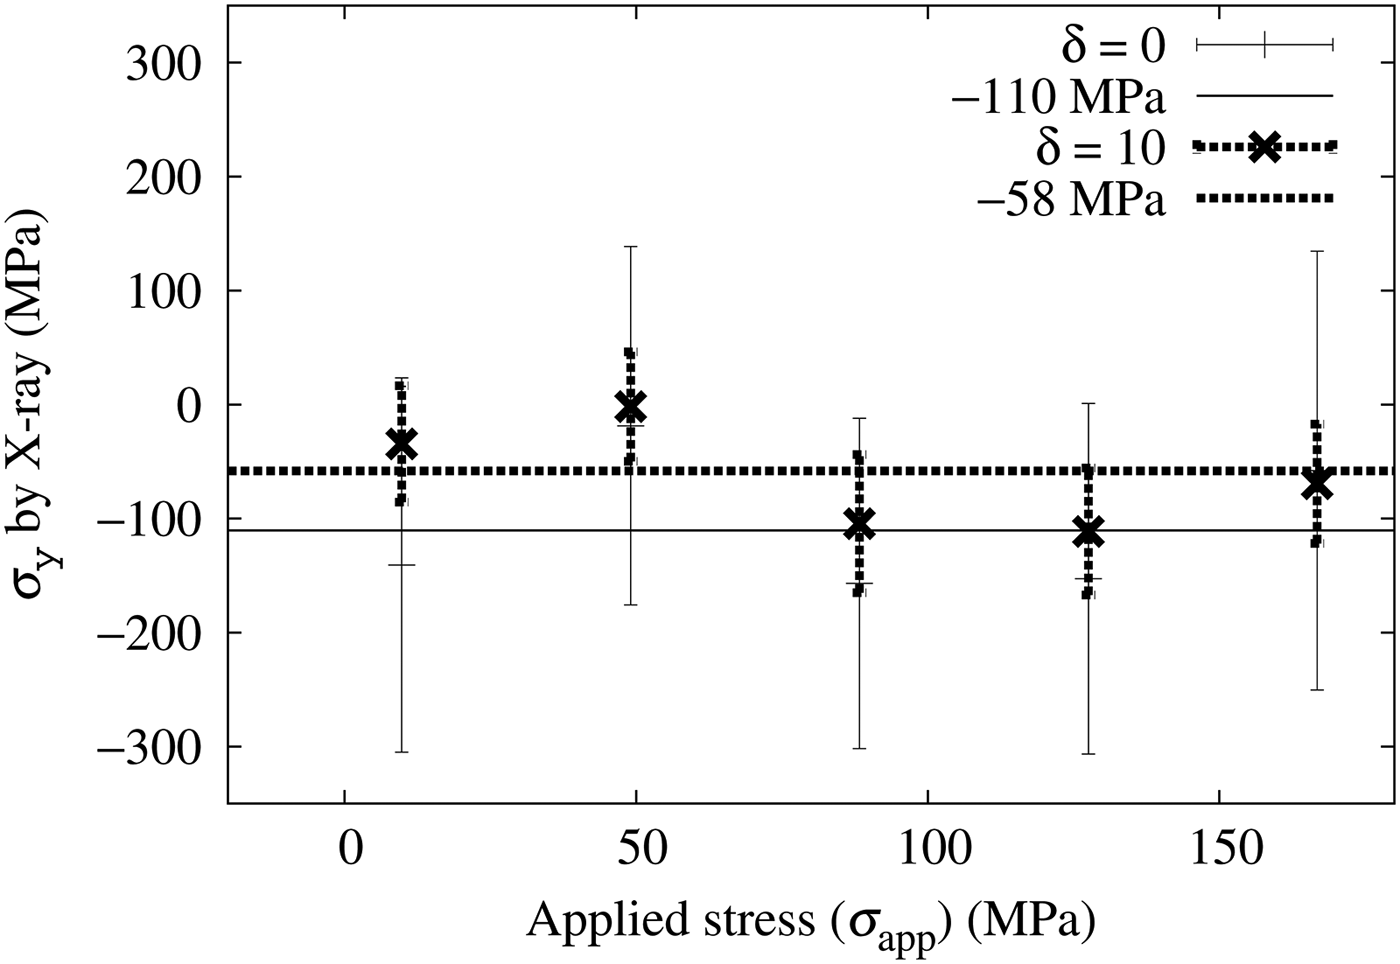
Although both measurements agree with σ y = 0 within the 95% confidence range (two times of the error bars of Figure 13), estimation errors are large compared with σ x and τ xy cases. Further improvements are required to the σ y estimation.
IV. CONCLUSION
In this paper, we applied incident angle oscillation to an X-ray stress measurement by Fourier analysis of a D–S ring. Incident angle oscillation is effective with coarse-grained specimens producing a grainy D–S ring. The proposed technique makes the normal strain ε(α) closer to the plane stress approximation. This effect was clearly illustrated by the power spectrum of ε(α). Although the improvement to σ x values was not clear, we did find that the τ xy values were significantly improved. We also proposed a method to estimate the measurement errors by the grain scale stress from the power spectrum. The estimations seem to be consistent with the measurements of this study.
The effective incident angle of the D–S ring obtained with the incident angle oscillation differs from the center of the oscillation angle ψ 0. We estimated this effect for the simplest case and found that at less than 2% for ±10° oscillation, it is not significant in terms of actual stress measurement.
ACKNOWLEDGMENTS
This work was partially supported by a Grant-in-Aid for the Innovative Nuclear Research and Development Program (No. 120804) from the Ministry of Education, Culture, Sports, Science and Technology in Japan.