Introduction
The contents of obsessional thoughts, like ‘did I turn off the stove?’ or ‘are my hands clean?’, are also experienced by 80–90% of non-clinical subjects (e.g. Rachman & de Silva, Reference Rachman and de Silva1978; Crye et al. Reference Crye, Laskey and Cartwright-Hatton2010). However, if these thoughts are frequently experienced and accompanied by distress, anxiety or compulsive behaviours, the criteria for an obsessive–compulsive disorder (OCD) may be fulfilled (American Psychiatric Association, 2013). Obsessions and compulsions are often related to potential harm or disastrous consequences of errors, such as burning the house or infecting oneself or others. Thus, it has been proposed that key symptoms of OCD like the feeling of incompleteness, doubt regarding the correctness of own actions and repetitive behaviours may result from hyperactive monitoring of behaviour for potential errors and conflicts (Pitman, Reference Pitman1987). This notion motivated studies using event-related potentials (ERPs) on neural correlates of performance monitoring and conflict adaptation in OCD.
A number of studies investigated performance monitoring in OCD with tasks eliciting response conflict. Evidence for enhanced monitoring of behavioural responses has been shown by larger amplitudes for the response-related error-related negativity (ERN; Falkenstein et al. Reference Falkenstein, Hohnsbein, Hoormann and Blanke1991; Gehring et al. Reference Gehring, Coles, Meyer and Donchin1995) and correct-related negativity (CRN; Ford, Reference Ford1999) in OCD (Gehring et al. Reference Gehring, Himle and Nisenson2000; Endrass et al. Reference Endrass, Klawohn, Schuster and Kathmann2008; Hajcak et al. Reference Hajcak, Franklin, Foa and Simons2008; Stern et al. Reference Stern, Liu, Gehring, Lister, Yin, Zhang, Fitzgerald, Himle, Abelson and Taylor2010; Riesel et al. Reference Riesel, Endrass, Kaufmann and Kathmann2011, Reference Riesel, Kathmann and Endrass2014, Reference Riesel, Endrass, Auerbach and Kathmann2015a ; Mathews et al. Reference Mathews, Perez, Delucchi and Mathalon2012; Endrass & Ullsperger, Reference Endrass and Ullsperger2014). However, results with regard to the processing of stimulus conflict and subsequent adjustment are less consistent (Stern & Taylor, Reference Stern and Taylor2014). The processing of stimulus conflict has been related to the N2 component of the ERP (Folstein & Van Petten, Reference Folstein and Van Petten2008). While some studies show enhanced N2 amplitudes in OCD (Towey et al. Reference Towey, Bruder, Tenke, Leite, DeCaria, Friedman and Hollander1993; Ruchsow et al. Reference Ruchsow, Reuter, Hermle, Ebert, Kiefer and Falkenstein2007; Ciesielski et al. Reference Ciesielski, Rowland, Harris, Kerwin, Reeve and Knight2011), others report evidence for a reduction (Morault et al. Reference Morault, Bourgeois, Laville, Bensch and Paty1997; Kim et al. Reference Kim, Kim, Yoo and Kwon2007; Keskin-Ergen et al. Reference Keskin-Ergen, Tükel, Aslantaş-Ertekin, Ertekin, Oflaz and Devrim-Üçok2014) or no difference in N2 amplitude (Herrmann et al. Reference Herrmann, Jacob, Unterecker and Fallgatter2003; Keskin-Ergen et al. Reference Keskin-Ergen, Tükel, Aslantaş-Ertekin, Ertekin, Oflaz and Devrim-Üçok2014). ERN and N2 are both characterized by a fronto-central topography and are assumed to share a common neural substrate, the posterior medial frontal cortex (van Veen & Carter, Reference van Veen and Carter2002; Ridderinkhof et al. Reference Ridderinkhof, Ullsperger, Crone and Nieuwenhuis2004; Iannaccone et al. Reference Iannaccone, Hauser, Staempfli, Walitza, Brandeis and Brem2015). Furthermore, both components are suggested to signal the need for an increase of cognitive control to avoid failure (Botvinick et al. Reference Botvinick, Braver, Barch, Carter and Cohen2001; Yeung et al. Reference Yeung, Botvinick and Cohen2004; Ullsperger et al. Reference Ullsperger, Fischer, Nigbur and Endrass2014; Iannaccone et al. Reference Iannaccone, Hauser, Staempfli, Walitza, Brandeis and Brem2015). Thus, the discrepancies with regard to enhanced ERN but inconsistent findings in N2 in OCD call for further investigation. Task characteristics and motivational factors have been shown to modulate aberrant error processing in OCD patients (Gründler et al. Reference Gründler, Cavanagh, Figueroa, Frank and Allen2009; Endrass et al. Reference Endrass, Schuermann, Kaufmann, Spielberg, Kniesche and Kathmann2010; Riesel et al. Reference Riesel, Richter, Kaufmann, Kathmann and Endrass2015b ) and may represent a potential explanation for variability in N2 results.
Another potential moderator of results is differences in the ability to flexibly adapt conflict or error monitoring to external requirements. Endrass et al. (Reference Endrass, Schuermann, Kaufmann, Spielberg, Kniesche and Kathmann2010) showed that healthy controls flexibly regulate error monitoring in accordance to experimental requirements (i.e. up-regulate in conditions of heightened error relevance, down-regulate under standard conditions), whereas OCD patients show enhanced error monitoring independently of situational demands. Flexibility in conflict monitoring is usually investigated by examining sequential conflict effects especially with regard to beneficial effects of conflict on subsequent adaptation (Gratton et al. Reference Gratton, Coles and Donchin1992). Several studies found that healthy controls show reduced conflict effects in behavioural and electrophysiological markers after incompatible trials, which is thought to reflect an adaptation related to compensatory adjustment in cognitive control (Botvinick et al. Reference Botvinick, Braver, Barch, Carter and Cohen2001; Kerns, Reference Kerns2006; Larson et al. Reference Larson, Clayson and Clawson2014). One previous study found reduced conflict adaptation in paediatric patients with OCD (Liu et al. Reference Liu, Gehring, Weissman, Taylor and Fitzgerald2012).
The aim of the present study was to examine behavioural and electrophysiological correlates of conflict monitoring and adaptation in a large sample of adult patients with OCD. Based on OCD symptoms such as doubt, repetitive behaviours and uncertainty, we would expect enhanced responses to conflict (i.e. enhanced N2 amplitudes) in OCD patients. This is further supported by the outlined similarities between ERN and N2 and the well-documented enhancement of ERN amplitude in OCD (Endrass & Ullsperger, Reference Endrass and Ullsperger2014). However, based on previous results showing reduced conflict adaptation in paediatric OCD (Liu et al. Reference Liu, Gehring, Weissman, Taylor and Fitzgerald2012) and an inverse relationship between N2 and CRN in healthy participants (Grützmann et al. Reference Grützmann, Riesel, Klawohn, Kathmann and Endrass2014), it is also possible that enhanced ERN and CRN amplitudes in OCD reflect a compensatory process for reduced conflict monitoring at stimulus processing, which would suggest reduced N2 amplitudes in OCD. Furthermore, the flexibility and adaptability of conflict monitoring are studied by sequential trial-by-trial conflict adaptation effects. We assume that patients with OCD show an inflexible monitoring of conflicts as it has been shown for paediatric OCD patients (Liu et al. Reference Liu, Gehring, Weissman, Taylor and Fitzgerald2012) and as it has been suggested for errors (Endrass et al. Reference Endrass, Schuermann, Kaufmann, Spielberg, Kniesche and Kathmann2010).
Method
Participants
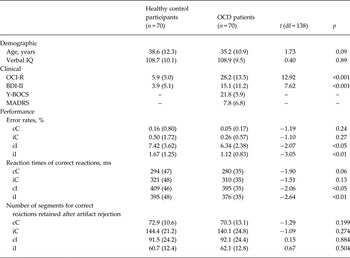
A total of 70 patients with OCD (38 females) and 70 healthy comparison participants (38 females) were included in the current study (Table 1). Data on error monitoring of 132 of these participants have been published in a previous study (Riesel et al. Reference Riesel, Kathmann and Endrass2014). All patients were recruited from the out-patient unit of the Department of Psychology at Humboldt University, Berlin, and were in the diagnostic phase before starting cognitive–behavioural therapy. Patients were diagnosed by trained clinicians using the Structured Clinical Interview for DSM-IV (SCID; First et al. Reference First, Gibbon, Spitzer and Williams1996) and fulfilled criteria for OCD as a primary diagnosis. Healthy comparison participants were recruited from the community through advertisement. Both groups were matched with regard to age and level of education. All participants were aged between 18 and 65 years, had normal or corrected-to-normal vision, and reported no history of head trauma or neurological disease. Exclusion criteria for patients were a lifetime diagnosis of psychotic or substance-related disorders; additional exclusion criteria for healthy controls were psychopharmacological treatment, psychotherapy and any present or past mental disorders as assessed with the SCID (First et al. Reference First, Gibbon, Spitzer and Williams1996). A total of 34 patients (48.6%) had one to three current co-morbid diagnoses, such as affective disorders (major depression n = 25, dysthymia n = 2), anxiety disorders (social phobia n = 15, panic disorder n = 4, generalized anxiety disorder n = 3, specific phobia n = 6), eating disorders (bulimia n = 2), somatoform disorders (hypochondrias n = 1), Tourette syndrome (n = 1) and personality disorders (obsessive–compulsive n = 11, avoidant n = 3, dependent n = 2, histrionic n = 2). Of the patients, 32 (45.7%) were currently receiving psychotropic medication (serotonin reuptake inhibitors n = 26, tricyclic antidepressants n = 6), which had been stable for at least 4 weeks before study participation. Participants received written and verbal information about the study, and gave written informed consent. Study procedures were in accordance with the ethical guidelines of the Declaration of Helsinki, as approved by the local ethics committee.
Demographic, clinical and performance measures of patients with OCD and healthy control participants

Data are given as mean (standard deviation).
OCD, Obsessive–compulsive disorder; df, degrees of freedom; IQ, intelligence quotient; OCI-R, Obsessive–Compulsive Inventory-Revised; BDI-II, Beck Depression Inventory-II; YBOCS, Yale–Brown Obsessive Compulsive Scale; MADRS, Montgomery–Åsberg Depression Rating Scale; cC, compatible trials preceded by a compatible trial; iC, compatible trials preceded by an incompatible trial; cI, incompatible trial preceded by a compatible trial; iI, incompatible trial preceded by an incompatible trial.
Measures
Participants completed the Beck Depression Inventory-II (BDI-II; Steer et al. Reference Steer, Ball, Ranieri and Beck1997; Hautzinger et al. Reference Hautzinger, Keller and Kühner2006) as well as the Obsessive–Compulsive Inventory-Revised (OCI-R; Foa et al. Reference Foa, Huppert, Leiberg, Langner, Kichic, Hajcak and Salkovskis2002; Gonner et al. Reference Gonner, Leonhart and Ecker2008), and a vocabulary test measuring verbal intelligence (Schmidt & Metzler, Reference Schmidt and Metzler1992). Severity of obsessive–compulsive symptoms was additionally rated by trained clinicians in patients with the Yale–Brown Obsessive Compulsive Scale (Goodman et al. Reference Goodman, Price, Rasmussen, Mazure, Fleischmann, Hill, Heninger and Charney1989; Hand & Büttner-Westphal, Reference Hand and Büttner-Westphal1991). Depressive symptoms were rated through the Montgomery–Åsberg Depression Rating Scale (Montgomery & Åsberg, Reference Montgomery and Åsberg1979; Neumann & Schulte, Reference Neumann and Schulte1989).
Task
An arrowhead flanker task (Kopp et al. Reference Kopp, Rist and Mattler1996) was administered using Presentation software (Neurobehavioral Systems, Inc., USA). On each trial, five vertically aligned arrows were presented and participants were instructed to respond with their index fingers in accordance with the direction of the central arrow. Responses were collected from response buttons with a 1000 Hz sampling rate. The four flanker stimuli were presented for 110 ms and pointed to the left or to the right. Then, flanker and target stimuli were presented simultaneously for 50 ms, followed by an inter-trial interval that varied randomly between 900 and 1500 ms. Half of the trials were compatible (i.e. flanker and target point in the same direction), and half were incompatible (i.e. flanker and target point in the opposite direction). Stimulus compatibility and direction varied pseudo-randomly across trials. Identical stimulus repetitions were omitted since conflict adaptation effects are sensitive to repetition priming (e.g. Mayr et al. Reference Mayr, Awh and Laurey2003; Clayson & Larson, Reference Clayson and Larson2011; Schmidt & De Houwer, Reference Schmidt and De Houwer2011). In all, 500 trials including 20 practice trials were presented. Short breaks and performance-based feedback were given every 60 trials. If error rates in one block were above 20%, participants were instructed to respond more accurately. When error rate was below 10%, participants were asked to respond faster. If error rates ranged between 10 and 20%, participants were reminded to respond both quickly and accurately. The duration of the experiment was about 25 min.
Electroencephalogram (EEG) recording, data reduction and analysis
The EEG was recorded from 65 electrodes with Cz as recording reference. Electrodes were mounted on an electrode cap with equidistant electrode positions (EASYCAP GmbH, Germany). External electrodes were placed below the left and right eyes, on the nasion, neck and below T1 (ground). All impedances were kept below 5 kΩ. The EEG was sampled at 500 Hz and amplified with a band pass filter of 0.01–100 Hz. Eye movement artifacts were corrected using the multiple source eye correction method (Berg & Scherg, Reference Berg and Scherg1994) implemented in BESA 5.2 (Brain Electrical Source Analysis, MEGIS Software GmbH, Germany). A digital low-pass filter set at 40 Hz and a notch filter at 50 Hz were applied to the raw data. Stimulus-locked epochs with a duration of 800 ms including a 200 ms pre-stimulus interval were extracted. Epochs containing a voltage step of more than 50 µV between consecutive sample points or a voltage difference of 200 µV of any two sample points within the epoch were excluded from averaging. The pre-stimulus interval −200 to −100 ms served as baseline. Before computing individual and grand averages for the N2, we calculated the current source density of the signal (Perrin et al. Reference Perrin, Pernier, Bertrand and Echallier1989) to enhance local electrical activities and reduce the effect of distal activities (volume conduction). N2 amplitudes were quantified at electrode FCz as the difference between the most negative peak occurring between 200 and 400 ms following the stimulus and the preceding positive peak (150–300 ms).
Statistical analyses were conducted using SPSS (version 21.0; USA). t Tests were used to assess group differences in demographic and symptom measures. To analyse conflict adaptation in N2 and behavioural measures, the Gratton effect (Gratton et al. Reference Gratton, Coles and Donchin1992) was evaluated by analysing current conflict as a function of preceding conflict. The following trial combinations are possible: compatible trials either preceded by a compatible (cC) or an incompatible trial (iC) and incompatible trials either preceded by a compatible (cI) or an incompatible trial (iI). Electrophysiological and behavioural data were analysed with repeated-measures analysis of variance using group (OCD patients v. comparison participants) as the between-subject factor and compatibility of the current (compatible v. incompatible) and preceding trial (compatible v. incompatible) as within-subject factors. Further, the overall conflict adaptation effect for N2 and behaviour was calculated using the formula: (cI – cC) – (iI – iC) (Nieuwenhuis et al. Reference Nieuwenhuis, Stins, Posthuma, Polderman, Boomsma and de Geus2006; Clayson & Larson, Reference Clayson and Larson2012). Error and post-error trials were excluded from ERP and behavioural analyses to avoid interference with error-related adaptation effects. The number of artifact-free trials in the four conditions are reported in Table 1 and did not differ between groups. For the OCD group, control analyses with medication status and co-morbidity as between-subject factors were conducted. For all analysis of variance results the effect size η 2 P was reported. For group comparisons Cohen's d and 95% confidence intervals (CIs) for Cohen's d were additionally reported. Correlation coefficients (Pearson r) were used to examine associations between symptom severity and conflict adaptation in N2 as well as behaviour.
Results
Demographic and clinical characteristics
Table 1 presents demographic, clinical and behavioural measures as well as statistical information for the t test comparing groups. Groups did not differ with regard to age, verbal intelligence quotient and gender. OCD patients scored higher on self-reported symptom severity for both OCI-R and BDI-II.
Behavioural data
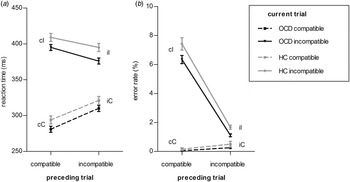
Error rates as well as reaction time on correct trials as a function of the compatibility of the current and preceding trials are shown in Table 1 and Fig. 1. Overall, OCD patients committed fewer errors than healthy comparison participants as reflected in a main effect of group (F 1,138 = 6.47, p < 0.05, η 2 P = 0.05, d = 0.43, 95% CI 0.09–0.76). Error rates were higher for incompatible than compatible trials (F 1,138 = 586.99, p < 0.001, η 2 P = 0.81). An interaction between group and current trial type emerged (F 1,138 = 3.89, p = 0.05, η 2 P = 0.03). A group difference in error rates was only observed in incompatible trials (t 138 = 2.53, p < 0.05, d = 0.43, 95% CI 0.09–0.76), but not in compatible trials (t 138 = 1.14, p = 0.26, d = 0.19, 95% CI −0.14 to 0.52). An interaction between preceding and current trial compatibility was found for error rates (F 1,138 = 632.10, p < 0.001, η 2 P = 0.82). Error rates were higher for cI than iI trials (t 139 = 25.19, p < 0.001), suggesting that conflict associated with the preceding trial improves conflict resolution in the current trial. The interaction of current trial compatibility, preceding trial compatibility and group was not significant (F 1,138 = 1.99, p = 0.16, η 2 P = 0.01). In accordance, the conflict adaptation score for error rates indicated an adaptation present in healthy controls (mean = 6.10, s.d. = 3.22) and patients (mean = 5.45, s.d. = 2.10), while no significant group difference was found (t 138 = 1.41, p = 0.16, d = 0.25, 95% CI −0.07 to 0.59).
Reaction times (a) and error rates (b) for healthy comparison (HC) participants and patients with obsessive–compulsive disorder (OCD) as a function of the compatibility of the current and preceding trial type. Values are means, with standard errors represented by vertical bars. cI, Incompatible trial preceded by a compatible trial; iI, incompatible trial preceded by an incompatible trial; cC, compatible trials preceded by a compatible trial; iC, compatible trials preceded by an incompatible trial.

Responses for correct trials were significantly shorter in patients than in controls (F 1,138 = 4.39, p < 0.05, η 2 P = 0.03, d = 0.36, 95% CI 0.02–0.69). Overall, reaction times were longer for incompatible compared with compatible trials (F 1,138 = 3847.43, p < 0.001, η 2 P = 0.97), and longer in trials following incompatible trials (F 1,138 = 95.98, p < 0.001, η 2 P = 0.41). A significant interaction between preceding and current trial type compatibility was observed (F 1,138 = 1078.45, p < 0.001, η 2 P = 0.89). The effect of current compatibility on reactions times was larger in trials preceded by compatible trials (mean = 115 ms, s.d. = 21) compared with trials preceded by incompatible trials (mean = 70 ms, s.d. = 18, t 139 = 32.21, p < 0.001). A significant interaction of current trial compatibility, previous trial compatibility and group was found (F 1,138 = 6.45, p < 0.05, η 2 P = 0.05). This interaction suggests that the reduction of the compatibility effect following incompatible trails was more pronounced in patients with OCD (mean = 66, s.d. = 18) than in healthy comparison participants (mean = 74, s.d. = 18, t 138 = 2.64, p < 0.05, d = 0.45, 95% CI 0.11–0.78). The reaction time difference following compatible trials did not differ between groups (t 138 = 0.32, p = 0.75, d = 0.05, 95% CI −0.28 to 0.39). These results suggest greater conflict adaptation in OCD patients, which was also reflected in a higher conflict adaptation score in reaction times for patients (mean = 48.15, s.d. = 17.09) compared with healthy participants (mean = 41.24, s.d. = 15.04, t 138 = 2.54, p < 0.05, d = 0.43, 95% CI 0.09–0.76).
Electrophysiological data
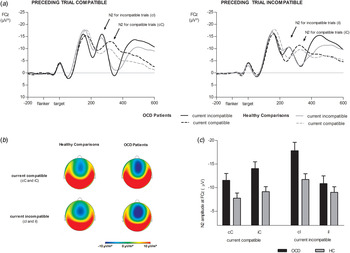
Grand average waveforms for N2 as well as topographies are presented in Fig. 2. Patients with OCD show higher (i.e. more negative) N2 amplitudes than healthy controls (F 1,138 = 7.10, p < 0.01, η 2 P = 0.05, d = 0.45, 95% CI 0.11–0.79). The main effect of current trial compatibility was not significant (F 1,138 = 3.34, p = 0.07, η 2 P = 0.02), but a significant effect of preceding trial compatibility was found (F 1,138 = 8.43, p < 0.01, η 2 P = 0.06). Further, the interaction of preceding and current trial compatibility was significant (F 1,138 = 44.33, p < 0.001, η 2 P = 0.24). Importantly, a significant interaction of both factors with group was observed (F 1,138 = 6.76, p < 0.01, η 2 P = 0.05) (see Fig. 2c ). A significant reduction in N2 amplitude in iI trials compared with cI trials (i.e. Gratton effect) was found in healthy comparison participants (t 69 = 2.83, p < 0.01) and in patients with OCD (t 69 = 6.54, p < 0.001). This reduction was larger for patients with OCD (mean = 6.94, s.d. = 8.89) than for healthy controls (mean = 2.73, s.d. = 8.09, t 138 = 2.93, p < 0.01, d = 0.50, 95% CI 0.16–0.83). As a result of stronger conflict adaptation in patients with OCD, group differences disappeared in iI trials (t 138 = 0.92, p = 0.36, d = 0.16, 95% CI −0.18 to 0.49), whereas N2 amplitudes were larger in OCD patients in all other conditions (cI, t 138 = 2.81, p < 0.01, d = 0.48, 95% CI 0.14–0.81; iC, t 138 = 2.72, p < 0.01, d = 0.46, 95% CI 0.12–0.79; cC, t 138 = 2.07, p < 0.05, d = 0.35, 95% CI 0.02–0.68). An influence of previous trial compatibility on current compatible trials was found for OCD patients, who showed larger N2 in iC trials compared with cC trials (t 138 = 2.29, p < 0.05), whereas healthy comparison participants did not show a significant difference (t 138 = 1.55, p = 0.13). The overall conflict adaptation score also indicated stronger conflict adaptation in N2 amplitude for OCD patients (mean = −9.44, s.d. = 13.12) compared with healthy comparison participants (mean = −4.14, s.d. = 10.91, t 138 = 2.6, p < 0.01, d = 0.44, 95% CI 0.10–0.78). The larger score in OCD patients reflected a stronger effect of preceding conflict on N2 amplitude, i.e. a larger difference in N2 after compatible trials (cI, cC) than after incompatible trials (iI, iC), reflecting the beneficial effects of conflict resolution in the previous trial.
(a) Grand average waveforms at electrode site FCz of stimulus-locked N2 in healthy comparison (HC) participants and patients with obsessive–compulsive disorder (OCD) for current incompatible (solid lines) and compatible trials (dashed lines) that are preceded by compatible (left subfigure) or incompatible trials (right subfigure). (b) Topographies (current source density) of N2 in the time window from 250 to 350 ms after stimulus presentation. For interpretation of the colour scale of the topographies in this figure, the reader is referred to the web version of this article. (c) N2 amplitudes at electrode site FCz in HC participants and patients with OCD for current compatible trials and incompatible trials as a function of preceding conflict. Values are means, with standard errors represented by vertical bars.

Additional analyses were calculated using medication status and co-morbidity as between-subject factors in the patient group. Neither medication status (F 1,67 = 0.06, p = 0.95, η 2 P = 0.002), nor co-morbidity (F 1,67 = 1.14, p = 0.29, η 2 P = 0.02), significantly influenced the observed pattern of results in patients.
Correlational analyses
No significant correlations of the conflict adaptation scores for N2, error rates, and reaction times with clinical measures (OCI-R and BDI-II) in OCD patients were observed (all p > 0.26, r < 0.11). In healthy comparison participants, a significant correlation of the conflict adaptation score for the N2 with the BDI-II emerged (r = −0.24, p < 0.05), indicating higher conflict adaptation in the N2 (i.e. more negative values) with higher BDI-II scores. However, this correlation was driven by two participants with the highest BDI-II scores; after exclusion of them the correlation was no longer significant (r = −0.15, p = 0.21).
Discussion
The current study showed enhanced conflict monitoring in OCD during stimulus processing as reflected by larger N2 amplitudes. Further, OCD patients showed greater conflict adaptation in N2 amplitudes and reaction times. Our results are consistent with studies showing an increase of N2 amplitudes in OCD (Towey et al. Reference Towey, Bruder, Tenke, Leite, DeCaria, Friedman and Hollander1993; Ruchsow et al. Reference Ruchsow, Reuter, Hermle, Ebert, Kiefer and Falkenstein2007; Ciesielski et al. Reference Ciesielski, Rowland, Harris, Kerwin, Reeve and Knight2011) and, more broadly, in individuals with high trait anxiety or behavioural inhibition (Dennis & Chen, Reference Dennis and Chen2009; Leue et al. Reference Leue, Lange and Beauducel2012, Reference Leue, Weber and Beauducel2014), traits that are transdiagnostically associated with anxiety disorders and OCD. However, several studies in OCD did not report differences in N2 amplitude (Herrmann et al. Reference Herrmann, Jacob, Unterecker and Fallgatter2003; Keskin-Ergen et al. Reference Keskin-Ergen, Tükel, Aslantaş-Ertekin, Ertekin, Oflaz and Devrim-Üçok2014) or even reported an N2 reduction (Morault et al. Reference Morault, Bourgeois, Laville, Bensch and Paty1997; Kim et al. Reference Kim, Kim, Yoo and Kwon2007; Keskin-Ergen et al. Reference Keskin-Ergen, Tükel, Aslantaş-Ertekin, Ertekin, Oflaz and Devrim-Üçok2014). Similarly, a study examining patients with generalized anxiety disorder (Larson et al. Reference Larson, Clawson, Clayson and Baldwin2013), a disorder that shares key symptoms with OCD such as worry and overestimation of threat, found evidence for reduced principal-component N2 amplitudes and conflict adaptation in N2 but not at the behavioural level. Overall, this variability in findings across studies needs further clarification and future studies should examine potential moderators such as task characteristics, data analysis techniques and heterogeneity in symptoms. For example, Larson et al. (Reference Larson, Clawson, Clayson and Baldwin2013) only found group differences in principal-component N2, but not in original N2 amplitudes suggesting that different functional aspects and sources are captured in ERP N2 and principal component analysis-derived factors. Further, co-morbidity (e.g. Weinberg et al. Reference Weinberg, Klein and Hajcak2012), differences in symptoms between generalized anxiety disorder and OCD as well as heterogeneity within OCD symptoms (Mataix-Cols et al. Reference Mataix-Cols, Rosario-Campos and Leckman2005) are potential confounds that could lead to discrepant findings. With regard to task effects, previous studies mostly used Go/NoGo tasks to analyse conflict monitoring in OCD (Herrmann et al. Reference Herrmann, Jacob, Unterecker and Fallgatter2003; Kim et al. Reference Kim, Kim, Yoo and Kwon2007; Ruchsow et al. Reference Ruchsow, Reuter, Hermle, Ebert, Kiefer and Falkenstein2007; Keskin-Ergen et al. Reference Keskin-Ergen, Tükel, Aslantaş-Ertekin, Ertekin, Oflaz and Devrim-Üçok2014). Go/NoGo tasks require a high degree of response inhibition, which is proposed to be dysfunctional in OCD (Chamberlain et al. Reference Chamberlain, Blackwell, Fineberg, Robbins and Sahakian2005, Reference Chamberlain, Fineberg, Menzies, Blackwell, Bullmore, Robbins and Sahakian2007; Penades et al. Reference Penades, Catalan, Rubia, Andres, Salamero and Gasto2007; Woolley et al. Reference Woolley, Heyman, Brammer, Frampton, McGuire and Rubia2008). To avoid the potential influences of response inhibition, the flanker task was recommended for the analysis of conflict monitoring and adaptation (Larson et al. Reference Larson, Clayson and Clawson2014). Further, most studies focused on high conflict trials (e.g. Ciesielski et al. Reference Ciesielski, Rowland, Harris, Kerwin, Reeve and Knight2011). The present results suggest that alterations in conflict monitoring in OCD depend on current and previous conflict and that sequential conflict adaptation is altered in OCD. Altogether, the present results indicate that OCD patients show hyperactive conflict monitoring as implied by OCD symptoms such as worry about potential harm and errors and intolerance of uncertainty. Together with the robust finding of enhanced ERN amplitudes in OCD (e.g. Endrass & Ullsperger, Reference Endrass and Ullsperger2014) this strengthens hyperactive monitoring as a core dysfunction in OCD.
The examination of sequential trial-by-trial modulations in conflict monitoring allows us to further disentangle the observed hyperactivity in conflict monitoring in OCD. Patients with OCD seem to be more sensitive to newly occurring conflicts than healthy participants (i.e. cI). Moreover, they also show dysfunctional hyperactive monitoring in non-conflicting situations (i.e. cC and iC), where there is no demand for higher recruitment of cognitive control. This might be seen as an unnecessary effort, but could as well be connected to symptoms of distress and doubt (Klawohn et al. Reference Klawohn, Riesel, Grutzmann, Kathmann and Endrass2014), or a high need to avoid potential harm. Further, this parallels and extends results by Endrass et al. (Reference Endrass, Schuermann, Kaufmann, Spielberg, Kniesche and Kathmann2010) indicating that hyperactive error monitoring in OCD cannot be further up-regulated by external demands (Endrass et al. Reference Endrass, Schuermann, Kaufmann, Spielberg, Kniesche and Kathmann2010). Similar to our results, group differences emerged in conditions in which it is not particularly adaptive to strongly monitor one's own actions and in which healthy participants down-regulated their monitoring (Endrass et al. Reference Endrass, Schuermann, Kaufmann, Spielberg, Kniesche and Kathmann2010). In summary, our results suggest that OCD is characterized by hyperactive monitoring that seems to operate more independently of the actual monitoring demands, since it is observed not only in errors and high-conflict trials, but also in compatible trials and correct responses low in conflict.
Beyond this general hyperactivity, OCD patients showed greater trial-by-trial adaptation in response to conflict as reflected in behaviour as well as N2 amplitude. A larger increase (i.e. up-regulation) was observed in compatible trials that follow incompatible ones and a larger decrease (i.e. down-regulation) in incompatible trials that are preceded by incompatible trials. When it is adaptive to recruit more control and invest more resources (i.e. in iI trials), similar monitoring was observed in patients and controls. Hence, in these trials OCD patients even benefit from their generally overactive monitoring, in that they show a stronger conflict adaptation, which leads to a normalization in N2 in iI trials and is accompanied by a more successful behavioural conflict adaptation. These results fit well to conflict monitoring accounts, which state that enhanced conflict processing leads to a stronger recruitment of cognitive control and subsequently to a more effective conflict resolution (Kerns et al. Reference Kerns, Cohen, MacDonald, Cho, Stenger and Carter2004; Kerns, Reference Kerns2006; Carter & van Veen, Reference Carter and van Veen2007). Thus, the enhanced processing of conflict in OCD seems to be associated with a stronger allocation of control and resources to the next trial as reflected by a greater conflict adaptation in N2 and reaction times. Our results are consistent with Ciesielski et al. (Reference Ciesielski, Rowland, Harris, Kerwin, Reeve and Knight2011) who also concluded that OCD patients show enhanced adaptive top-down control and linked that to prefrontal and dorsal anterior cingulate networks. However, our results are in contrast to behavioural results reported by Liu et al. (Reference Liu, Gehring, Weissman, Taylor and Fitzgerald2012) showing reduced post-conflict adaptation in paediatric OCD patients. Although only a direct comparison of same-age groups would allow clarification, possible explanations may relate to differences in task difficulty or patient populations. Liu et al. (Reference Liu, Gehring, Weissman, Taylor and Fitzgerald2012) used a complex multi-source interference task (Bush & Shin, Reference Bush and Shin2006) that elicits high levels of conflict and longer reaction times were observed than in the current task, possibly diminishing the currently observed greater conflict adjustment effects. Alternatively, conflict processing and adjustment may differ between patients with childhood v. adult onset of OCD similar to results for the ERN that suggest that the relationship between the ERN and anxiety changes as a function of age (Meyer et al. Reference Meyer, Weinberg, Klein and Hajcak2011). In conclusion, our results suggest that hyperactive conflict monitoring in adult patients with OCD seemed to be beneficial in situations that include a high amount of conflict and require the recruitment of control to resolve conflict. However, this is associated with a stronger monitoring in non-conflicting situations which may be related to more effort and higher employment of resources. This parallels symptoms of OCD such as compulsions that often aim to reduce rare negative consequences and may even reduce risk to some extent (e.g. washing hands reduces the risk for infections), but at the costs of daily functioning and enhanced distress.
Limitations of the current study are that patients taking psychotropic medication and with co-morbidities were included. However, post-hoc analyses showed that results were not affected by medication or co-morbidity. Moreover, the large sample size and the inclusion of a naturalistic, heterogeneous patient sample allows the analysis of co-morbidities and medication effects with sufficient power and, thus, represents a strength of this study. Another important avenue for future studies should be the analysis of lateralized readiness potentials in the context of conflict adaptation in clinical groups. This would allow us to further disentangle effects of conflict processing from those of motor preparation and motor inhibition, processes that might add to differences in conflict adaptation in patients with OCD as well.
Overall, the current study supports that OCD patients are characterized by a hyperactive monitoring system that is not adapted (i.e. down-regulated) in unambiguous, non-conflicting situations. This may be related to OCD symptoms such as doubt and the higher need to avoid harm and control actions and thoughts. The present results further suggest benefits in conflicting situations that occur in the context of conflict as reflected by an enhanced conflict adaptation in OCD patients, both in EEG and behaviour. This stronger conflict adaptation has been linked to an enhanced recruitment of top-down cognitive control (Kerns et al. Reference Kerns, Cohen, MacDonald, Cho, Stenger and Carter2004; Kerns, Reference Kerns2006; Carter & van Veen, Reference Carter and van Veen2007; Ciesielski et al. Reference Ciesielski, Rowland, Harris, Kerwin, Reeve and Knight2011) triggered by an enhanced conflict monitoring.
Acknowledgements
A.R. received funding from a predoctoral fellowship (Else-Neumann-Scholarship). The authors thank Thomas Pinkpank and Rainer Kniesche for their technical support and Ulrike Bunzenthal, Lea Auerbach, Anika Momberg and Carolin Stoppe for their help in data collection.