Introduction
As a new type of energy storage device, supercapacitors have drawn more and more attention for their considerably high-power density, high specific capacitance, and long-life cycle.[Reference Liu, Zhang, Wang, Wen and Wu1–Reference Augustyn, Simon and Dunn4] Electrode materials have a decisive influence on the electrochemical performance of supercapacitors.[Reference Chang, Zhai, Sun, Gu, Dong and Yin5–Reference Liu7] Therefore, researchers are trying to discover supercapacitor electrodes materials with excellent performance to expand the application value of supercapacitors. Generally, on the basis of the energy storage mechanism, supercapacitors are divided into electrical double layer supercapacitors (EDLC) and pseudo-supercapacitors. Carbon materials have been the main active electrode materials of the electrical double layer supercapacitor, because of their low cost, facile synthesis, large specific surface area, and excellent cycle performance.[Reference Balducci, Dugas, Taberna, Simon, Plee, Mastragostino and Passerini8–Reference Zhang and Zhao10]
As a conjugated polymer, g-C3N4 has the graphite-like structure[Reference Hu, Ouyang, Guo, Lin, Jiang, Qiu and Chen11] in which the layers are stacked by van der Waals forces. Graphitic C3N4 is possible to be an EDLC electrode material for its unique structure. In addition, g-C3N4 has industrial production feasibility due to its low cost and facile synthesis.[Reference Wu, Chen, Yan, Ren, Dai, Wang, Pan, Wang and Cheng12] As a structurally stable polymer, g-C3N4 presents remarkable thermal stability, chemical stability, and large theoretical specific surface area, which is remarkably attractive for supercapacitors. Moreover, the high N element content of g-C3N4 effectively improves its wettability. More and more efforts have been put into improving the electrochemical performance of g-C3N4 electrode material. Tahir et al.[Reference Tahir, Cao, Butt, Idrees, Mahmood, Ali, Aslam, Tanveer, Rizwan and Mahmood13] prepared one-dimensional (1D) tubular g-C3N4 through thermal polymerization melamine precursors pretreated with HNO3. Its specific capacity reached 233 F/g at the current density of 0.2 A/g and after 1000 cycles its specific capacity remained 90%. Compounding g-C3N4 with a material with high conductivity and large specific surface area can improve its electrochemical performance. Chen et al.[Reference Chen, Zhao, Huang, Chen and Qu14] synthesized a 3D structure of g-C3N4@graphene composite by a simple one-step hydrothermal process. The result displays that g-C3N4@graphene composite has a specific capacitance of 264 F/g, while it also has sensational cycle stability. There is evidence that addition of Ag nanoparticles (AgNPs) can improve the electrochemical performance of electrode materials[Reference Xia, Hong, Shi, Li, Yuan, Yao and Xie15, Reference Cho, Chang-Jian, Lee, Huang, Ho, Liu and Hsiao16] due to its excellent electrical conductivity, low cost, and high thermal stability.[Reference Sawangphruk, Suksomboon, Kongsupornsak, Khuntilo, Srimuk, Sanguansak, Klunbud, Suktha and Chiochan17, Reference Dhibar and Das18] Guo et al.[Reference Guo, Guan, Dai, Mu, Che, Wang, Zhang, Zhang and Zhang19] synthesized 1D AgNPs/MnO2 nanorod composite by combining a simple solvothermal method with a rapid in-situ reduction method. The specific capacitance reaches 314 F/g at a current density of 2 A/g due to its high electrical conductivity which is much higher than that of MnO2 nanorod monomers. In addition, the composite exhibited excellent cycling stability (91% maintained after 1000 cycles).
In this work, Ag-containing sol was successfully prepared by reduction method and then AgNPs@g-C3N4 composite was synthesized from Ag-containing sol and g-C3N4 powder by the ultrasonic-assisted self-assembly method. The enhancement of conductivity is expected to improve its electrochemical performance. The results show that the composite is a potential supercapacitors electrode material.
Experimental part
Synthesis of g-C3N4 powder
The g-C3N4 powder was obtained by a simple calcination of dicyanodiamine. In short, 5.0013 g dicyanodiamine was heated at 550 °C for 4 h with a heating rate of 5 °C/min. Later, it was naturally cooled down to the room temperature, the resulting powder was sufficiently ground in a mortar.
Synthesis of Ag-containing sol
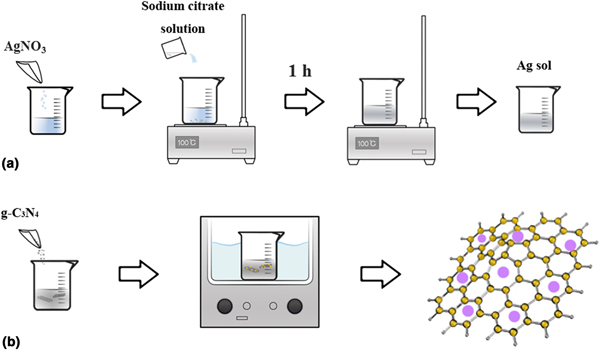
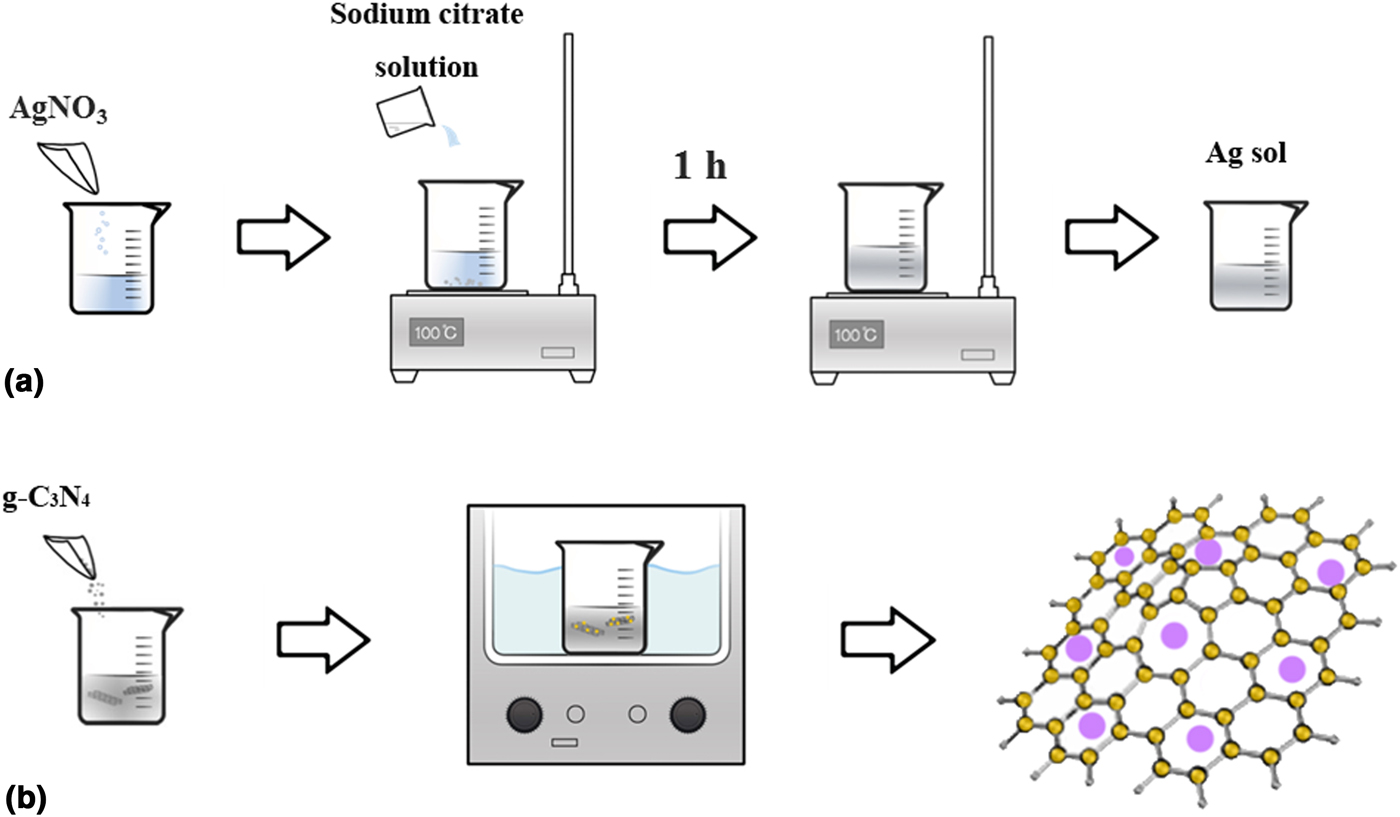
For the synthesis of AgNPs@g-C3N4 composites, Ag-containing sol was prepared at first. AgNO3 (90 mg) was dissolved in 500 mL deionized water. The suspension was heated to boiling and kept stirring during this process. Then, 10 mL 1% sodium citrate solution was added and kept boiling for 1 h. The entire heating process was performed under dark conditions to avoid deterioration of the silver substance. After naturally cooled down to room temperature, the Ag-containing sol was obtained.
Synthesis of AgNPs@g-C3N4 composites
Graphitic C3N4 (1.0130 g) powder was used as a matrix. Ag-containing sol (50 mL) and light blue CuSO4 solution (3 mL) was added. After sonicated for 48 h, the solution was centrifuged three times with deionized water and ethanol at a rate of 8000 rpm. Then, the obtained precipitate was dried in a vacuum oven. Finally, the dried precipitate was put into a grinding medium and sufficiently ground to obtain AgNPs@g-C3N4 powder. The preparation process of Ag-containing sol and AgNPs@g-C3N4 composite is shown in Fig. 1.
Schematic illustration of the synthesis procedure for Ag nanoparticles sol (a) and AgNPs@g-C3N4 composite (b).
Characterizations
X-ray diffraction (XRD) was carried out by using a D8 advance (Bruker-AXS) diffractometer. The structures of the samples were determined by Fourier transform infrared spectroscopy (FTIR). The specific surface area of samples was examined by Brunauer–Emmett–Teller (BET). The morphologies of the samples were determined by a JEM 2100 transmission electron microscope (TEM) and a JEOL JSM-7001 field emission scanning electron microscopy (SEM).
The as-prepared samples were investigated as a working electrode material. The working electrode was made as follows: first of all, the nickel foam was cut into 1 cm × 5 cm rectangles. After removing impurities and oxide films on the surface of the foamed nickel, it was dried in a vacuum oven for 12 h. The working electrode was obtained by spreading the electrode material on the nickel foam. The electrode material was prepared by mixing active materials, conductive acetylene black and polyvinylidene fluoride with a mass ratio of 75:15:10.
The electrochemical properties were tested using a CHI 760E electrochemical workstation. A conventional three-electrode system was used containing Pt wire as counter, the samples-based electrode as a working electrode and a calomel electrode as a reference electrode. The electrolyte used was a 1 M Na2SO4 solution. Cyclic voltammetry (CV) tests, galvanostatic charge and discharge (GCD) tests, alternating current impedance tests, and cyclic performance tests were performed on electrochemical workstations. The evaluation formula for specific capacitance is C s = IΔt/mΔV, where C s (F/g) represents the specific capacitance; I (A) is the discharge current; Δt (s) is the discharge time; m (g) is the mass of the active material; ΔV (V) represents the potential window.
Results and discussion
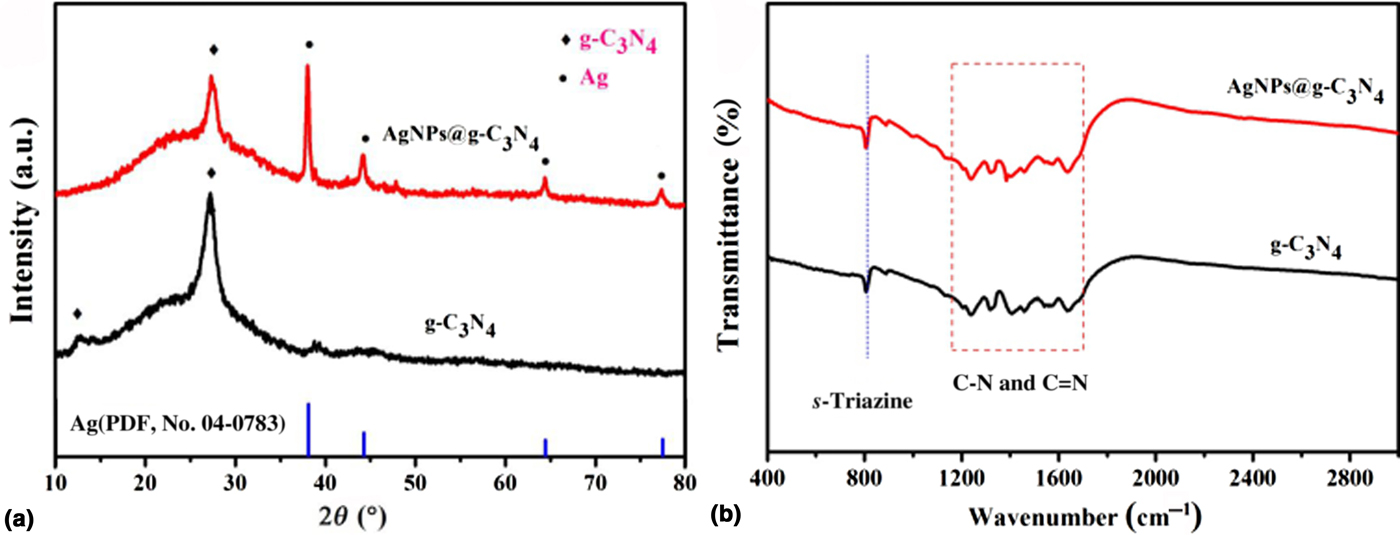
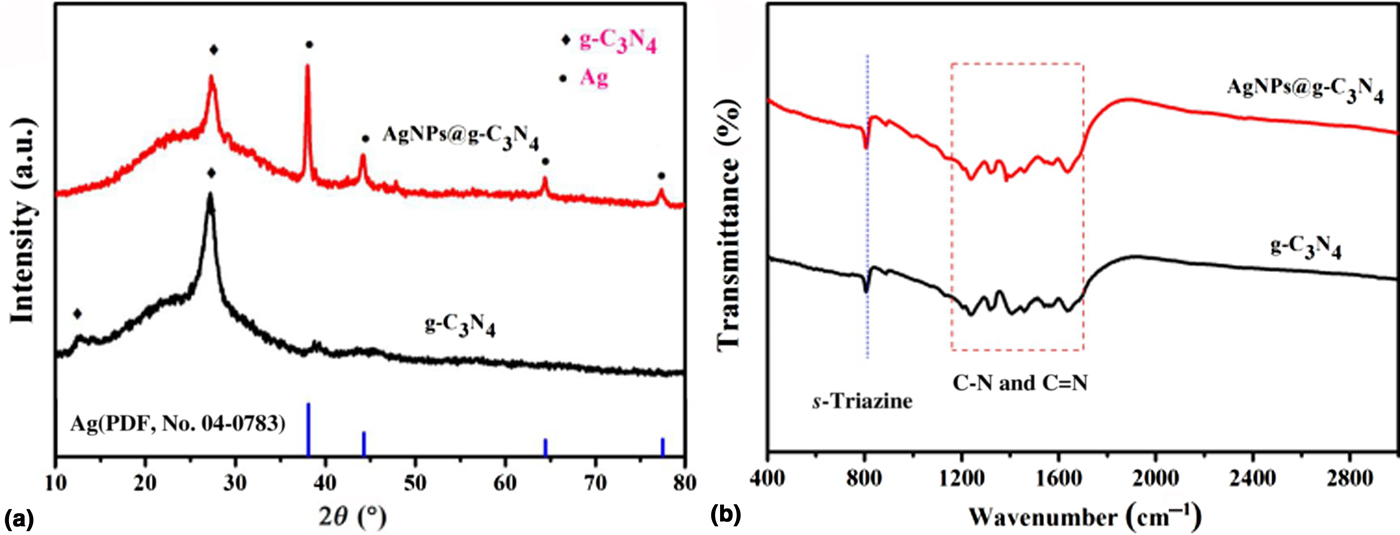
Figure 2 is the XRD pattern and FTIR spectra of g-C3N4 monomer and AgNPs@g-C3N4 composites. As shown in Fig. 2(a), g-C3N4 monomer has strong XRD peak at 27.3° and the weak peak at 13.0°, which are respectively corresponding to the stacking of the conjugated aromatic systems and interlayer stacking of g-C3N4. AgNPs@g-C3N4 composites have the strong XRD peak at 27.3°, demonstrating the existence of g-C3N4 in the composites. However, the weak peak at 13.1° is too weak to observe in the composite material. In addition, XRD pattern of AgNPs@g-C3N4 composites has strong diffraction peaks at 38.1°, 44.3°, 64.5°, and 77.4°, which are corresponding to the (111), (200), (220), and (311) planes of the Ag, respectively (PDF, No. 04-0783). There are no other diffraction peaks, which prove that the sample is pure. Figure 2(b) is FTIR spectra of g-C3N4 monomers and AgNPs@g-C3N4 composites. As shown in Fig. 2(b), g-C3N4 monomers and AgNPs@g-C3N4 composites have similar spectral shapes. The typical peaks at 811 cm−1 denote to the stretching vibrations of the triazine ring and the typical peak at the range of 1236–1635 cm−1 corresponds to C-N and the C = N stretching vibrations in C-N aromatic ring.
(a) XRD patterns and (b) FTIR spectra of g-C3N4 and AgNPs@g-C3N4 composite.
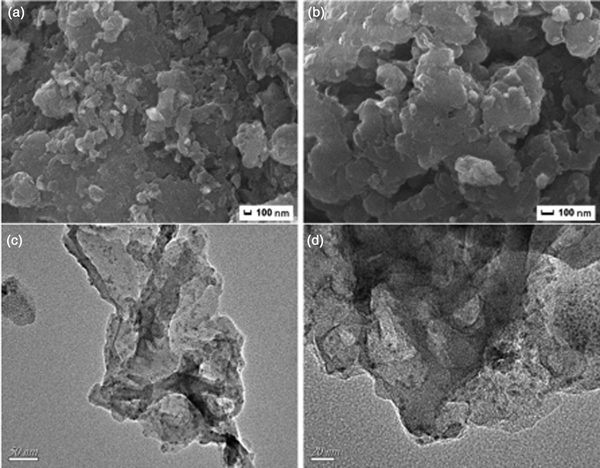
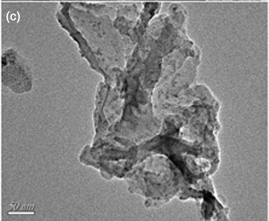
The micro-morphology of composites was characterized by SEM and TEM. The SEM images of AgNPs@g-C3N4 composites are shown in Figs. 3(a) and 3(b). It shows that a small amount of Ag nanoparticles is attached to the surface of the g-C3N4. Ag nanoparticles have so small size that we have to further characterize the composite by TEM. Figures 3(c) and 3(d) are TEM images of AgNPs@g-C3N4 composite. As shown in Figs. 3(c) and 3(d), Ag nanoparticles are evenly distributed on the surface of g-C3N4 with the size of about 5 nm.
(a) and (b): SEM images of AgNPs@g-C3N4 composite; (c) and (d): TEM images of AgNPs@g-C3N4 composite.

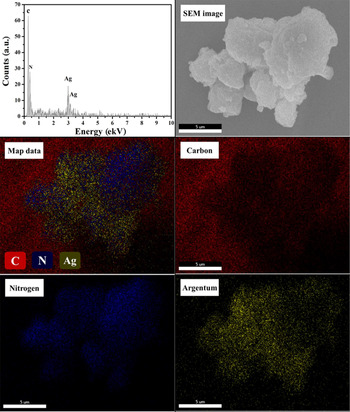
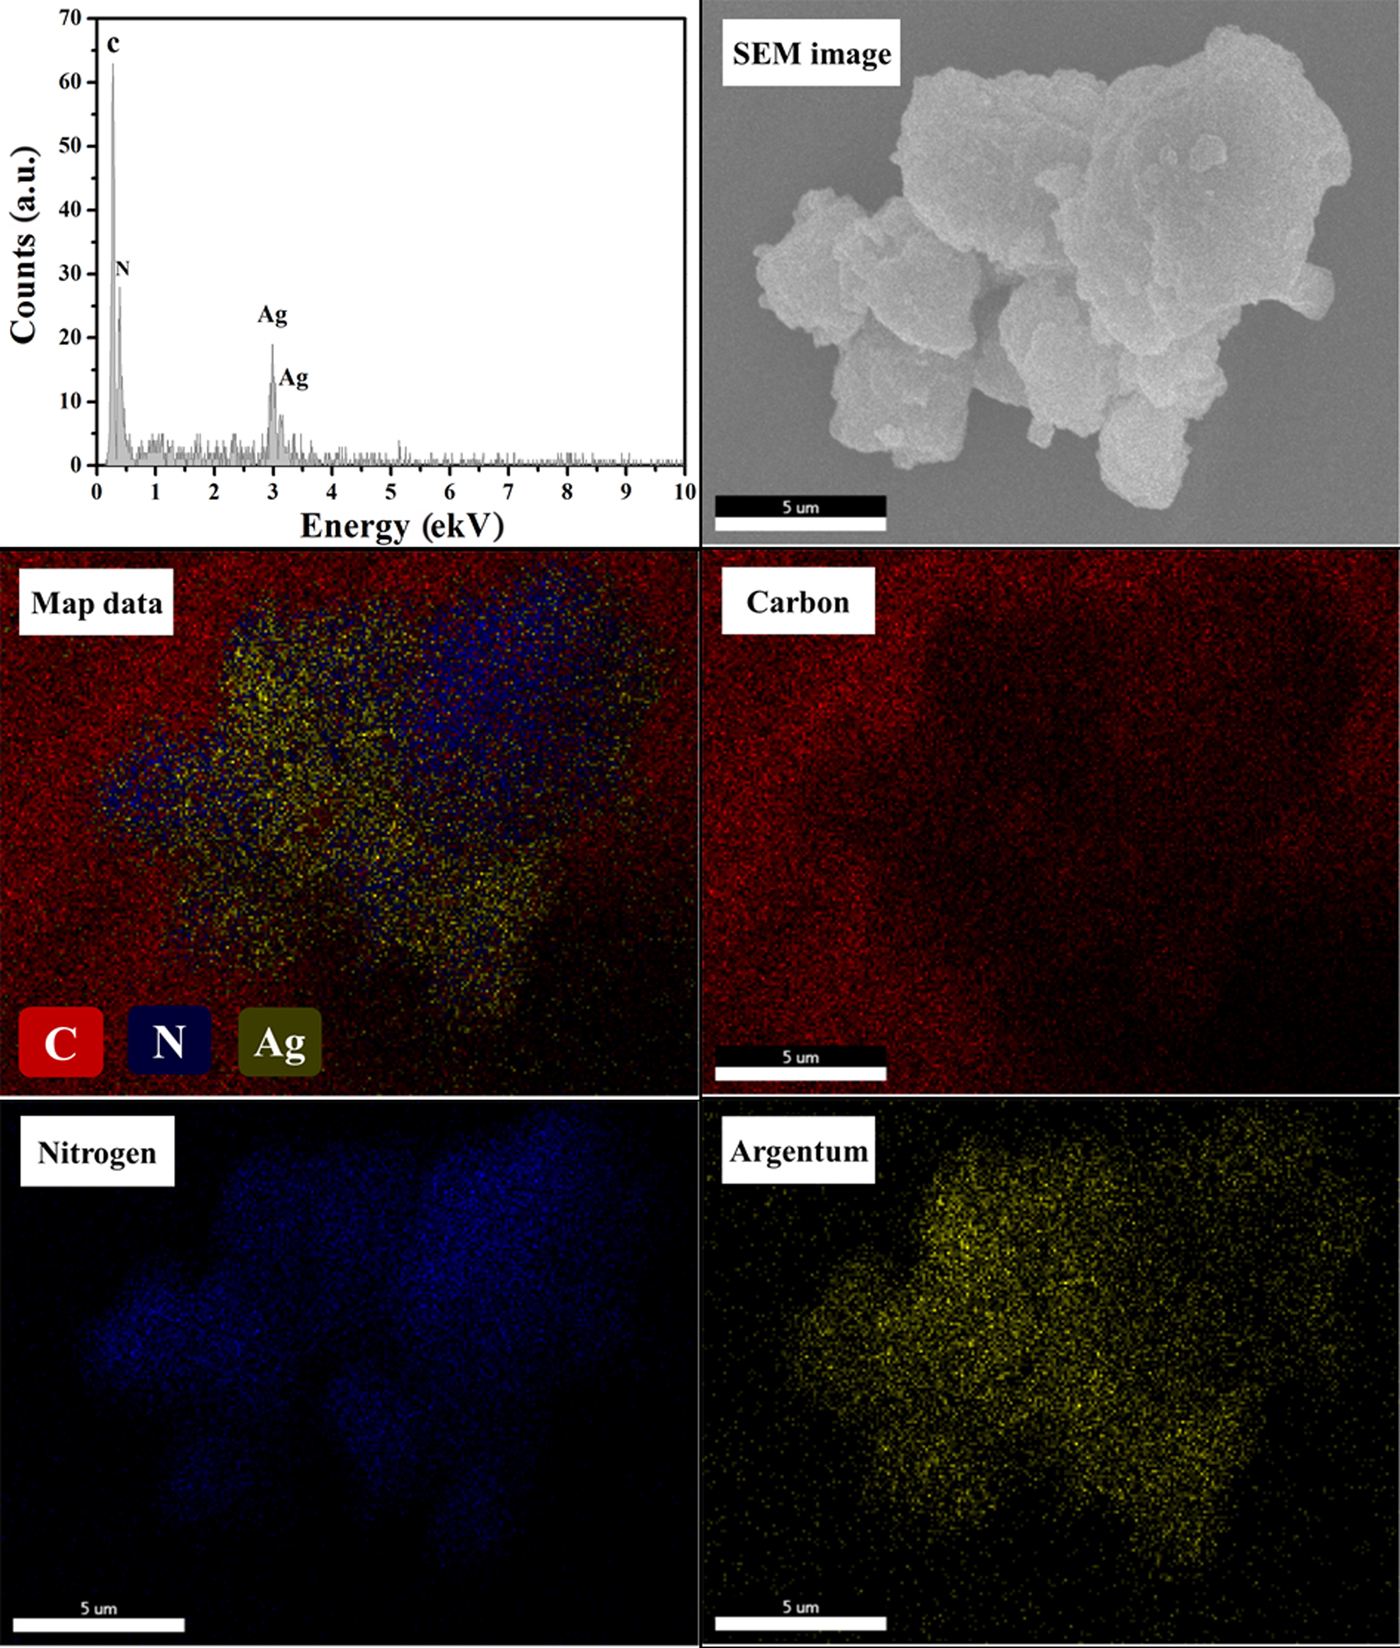
Figure 4 shows the EDX spectrum of AgNPs@g-C3N4 composites and the mapping images of each element. Element types and the distribution of elements are shown. The EDX spectrum shows that there are only three elements, C, N, and Ag, respectively. From the mapping images of composite materials, it can be seen that C, N, and Ag are uniformly distributed in the composite material. This confirms that the samples are consisting of only two substances, g-C3N4 and Ag.
EDX spectrum and EDX mapping of Ag, C, and N obtained from AgNPs@g-C3N4.
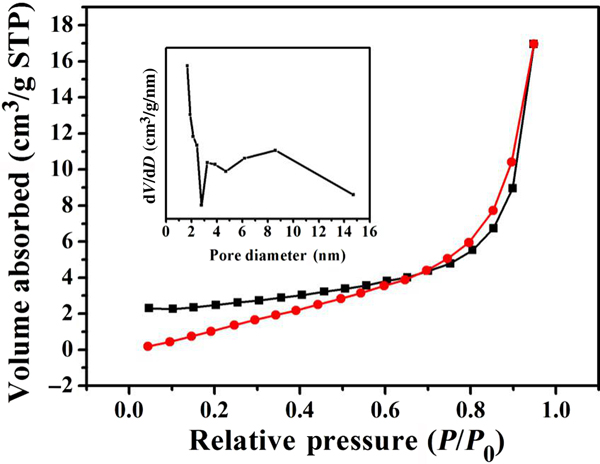
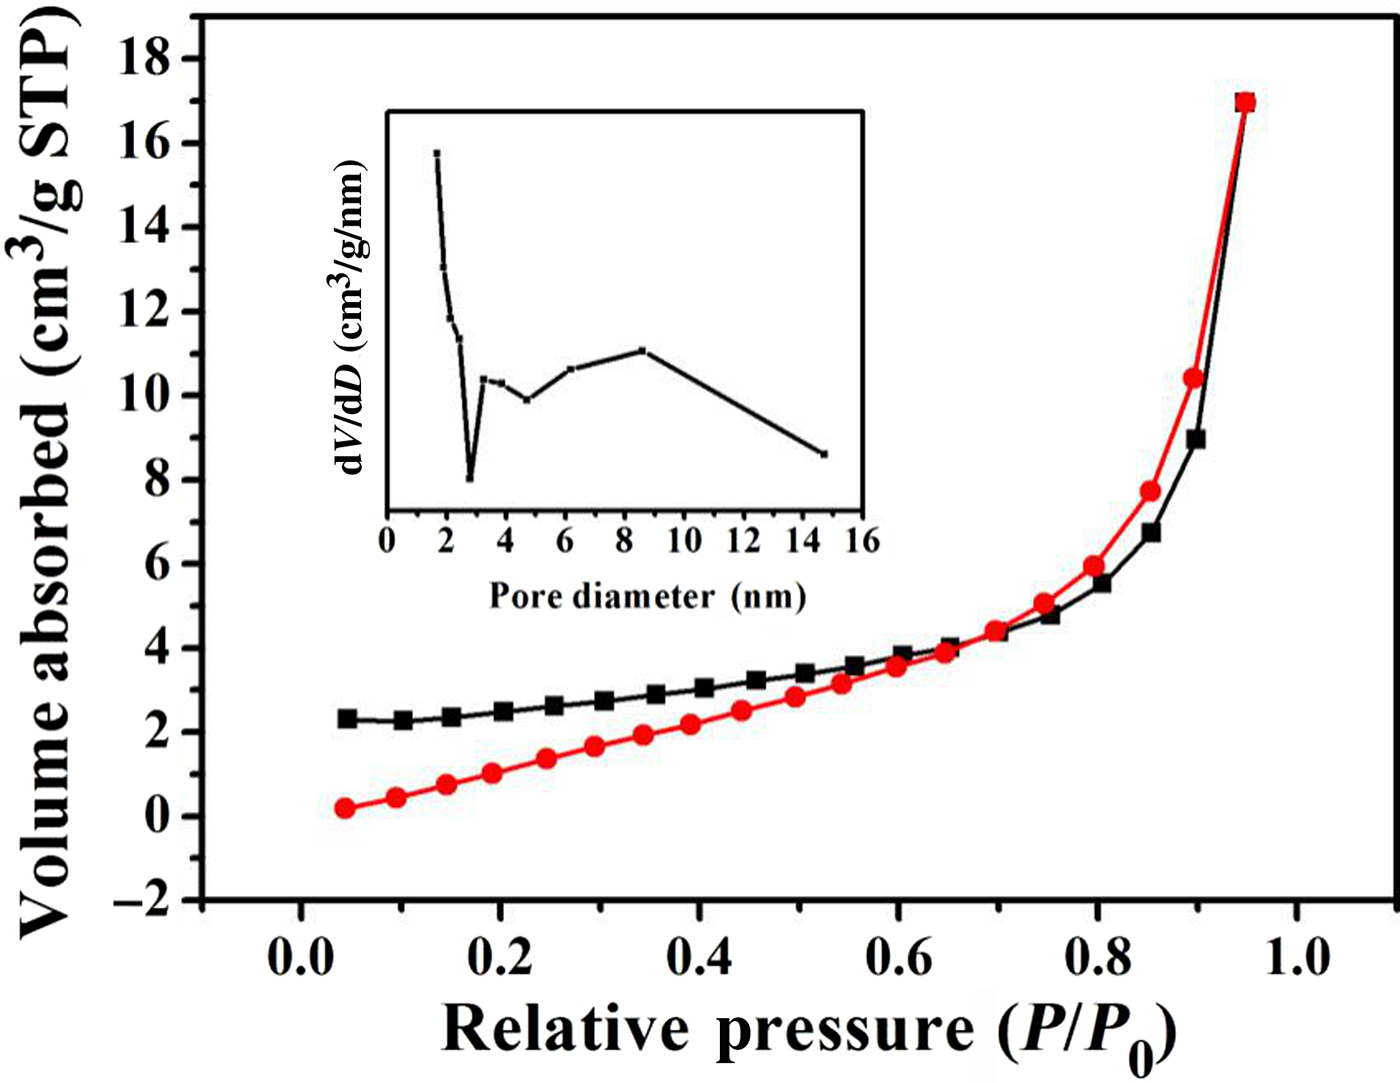
To characterize the specific surface area and pore size distribution of the materials, the nitrogen adsorption-desorption of the g-C3N4 and AgNPs@g-C3N4 were carried on. Figure 5 shows N2 adsorption-desorption isotherms and pore size distribution curves for AgNPs@g-C3N4. As shown in Fig. 5, the N2 adsorption-desorption isotherm of the sample belongs to the IV curve and the hysteresis can be observed at the same time, confirming that mesoporous structure in the materials. The specific surface area of the composite (8.953 m2/g) increases a little, comparing to that of the g-C3N4 monomer (8.605 m2/g). From the pore size distribution curve (inset) of composites, it can be seen that there are three peaks in the composite, corresponding to the pore size of 1.64, 3.26, and 8.65 nm, respectively. The strongest peak is related to the most pore diameters (1.64 nm). The hierarchical mesoporous structure will be favorable for different sizes of electrolyte ions contacting with the surface of the electrode material and improving the surface utilization rate of the composite, thus contribute to improving the electrochemical performance of the composite. The large specific surface area and the hierarchical mesoporous structure provide the conditions for improving the electrochemical properties of the materials.
Nitrogen adsorption–desorption isotherms and pore size distribution curves (inset) of AgNPs@g-C3N4.
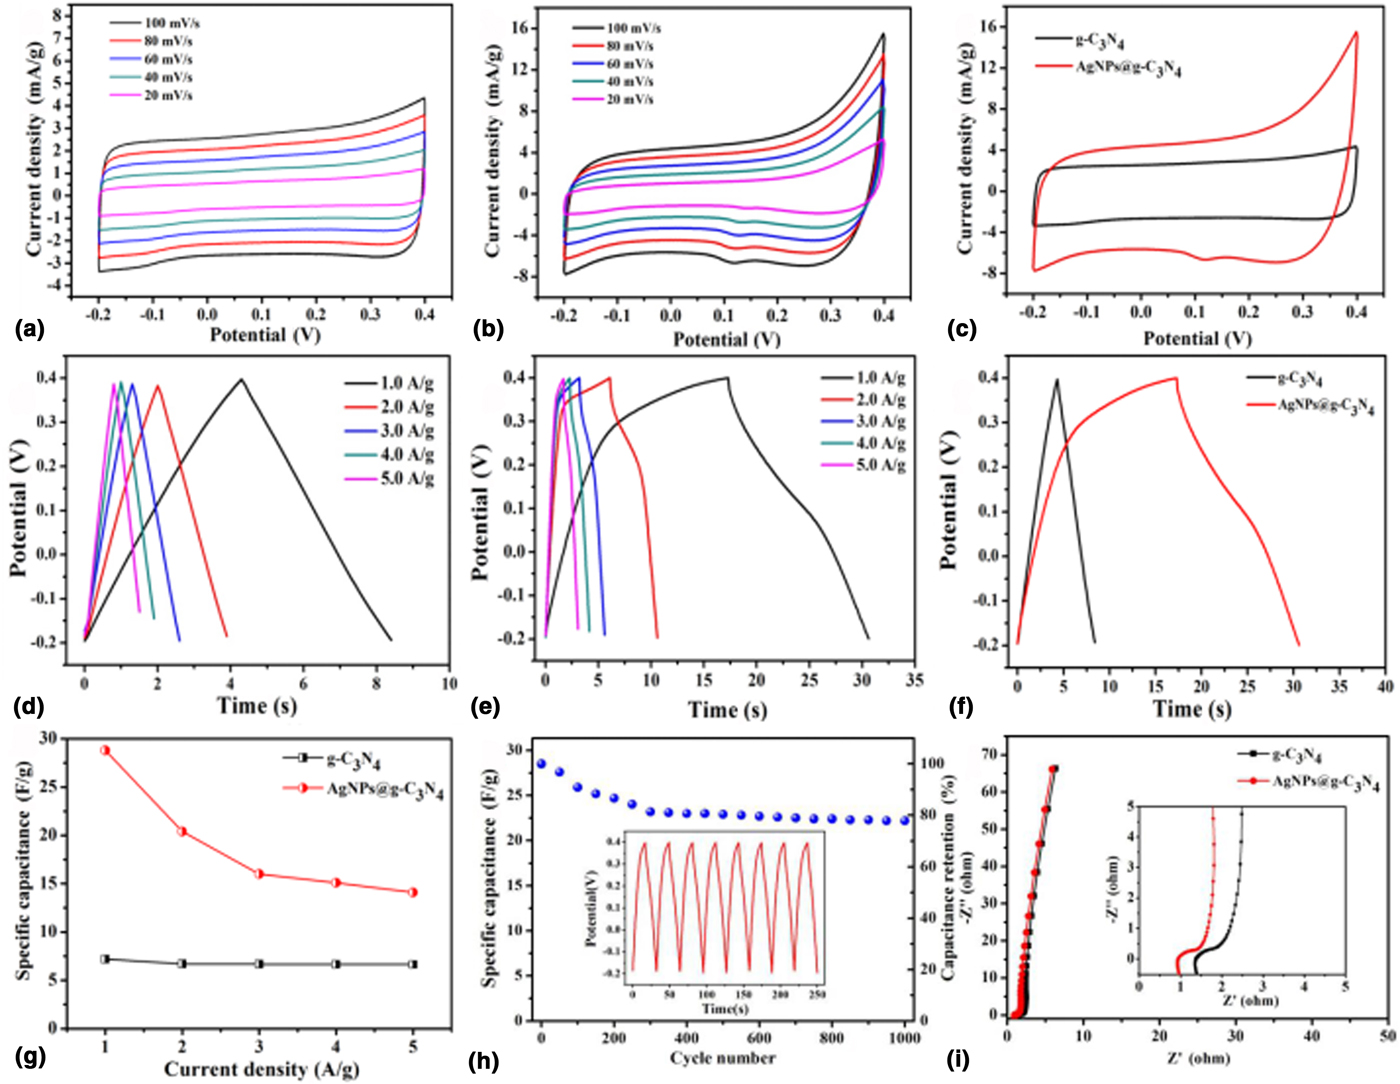
In order to investigate the electrochemical properties of g-C3N4 and AgNPs@g-C3N4 composite as supercapacitor electrode materials, CV measurements at different scan rates from 20 to 100 mV/s were carried out at first [Figs. 6(a) and 6(b)]. The CV curves of the two materials are quasi-rectangles, meaning that the two materials have good double layer capacitance behavior. CV curve of AgNPs@g-C3N4 composite has redox peaks which can be ascribed to the faradaic redox reactions. As the increase of scanning rate, the area of the closed curve and the current value increase. Comparing the CV curves of the two materials at a scan rate of 100 mV/s [Fig. 6(c)], the difference in CV performance can be observed visually. The curve integrated area of AgNPs@g-C3N4 composites was significantly larger than that of g-C3N4 monomer, indicating that the composites have higher specific capacitance values. It initially proves that the material has better capacitance performance after introducing Ag nanoparticles.
CV spectra of (a) g-C3N4 and (b) AgNPs@g-C3N4 composite at different scan rates; (c) CV spectra of g-C3N4 and AgNPs@g-C3N4 composite at a scan rate of 100 mV/s. GCD spectra of (d) g-C3N4 and (e) AgNPs@g-C3N4 composite at different current densities; (f) GCD spectra of g-C3N4 and AgNPs@g-C3N4 composite at current density of 1.0 A/g; (g) Specific capacities of g-C3N4 and AgNPs@g-C3N4 composite at different current densities. (h) Variation curve of capacitance with cycle number at 1.0 A/g of AgNPs@g-C3N4 composite. (i) Electrochemical impedance spectra (EIS) of g-C3N4 and AgNPs@g-C3N4 composite.
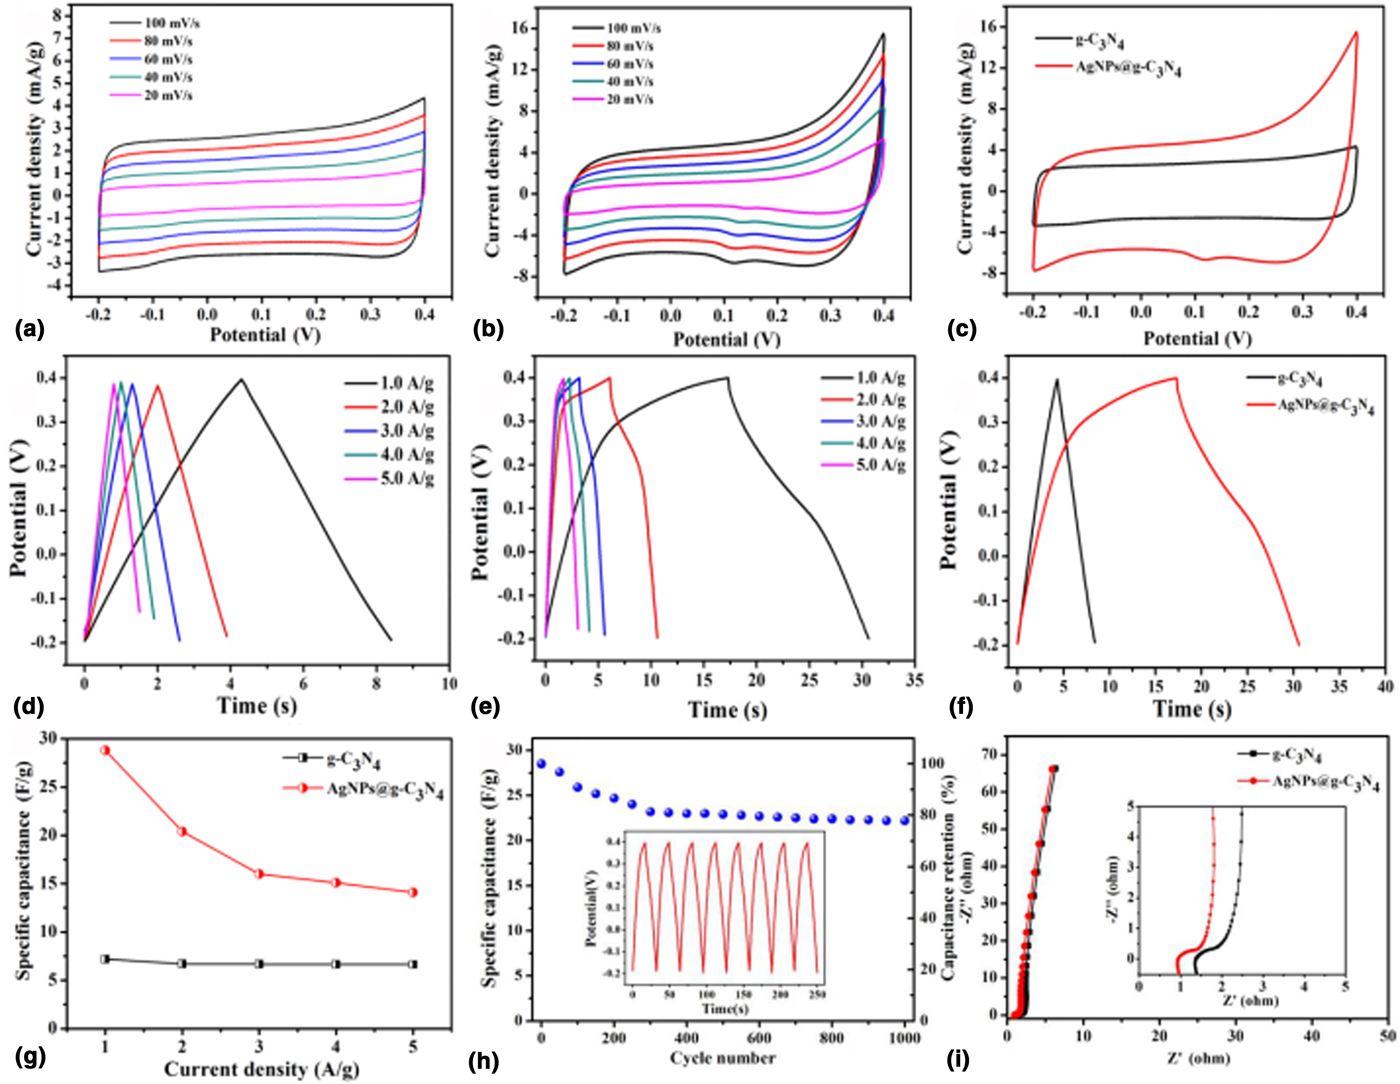
To further evaluate the electrochemical properties of the materials, the GCD of g-C3N4 and AgNPs@g-C3N4 composite are conducted. Figures 6(d) and 6(e) are GCD curves of g-C3N4 and AgNPs@g-C3N4 composite at current densities from 1.0 to 5.0 A/g. The GCD curves of g-C3N4 monomer are symmetrical triangular shapes, while that of AgNPs@g-C3N4 composite has charging platform. Presence of fradaic psedocapacitance in composite is further verified. Comparing the GCD curves of the two materials at a current density of 1.0 A/g [Fig. 6(f)], the charge and discharge time of the AgNPs@g-C3N4 composite is longer than those of g-C3N4. It illustrates that the capacitance value of composite compared with that of g-C3N4 is significantly improved. According to the GCD curves of the two materials, the corresponding specific capacitance values are calculated [Fig. 6(g)]. At current densities from 1.0 to 5.0 A/g, the capacitances of the AgNPs@g-C3N4 composites were 28.8, 20.4, 16.0, 15.1, and 14.1 F/g, respectively. As compared with g-C3N4 monomer, the specific capacitance of the composite increases 3 times. It illustrates that the electrochemical properties of the material have been significantly improved after introducing Ag nanoparticles.
The cycle stability is very important for electrode materials. Figure 6(h) shows charge and discharge curves of the AgNPs@g-C3N4 composite at a current density of 1.0 A/g. As shown in Fig. 6(h), the specific capacity of the material still remained at 78.9% after 1000 cycles. It means that the composite has well cycle stability performance.
Figure 6(i) shows the Nyquist plots of supercapacitors based on g-C3N4 and AgNPs@g-C3N4 composite. The impedance of materials is the main factor restricting the specific power of the supercapacitors.[Reference Chen, Dai, Wang, Wang, Wang, Cheng and Yan20] The impedance could be expressed by equivalent series resistance, which mainly contains the internal resistance (R s) and the charge transform resistance (R ct).[Reference Zhao, Xu, Huang, Bao, Qiu, Lian, Xu, Huang, Xu and Li21] The R s of g-C3N4 and AgNPs@g-C3N4 are 1.40 and 0.96 Ω, respectively. It indicates that the introduction of Ag nanoparticles can significantly reduce R s. At the same time, the R ct of the AgNPs@g-C3N4 composite (0.46 Ω) is reduced with respect to g-C3N4 (0.77 Ω). The conductivity of AgNPs@g-C3N4 composites is obviously better than that of g-C3N4 monomers. Higher conductivity is good for the transfer of electrons and promoting the electrochemical performance of the material.
Conclusion
In summary, we have prepared Ag-containing sols by reduction method and thus prepared AgNPs@g-C3N4 composite by the ultrasonic-assisted self-assembly of Ag-containing sols and g-C3N4. The obtained AgNPs@g-C3N4 composite has a hierarchical pore size distribution. The Ag nanoparticles with a size of about 5 nm are successfully adhered on the g-C3N4 surface, and uniformly distributed on the surface of g-C3N4. The specific capacitance of AgNPs@g-C3N4 composite is 4 times better than that of g-C3N4. The improvement of the electrochemical performance of AgNPs@g-C3N4 composites can be attributed to the following two aspects: (a) the specific surface area of the composite compared to that of the g-C3N4 monomer has been increased. (b) The introducing of Ag nanoparticles significantly increases the conductivity and promotes the transfer of electrons. The above results provide new ideas for improving the application of g-C3N4 as an electrode material for supercapacitors.
Acknowledgments
This work is supported by Six Talents Peak Project in Jiangsu Province (2011-ZBZZ045), Jiangsu Province Ordinary University Graduate Student Innovation Project (17A037), Key R & D Program of Zhenjiang (GY 2018016).