


As crass as it may sound, Americans value some people more than others. In politics, this tendency is probably most obvious in the realm of international affairs. In his inaugural address, Donald Trump celebrated “the right of all nations to put their own interests first.”Footnote 1 On trade policy, in particular, he denounced “the ravages of other countries, making our products, stealing our companies, and destroying our jobs.” Trump referred to trade deals as the ”raping” of the United States by other countries, benefitting trading partner countries while exploiting Americans.Footnote 2 This perspective glorifies the idea of favoring one’s fellow Americans over the citizens of other countries. The “America First” argument encourages Americans to value the well-being of distant others less than those closer to home. Differential valuation may explain why people do not always support the policy option that produces the greatest collective benefits. Further, how people simultaneously weigh the costs and benefits of trade for their own country and for trading partner countries is rooted in their views of competition.
Burgeoning research on how individuals form trade preferences suggests that “sociotropic” trade perceptions, that is, perceptions of how the country as a whole is affected by trade, parallel the political impact of sociotropic economic perceptions. In both cases, perceptions of how the nation as a whole is affected tend to be more closely linked to policy preferences than are perceptions of people’s own pocketbooks (Mansfield and Mutz Reference Mansfield and Mutz2009; Rho and Tomz Reference Rho and Tomz2017; see Kuo and Naoi Reference Kuo, Naoi and Martin2015 for a review).Footnote 3 Importantly, sociotropic effects are not posited to be preferences rooted in altruistic motives, although they are commonly misinterpreted as such (Kinder and Kiewiet Reference Kinder and Kiewiet1981).Footnote 4 Sociotropic perceptions are more important to policy preferences because citizens find it easier to connect national conditions to government policy than to connect policy to their own life circumstances. The events of day-to-day life tend to be “morselized”—that is, they are not seen as part of a larger pattern that lends them political significance (Lane Reference Lane1962). In contrast, trade preferences are heavily influenced by whether citizens think trade has positive or negative consequences for the nation as a whole (Mansfield and Mutz Reference Mansfield and Mutz2009; Mutz and Kim Reference Mutz and Kim2017).
In contrast to economists’ focus on self-interest, psychologists generally assume that social motivations trump self-interested ones. For example, when faced with social dilemmas, people often cooperate even when they have no incentive to do so (Caporael et al. Reference Caporael, Dawes, Orbell and Kragt1989). Evolutionary psychology emphasizes the importance of cooperation with others as a survival skill. Empathy makes people want to alleviate others’ suffering; however, when others are out-group members, they may not be motivated to do so (Batson and Ahmad Reference Batson and Ahmad2009; Cikara, Bruneau, and Saxe Reference Cikara, Bruneau and Saxe2011). Although one would expect cooperation with out-group members to be less common than with in-group members, in some circumstances, people care about the well-being of outsiders and include them in their “scope of moral concern” (Caporael et al. Reference Caporael, Dawes, Orbell and Kragt1989). This perspective raises the possibility that people also may take into account the effects of trade policies on those in other countries. Research on sociotropic effects has focused on how trade preferences are influenced by the perceived effects of trade on the well-being of the home country (e.g., Mansfield and Mutz Reference Mansfield and Mutz2009). In this study, we posit that the consequences of trade for trading partner countries also factor into people’s trade preferences, but to varying degrees depending upon whether trade is viewed as competitive and on their predispositions toward competition.
Whether viewed as competition or cooperation, trade involves trade-offs that pose moral dilemmas. People may weigh its benefits and drawbacks from more than just a collective national perspective, thus complicating the calculus underlying their preferences. Trade generates collective benefits, but it also harms some individuals. A pro-trade stance might serve the greater good, but it is not easy for people to advocate policies that may hurt others, particularly members of their own national in-group. Our theoretical model explains why some Americans and Canadians judge trade to be worth engaging in nonetheless. Preferences are not just sociotropic with respect to effects within one’s own country; perceptions of how the trading partner country is affected by trade policy also matter predictably, but in less obvious ways. To economists, it is self-evident that engaging in trade is a cooperative act (Alston, Kearl, and Vaughan Reference Alston, Kearl and Vaughan1992); to the mass public, this is less clear (Rubin Reference Rubin2014). Instead, trade is frequently said to be a policy that creates “winners and losers.” When economists refer to trade in this fashion, they are typically referring to winners and losers within a single country. For example, in the US, businesses and industries that export products generally benefit, as do employees in those lines of work. But other industries that cannot compete in the global marketplace may go out of business, thus creating unemployment in those lines of work.
In contrast, when the public at large thinks about “winners and losers” due to trade, they may think of it as a competitive sports event involving the US and a trading partner country, a contest in which a winner and a loser must ultimately emerge. Further, because many Americans think of trade as a zero-sum game (Mutz and Kim Reference Mutz and Kim2017), it seems logical to some that if our trading partners are gaining jobs due to trade, our own country must be losing them.
Introductory textbooks on economics mention competition eight times more often than cooperation, thus encouraging a competition-oriented understanding of trade (Rubin Reference Rubin2014). This competitive framing may be responsible for many of trade’s negative connotations. Whereas cooperation sounds highly moral and laudatory, and implies a win-win situation, a policy rooted in competition sounds to many like a dog-eat-dog, cut-throat situation that results in one group dominating another (Rubin Reference Rubin2014). This remains a seemingly intuitive understanding held by many ordinary people.
In the US, the sociotropic consequences of trade are viewed first and foremost in terms of how they affect job availability in the home country (Hiscox Reference Hiscox2006; Slaughter Reference Slaughter1999). We know little, however, about whether trade’s perceived effects on the availability of jobs in other countries also matter. Most importantly, how do beliefs about the benefits and desirability of competition interact with perceptions of trade as cooperative or competitive? We expect that competitive attitudes and viewing trade in competitive terms will both discourage consideration of the other country’s well-being and encourage differential valuation of the home country’s well-being relative to the trading partner country’s well-being. In other words, competition should discourage people from taking trade’s effects on trading partner countries into account. In this study, we contribute to knowledge on the psychological bases of individual trade preferences by evaluating the role of sociotropic perceptions of both the home country and trading partner countries under varying conditions of competitiveness.
Previous studies have addressed some closely related research questions. For example, one experimental study asked respondents about allowing imports from a foreign firm, named to suggest it was either culturally familiar or ambiguously foreign. Sabet (Reference Sabet2013) found that respondents high in social dominance orientation responded more negatively to allowing imports from a foreign-sounding firm. In the context of trade, Mutz and Kim (Reference Mutz and Kim2017) found in-group favoritism to be exacerbated by high levels of nationalism; moreover, those with high levels of social dominance orientation were concerned about relative as opposed to absolute home country gains in jobs. In other words, these people viewed trade as an international competition. Additional studies have experimentally examined the effects of the distributional consequences of trade by informing people about groups who are helped or hurt by trade (Herrmann, Tetlock, and Diascro Reference Herrmann, Tetlock and Diascro2001; Rho and Tomz Reference Rho and Tomz2017). However, in these studies, the in-groups and out-groups are both groups inside the US rather than foreign out-groups. Mansfield, Mutz, and Silver (Reference Mansfield, Mutz and Silver2015) suggested that differences in orientations toward competition lead men and women to form trade preferences on different bases. Because their data was observational, they were limited in the strength of causal argument they could make for competitive orientations. Nonetheless, since variations in competitiveness obviously occur within both gender groups, competition’s role could extend beyond this purpose.
Ethnocentric Valuation and Moral Exclusion
Differences in levels of trade support are in part a function of two processes that alter how people combine perceptions of effects on the home country and the trading partner country when forming preferences about trade. First, because nations serve as highly salient group memberships, trade agreements are expected to trigger ethnocentric valuation; that is, in-group/out-group dynamics that favor the national in-group, all else being equal (e.g., Brewer Reference Brewer1979; Mutz and Kim Reference Mutz and Kim2017; Tajfel et al. Reference Tajfel, Billig, Bundy and Flament1971). However, less is known about whether favoring in-groups implies that out-groups are assigned a lesser value (Pratto and Glasford Reference Pratto and Glasford2008). In fact, in-group favoritism and out-group hostility are “less tightly bound than often assumed” (Kinder and Kam Reference Kinder and Kam2009, 73).
To address the implications for out-group consideration, in addition to ethnocentric valuation, our study examines the role of moral exclusion in forming views of trade—that is, neglecting consideration of the out-group’s well-being when all else is equal for the in-group. By moral exclusion, we mean “when individuals or groups are perceived as outside the boundary in which moral values, rules, and considerations of fairness apply” (Opotow Reference Opotow1990, 1). At its extreme, moral inclusion means incorporating all of humanity as part of the in-group (McFarland, Webb, and Brown Reference McFarland, Brown and Webb2013). Moral exclusion, in contrast, suggests that at least some people are outside the scope of one’s moral concern.
To the extent that the effects of trade on trading partner countries are irrelevant to trade preferences, citizens can be said to engage in moral exclusion. Even when trade benefits everyone, to the extent that citizens engage in moral exclusion, they will be indifferent to the positive effects on those in other countries in evaluating the desirability of a policy.
Ethnocentric valuation and moral exclusion are not attitudes that one can assess by means of self-report. Although ethnocentrism (as opposed to ethnocentric valuation) has been measured and studied in relation to policy attitudes, it is assessed by asking people about positive/negative characteristics of specific racial groups in order to evaluate whether people’s racial in-groups are evaluated more positively than racial out-groups (Kinder and Kam Reference Kinder and Kam2009). Not surprisingly, race-based ethnocentrism predicts attitudes toward policies such as foreign aid and social welfare, policies widely perceived to be designed to help “others.” Trade, on the other hand, is officially supposed to be good for both “us” and “them,” thus complicating the expected relationship between ethnocentrism and trade support. Ethnocentric valuation in the context of trade is more clearly demonstrated by between-group differences in levels of support for a trade policy that creates or destroys the same total number of jobs, with the only difference being whether the home country or the trading partner country wins the new jobs.
Independent of ethnocentric valuation of job gains, moral exclusion can be observed by comparing levels of support for a trade policy in which both countries gain jobs with one in which the home country gains the same number of jobs as in the other condition, but the trading partner loses jobs. Moral exclusion occurs to the extent that people do not take into account how the trading partner is affected, even when the home country obtains identical benefits.
The Role of Competition
In studies of intergroup relations, competition plays a central role in exacerbating both of the processes described above. Ethnocentric valuation intensifies when benefits to one group are perceived to go hand in hand with losses to another (e.g., Campbell Reference Campbell and Levine1965; Rabbie et al. Reference Rabbie, Benoist, Oosterbaan and Visser1974; Sherif and Sherif Reference Sherif and Sherif1953). For example, in an international intergroup context involving war, Americans valued in-group and out-group lives equally when outcomes for the two nations did not compete, but under competitive conditions, Americans valued American lives more (Pratto and Glasford Reference Pratto and Glasford2008). Although trade is obviously not the same as war, it is no accident that conflicts over trade policies are termed “trade wars.”
The “fair trade” movement emerged from a concern that workers in other countries were being taken advantage of by international trade—that is, from sociotropic concerns focused on trading partner countries. Ironically, when Americans talk about “fairness” in the context of trade today, it often comes up in the context of questioning whether there is a level playing field in a competition among nations (Rios, Finkelstein, and Landa Reference Rios, Finkelstein and Landa2015). As the US Chamber of Commerce (2019) describes it, “No one wants to go into a basketball game down by a dozen points from the tip-off” (Brilliant Reference Brilliant2014). We expect that a competitive context in which one group’s loss is seen as another group’s gain should discourage consideration of the other’s well-being. Likewise, a competitive, zero-sum perspective will result in greater favoritism toward the home country in a context where trade is viewed as a competition that creates winners and losers.
Competition circumscribes the extent of moral inclusion versus exclusion. People’s moral circles—the boundaries distinguishing those deemed deserving of moral consideration from those not—contract when they feel threatened by competition (Bloom Reference Bloom2004). Thus, competitive contexts should constrict people’s scope of moral concern and increase the extent to which others are deemed outside of the boundaries of those whose well-being “counts.” We expect moral exclusion to lead to greater devaluation of the effects of trade on those in other countries, even when both countries are benefitting from a trade agreement. In the context of trade, this would manifest itself in exclusive attention to a policy’s effects on the home country and lack of consideration given to any effects on trading partner countries.
Although countries can be characterized by their overall regard for competition, not everyone within any given country embraces competition equally. Within countries, those individuals who dislike competition and favor cooperation will naturally view trade more negatively when it is cast as a competition. For example, dislike of competition is one of the key reasons posited to explain why women are less likely than men to support trade (Baker Reference Baker2005; Beaulieu, Benarroch, and Gaisford Reference Beaulieu, Benarroch and Gaisford2004; Mayda and Rodrik Reference Mayda and Rodrik2005).Footnote 5 Women are more likely to favor cooperation over competition, even when they would benefit more personally under competitive conditions (Croson and Gneezy Reference Croson and Gneezy2009; Ortmann and Tichy Reference Ortmann and Tichy1999).
Competitive personalities should be more likely to want to defeat the out-group rather than cooperate with it. In the classic minimal group experiment, when people are given a choice of taking their in-group’s maximum benefit, which also provides the same benefit to the out-group, as opposed to an option in which the in-group benefits less than the maximum but benefits more than the out-group, they typically choose the latter. Sacrificing in-group benefits in order to maximize the difference in the amounts the two groups receive is a competitive act. As the authors of this classic study note, “It is the winning that seems more important to them” (Tajfel et al. Reference Tajfel, Billig, Bundy and Flament1971, 172). Likewise, in a series of experiments focused on neglect of the interests of outsiders, Baron (Reference Baron, Boodman, Jinks and Woods2012) documents the importance of the value people place on doing not just well but doing better than others in conditioning their extent of cooperation.
To summarize our expectations, we hypothesize that competition will increase both ethnocentric valuation and moral exclusion, thus altering the basis of people’s trade preferences. In this study, we examine the role of competition cross-nationally in two countries that differ in the degree to which competition is seen as beneficial, and within these two countries using individual-level predispositions toward competition.
Our initial comparison for purposes of testing this hypothesis is between Canada and the United States, countries characterized by lower and higher regard for competition, respectively. Using experimental design, we test our predictions in the context of attitudes toward trade agreements using representative national samples of Americans, who hold especially high regard for competition, and Canadians, a population with significantly less enthusiasm for competition. Competition encourages the belief that jobs in one’s home country are worth more than those outside of it. By examining variations in ethnocentric valuation and moral exclusion in more and less competition-oriented countries as well as by more and less competitive individuals within each of those countries, we underscore how competition conditions attitudes toward trade.
Trade Attitudes in the United States and Canada
The US and Canada provide an excellent basis for comparison because of both their similarities and differences. In both countries, trade policies are viewed mainly in terms of their potential effects on job availability, thus lending a common currency for evaluating how much a person in one country is worth relative to another. Both countries are also high-skill, wealthy democracies.
Key differences between these two countries are equally useful for our purposes. In Lipset’s (Reference Lipset1989) comparison of US and Canadian culture, he suggests that Americans emphasize individualism and achievement, whereas Canadians are more collectivist in their value orientations. Canadians are self-deprecators, who can tolerate losing, whereas Americans are “descended from winners” (Lipset Reference Lipset1989, 1). Whether one agrees with these characterizations or not, American enthusiasm for competition is clearly unmatched by any other industrialized country in the world (Duina Reference Duina2010). Data from the World Values Surveys confirm that Americans are far more positive about the role of competition in society than Canadians. On a scale anchored at one end by “Competition is good. It stimulates people to work hard and develop new ideas” and at the other end by “Competition is harmful. It brings out the worst in people,” Canadians are significantly less enthusiastic about the benefits of competition than Americans (p < 0.001). For this reason, we expect Americans to exhibit greater ethnocentric valuation and moral exclusion than Canadians when forming attitudes toward identical trade policies.
Canadians are known to be more supportive of trade than Americans, and this is true in our surveys as well. Differences in absolute levels of support for trade may occur for a whole host of reasons, including the relative size of nations, their historical dependence on trade, and availability of natural resources. But by using experiments to systematically manipulate and hold constant the costs and/or benefits of specific trade agreements to the home country and to trading partner countries, we can observe how much people take the home country and trading partner countries into account, independent of their preexisting preferences and beliefs about international trade.
We draw on several sources of comparison for the purposes of multiple tests of our hypotheses across two countries. First, we expect Americans’ greater enthusiasm for competition to produce significantly more evidence of both ethnocentric valuation and moral exclusion in the US than in Canada.
H1: Americans will be more likely than Canadians to support a trade agreement in which the home country gains jobs and trading partner countries lose jobs (Ethnocentric Valuation Experiment).
This hypothesis predicts a significant interaction between country and the experimental conditions representing identical total job gains, varying whether it is the home country or trading partner country that gains versus loses jobs.
Second, the country with higher levels of enthusiasm for competition is also expected to display greater moral exclusion in the extent to which they ignore out-group gains even when the home country benefits to the same degree:
H2: When a trade policy benefits both the home country and trading partner countries, it will receive greater support from Canadians than Americans, whereas a trade policy that benefits the home country but hurts trading partner countries will be favored more by Americans than by Canadians (Moral Exclusion Experiment).
Confirmation of this hypothesis would require a significant interaction between country and the experimental conditions in which the home country gains the same amount of jobs in both cases, but the trading partner also benefits in one condition, but not in the other.
Cross-national differences in affinity for competition are expected to condition the extent of ethnocentric valuation and moral exclusion so as to alter levels of support for the very same trade agreements. But as with any cross-country comparison, there are so many differences between countries that it is difficult to be confident that competition in particular is the important factor. For that reason, we also examine three individual differences in predispositions toward competition as additional tests of our hypothesis.
First, social dominance orientation (SDO) is known to facilitate greater ethnocentrism and moral exclusion because it represents a propensity to see the world in competitive terms. People high in SDO believe in the appropriateness of hierarchy, of some groups dominating others; some groups are simply better, more deserving, and more meritorious than others. Therefore, it is fitting that there are winners and losers (Pratto et al. Reference Pratto, Sidanius, Stallworth and Malle1994). Thus, across both countries, we expect people with high levels of SDO to demonstrate greater ethnocentric valuation as well as greater moral exclusion in their support for trade agreements.
H3/H4: Across both countries, those high in social dominance orientation will be more likely to exhibit ethnocentric valuation (H3) and demonstrate moral exclusion by neglecting a policy’s effects on trading partners (H4).
Empathy serves as second characteristic known to vary with competitiveness. Those with high levels of empathy tend to be less competitive than those with low levels of empathy (Arnocky and Stroink Reference Arnocky and Stroink2010; Barnett, Matthews, and Howard Reference Barnett, Matthews and Howard1979). “Competing to win presumably requires at least a temporary suppression of empathetic concern for opponents’ feelings and outcomes” (Hibbard and Buhrmester Reference Hibbard and Buhrmester2010, 414). Likewise, empathy has been found to alter people’s scope of moral inclusion (Batson et al. Reference Batson, Polycarpou, Harmon-Jones, Imhoff, Mitchener, Bednar and Klein1997). People high in empathy as a personality trait should be more likely to consider a policy’s effect on others, and thus they should be more likely to take into account the effects a trade agreement has on people in trading partner countries in addition to its effects on those in their own country.
H5/H6: In both the US and Canada, those high in empathy will be less likely to demonstrate ethnocentric valuation (H5) and moral exclusion (H6) in their support for trade policies.
As a final test of our theory that competitiveness moderates the roles of ethnocentric valuation and moral exclusion, we examine whether people viewed trade as a competitive, zero-sum competition prior to the experiment. If citizens perceive international trade to be the reshuffling of a finite number of jobs, then one country’s loss is necessarily another country’s gain. Viewing trade as a zero-sum competition should facilitate greater ethnocentric valuation and moral exclusion.
H7/H8: In both countries, those who already perceive trade in zero-sum, winner-loser terms will be more likely to exhibit ethnocentric valuation (H7) and moral exclusion by ignoring a policy’s effects on trading partners (H8).
Each of these last six hypotheses is tested by looking for significant interactions between individual characteristics (high social dominance orientation for H3/H4, low empathy for H5/H6, and zero-sum perceptions of trade for H7/H8) and the experimental treatments illuminating ethnocentric valuation and moral exclusion. Since individual differences in personality characteristics should matter similarly in both the US and Canada, we expect no significant interactions by country when looking at individual differences. But to the extent that Canadians are, on average, lower than Americans in social dominance, more likely to view trade in zero-sum competitive terms, and more likely to have empathy for trading partners, these results would lend further support to our cross-national interpretation of the significance of a competitive national culture.
In addition to testing these formal, directional hypotheses about reactions to job gains and losses, we predict that the magnitude of job gains and losses to the home country and trading partner countries will make little difference to people’s support for trade policies. Studies of price elasticity—that is, the extent to which demand for a product goes down as its cost increases—demonstrate that public goods are highly inelastic relative to private consumer goods (Green Reference Green1992). For example, small increases in the cost of a consumer good reduce the proportion of people willing pay for it. But the willingness of people to pay more in taxes for a public good such as the environment is far less sensitive to the price tag attached. Even the exact same good framed as a public versus a private good will generate less elasticity in willingness to pay as a public good across a broad range of costs (Green and Blair Reference Green and Blair1995). Trade is often framed in terms of the personal benefits of jobs to individuals. But if jobs are not viewed as individual goods so much as collective goods, then they may well follow the pattern described for public goods.
Given that support for trade involves symbolic considerations (Hainmueller and Hiscox Reference Hainmueller and Hiscox2006), we expect that the magnitude of the job gains and losses due to trade will make little difference to levels of support. For example, an experimental study of ethnocentric valuation systematically varied how many out-group and in-group lives were lost in a competitive context in order to quantify how competition alters the valuation of in-group and out-group lives. Consistent with our prediction, Pratto and Glasford (Reference Pratto and Glasford2008) found that even when very large numbers of enemy civilian lives were at stake, the magnitude of loss mattered little.Footnote 6
Using variation in the extent of job gain and job loss, we can quantify how much Americans and Canadians believe one home country job is worth relative to one trading partner’s livelihood. Although people in different countries may have myriad reasons to favor or oppose trade, we reasoned that surely there is a point at which the net gain to humanity makes such a policy worthwhile, even without concomitant home country benefits. We address this question by evaluating where convergence occurs in the absolute levels of support for the policy when the home country gains and the trading partners loses, relative to when the opposite occurs.
Research Design
Our data come from two population-based survey experiments. The American study was executed by Gfk Research,Footnote 7 and the Canadian data were collected by YouGov.Footnote 8 In both countries, data collection took place at two sequential points in time. First, pretreatment surveys were conducted to gather data on respondents’ general policy preferences concerning trade, along with individual predispositions toward competition (see Appendix A for question wording).Footnote 9 Five questions tapping general attitudes toward trade were used to create a pretreatment trade preference index, which was included as a covariate in the analysis of the experiment that took place months later. Because people’s preexisting attitudes toward trade are likely to account for much of the variance in attitudes toward a specific trade policy, this covariate increased the efficiency of our statistical models. The survey also measured social dominance orientation and empathy as a general personality trait using previously validated scales (see Pratto et al. Reference Pratto, Çidam, Stewart, Zeineddine, Aranda, Aiello and Chryssochoou2013; Davis Reference Davis1983, respectively).
To identify those who already viewed trade in zero-sum terms with respect to the allocation of jobs, in the pretreatment survey respondents were asked to indicate whether they believed trade had a positive, negative, or no effect on the availability of jobs in their home country. In a separate question, respondents were asked the same about trade’s impact on jobs in trading partner countries. The order of these two questions was randomized. Those who indicated that trade decreased the availability of jobs in the home country while increasing the number of jobs in other countries were labeled as having zero-sum perceptions of trade. Footnote 10 In other words, they viewed trade through the lens of winners and losers. Approximately 50% of Americans met the criteria for zero-sum perceptions, whereas significantly fewer—only 27%—of Canadians did.
Two to three months later, respondents were re-contacted for purposes of the population-based survey experiment (n = 2,350 for US and n = 2,000 for Canada).Footnote 11 Although this time lag reduced the sample sizes somewhat due to attrition, it facilitated collection of observational pretreatment data well before the actual experiments so that subjects’ responses to the experimental treatments would not be associated with the initial survey.
Both American and Canadian respondents were presented with a description of a trade agreement that varied the policy’s expected effect on the availability of jobs in the home country and trading partner country. Using a between-subjects design, respondents were randomly assigned to read about a trade agreement that either
(a) creates jobs in the trading partner country but reduces jobs in the home country,
(b) reduces jobs in the trading partner country but creates jobs in the home country, or
(c) creates jobs in the trading partner country as well as in the home country.
Given that both Americans and Canadians evaluate trade primarily based on its perceived effects on employment (Hiscox Reference Hiscox2006; Slaughter Reference Slaughter1999), we used job gains or losses to manipulate people’s perceptions of the trade policy’s impact.
These three conditions facilitate our two key experimental comparisons that reveal ethnocentric valuation and moral exclusion. First, by comparing levels of support for trade in conditions (a) and (b), we quantify the extent of ethnocentric valuation. In other words, how much more do people value home country jobs relative to the same number of jobs in trading partner countries? Importantly, in the Ethnocentric Valuation Experiment, we compare experimental conditions in which the same number of total job gains/losses are at stake, and only which country receives the gains versus the losses varies. As a result, we are comparing levels of support for trade agreements that are equally positive or negative for humanity as a whole.
Second, comparisons between conditions (b) and (c) facilitate our Moral Exclusion Experiment. What is constant across conditions (b) and (c) is that the home country gains the same number of jobs due to the trade agreement. What varies is strictly whether the trading partner countries also gain jobs. This comparison allows us to quantify the extent to which respondents engage in moral exclusion, in this case, failing to take into account job gains that would accrue to other countries as well as gains for the home country. In this comparison, the total number of jobs gained around the world is consistently higher in the gain-gain condition.
A second between-subjects experimental factor was fully crossed with the three conditions above. In this case, we manipulated the magnitude of the policy’s effect on jobs, from 1 job to 1,000 jobs. Seven possible levels of this factor were assigned to systematically alter the extent of total job gains or losses resulting from the trade agreement (see Appendix D for experimental conditions).
When using highly diverse, representative population samples, it is always risky to use treatments involving numbers, percentages, or ratios that may not be easily or uniformly understood by the public. For this reason, we pretested manipulations of the extent of gain/loss using subjects from Amazon Mechanical Turk (MTurk). Following the pretest experiment, respondents were asked who would gain and who would lose jobs based on the description they read, and we also asked them to assess the magnitudes of those gains/losses on a semantic scale for both the home country and trading partner countries.
Based on our pretest results, the most successful form of manipulation for magnitude occurred when using ratios to express how many jobs were gained and/or lost in countries. For example, a respondent might receive a description stating that for each person in the home country who loses a job, 100 people in a country that we trade with will gain jobs. These pretest responses also helped us identify a range within which we might expect that support for trade that benefits other countries would equal support for a policy favoring the home country. Home-country and trading-partner gains and losses were described in ratios ranging from 1 to 1, 1 to 10, 1 to 100, and 1 to 1,000.
The description of the trade policy was brief and to the point:
The [United States/Canada] is considering a trade policy that would have the following effects: For each [1/10/100/1,000] people in the [US/Canada] who [gain/lose] jobs, [1/10/100/1,000] people in a country that we trade with will [lose/gain] jobs.
After reading the description, respondents were asked whether they would support or oppose the trade policy. Support for trade policy was measured on a four-point scale, with higher values indicating more support.
To ensure that respondents correctly understood a given trade policy, after measuring the dependent variable, we asked them whether the home country and trading partner country gained or lost jobs according to the policy they had read about earlier and to what extent. In addition to the MTurk pretest, the experimental manipulations worked as intended in both the American and Canadian samples. The results of these manipulation checks are shown in Appendix C. The treatments successfully changed perceptions of who gained and lost jobs according to the policy description. The magnitude manipulations also produced more extreme perceptions of trading partner gains/losses in the appropriate conditions for both American and Canadian samples.
Results
To reiterate, our Ethnocentric Valuation Experiment is designed to assess the extent to which gains for people in one’s own country are more highly valued than gains for citizens of other countries when the total number of jobs is held constant. Our Moral Exclusion Experiment is designed to hold constant the benefits to people in one’s home country, while assessing the extent to which benefits to other countries matter in increasing support for trade policies. We hypothesize that both across countries and within individual countries, predispositions toward competition will moderate the extent of ethnocentric valuation and moral exclusion.
Our first hypothesis predicted that Americans, who are known to value competition more than any other country included in the World Values Surveys, would demonstrate higher levels of ethnocentric valuation than Canadians. The null hypothesis in this experiment suggests that the number of jobs gained/lost at home or overseas affects people’s favorability toward a policy equally, regardless of who gains or loses.
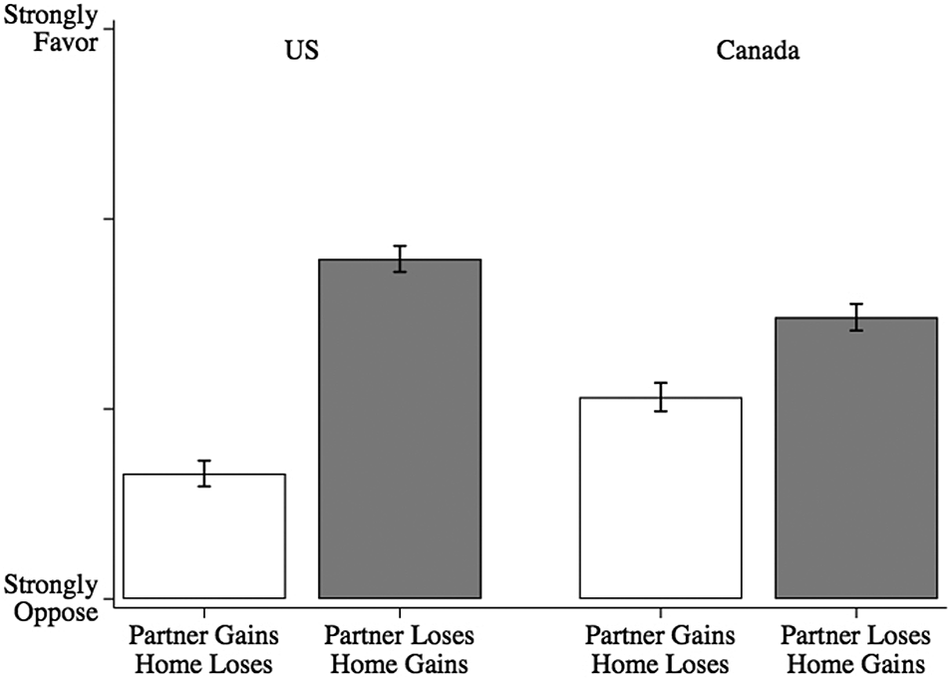
As Figure 1 illustrates, in the Ethnocentric Valuation Experiment, both Americans and Canadians are ethnocentric in that they favor a trade policy to a greater extent when it benefits the home country instead of trading partner countries. This produces an extremely large main effect of the experimental conditions (p < 0.001). However, the differences between experimental conditions are significantly larger for Americans than for Canadians, thus confirming a significant interaction between country and condition in the expected direction (p < 0.001). When the trading partner gains and the home country loses, Canadians are more supportive than Americans of the policy. When the home country gains and the trading partner loses, Americans are significantly more supportive of the policy than Canadians, thus demonstrating greater ethnocentric valuation.
Ethnocentric Valuation: Trade Support by Country and Who Wins versus Loses

Our second hypothesis was that this same between-country distinction would apply to the extent of moral exclusion. To test this, we compared mean levels of trade support between conditions in which the home country gains jobs from trade, but in one condition the trading partner loses jobs, whereas in the other condition the trading partner also gains jobs along with the home country. If there are no differences in levels of support for a trade policy that benefits the home country but costs the trading partner, versus a “win-win” policy in which both countries gain jobs, then citizens are seen as ignoring the well-being of those in the other country and excluding them from their scope of moral concern.
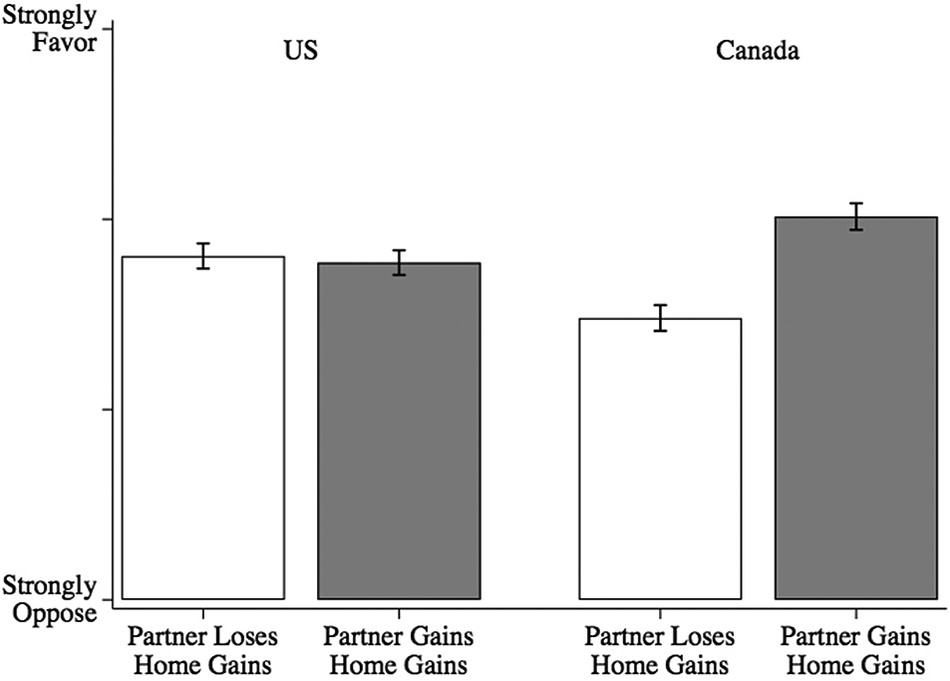
The results by country for the Moral Exclusion Experiment are shown in Figure 2. Americans were equally supportive of the trade policy regardless of how it affected the trading partner countries. Canadians, in contrast, were more supportive of the policy in which both Canadians and their trading partners gain jobs. Again, we found our hypothesized interaction between country and experimental conditions (p < 0.001). Americans were largely indifferent to whether the trade policy helped or hurt jobs in the trading partner country so long as it benefitted the US, whereas Canadians were more supportive of mutual gains.
Moral Exclusion: Trade Support by Country and Whether Trading Partner Also Wins

The results in Figures 1 and 2 both produce transverse interactions in which one country generated significantly more trade support in one condition and the other country favored it significantly more in the other condition. This pattern suggests that differences by country in overall levels of support for trade produced by other between-country differences cannot be responsible for these results. Nonetheless, it is possible that the characteristic producing these differential effects by country is something other than a culture of competition. These two comparisons are consistent with our hypotheses, but by themselves, they do not isolate affinity for competition over cooperation or the perception of trade as a competition as the key difference.
For this reason, we turn next to individual differences in characteristics linked to our central expectation that competition moderates the extent of ethnocentric valuation and moral exclusion involved in attitudes toward trade policies. As predicted in hypotheses 3 and 4, if competitiveness is important, we expect social dominance orientation—the tendency to favor hierarchy over equality—to moderate the effect of our treatments in both the ethnocentric valuation and moral exclusion experiments. Competitive people should favor dominating others over cooperating with them.
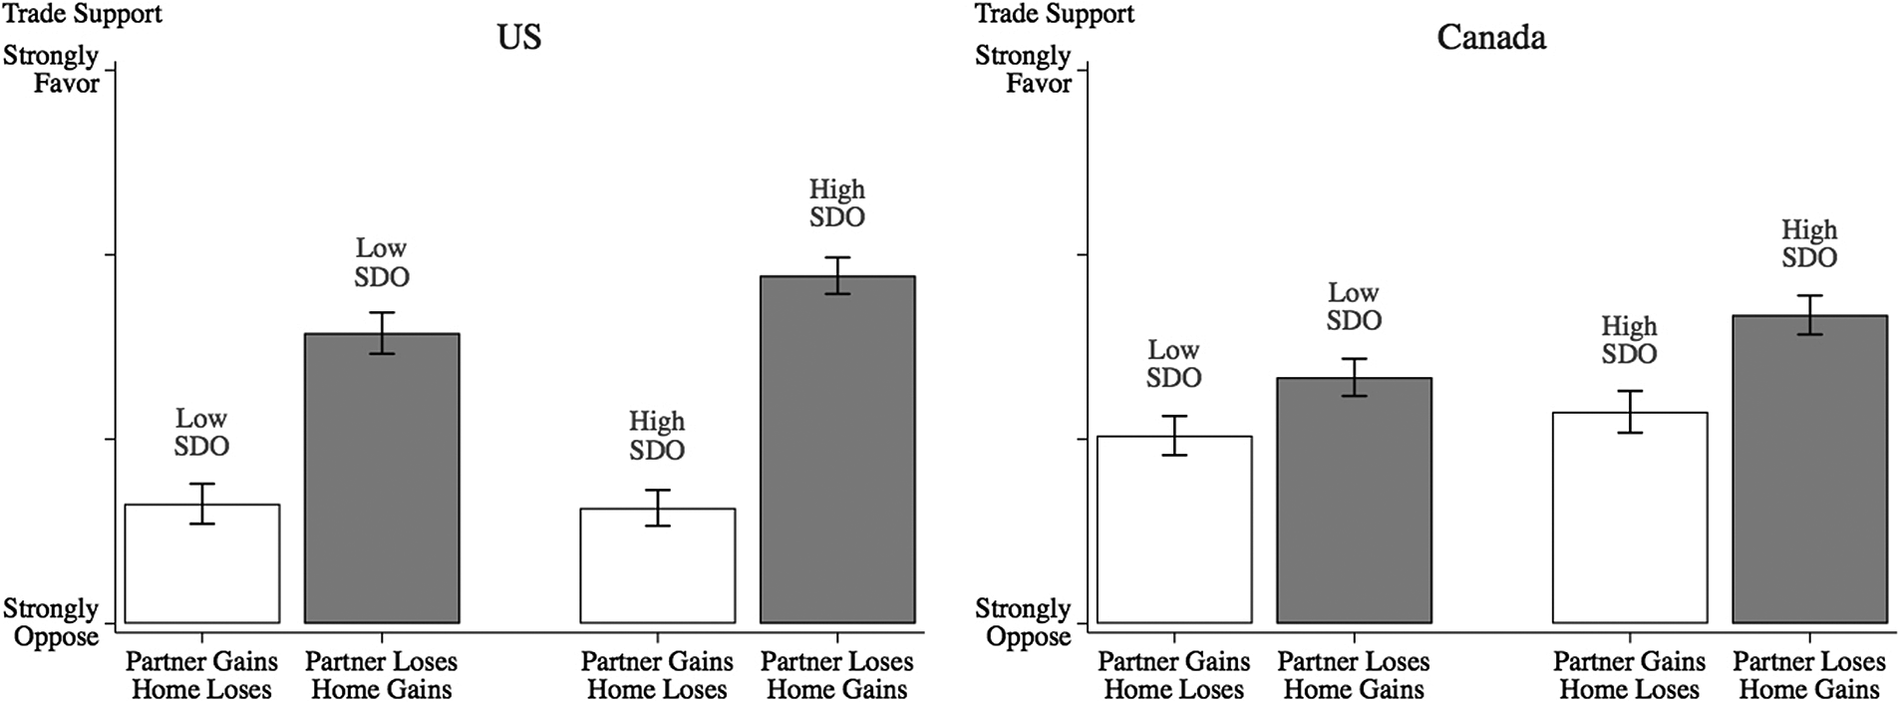
As shown in Figure 3, in both the US and Canada, the extent of ethnocentric valuation was significantly greater among those high in SDO. Low and high SDO people are roughly the same in their levels of support for trade when their home country loses jobs and the trading partner gains them. But when a trade policy creates jobs in the home country but reduces jobs in the trading partner country, people with high levels of SDO are significantly more favorable toward the policy than low SDO people (p < 0.001). So long as they end up on top, a competitive scenario is perfectly fine for those high in SDO.
Social Dominance Orientation Moderates Ethnocentric Valuation

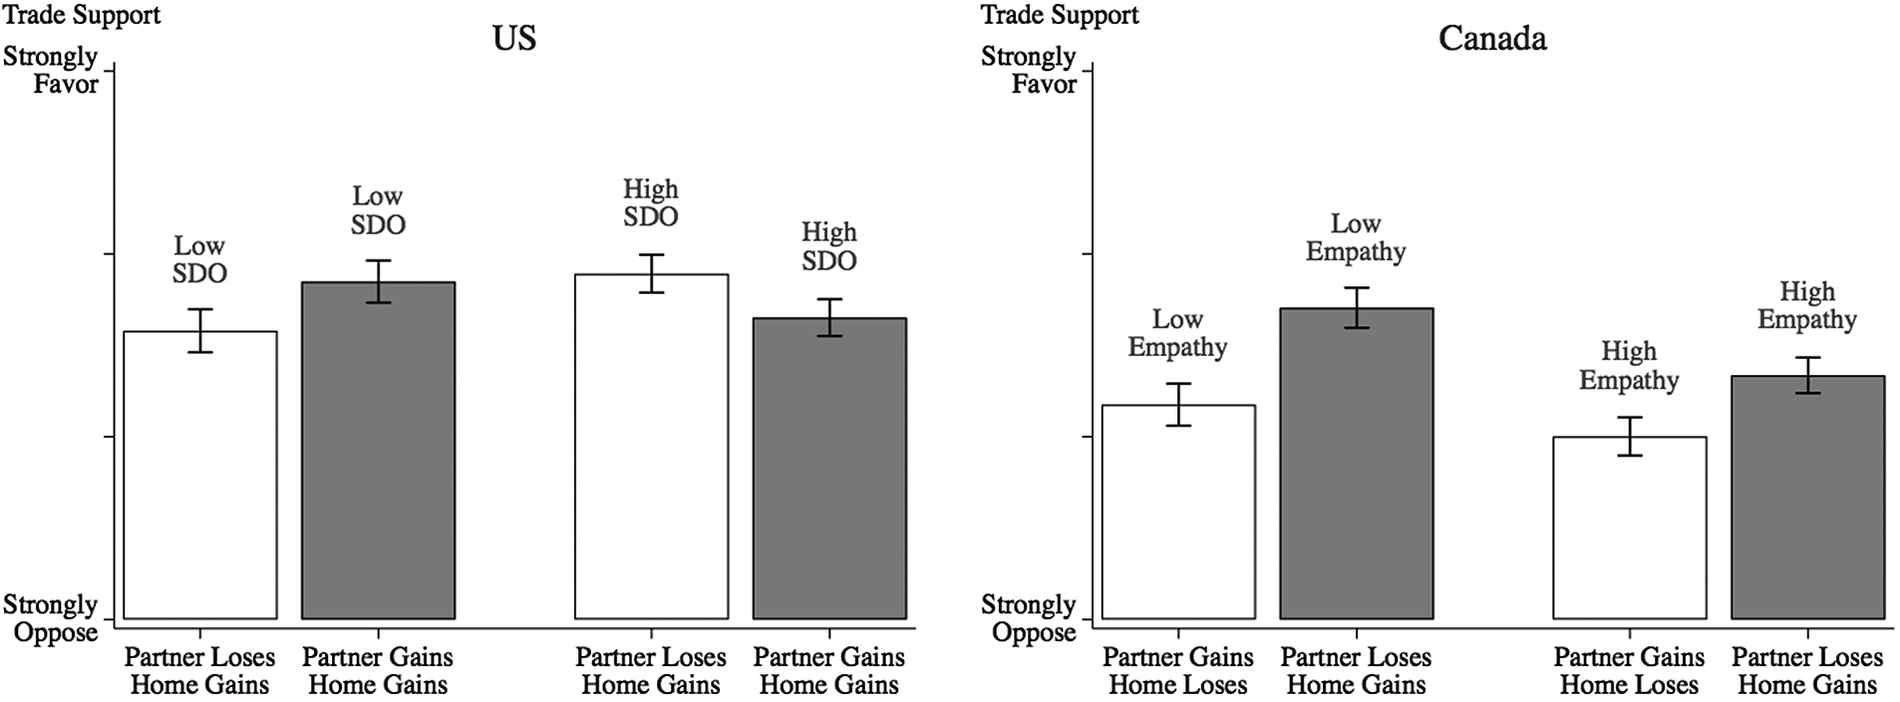
As shown in Figure 4, results from the Moral Exclusion Experiment also confirm significant interactions between experimental condition and SDO (p < 0.001), but the underlying patterns are somewhat different between the US and Canada. In the US, low SDO people are more likely to favor a “win-win” trade policy, whereas those high in SDO are more likely to favor a policy in which the US wins and the trading partner loses. High SDO people appear to feel that they should gain more than those in the trading partner country, thus reducing their support for even the win-win scenario. Among Canadians, there is a significant interaction as well. But in this case the interaction is driven by the fact that there is much greater support for the win-win policy relative to the lose-win policy among low SDO Canadians and a smaller such difference for those high in SDO.
Social Dominance Orientation Moderates Moral Exclusion

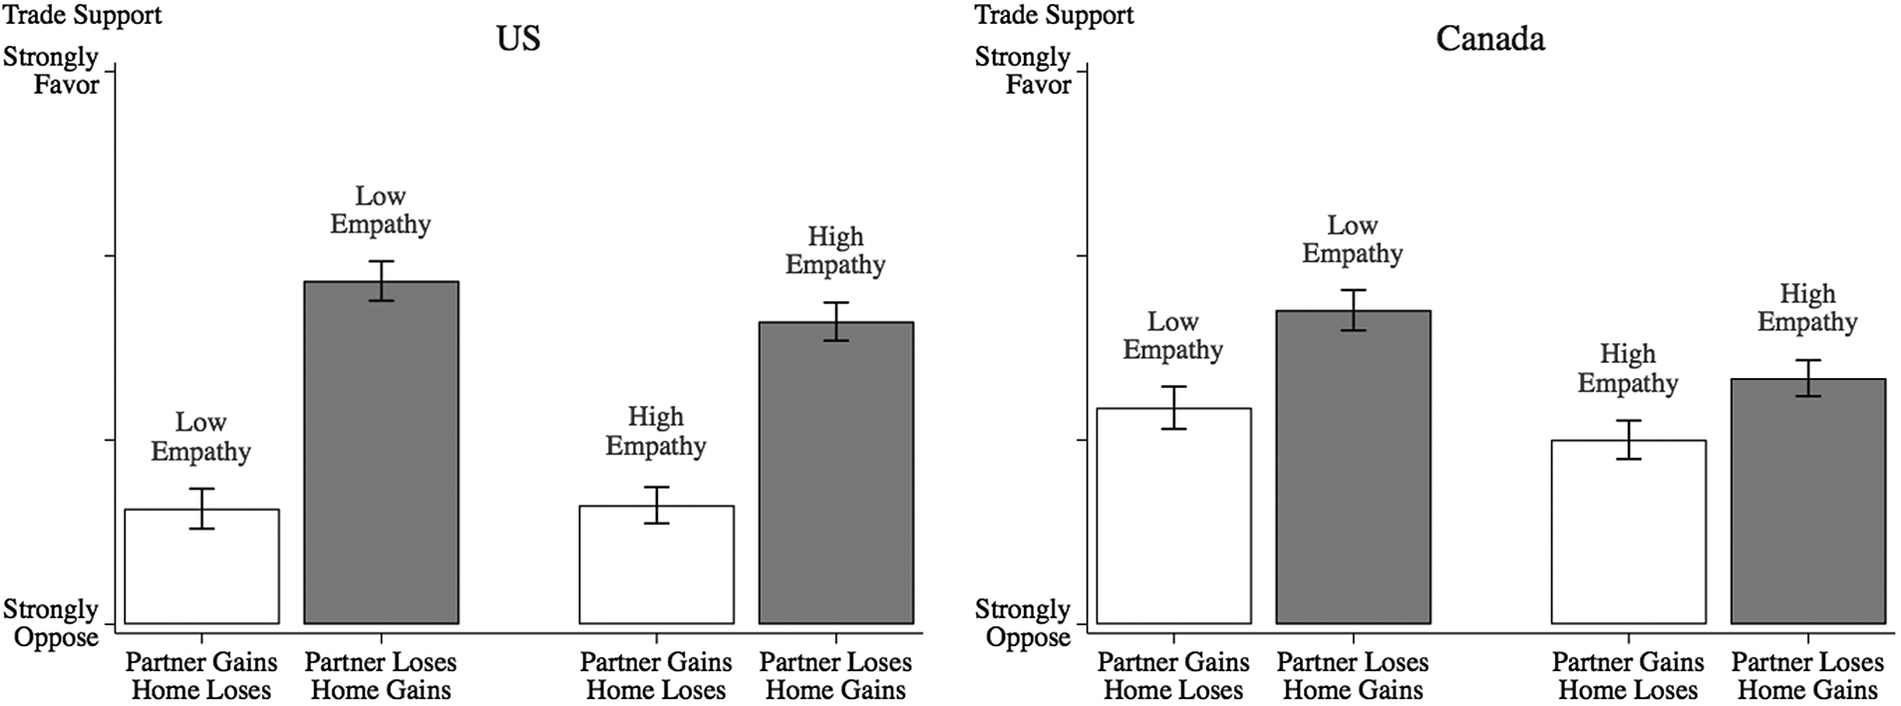
Do individual differences in empathy likewise support the hypothesis that those with low levels of empathy will be more likely to engage in ethnocentric valuation? Competitiveness and empathy may not be mutually exclusive, but they clearly push in opposing directions with respect to considering the feelings of others. Figure 5 demonstrates that regardless of empathy levels, Canadians and Americans both have lower levels of support for the policy involving job gains for trading partner countries and losses for the home country. But when the policy’s effect is reversed so that the home country gains while the trading partner loses, those high in empathy are significantly less supportive of the policy (p < 0.01), demonstrating a lesser extent of ethnocentric valuation relative to those low in empathy. Their high levels of empathy lead them to take into consideration the losses experienced by trading partner countries.
Empathy Moderates Ethnocentric Valuation

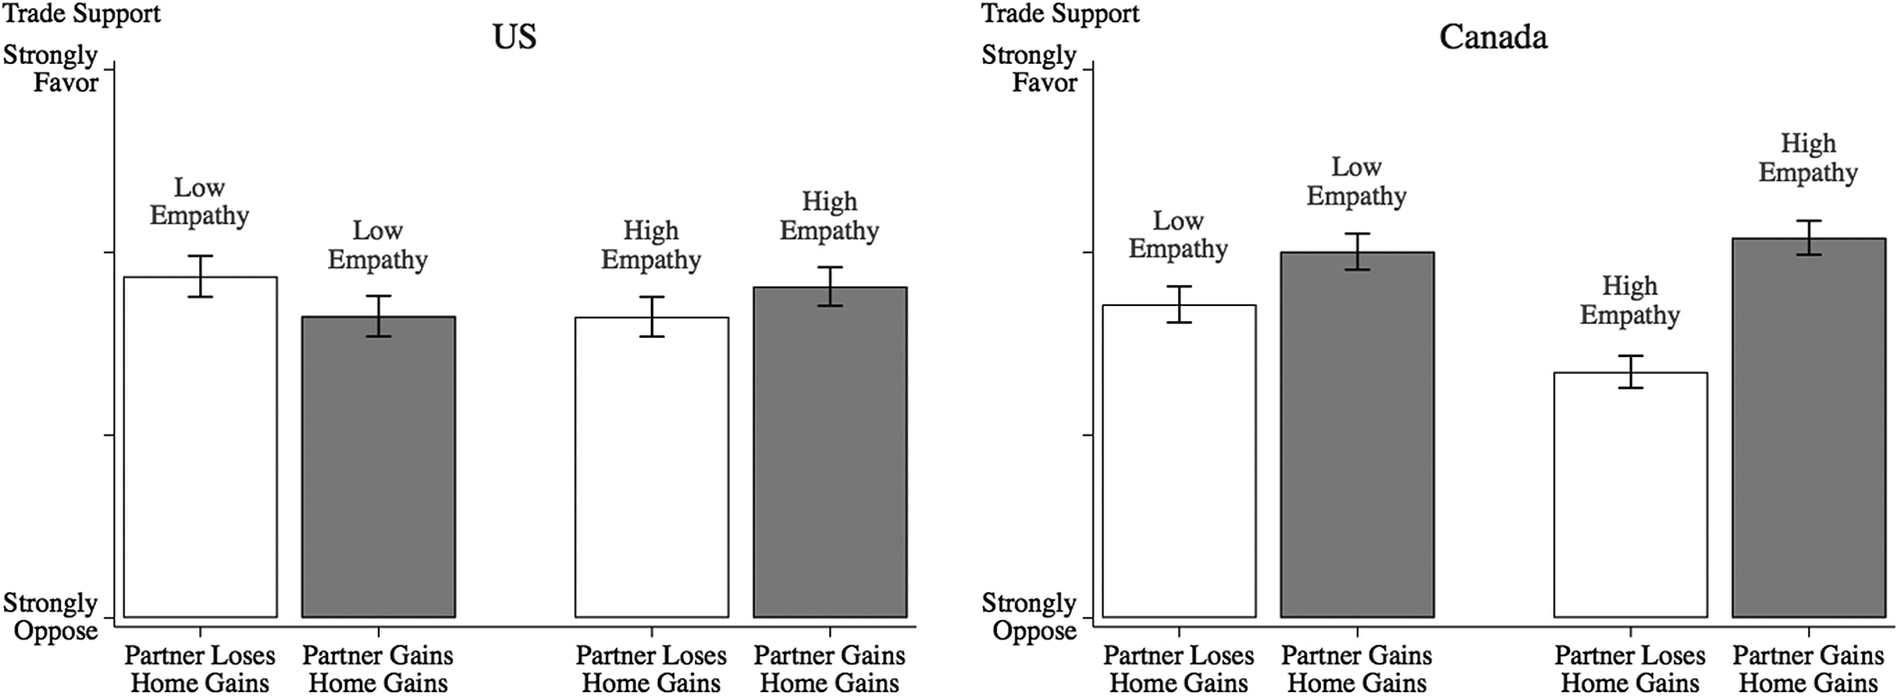
In Figure 6, we compare the two conditions in which the home country gains the same amount, and all that varies is whether the trading partner also gains jobs, broken down by levels of empathy. A difference in preferences favoring the gain-gain condition means that people are taking the effects of a trade policy on others into account. As one would expect, those high in empathy are significantly more likely to do so in both the US and Canada. However, when the home country gains and the trading partner loses, those with high levels of empathy are significantly less supportive of the policy than are low-empathy respondents (p < 0.001), thus suggesting that empathy for the other country plays a role among this subgroup. In Canada, even those low in empathy are more favorable toward the gain-gain condition, whereas in the US, those low in empathy favor the gain-gain version of the trade agreement less than when the home country gains and the trading partner does not. This reflects Americans’ more competitive bent; even though it would not negatively affect their own country, they prefer gaining while others are losing.
Empathy Moderates Moral Exclusion

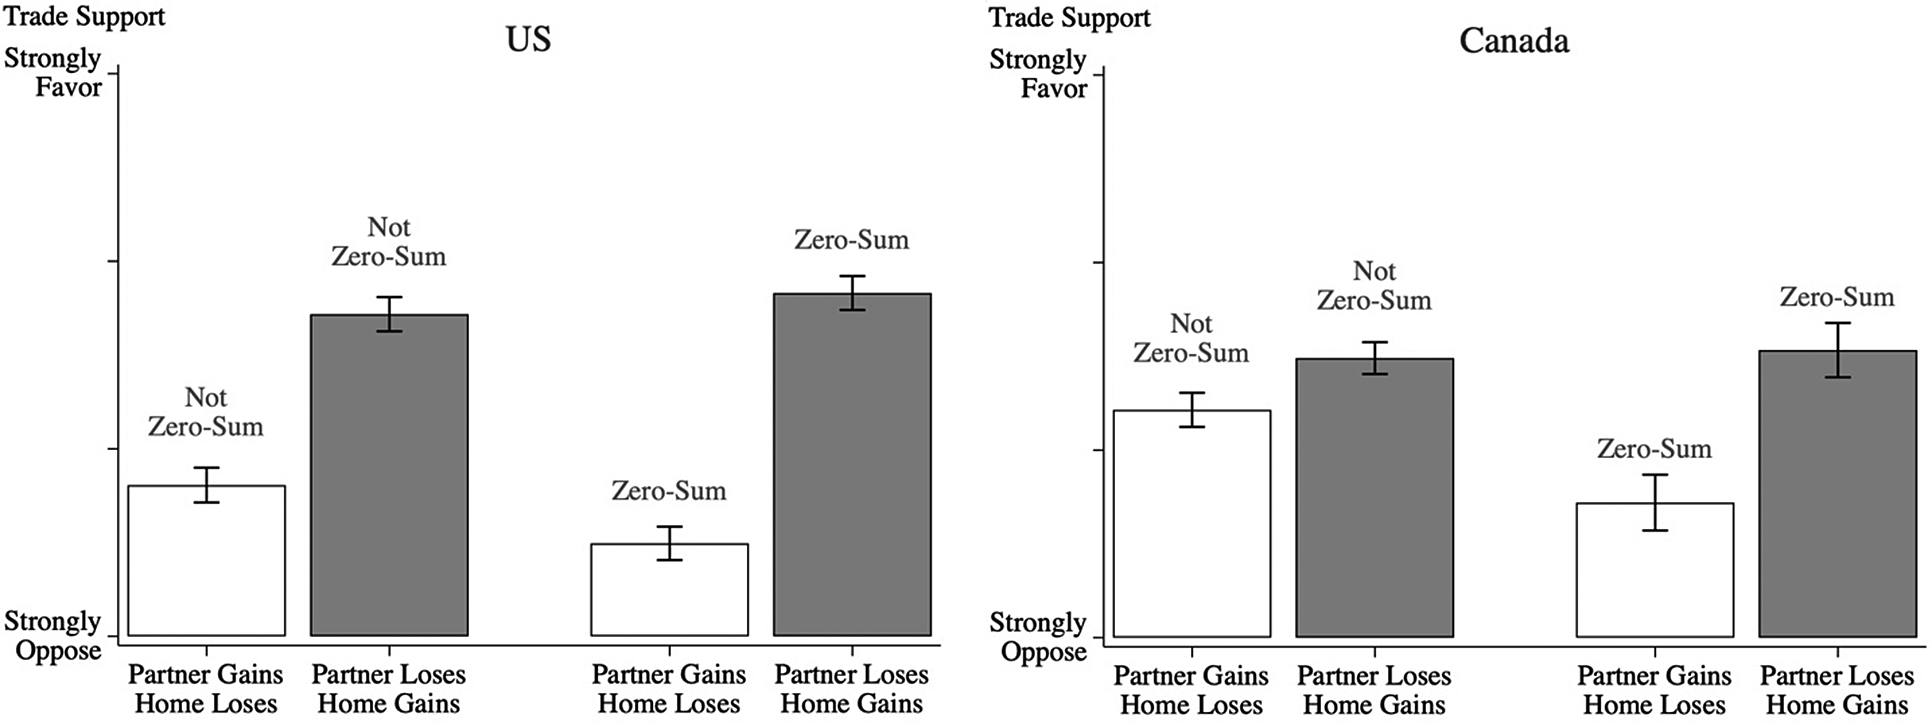
Finally, in Figures 7 and 8, we examine the role of a trade-specific competition measure as a moderator in influencing support for trade by means of ethnocentrism and moral exclusion. If competitiveness plays the role that we hypothesized, then those prone to see trade as a zero-sum competition with winners and losers should demonstrate greater ethnocentric valuation and moral exclusion. Using a dichotomous variable to represent those who, months prior to the experiment, already thought of trade in zero-sum terms, we again find significant interactions with the experimental treatments. Those who began the study with the notion that trade helped job availability overseas at the cost of home country jobs demonstrated greater ethnocentric valuation in response to experimental treatments in both the US and Canada (p < 0.001). When trade is assumed to be a process that produces winners and losers, people demonstrate an even stronger tendency to favor it strictly when they are the assured winners and others are losers.
Zero-Sum Perceptions Moderate Ethnocentric Valuation

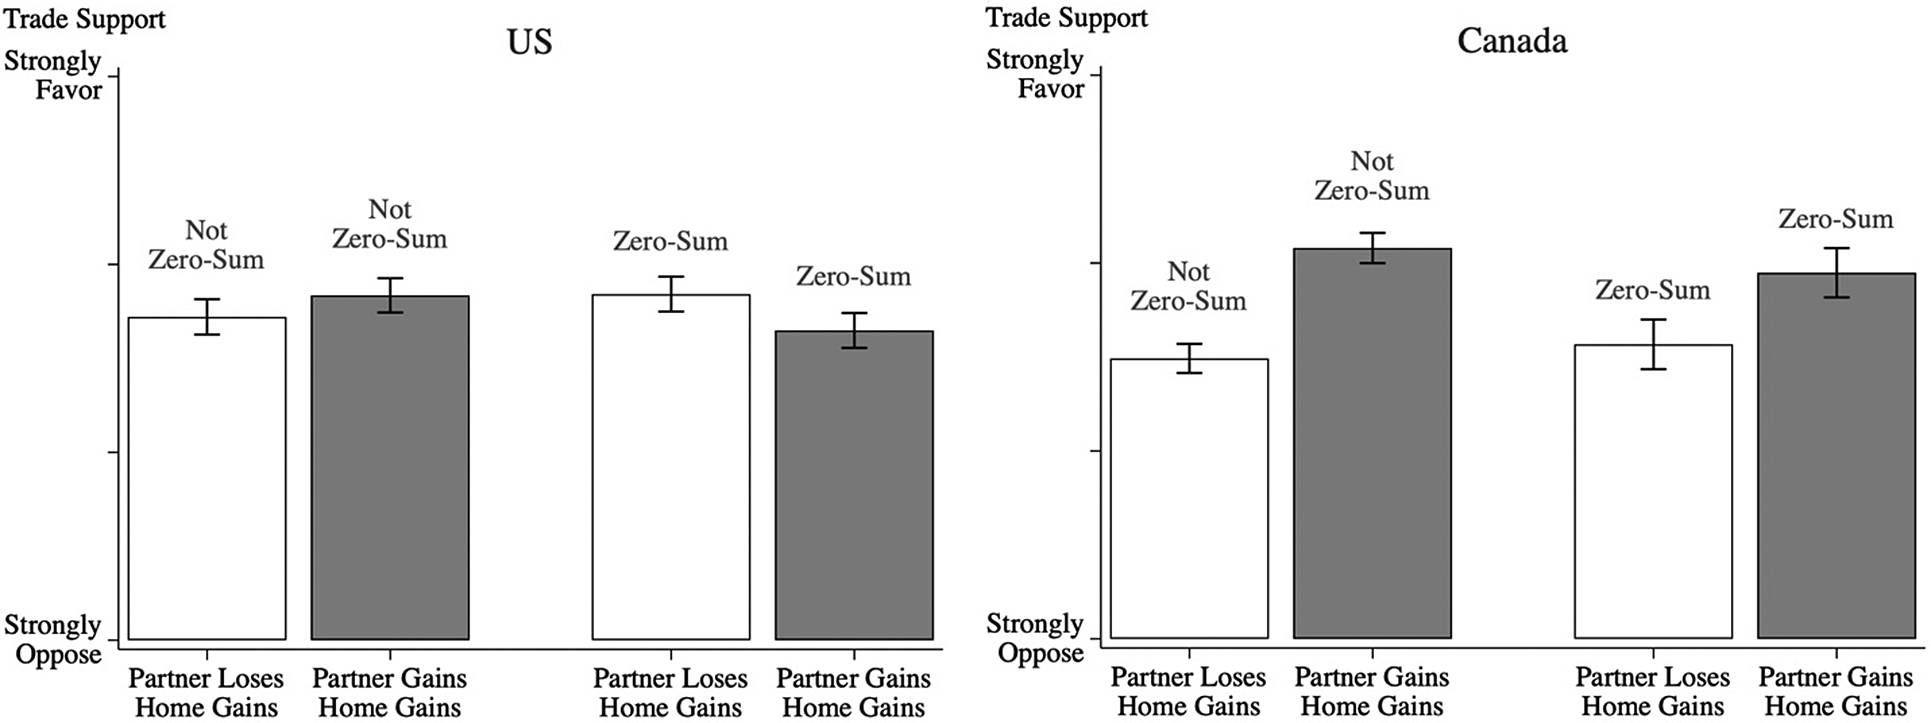
Zero-Sum Perceptions Moderate Moral Exclusion

Likewise, people’s preexisting tendencies to view trade in competitive terms decreases the extent to which they take into account the effects a trade agreement has on the trading partner—that is, to encourage moral exclusion. One would logically expect more support for a policy in which both parties gain since it benefits everyone. But as shown in Figure 8, this is only the case in Canada where, regardless of whether one started with zero-sum perceptions, a trade policy benefitting people both home and abroad was most popular. Among Americans, in contrast, only those who were not predisposed to think of trade as a zero-sum competition increased support for trade due to the additional benefits to trading partner countries. In fact, for that 50% of Americans who viewed trade in competitive, zero-sum terms, the policy is slightly less desirable when everyone benefits than when only the home country does. Across both countries, there is, as predicted, a significant interaction between zero-sum perceptions and the experimental treatments such that people with zero-sum perceptions are more likely to disregard the positive effects of trade on the trading partner country (p < 0.001). However, Canadians still see the other country’s gains as a positive factor, increasing their support for the “win-win” agreement, whereas Americans who perceive trade as a zero-sum game go beyond moral exclusion to view the agreement less positively when it benefits both the home country and trading partner countries.
Discussion and Limitations
Overall, our results are highly consistent with the argument that valuing competition and viewing trade as a policy involving competition increase ethnocentric valuation—that is, assigning greater value to co-nationals’ well-being than to outsiders’—while also promoting moral exclusion—that is, indifference or even negative attitudes toward benefits to those outside of one’s national in-group. How confident should we be that the results described here can be interpreted causally? Because this study involves random assignment to experimental conditions, as well as representative national surveys, we can be fairly confident of the strength of causal inference and of estimated effect sizes. It is always possible, however, that in altering these scenarios we have inadvertently manipulated something other than perceptions of jobs gained and lost by trade. However, given our sparse descriptions of these trade agreements, it is difficult to imagine what that might be. Mass publics are notoriously innumerate and often have difficulty understanding experimental treatments involving numbers and probabilities, but our manipulation checks confirmed that perceptions of both who gained and who lost, and how much was gained or lost, were successfully manipulated. Nonetheless, it remains possible that we unintentionally manipulated something else, though we have no specific possibilities in mind that would account for this pattern.
Evaluating the external validity of these findings involves more complex considerations. On one hand, the samples of respondents are highly representative and closely mirror their respective national populations (see Appendix F for comparison to population estimates), so the generalizability of the sample is high. The American sample had some differential attrition between waves, but not on any characteristic associated with the size of treatment effects.Footnote 12 On the other hand, we purposely described trade policies with known consequences for the home country and trading partner countries. We do not know which of these scenarios most Americans or Canadians assume when they form opinions about, say, NAFTA or the TPP. Nonetheless, our results are useful toward understanding the theoretical basis of trade preferences and how linking trade to competition as opposed to cooperation may adversely affect levels of support.
Is it realistic to think that in the real world, people form trade attitudes based on their impressions of job losses and gains in the home country and in trading partner countries? Our survey data preceding the experiment suggest that people do hold such impressions. Moreover, our experimental findings confirm that these perceptions have consequences for trade preferences. Each hypothesis derived from this general theory was tested in two countries. These findings are robust taking into account examinations across two countries and 8 hypotheses in total.
When forming attitudes toward trade, citizens think about how their own country will be affected as well as how the trading partner country will be affected. Trade is in this sense dually sociotropic; its collective effects on both the home country and on other countries are relevant. Further, belief in competition alters the extent to which these factors influence trade preferences. Trade preferences in the US should be a function of trade’s perceived effect on the home country and on trading partner countries, moderated by the extent to which trade itself is perceived as a form of competition as opposed to cooperation.
As David Autor (2016) points out, the costs and virtues of trade in the US pale in comparison with the basic humanitarian benefits that people in other places have experienced as a result of trade: “The gains to the people who benefitted are so enormous—they were destitute, and now they were brought into the global middle class. The fact that there are adverse consequences in the US should be taken seriously, but it doesn’t tilt the balance.”Footnote 13 When a trading partner was described as gaining a large number of jobs in our study, many respondents claimed it was “unfair.” However, if trade is considered in moral terms, “it seems important to contemplate how to assign and compare the values of a new job to someone who would otherwise be stuck in dire poverty and a lost job for someone with at least some version of a safety net.”Footnote 14
One limitation of our study is that we manipulated only two dimensions of trade’s effects, its collective effects on jobs at home and in trading partner countries. People may have other reasons for favoring or opposing trade. The pretreatment survey in this study asked both Americans and Canadians about their trade preferences as well as an open-ended follow-up question asking why they favored or opposed trade. Among those who opposed trade, its effects on jobs was cited most often as the reason by both Americans and Canadians. This suggests that employment is the central focus of concern when considering the effect of trade in these countries.
Within the United States and Canada, these findings also help to explain the consistently lower levels of support for trade among women relative to men. As previously reviewed, women are well documented to prefer cooperation over competition to a greater extent than men. They are also lower in SDO (Milfont and Sibley Reference Milfont and Sibley2016; Pratto, Stallworth, and Sidanius Reference Pratto, Stallworth and Sidanius1997) and higher in empathy (Rueckert and Naybar Reference Rueckert and Naybar2008), characteristics that suggest women should demonstrate less ethnocentric valuation and less moral exclusion. However, both men and women are equally likely to see trade as a zero-sum arrangement with respect to jobs. Based on this combination, women should be especially likely to take effects on “others” into account.
This prediction is borne out in the data. Gender interacts with both experimental treatments. When both the trading partner and the home country gain jobs, women and men are indistinguishable in their trade support both in the US and Canada (see Appendix G for analyses). What these patterns demonstrate is that women are not always more opposed to trade than men are; they are less supportive only when those in other countries are hurt by trade. Women are simply more likely to consider trade’s effect on others when forming opinions about trade policies. By taking into account the fact that trade is dually sociotropic, depending both on perceived effects on the US as well as on trading partners, gender differences become more easily understood.
How Much is One American/Canadian Worth?
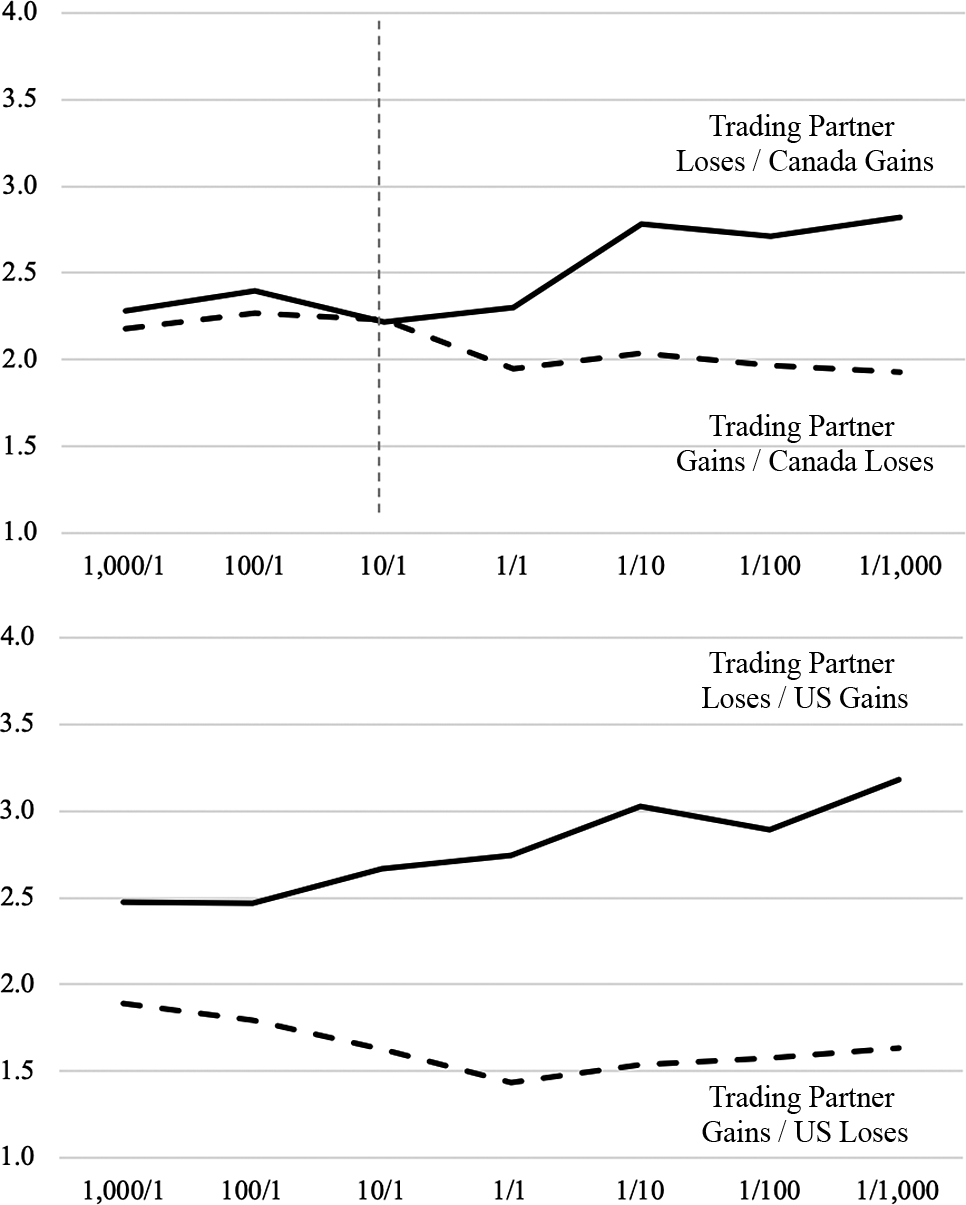
Finally, we address our informal hypothesis that the magnitude of gains and losses will not make much difference to trade support. This analysis also allows us to answer the uncomfortable question of how much one Canadian or one American livelihood is worth in the eyes of its citizens relative to the livelihood of those outside of its national borders. Figure 9 quantifies roughly how many foreigners must benefit for a trade policy to offset the cost of one home-country job loss. As shown by the grey vertical line in the top panel of Figure 9, the answer for Canadians is that roughly 10 jobs gained by foreigners offset the cost of one Canadian job loss in the minds of Canadians. Levels of public support for the trade policy become roughly equal at that point.
How Much is One Canadian or American Job Worth?

However, as shown in the bottom panel of Figure 9, the answer to this question is quite different for Americans. The extent of ethnocentric valuation is far greater in the US; thus, the two lines never cross or even come close to one another. Even when 1,000 jobs are gained in the trading partner country for one job loss in the US, support levels do not equalize. It is, of course, possible that these lines would cross if the scales went further out so that one American job loss corresponded to, say, 100,000 jobs gained elsewhere. However, as numbers get larger and less comprehensible to the average person, we expect, if anything, greater indifference to magnitude. In both the Canadian and American samples, even though the extreme job gains or losses are 1,000 times the level at the center of Figure 9, opinions never change even one point on a four-point scale. Our experimental findings suggest that there may be no extent of gain to trading partner countries that would justify even one American job loss in the minds of Americans.
There is perhaps no greater commodity to most human beings than having a job. Indeed, it is known to be essential not only to physical and material well-being but also to human dignity. As the quintessential instrumental good, one might expect jobs to be highly elastic in the economic sense. Yet when viewed through a moral or ideological lens as is often the case with public policies, jobs are seen as more of a public rather than a private good.
Conclusion
Competition plays a powerful role in most societies (Christiansen and Loeschcke Reference Christiansen, Loeschcke, Wöhrmann and Jain1990). Nonetheless, there is variation in the confidence people have in the laudatory effects of competition (Hayward and Kemmelmeier Reference Hayward and Kemmelmeier2007). Competition always produces winners and losers, but people and societies differ in the extent to which they see the harm that losers experience as a justifiable harm. To be harmed by competition is not the same thing as being wronged by competition (Cornell Reference Cornell2018).
Our results suggest that the perceived desirability of competition plays an important role in conditioning attitudes toward trade. In evaluating trade agreements, we observe greater ethnocentric valuation of co-nationals’ livelihoods in the more competition-oriented country (the United States), among those citizens high in social dominance, those low in empathy, and among those who see trade as a zero-sum policy. All of these operationalizations of competitiveness produce the predicted reactions to experimentally manipulated trade policies. Competition, particularly among those comfortable with unequal outcomes, appears to exacerbate both ethnocentric valuation and moral exclusion.
Reactions to these experimental scenarios were fundamentally different by country. Canadians were more likely to support policies that benefitted both the home country and trading partner countries, whereas Americans were more likely to favor agreements in which strictly the home country benefitted. Highly competitive citizens tend to favor only those trade policies that ensure the home country “wins.” Further, for citizens who value competition, even when the home country does gain, negative reactions are still likely if the home country is not gaining more than the trading partner. A tie game is not a win. Far from viewing trade as a cooperative venture with mutual benefits, for those in a competitive mindset, trade is more like a sports competition in which one must win, lose, or refuse to play the game at all.
An explanation for why Americans are more enthusiastic about competition than Canadians is beyond the scope of this study. Nonetheless, we suspect that several cross-country differences may help account for the fact that Americans are far more enthusiastic about competition, winning, and domination than are Canadians. The US is larger and more geopolitically dominant than Canada. The US is also less dependent on trade. To the extent that American and Canadian character reflects these national differences, it makes sense that Canadians are not swaggering bullies insisting that a “fair” trade agreement be one in which they win and others lose.
The original rationale for trade was simple and something that individuals could relate to in their everyday lives. Adam Smith’s logic was that people can produce more things of value if they specialize in producing specific things rather than trying to do everything themselves. They can then trade what they produce themselves for the other things they need. Based on this simple logic, trade is good for everyone because all will have access to more if we do not try to do it all ourselves.
In contrast to the Smithian idea, the Ricardian logic emphasizes comparative advantage. In this view, different countries have different capacities to produce certain products. As a result, the effects of trade on different groups of people will differ. As consumers, all people should benefit under either logic, but as workers, there will be winners and losers. This popular perspective highlights trading partner countries as competitive out-groups, thus increasing the role that ethnocentric valuation and moral exclusion play in the formation of trade attitudes. While we would be naive to suggest that the public has either Smith or Ricardo specifically in mind, it is clear that once trade is viewed in terms of winners and losers, people will evaluate it differently from when it is viewed as cooperative.
Few would argue with the claim that trade has been a boon to the world economy (Milanovic Reference Milanovic2012).Footnote 15 Collectively, people have benefitted and levels of worldwide inequality have dropped as a result. Nonetheless, when the culture within a country encourages favoring co-nationals in a supposed competition against citizens of other countries, these benefits may not be persuasive. Research on political economy seldom confronts this issue.
After indicating their support or opposition to a given trade policy, our respondents in both countries were asked to comment on what they were thinking with respect to the trade policy they had evaluated. Their responses focused heavily on two themes: the issue of fairness and desert. Interestingly, there was no consensus on what counted as “fair trade” because people had different orientations toward who deserved these jobs. To most respondents, the term “fair trade” did not connote a concern for the treatment of labor or the environment in other countries so much as whether what one’s country received and/or sacrificed in a deal made it a “fair” trade.
For some, particularly those who envisioned less developed countries as the recipients of these jobs, the policy was deemed unfair because it did not benefit the trading partner country enough: “God wants us to love all people, not just ones of our own nationality. All people worldwide deserve the opportunity to provide for their families the best they can.” Fairness for these respondents required lack of moral exclusion: “I just thought, why is anybody from any country any more deserving of a job than another.” Some saw the trading partners as more deserving due to their neediness: “I thought of the third world countries whose children do not have enough food to eat or clean water to drink. They deserve better.”
On the other hand, for those who valued competition, it was perfectly fair that Americans gained and others lost because, as one respondent put it, “The American people deserve more.” As another suggested, “I think the people born in this country deserve the right to make a living and no other country should gain by someone here else [sic] losing their job.” Some clearly indicated that trading partner countries were not in need, stating, “The other countries can support their own, they do not need our jobs and employers in the USA. Need to remember we deserve the jobs and need an income to support our families.”
The comparison of results between the US and Canada makes it clear that it is not inevitable or “natural” that citizens ignore the well-being of out-group members. This begs the question of how Americans came to see themselves as more worthy and deserving of these livelihoods than citizens of other countries. The data in these studies were collected well before President Trump was elected, so we cannot attribute this to his campaign slogans or opinion leadership. The notion that America is unique and special in some regard was encapsulated long ago in the notion of American exceptionalism (Tocqueville Reference Tocqueville1835). However, the meaning of American exceptionalism has gone awry, transmogrified into the idea that America’s past somehow grants it a right to dominance and superiority. If there is no number of livelihoods that could be gained elsewhere that would be worth the loss of even one American job, then Americans are indeed quite complacent.
Finally, this study lends insight into how the psychology of intergroup competition is applicable to international relationships. Because humans are guided by a psychology that is deeply rooted in face-to-face, interpersonal interactions, they are poorly geared to comprehend large-scale, complex systems such as international trade. To deal with this problem, people try to extend what they know about human interaction to understand multinational interactions. For purposes of understanding trade, this approach often does not serve them well. Nations are abstract, distant entities that do not elicit the same levels of empathy and cooperation as do other human beings. Nonetheless, our results suggest that theories and evidence from studies of small group interactions may prove extremely useful for understanding the dynamics of public opinion toward trade.
Supplementary Materials
To view supplementary material for this article, please visit http://dx.doi.org/10.1017/S0003055420000623.
Replication materials can be found on Dataverse at: https://doi.org/10.7910/DVN/57QESD.




Comments
No Comments have been published for this article.