1. Introduction
The world biggest stellarator Wendelstein 7-X (W7-X) will resume operation in the next few years (Klinger et al. Reference Klinger, Andreeva, Bozhenkov, Brandt, Burhenn, Buttenschön, Fuchert, Geiger, Grulke and Laqua2019; Pedersen et al. Reference Pedersen, König, Jakubowski, Krychowiak, Gradic, Killer, Niemann, Szepesi, Wenzel and Ali2019). The ion-cyclotron plasma heating (ICRH) system (Ongena et al. Reference Ongena, Messiaen, Van Eester, Schweer, Dumortier, Durodie, Kazakov, Louche, Vervier and Koch2014) will be installed at it among other new equipment.
The microwave heating at the second electron-cyclotron resonance (ECR) harmonics is the main scenario for plasma production and heating at the W7-X device (Wolf et al. Reference Wolf, Bozhenkov, Dinklage, Fuchert, Kazakov, Laqua, Marsen, Marushchenko, Stange and Zanini2019). The magnetic field range for operation is mostly limited around the vicinity of 2.5 T value because the ECR zone should be present inside the plasma column. There is an option to use heating at third ECR harmonics in the 1.7 T magnetic field (Erckmann et al. Reference Erckmann, Brand, Braune, Dammertz, Gantenbein, Kasparek, Laqua, Maassberg, Marushchenko and Michel2007; Marushchenko et al. Reference Marushchenko, Aleynikov, Beidler, Dinklage, Geiger, Helander, Laqua, Maassberg and Turkin2019). Experiments at this magnetic field are of certain interest. First, they will give a possibility to determine the influence of the magnetic field on plasma confinement, plasma instabilities, equilibrium electric currents, etc. Second, because W7-X mechanical stresses are reduced in this case, it will be possible to study more magnetic configurations. In addition, studying the physics of the electron-cyclotron heating at third harmonics is of interest. The magnetohydrodynamic (MHD) stability studies (Nührenberg Reference Nührenberg2016) and high-beta equilibrium investigations (Geiger et al. Reference Geiger, Beidler, Feng, Maaβberg, Marushchenko and Turkin2015) need more magnetic configuration space of W7-X than is available at 2.5 T.
The first problem of operation at the lower magnetic field (1.7 T) is plasma production. Although plasma production is reliable at the second ECR harmonic, it is not observed at the third harmonic. An alternative possibility is plasma production using neutral beam injection (NBI), which is available at W7-X. The calculations (Gradic et al. Reference Gradic, Dinklage, Brakel, McNeely, Osakabe, Rust and Wolf2015) show a delay of about 5 s between NBI start and full ionization of the neutral gas. This means that during that time almost all beam energy would be delivered to the armour installed at the opposite of the injector wall. The time of 5 s is excessively long and such a plasma production regime would result in unacceptably high thermal load on the armour (Äkäslompolo et al. Reference Äkäslompolo, Drewelow, Gao, Ali, Asunta, Bozhenkov, Fellinger, Ford, den Harder and Hartmann2019; van Eeten et al. Reference van Eeten, Kallmeyer, McNeely, Rust, Hartmann, Schacht, Naujoks, Degenkolbe, Vilbrandt and Boschthe2019).
The radiofrequency (RF) discharge becomes an attractive opportunity in such a situation. Calculations in the paper by Gradic et al. (Reference Gradic, Dinklage, Brakel, McNeely, Osakabe, Rust and Wolf2015) indicate that successful plasma production with the NBI for less than 0.5 s needs a target plasma with a density of 1010–1011 cm−3. Other plasma parameters such as temperature and ion composition are not very important. Thus, the production of such a plasma is a minimum task for the RF discharge. After successful plasma production, the NBI can increase plasma density and temperature (approximately to 500 eV) until the microwave beam can be effectively absorbed at the third harmonic of ECR (Marushchenko et al. Reference Marushchenko, Aleynikov, Beidler, Dinklage, Geiger, Helander, Laqua, Maassberg and Turkin2019).
Note that the RF heating equipment of W7-X has a wide frequency range, 25–38 MHz (Ongena et al. Reference Ongena, Messiaen, Van Eester, Schweer, Dumortier, Durodie, Kazakov, Louche, Vervier and Koch2014), which provides the ion-cyclotron resonance (ICR) for hydrogen ions inside the plasma column at 2.5 and 1.7 T magnetic field. The RF heating equipment also gives a possibility of inner vacuum surfaces conditioning in hydrogen or other chemically active gas atmosphere with an RF discharge.
For plasma production, a scenario was developed and used on Uragan devices with frame antennae (Lyssoivan et al. Reference Lyssoivan, Moiseenko, Shvets and Stepanov1992) and frequencies below the ion cyclotron. This scenario does not fit well with W-7X because its ICRH antenna is of a different type and consists of two vertically oriented straps. The antennae with vertical straps are used at tokamaks for plasma production for wall conditioning purposes (see, e.g., Li et al. Reference Li, Shimada, Zhao, Hu, Gong, Yu and Zhuo2011). In those discharges, the plasma density was below 1 × 1012 cm−3 without full ionization of the neutral gas. A bit higher plasma density and temperature was achieved in at W7-AS (Brakel et al. Reference Brakel, Hartmann and Grigull2001) in a sophisticated two-step two-frequency scenario. Uragan-3M and Uragan-2M (U-2M) have the THT antennae (Lozin et al. Reference Lozin, Moiseenko, Grigor’eva, Kozulya, Krasyuk, Kulaga, Kramskoy, Lyssoivan, Maznichenko and Mironov2013; Moiseenko et al. Reference Moiseenko, Lozin, Kozulia, Korovin, Beletskii, Baron, Grigor’eva, Chechkin, Mironov and Romanov2019) with the  ${\rm \pi}$–0–
 ${\rm \pi}$ phased vertical straps. The experiments on plasma production with these antennae shown that they can produce plasma at a lower magnetic field than the frame antenna when the frequency is equal to the ion cyclotron frequency. This plasma production scenario is characterized by a long gas breakdown time during which there is almost no antenna loading, and low temperature of plasma produced. Thus, for vertical strap antennae, there is a need for a more efficient scenario of plasma production that in addition to plasma production gives the opportunity for successive plasma heating in the same pulse.
As the main gas for the experiments at U-2M, helium is chosen because it is one of the working gases at W7-X (Klinger et al. Reference Klinger, Andreeva, Bozhenkov, Brandt, Burhenn, Buttenschön, Fuchert, Geiger, Grulke and Laqua2019). It is used in glow and ECR discharges for W7-X inner vacuum surface conditioning (Wauters et al. Reference Wauters, Brakel, Brezinsek, Dinklage, Goriaev, Laqua, Marsen, Moseev, Stange and Schlisio2018). Helium ICR discharge was used earlier for vacuum chamber conditioning at W7-AS (Brakel et al. Reference Brakel, Hartmann and Grigull2001), Tore Supra (Gauthier et al. Reference Gauthier, de la Cal, Beaumont, Becoulet, Gil, Grisolia, Grosman, Hutter, Kuus and Ladurelle1997), TEXTOR-94 (Esser et al. Reference Esser, Lyssoivan, Freisinger, Koch, Van Oost, Weschenfelder and Winter1997), HT-7 (Hu et al. Reference Hu and Li2007) and EAST (Hu et al. Reference Hu, Li and Zhao2008).
The goal is to research helium plasma production in the U-2M stellarator device in the ion-cyclotron frequency range and to collect the information needed for W7-X plasma production scenario development.
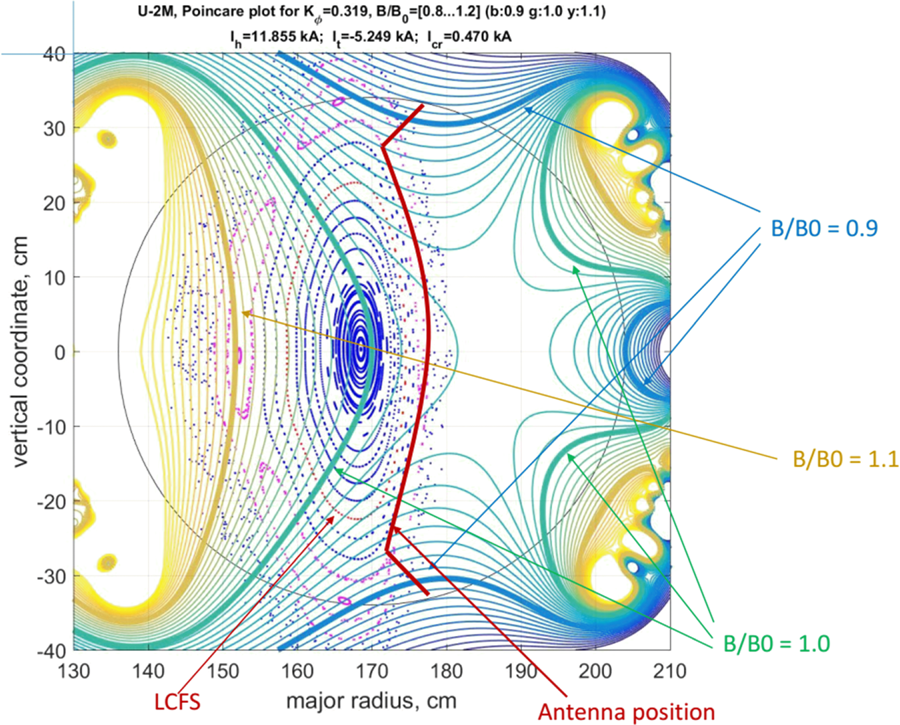
The U-2M experimental setup is chosen to be mostly close to W7-X. Note here that both U-2M and W7-X are stellarators with topologically similar plasma column. The plasma confinement time is longer than the plasma start-up time in both machines. The gas types and pressure ranges are similar. The plasma density is lower at U-2M but still valuable for W-7X. For the experiments, a new W7-X-like antenna is installed at U-2M that has a  ${k_\parallel }$ spectrum of similar shape. The magnetic field module behaviour at the antenna place is important for the plasma start-up scenario chosen. The magnetic field module contours at the antenna location at U-2M are shown in figure 1. They are not very topologically different from the contours at W7-X (Ongena et al. Reference Ongena, Messiaen, Van Eester, Schweer, Dumortier, Durodie, Kazakov, Louche, Vervier and Koch2014).
Poincaré plot of magnetic configuration and contours of magnetic field module at U-2M in antenna location. The circular line shows the vacuum chamber wall.

The present paper gives the experimental results on plasma production at U-2M with a W-7X-like antenna. Section 2 describes the device, the W-7X-like antenna, the diagnostics and the experimental conditions. Section 3 discusses the experimental results of plasma production at the fundamental ion-cyclotron harmonic of hydrogen and gives some theoretical explanation to the experimental data. Section 4 summarizes the obtained results.
2. Description of the experiment
2.1. Experimental setup
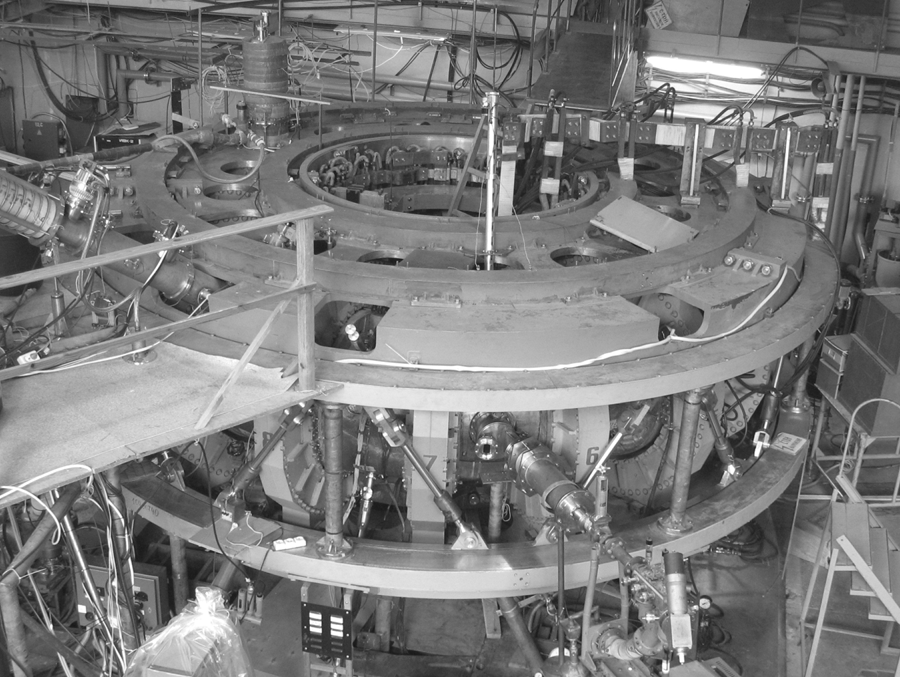
The experiments on ICRF plasma build-up by the W7-X-like antenna were carried out in the U-2M stellarator-type device (see Pankratov et al. Reference Pankratov, Beletskii, Berezhnyj, Burchenko, Chechkin, Grigor’eva, Hartmann, Koch, Konovalov and Kulaga2010; Moiseenko et al. Reference Moiseenko, Berezhnyj, Bondarenko, Burchenko, Castejón, Chechkin, Chernyshenko, Dreval, Garkusha and Glazunov2011; Voitsenya et al. Reference Voitsenya, Shapoval, Pavlichenko, Pankratov, Chechkin, Moiseenko, Lozin, Dreval, Grigor’eva and Konovalov2014; Moiseenko et al. Reference Moiseenko, Lozin, Shapoval, Dreval, Kulyk, Mironov, Romanov, Pashnev, Sorokovoy and Petrushenya2016, Reference Moiseenko, Lozin, Kozulia, Mironov, Romanov, Konovalov and Shapoval2017a). U-2M (see figure 2) was assembled in the early 1990s (Bykov et al. Reference Bykov, Georgievskij, Demchenko, Kuznetsov, Litvinenko, Longinov, Pavlichenko, Rudakov, Stepanov and Tolok1990; Pavlichenko Reference Pavlichenko1993), operated briefly and then conserved. It was renewed and put to operation again at the end of 2006 (see Moiseenko et al. Reference Moiseenko, Stadnik, Schvets, Stepanov, Volkov and Tereshin2007; Beletskii et al. Reference Beletskii, Berezhnyj, Burchenko, Chechkin, Chernyshenko, Grigor’eva, Gubarev, Konovalov, Kulaga and Kurilo2008).
General view of Uragan-2M.

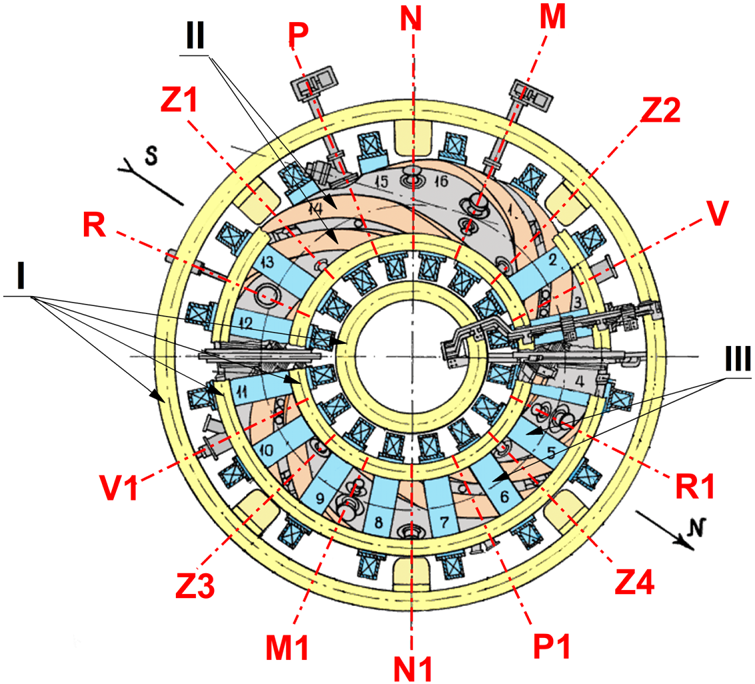
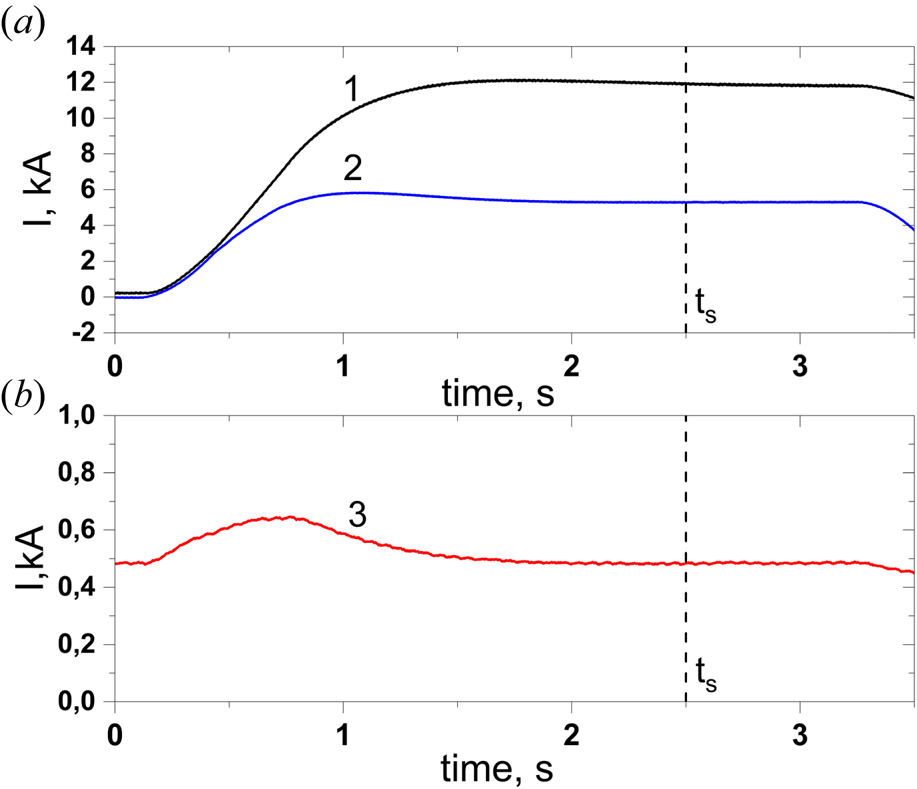
The U-2M scheme is shown in figure 3. The major radius of the device is R = 1.7 m, the average plasma radius is rpl < 24 cm and the toroidal magnetic field at the toroidal axis at present is B 0 < 0.6 T (B 0 = Btt + Bth, Btt and Bth are the toroidal fields produced by the toroidal and helical coils, respectively, the maximum magnetic field with respect to the mechanical stresses is B 0 = 2.4 T). The U-2M magnetic system consists of l = 2 helical coils with four periods (m = 4) in the toroidal direction. The minor radius of the helical coils is rh = 0.44 m. The additional toroidal magnetic field is provided by a set of 16 circular toroidal coils evenly distributed along the torus. The poloidal coil system that consists of eight coils is mainly aimed at eliminating the vertical field induced by the helical coils. It includes four trim (correcting) coils for control of the residual vertical field and four coils for the magnetic island control. Two DC sources are used for power supply for the magnetic system. Each DC source consists of two generators P-22-33-17 K with a peak power of 2750 kW each. The generators are operated in a pulsed mode (see figure 4).
Scheme of Uragan-2M: I, poloidal field coils; II, helical field coils; III, toroidal field coils numbered 1–16. Different toroidal cross-sections are shown by red lines and denoted by capital letters and numbers.

Time evolution of currents in helical (a, 1), toroidal (a, 2) and poloidal (correcting) (b, 3) coils of a magnetic system, where ts is start time of the RF pulse.

In the U-2M stellarator, the RF methods are used to produce and heat the plasma. For this purpose, two RF systems are used: ‘Kaskad-1’ (K-1) and ‘Kaskad-2’ (K-2) (Korovin & Kramskoy Reference Korovin and Kramskoy2012). Both systems operate independently. Each RF system includes the RF generator, the transmission line, the matching circuit, the antenna and the control and diagnostic systems. The RF generators are single-staged and have a push–pull design. They use the GI-26A powerful tubes. Pairs of tubes are connected in parallel at each generator push–pull shoulder with the purpose of doubling the power output without increasing the anode voltage. The generators operate at a constant frequency in the range of 3–15 MHz and provide a pulse duration up to 100 ms. The maximum output power of the generators is about 0.8 MW. The output of the generators is coaxial bipolar. High-frequency power from the generator is delivered to the antenna by the feeder line, which consists of four coaxial cables (the RF cable RK-50-11-13 is used): two in each generator shoulder.
The toroidal vacuum chamber with the minor radius rc = 0.34 m has a volume Vc = 3.88 m3 (without vacuum ports) and the inner surface area of S = 22.8 m2. There are 48 ports used for diagnostics, gas puffing, vacuum pumping, etc. The vacuum chamber is pumped by three turbo-molecular pumps TMN-500 (cross-sections V, Z1 and V1 in figure 2), each has a pumping speed of 0.5 m3 s−1 and is equipped with a liquid nitrogen cryotrap aimed at trapping heavy gas molecules such as water and located between the pump and the vacuum chamber. Exhaust ends of the three turbo-molecular pumps are connected in parallel to the fore vacuum pump AVZ-63D (the pumping speed is 0.063 m3 s−1) through the nitrogen cryotrap. The ultimate residual pressure in the vacuum chamber is 1.1 × 10⁻⁵ Pa. There is a mass spectrometer IPDO-2 of the omegatron type with the omegatron tube RMO-4S for measuring the residual gas partial pressures in the vacuum chamber. To measure the total pressure in the vacuum vessel, the thermocouple PMT-2 and the ionization PMI-2 and PMM-32-1 pressure gauges are used. The puffing of the working gas into the vacuum chamber is made using the SNA-2 stationary gas puff system.
2.2. Two-strap antenna
The U-2M has a history of ICRF plasma production and heating studies. The single and double frame, the crankshaft, the three-half-turn and the four-strap antennae (Pankratov et al. Reference Pankratov, Beletskii, Berezhnyj, Burchenko, Chechkin, Grigor’eva, Hartmann, Koch, Konovalov and Kulaga2010; Moiseenko et al. Reference Moiseenko, Berezhnyj, Bondarenko, Burchenko, Castejón, Chechkin, Chernyshenko, Dreval, Garkusha and Glazunov2011, Reference Moiseenko, Lozin, Shapoval, Dreval, Kulyk, Mironov, Romanov, Pashnev, Sorokovoy and Petrushenya2016, Reference Moiseenko, Lyssoivan, Wauters, Tripský, Lozin, Pavlichenko, Kozulya, Dreval, Mironov and Romanov2017a) were used.
For plasma production studies, the existing vertical strap antenna, the THT antenna (Moiseenko et al. Reference Moiseenko, Lozin, Kozulia, Korovin, Beletskii, Baron, Grigor’eva, Chechkin, Mironov and Romanov2019), could be used. However, it does not excite low k || waves, and this could be an obstacle for plasma production (Lyssoivan et al. Reference Lyssoivan, Douai, Koch, Ongena, Philipps, Schüller, VanEester, Wauters, Blackman and Bobkov2012, Reference Lyssoivan, Wauters, Tripsý, Bobkov, Crombé, Douai, Kreter, Nicolai, Noterdaeme and Rohde2014).
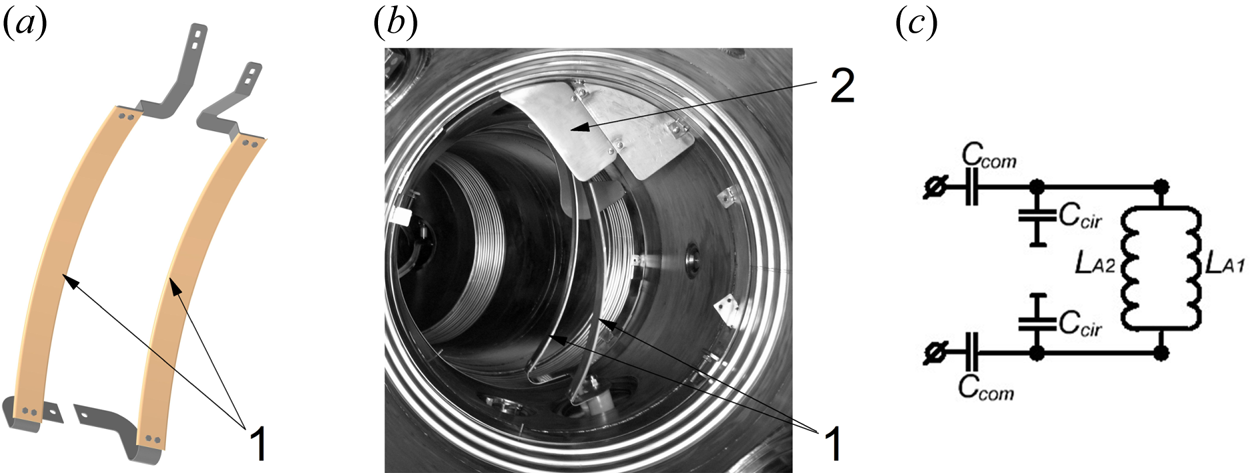
Recently a new two-strap antenna was manufactured and installed at the U-2M stellarator. This antenna is similar in shape to the ICRH antenna of the W-7X and the main difference is that it is smaller. The antenna consists of two parallel poloidal straps (see figure 5a,b) made of stainless steel, 2 mm thick. The strap width is 60 mm and the length is 600 mm. The antenna is installed in the cross-section R1 (see figure 3). Its shape is fitted to the last closed flux surface, and the straps are placed at 10 mm distance from it (the magnetic configuration with K φ = 0.32 is used, where K φ = Bth/(Btt + Bth)). Two antenna straps are oriented perpendicular to the toroidal axis. Part of the plasma column comes too close to the antenna port, and at this place, the small limiters are inserted at both sides of the antenna. The main antenna elements and limiters are covered with titanium nitride film.
(a) Sketch of two-strap antenna, (b) two-strap antenna view in U-2M vacuum chamber (1 denotes straps, 2 denotes antenna limiter) and (c) connection scheme (LA 1 and LA 2 represent the antenna strap electric responses, Ccir, Ccom are capacitors banks).

The two-strap antenna has four feeding points. The antenna can operate in different phasing, monopole or dipole, and be grounded or floating. This, in contrast to the THT antenna, gives more possibilities to control antenna  ${k_\parallel }$ spectrum. The water cooling of the strap feed-throughs allows one to use the antenna in long pulses, up to 0.5 s. In the experiments reported here, the antenna operated in monopole phasing.
One of the electric connection schemes for monopole phasing is presented in figure 5(c). To match the impedance of the feeder line to the antenna, a matching device with a bi-polar L-circuit was used (Hayward Reference Hayward1994). For the dipole phasing, the serial connection of the straps is a possibility.
The RF power is calculated using the amplitudes of the forward and reflected waves in the feeder line measured by the directional coupler, according to the formula
 \begin{equation}{P_{RF}} = \frac{1}{2} \cdot \frac{{|{U_f}{|^2}}}{{{Z_0}}}(1 - |\varGamma|^2),\end{equation}
where Z 0 is the impedance of the transmission line, Z 0 = 25 Ω,  $|\varGamma|$ is the reflection coefficient modulus,
 $|\varGamma| = |{U_r}|/|{U_f}|$,
 $|{U_f}|$ and
 $|{U_r}|$ are the voltage modules of the forward and reflected waves, respectively.
2.3. Diagnostic methods
As for plasma diagnostics, the time dependence of the linear electron density averaged over the line of sight was measured using a microwave interferometer (Pavlichenko, Zamanov & Kulaga Reference Pavlichenko, Zamanov and Kulaga2017, Reference Pavlichenko, Zamanov and Kulaga2018). The operational frequency of this super-heterodyne interferometer is equal to 140 GHz. The critical electron density for this frequency is 2.43 × 1014 cm−3. The interferometer launches the ordinary polarized wave through the horizontal equatorial port along the minor axis of the elliptically shaped plasma in the cross-section R (see figure 3).
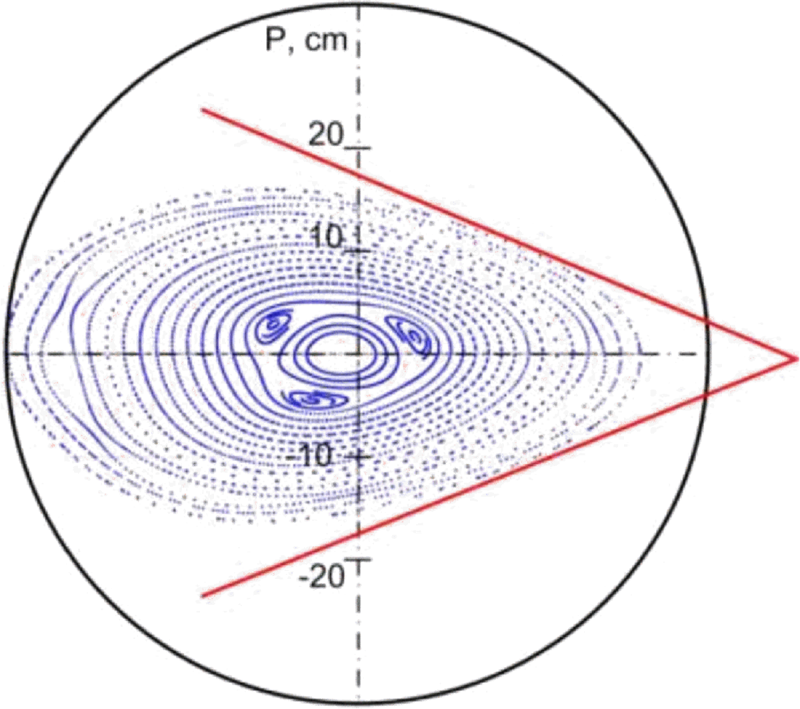
U-2M is equipped with the time-resolved optical emission spectroscopy (OES). OES was carried out using a monochromator-spectrograph SOLAR TII by SOL instruments Ltd, model MS7501i with Cherny–Turner optical scheme and a photomultiplier tube (PMT). The signals from the photomultiplier are amplified by a broadband amplifier and transmitted to the data acquisition system. The OES system has four independent channels. The database (Kramida et al. Reference Kramida, Ralchenko and Reader2019) was used to identify the optical emission lines of atoms and ions. In addition to the integral emission registration, the scanning was made with 41 chords (see figure 6) in cross-section P1 (see figure 3). The chord distributions are measured using a pulse-by-pulse technique.
Sketch of chord measurements.

Signals from the microwave interferometer and OES system are transmitted via the fibreoptic transmission line to the data acquisition system. The data acquisition system of U-2M is based on the high-speed ADC modules L-CARD E-20-10 with maximum acquisition frequency 10 MHz and module L-CARD L-783 that is used only for the acquisition of the data from the RF directional coupler. The magnetic system, the RF system, the diagnostic equipment and the data acquisition system are synchronized with the U-2M timing facility (Lyashchenko et al. Reference Lyashchenko, Ozherel’ev, Reva and Tsibliev2009).
3. Experimental results and discussion
3.1. Discharge characteristics
Helium was chosen as the working gas and hydrogen was always present during our experiments because the U-2M vacuum chamber inner surfaces were pre-loaded with hydrogen. Hydrogen ions are also produced by dissociative ionization of the residual water vapor and desorbed hydrogen-containing impurities from the wall.
The experiments were carried out at a helium pressure p = 0.145 Pa. The magnetic field value was B 0 = 0.347 T, K φ = 0.32, the current in the poloidal correcting coil was Icorr = 470 A. The RF generator frequency was f = 5.15 MHz, whereas the hydrogen cyclotron frequency was 5.27 MHz at the axis of the torus. In this case ω ≈ ωci (H+) ≈ 2ωci (He2+) ≈ 4ωci (He+). K-1 generator anode voltage was up to 7.5 kV. The timing was 10 ms (start), 11 ms (step 1, the first stepwise power increase), 12 ms (step 2, the final power increase) and 24 ms (shutdown). The RF generator anode voltage was varied stepwise as follows: Ua 1 ≈ 0.4⋅Ua at the start, Ua 2 ≈ 0.6⋅Ua at step 1 and maximal anode voltage Ua was set at step 2.
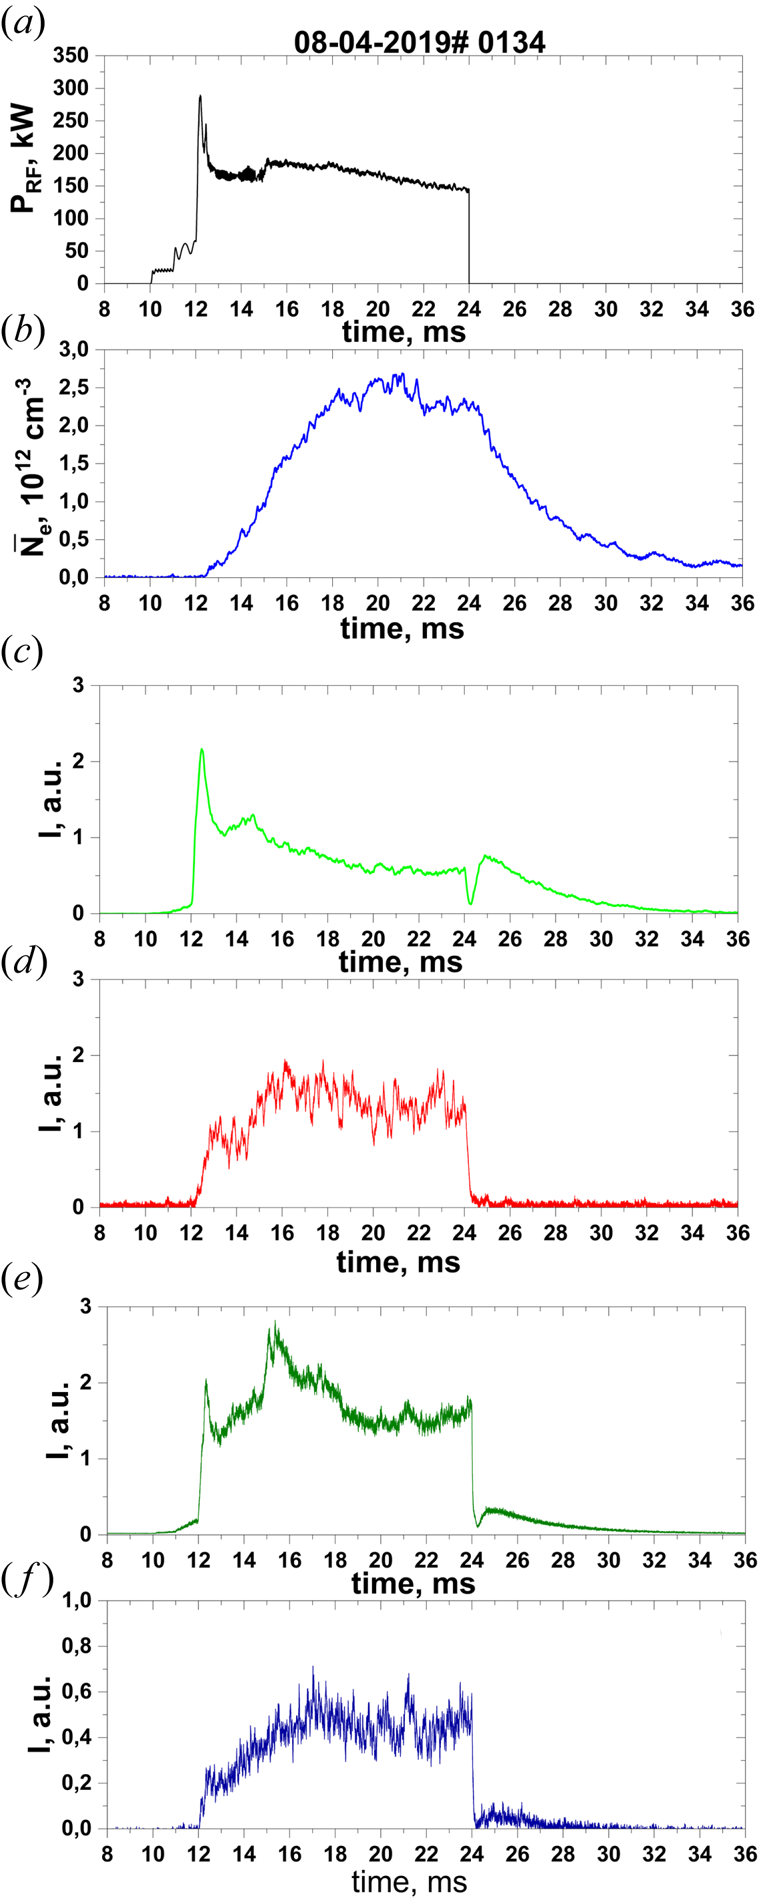
The RF power, the average density, and the spectral line intensities are shown in figure 7. Three stages could be separated in this discharge. The first stage is the plasma production that starts at 10 and ends at 15 ms. Figure 7 shows that the power radiated by the antenna varied significantly: PRF is ~21 kW in the time interval between 10 ms (start) and 11 ms (step 1), PRF is ~65 kW in the time interval between 11 ms (step 1) and 12 ms (step 2). The maximal power ~290 kW is registered after 12 ms (step 2) and later decreases down to ~160 kW. The initial plasma production and the plasma density growth occur at the first stage (the plasma production initial stage is discussed in detail in § 3.2). At the second stage that lasts from 15 to 18 ms, plasma density grows up to 2.4 × 1012 cm−3. The atomic H* (HΔ), He* (He I) spectral line intensities decrease and excited ions He+* (He II), O+* (O II) spectral line intensities increase until certain values. The power fed to the antenna is in the range of 160–190 kW.
Time evolutions of (a) RF power and (b) average plasma density, and optical emission intensities of (c) He I, 447.15 nm, (d) He II, 468.6 nm, (e) HΔ, 410.1 nm and (f) O II, 441.5 nm, where the K-1 generator anode voltage is Ua = 7.5 kV.

The average plasma density changes in the range of (2.2–2.6) × 1012 cm−3 at the third stage that lasts from 18 to 24 ms while power fed to antenna decreases from 184 to 140 kW. Plasma decay begins after RF heating switch-off (24 ms). The average plasma density slowly ramps down with the characteristic time of about ~4 ms. He I, HΔ and O II spectral lines intensities increase during the certain time after the RF heating switch-off, and He I afterglow is the most pronounced. It can be explained by electron temperature decrease and recombination of He+, H+ and O2+ ions with electrons. The absence of He II spectral line afterglow is likely a result of the small He2+ ion concentration in plasma. The ionization energy threshold for He+ ion is 54.4 eV, for O+ is 35.1 eV, for He is 24.6 eV and for H is 13.6 eV (Kramida et al. Reference Kramida, Ralchenko and Reader2019). Thus, effective He2+ generation by electron impact ionization requires a higher temperature than O2+ generation. Note that the spectral lines of the ions O4+ (OV, the ionization energy threshold is 113.9 eV) and C4+ (CV, the ionization energy threshold is 392.1 eV) were not detected in the experiments. This means that the electron mean energy is much lower than the lowest previously cited threshold.
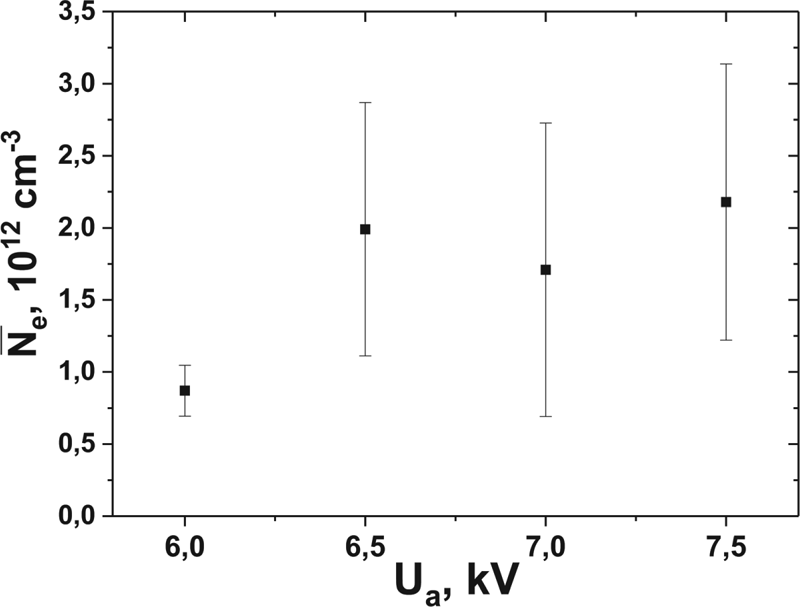
Figure 8 shows the dependency of the maximal average plasma density on the K-1 generator anode voltage. Plasma density does not exceed 1.2 × 1012 cm−3 at voltages lower than 6.5 kV, whereas it is about 2 × 1012 cm−3 at higher voltage. Further increase of the voltage does not result in increasing plasma density. Note that the average plasma density was of the same order as in other experiments for RF plasma production (see, e.g., Esser et al. Reference Esser, Lyssoivan, Freisinger, Koch, Van Oost, Weschenfelder and Winter1997; Brakel et al. Reference Brakel, Hartmann and Grigull2001).
Maximum average plasma density as a function of the anode voltage on the generator K-1.

3.2. Start-up details
Research on the initial plasma production stage of RF discharges in toroidal devices were carried out in experimental (Zaleskij et al. Reference Zaleskij, Kurilko, Nazarov, Plyusnin and Shvets1989; Carter et al. Reference Carter, Lysojvan, Moiseenko, Nazarov, Shvets and Stepanov1990; Lyssoivan et al. Reference Lyssoivan, Hartmann, Noterdaeme, Koch, Bobkov, Blackman, Braun, Cox, de Vries and Esser2005; Moiseenko et al. Reference Moiseenko, Lyssoivan, Wauters, Tripský, Lozin, Pavlichenko, Kozulya, Dreval, Mironov and Romanov2017b, Reference Moiseenko, Lozin, Kozulia, Korovin, Beletskii, Baron, Grigor’eva, Chechkin, Mironov and Romanov2019) and theoretical (Lyssoivan et al. Reference Lyssoivan, Moiseenko, Shvets and Stepanov1992, Reference Lyssoivan, Douai, Koch, Ongena, Philipps, Schüller, VanEester, Wauters, Blackman and Bobkov2012; Moiseenko et al. Reference Moiseenko, Stadnik, Lysoivan and Korovin2013; Tripský et al. Reference Tripský, Wauters, Lyssoivan, Bobkov, Schneider, Stepanov, Douai, Van Eester, Noterdaeme and Van Schoor2017; Wauters et al. Reference Wauters, Borodin, Brakel, Brezinsek, Brunner, Buermans, Coda, Dinklage, Douai and Ford2020) studies. Following these studies, separate plasma production stages can be identified that are characterized by different physical pictures.
The first stage (non-wave stage) is the initial stage of plasma production. Here, the electromagnetic waves do not propagate in toroidal vacuum vessels of fusion devices because of the low charged particle density ωpe < ω (where ωpe is the electron plasma frequency). The neutral gas is ionized by the electrons accelerated in the electric field of the RF antenna. The resulting low-density plasma ( ${N_e} \ll {N_0}$, where N 0 is the density of neutral particles) propagates along the magnetic field lines and practically has no influence on the electromagnetic field structure.
Numerical simulations show transition to a second stage when the wave propagation conditions are met ωpe  $\gt$ ω (Tripský et al. Reference Tripský, Wauters, Lyssoivan, Bobkov, Schneider, Stepanov, Douai, Van Eester, Noterdaeme and Van Schoor2017), that cause an increase of the electron multiplication rate. Here, the plasma produced electrostatic field amplitude is of the same order as the vacuum E || field of the antenna. The plasma is mostly created via electron impact ionization. These collisions are accompanied by a significant electron power loss, which needs to be compensated for via the RF power supply.
At higher densities, the conditions given by the lower hybrid resonance  ${\omega ^2} = \omega _{pi}^2 + \omega _{ci}^2$, the ICR ω = ωci and the fast wave cut-off density
 $\omega _{pi}^2 = (N_\parallel ^2 - 1){\omega _{ci}}(\omega + {\omega _{ci}})$ determine the final radial extend of the discharge as well as the coupling efficiency of the RF power (Lyssoivan et al. Reference Lyssoivan, Douai, Koch, Ongena, Philipps, Schüller, VanEester, Wauters, Blackman and Bobkov2012, Reference Lyssoivan, Wauters, Tripsý, Bobkov, Crombé, Douai, Kreter, Nicolai, Noterdaeme and Rohde2014). Both electrons and ions are heated through collisional absorption of the electromagnetic waves, with the additional possibility for resonant absorption on ions in the case of ICR.
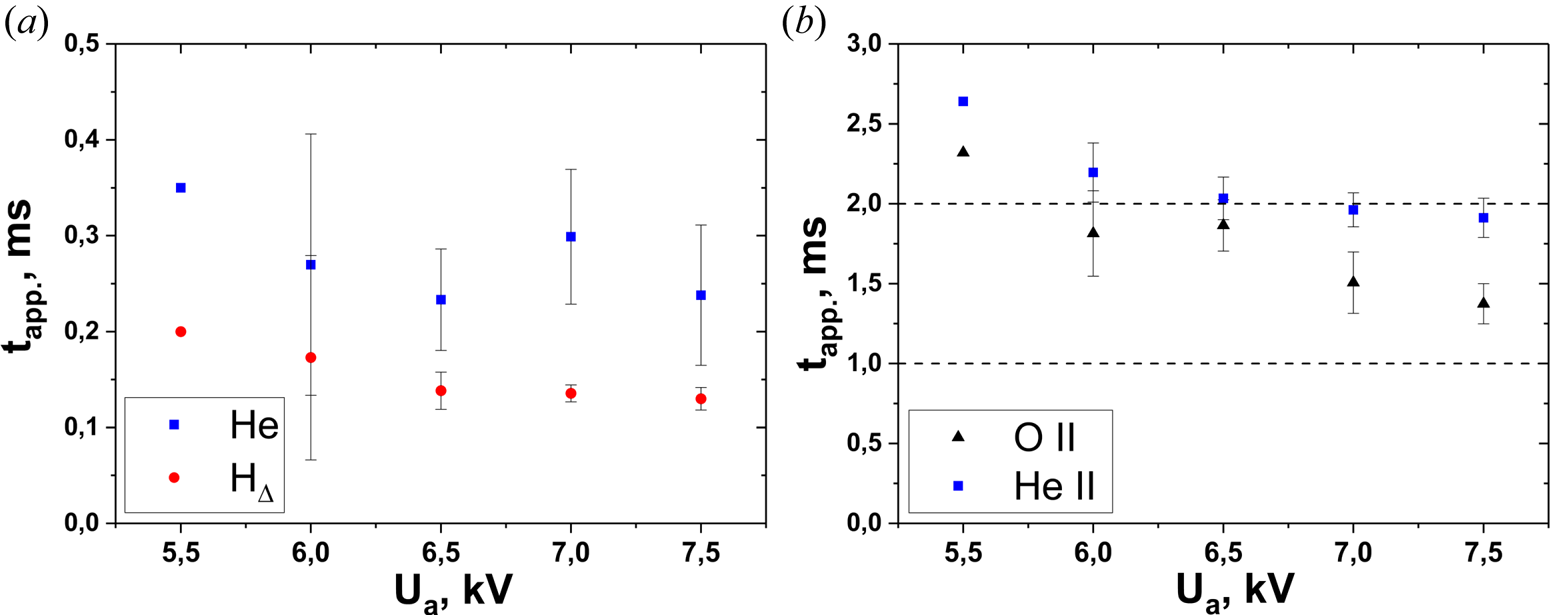
The time of plasma production can be associated with the time of appearance of excited atoms and ions in the plasma tapp. This is the time between RF pulse start-up and the start of the emission signal. Figure 9 shows tapp values for excited atoms and ions of helium, hydrogen and oxygen. As can be seen in figure 9, tapp is different for different optical lines and decreases with RF generator anode voltage increase. The optical emission by excited atoms have weaker dependence of tapp . on Ua than that of the excited ions. The minimal values of tapp are observed for the hydrogen atom optical line HΔ and helium line He I (figure 9a). HΔ has a value of tapp between 0.13 and 0.2 ms, and the He I line has tapp ≈ 0.23–0.35 ms accordingly. The tapp difference between HΔ and He I line is likely a result of different energy thresholds and cross-section value of excitation by the electron impact. For HΔ 410.1 nm and He I 447.15 nm lines, the corresponding thresholds are 13.2 and 23.7 eV accordingly (Kramida et al. Reference Kramida, Ralchenko and Reader2019). Note that atomic hydrogen in ground or excited state appears in the discharge from electron impact with H2 and other hydrogen-containing molecules in the processes of dissociation, dissociative ionization and dissociative attachment (Itikawa Reference Itikawa2001).
Time delay of spectral line emission appearing for (a) helium atoms He I 447.15 nm, HΔ 410.1 nm and (b) ions He II 468.6 nm, O II 441.5 nm as a function of anode voltage of K-1 generator. Dashed lines show time moments of stepwise K-1 anode voltage increase.

In the experiments, H and He I optical line emissions appears at the RF generator step 1 (low-power operation) at time interval from 10 ms (start) to 11 ms (step 1). The RF plasma production start-up occurs in this time interval. Then the second (wave) discharge stage begins. The plasma density increases, and the excited ion lines appear, first oxygen and then helium (figure 9b). Here tapp ≈ 1.4–2.3 ms for O II and tapp ≈ 1.9–2.6 ms for He II. The times tapp cover different RF generator operational intervals. At low anode voltage, these lines appear at step 3 of K-1 operation. With increasing anode voltage, their start times migrate to step 2 (figure 9b). The difference of tapp for excited ions and atoms by an order of magnitude may be explained by a cascade mechanism of ion excitation (Kovtun, Shapoval & Siusko Reference Kovtun, Shapoval and Siusko2019). The corresponding thresholds for the lines O II 441.5 nm and He II 468.6 nm are 26.3 and 51.0 eV, accordingly (Kramida et al. Reference Kramida, Ralchenko and Reader2019). The oxygen atoms and ions appear in the discharge from electron impact excitation of O2 and other oxide molecules (e.g. water) during dissociative electron impact processes (Itikawa Reference Itikawa2001).
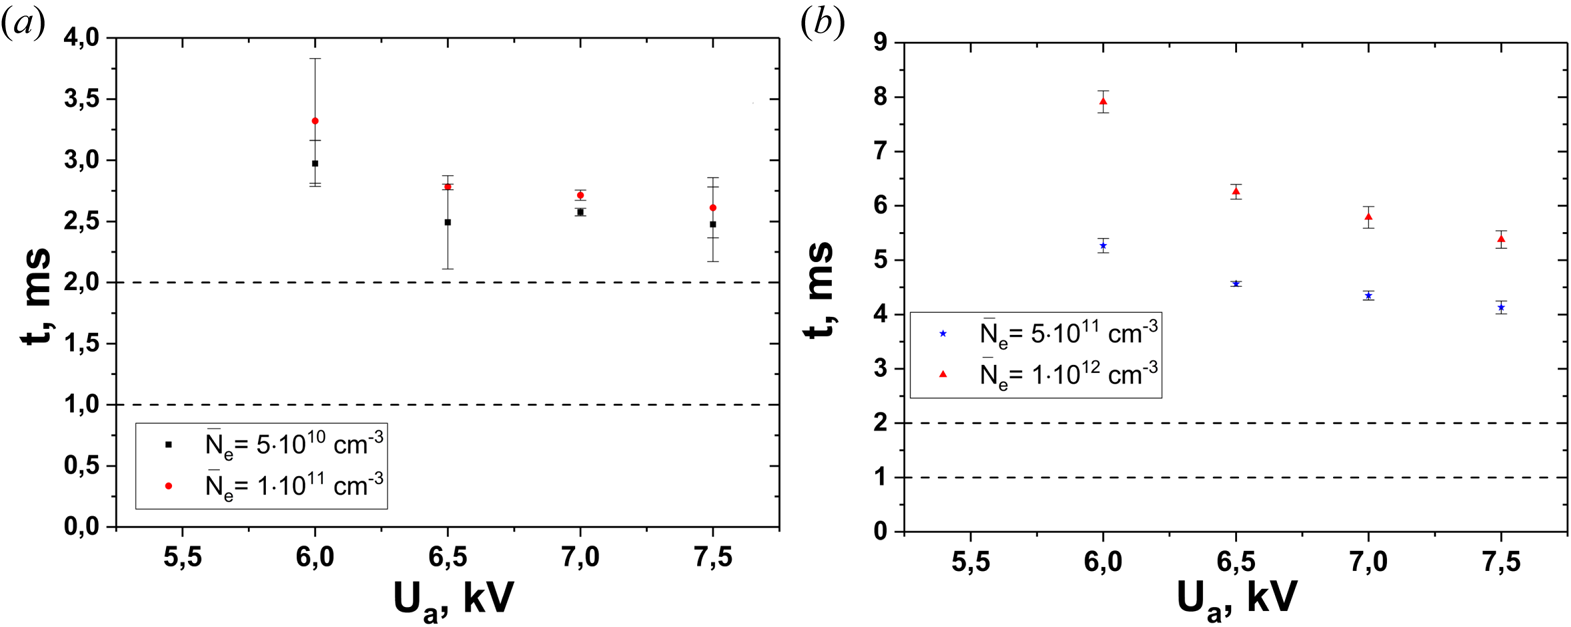
Some time after all the registered lines started to emit, the interferometer signal appears. Figure 10 shows the dependences of time interval needed for the average density to reach a certain value on the RF generator anode voltage. The dependences are ramp-down. They are weaker for low-density values and stronger for high-density values. This is an indirect indication that the electron temperature decreases with the plasma density increase.
Time intervals to reach average plasma density (a) 5 × 10¹⁰ and 1 × 1011 cm−3 and (b) 5 × 10¹¹ and 1 × 1012 cm−3 as a function of the anode voltage on the generator K-1. Dashed lines show time moments of K-1 anode voltage increase.

As can be seen from the data obtained, the production time of the average plasma density of 1 × 1012 cm−3 is less than 10 ms.
The times of appearance the optical line emissions and the times of reaching certain plasma density levels have a tendency to decrease with the anode voltage increase that is typical for the above shots. One can suggest that the electron temperature is higher for the higher anode voltage at the same other conditions. Thus, the inelastic collision rates increase with the electron temperature that happens when the trend of the corresponding rate coefficients is positive. This occurs when the electron energy is not so high, below 200 eV, the energy for the maximum electron impact ionization cross-section for helium (see Sorokin et al. Reference Sorokin, Beigman, Bobashev, Richter and Vainshtein2004).
3.3. Chord measurements
The chord measurements in a shot-by-shot regime for the optical lines He I and He II was carried out at the He pressure p  $=$ 0.145 Pa; magnetic field at the device axis B 0
 $=$ 0.347 T, Kφ
 $=$ 0.318, poloidal correctional coil current Icorr
 $=$ 447 A and K-1 generator frequency f
 $=$ 5.13 MHz. The K-1 generator operated as follows: start at 10 ms, the first power increase at 11 ms (step 1), the second power increase at 12 ms (step 2) and switch-off at 20 ms; the anode voltage was Ua
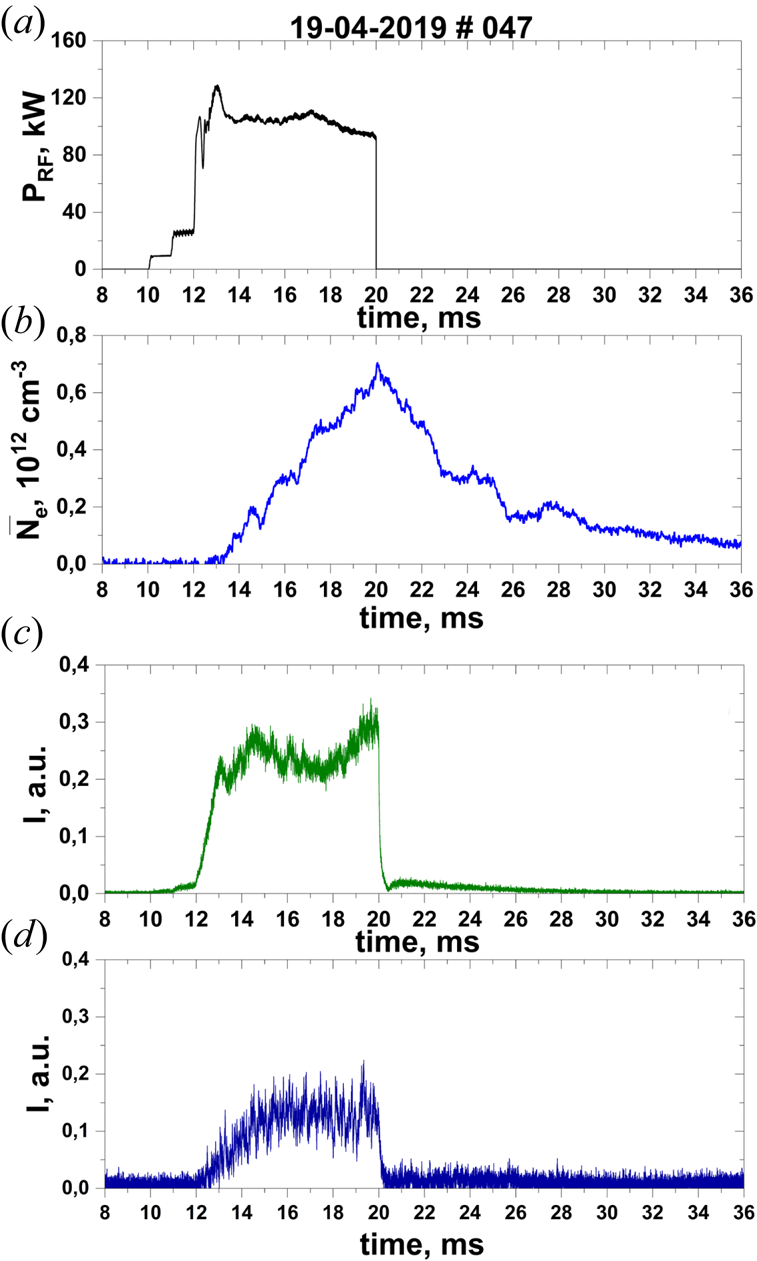
 $=$ 5 kV. The time dependences of RF power, average density and HΔ and O II spectral line intensities for these conditions are shown in figure 11.
Time evolutions of (a) RF power and (b) average plasma density, and optical emission intensities of (c) HΔ, 410.1 nm and (d) O II, 441.5 nm. The K-1 anode voltage is Ua = 6 kV.

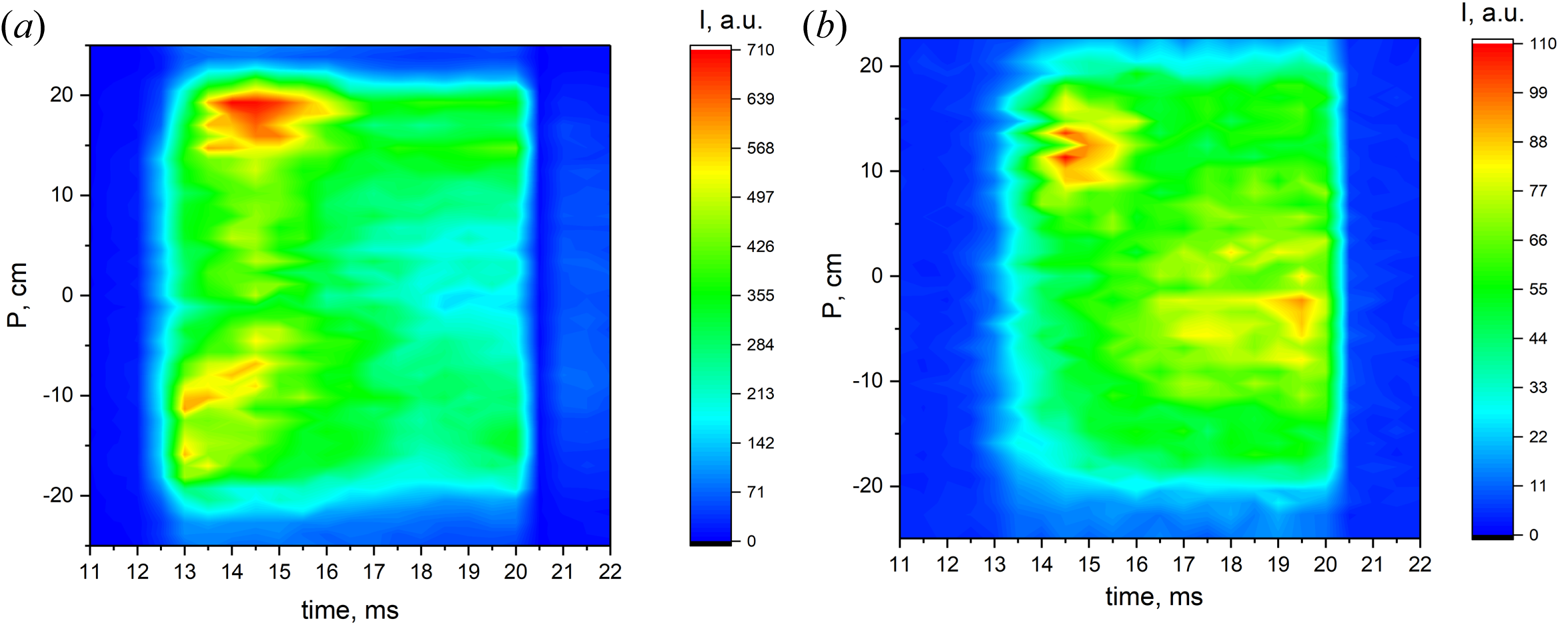
For this experimental series, the location of the chords with reference to the impact parameter is shown in figure 6. The measurement results for the optical lines He I and He II are presented in figure 12. Drawings are of a similar shape despite the fact that in the first case, light is emitted by neutral helium atoms, and in the second case, by ions. As can be seen in figure 12(a,b), the radiation sources have the same dimensions as the plasma column (|P|  $\lt$ 18 cm), with the ion luminescence region being somewhat smaller than that in the case of atoms. It can also be seen that the emission of the He I and He II lines along the chords changes in time, and the dependence of the line intensities on the impact parameter is not symmetric. Note that the average plasma density also changes in time (see figure 11b). Because the plasma production is transient and could be accompanied by plasma non-uniformity along the flux surface, conclusions on the profile shapes are hard to draw in this particular case.
Time evolution of (a) He I and (b) He II chord distribution. He I wavelength is 447.15 nm, He II wavelength is 468.6 nm and P is the impact parameter (see figure 5).

3.4. Discussion of wave propagation
In the studied scenario, the presence of the hydrogen ion cyclotron zone is necessary. Otherwise, the density of plasma produced is lower by orders of magnitude. This allows one to suggest a significant role of hydrogen ions in the plasma production process. Plasma production can occur with ion impact ionization (Moiseenko Reference Moiseenko1980). High ion energy is needed in such a case to effectively ionize the neutral gas; the helium ions ionization cross-section is 10−17 cm2 for 10 keV protons (Janev et al. Reference Janev, Langer, Evans and Post1987). In addition, indirect plasma production mechanism is possible when the hot ions heat the electrons via Coulomb collisions and, then, the electrons ionize the neutral gas. This mechanism is similar to that taking place at plasma production with the NBI. Such a mechanism provides slow plasma production, and the bottleneck is a low ion–electron collision rate (Kaneko et al. Reference Kaneko, Takeiri, Tsumori, Oka, Osakabe and Ikeda2002; Gradic et al. Reference Gradic, Dinklage, Brakel, McNeely, Osakabe, Rust and Wolf2015). In our experiments, the plasma generation delay is small. This means that the electrons obtain energy directly from the RF field.
The RF heating of electrons is connected to the wave processes in the plasma. The helium majority ions generally determine the plasma dielectric response on the RF field. The ion cyclotron frequency for both singly and doubly ionized helium is lower than the RF frequency. The fast magnetosonic wave (FMSW) is propagating in such conditions. It is absorbed poorly by the cold plasma electrons but can be absorbed in the cyclotron resonance zone for the minority hydrogen ions.
The two-strap poloidal antenna can excite the slow wave (SW) less compared with FMSW. However, SW can play an important role in the plasma production process. Its dispersion equation reads
 \begin{equation}k_ \bot ^2 = - \frac{{{\varepsilon _\parallel }}}{{{\varepsilon _ \bot }}}(k_\parallel ^2 - k_0^2{\varepsilon _ \bot }).\end{equation}
Here  ${k_{\parallel}} = \boldsymbol{k}\boldsymbol{\cdot}\boldsymbol{B}/B$,
 $k_{\bot}^2 = {k^2} - k_{\parallel}^2$,
 ${\varepsilon_\parallel} = \boldsymbol{B}\boldsymbol{\cdot} \boldsymbol{\hat{\varepsilon}}\boldsymbol{\cdot }\boldsymbol{B}/{B^2}$,
 ${\varepsilon _ \bot } = (\boldsymbol{r} \times \boldsymbol{B})\boldsymbol{\cdot }\boldsymbol{\hat{\varepsilon }}\boldsymbol{\cdot }(\boldsymbol{r} \times \boldsymbol{B})/ |{\boldsymbol{r} \times \boldsymbol{B}}|^2$, where
 $\boldsymbol{\hat{\varepsilon }}$ is the plasma dielectric tensor, r is the radius vector and B is the magnetic field vector. The longitudinal tensor component is negative
 ${\varepsilon _\parallel } < 0$ in a cold plasma, and SW can propagate in plasma
 $(k_ \bot ^2 > 0)$ where
 $\varepsilon_\bot$
 $\gt$ 0. The SW can be damped owing to the imaginary part of
 ${\varepsilon _\parallel }$ and in this case delivers its energy to the plasma electrons (Lyssoivan et al. Reference Lyssoivan, Moiseenko, Shvets and Stepanov1992). The imaginary part appears owing to the electron binary collisions, mainly with the neutral gas. A contribution to the imaginary part is also made by the Landau damping on electrons, especially at low RF generator frequencies.
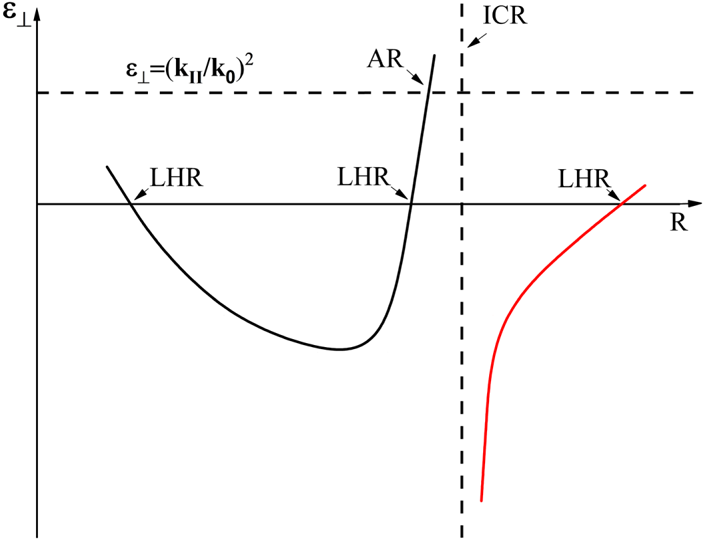
Figure 13 shows the  $\varepsilon_\bot$ behaviour along the major radial chord. There are three zones of SW propagation: two are at the plasma edge and one in the centre of the plasma column. All three zones are ended with zero-valued
 $\varepsilon_\bot$. When
 $\varepsilon_\bot$ → ±0, following (3.1),
 $k_ \bot ^2 \to \pm \infty $, and this is the lower hybrid resonance point. The SW travels in a direction opposite to the
 $\varepsilon_\bot$ gradient and reaches a lower hybrid resonance point where it is fully damped without reflections (Fidone & Granata Reference Fidone and Granata1971; Moiseenko, Wauters & Lyssoivan Reference Moiseenko, Wauters and Lyssoivan2016). At two SW propagation zones at the plasma edge, the plasma properties are determined by the majority ions, helium, and the plasma density corresponding to the lower hybrid resonance can be estimated as Ne ≈ 3 × 109 cm−3 for 5.1 MHz generator frequency. This suggests that the SW propagation zone near the antenna provides plasma production at the early stage of the RF discharge (Lyssoivan et al. Reference Lyssoivan, Wauters, Tripsý, Bobkov, Crombé, Douai, Kreter, Nicolai, Noterdaeme and Rohde2014).
Sketch of  $\varepsilon_\bot$ behaviour along the major radial chord.

The two-strap antenna excites waves with a broad  ${k_\parallel }$ spectrum. It
 ${k_\parallel }$ is large enough,
 ${{k_\parallel } > \omega \textrm{/}{v_{th,e}}}$ (where
 ${v_{th,e}}$ is the thermal electron speed), then
 ${\varepsilon _\parallel }$ changes its sign from negative to positive. The wave propagates inside the plasma column in such a case in the region where
 $\varepsilon_\bot$ < 0, and is absorbed by plasma electrons through the Landau mechanism. The zone between the antenna and the lower hybrid resonance point then becomes the zone of cut-off, and the wave tunnelling comes into play. As plasma density increases, the lower hybrid resonance point shifts closer to the antenna, and the tunnelling becomes better together with the antenna–wave coupling.
A more powerful plasma heating mechanism appears when there is a hydrogen cyclotron resonance zone inside the plasma column. The minority contribution to  $\varepsilon_\bot$,
 $\varepsilon_{\bot\textrm{H}}$, has a singularity at the point of ICR that is cancelled by the collision frequency or the Doppler shift. At a higher magnetic field than the resonant one,
 $\varepsilon$⊥H > 0 and its value can exceed the negative contribution of the majority ions. There, the SW propagation zone appears. It is bounded by the lower hybrid resonance from the left (see figure 13) and a cut-off point from the right, which obeys the condition
 $\varepsilon_\bot$ = (k ||/k 0)2 that can be obtained from (3.1). The cut-off point for SW is the conversion point [Alfvén resonance (AR)] of FMSW to SW. The generated by the FMSW field SW propagates inside the torus according to (2.1), reaches the point of low hybrid resonance (LHR) where it is totally absorbed (Klima, Longinov & Stepanov Reference Klima, Longinov and Stepanov1975).
In two- and three-dimensional non-uniform plasma, the electron heating pattern is more complicated. Following the papers by Hellsten & Tennfors (Reference Hellsten and Tennfors1984) and Moiseenko & Tennfors (Reference Moiseenko and Tennfors1996), in the limit of infinite conductivity of plasma along the magnetic field lines, the conversion occurs near the magnetic surface. The case of finite conductivity was treated numerically in two dimensions for tokamaks (see, e.g., Lin et al. Reference Lin, Wukitch, Bonoli, Marmar, Mossessian, Nelson-Melby, Phillips, Porkolab, Schilling and Wolfe2003). Even in the qualitative sense, the results are doubtfully applicable to our case because the calculations were done for hot fully ionized plasma with a temperature about two orders of magnitude higher than in our experiment.
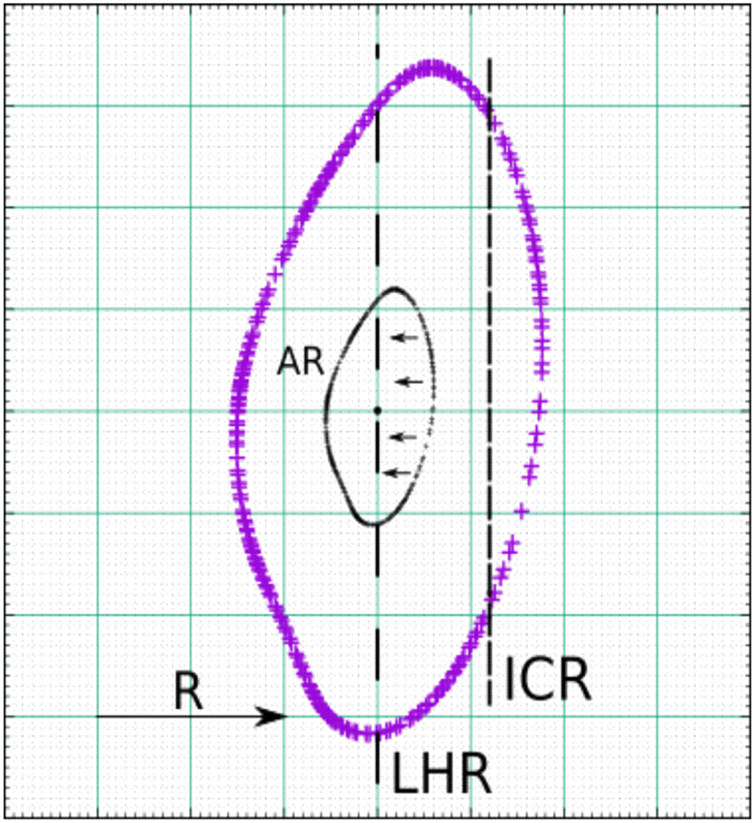
For efficient conversion, it is necessary that this magnetic surface does not intersect the cyclotron zone. Such a heating scheme needs to select a heating frequency lower than ion cyclotron one at the device axis (see figure 14). This is confirmed in our experiment.
Sketch illustrating FMSW conversion into SW in the presence of a minority inside the plasma column.

It is necessary to note that previously described scenario was developed initially for plasma heating and successfully used for this (see, e.g., Majeski et al. Reference Majeski, Rogers, Batha, Budny, Fredrickson, Grek, Hill, Hosea, LeBlanc and Levinton1996). Thus, after plasma production, with higher RF power the scenario could continue for plasma heating.
4 Summary and conclusion
In support of the ICRF experiments planned on the W7-X stellarator, that is, fast ion generation, wall conditioning, target plasma production and heating, a first experimental study on plasma production has been made in the U-2M stellarator using a W7-X-like two-strap antenna.
The first experimental results of ICRF discharges created with the W7-X-like antenna in certain regimes have been presented in this paper. For all the experiments, antenna phasing is a monopole. The W7-X-like antenna experiments with launched RF power of ~100 kW have been performed in helium (p = (4–14) × 10−2 Pa) with the vessel walls pre-loaded with hydrogen. Production of plasma with a density higher than 1011 cm−3 has been observed near the fundamental harmonic of the hydrogen cyclotron frequency. Operation at first hydrogen harmonic is feasible in W7-X future ICRF experiments. In experiments at U-2M, an ICRF plasma with an average density of ~(2–2.6) × 1012cm−3 has been produced.
The discharges of such type have been described and the three stages of discharge development have been identified. The dependences of measured quantities on the discharge parameters have been analysed. The dependence of the final average plasma density on the generator anode voltage (the launched power) saturates at high voltage values. Analysis of the OES data reveals that after the RF power launch, the HΔ line appears first, then the He I line after a small delay. The delay for He II and O II lines is quite long and becomes shorter with increasing RF power. The rate of plasma production is almost independent of the launched RF power at the initial plasma production stage and increases with power at further stages. The chord distribution of He I and He II lines luminosity are almost the same.
In the RF plasma production scenarios, RF generator operation without load is unavoidable. This happens at the initial stage of plasma production and could result in arcing. If the no-load stage is short, the probability of arcing is reduced to negligible values. In the scenario of plasma build-up studied, the no-load time is very small, 2–3 ms.
A short plasma production time indicates that at all stages of plasma production the electrons are intensively heated by the RF field. The SW may play a key role in this. At the initial stage of plasma production, the direct SW excitation by the antenna comes into play. At higher plasma densities, the mode conversion minority scenario of electron heating is realized.
The studied plasma production scenario looks promising and could possibly be used in machines larger than U-2M. The minority of hydrogen in the helium atmosphere is possible at W-7X, and the RF power at 26 MHz is available for a magnetic field of 1.7 T. The topologies of the magnetic field module at the antenna locations in U-2M and W7-X are not so different. In addition, the structure of the antenna currents is similar. If such a scenario could be realized at W7-X, higher RF power is necessary. One could suggest that power is proportional to the plasma volume. Under this assumption, the necessary ICRH power is 0.9–1.8 MW and such power will be available at W7-X.
The same can be said about the experiment on LHD (Komori et al. Reference Komori, Yamada, Imagawa, Kaneko, Kawahata, Mutoh, Ohyabu, Takeiri, Ida and Mito2010). There, for the RF frequency of 38.5 MHz, a 2.6 T magnetic field is available.
Acknowledgements
This work has been carried out within the framework of the EUROfusion Consortium and has received funding from the Euratom research and training programme 2014–2018 and 2019–2020 under Grant Agreement No. 633053. The views and opinions expressed herein do not necessarily reflect those of the European Commission. This work also received funding from National Academy of Sciences of Ukraine (grants P-3-22 and TsV-5-20).
Editor Per Helander thanks the referees for their advice in evaluating this article.
Declaration of interests
The authors report no conflict of interest.