

Lebanon has long been a bastion of electoral democracy in the Arab world. Nevertheless, Lebanese elections are far from clean affairs. Many Lebanese voters view election campaigns not as an opportunity to express their policy preferences or hold their government accountable but rather as a “season for money” in which ballots go to the highest bidder.Footnote 1 How does vote trafficking work in Lebanon? How widespread is the phenomenon? Is it endemic to the Lebanese electorate, or does it concentrate within some subgroups of the population?
Elections in many societies of the developing world often fail to perform their idealized functions of aggregating preferences and holding governments accountable to the will of the people.Footnote 2 Instead, elections frequently reinforce patron–client relationships and offer elites “a means to regularize payments to their supporters and implement punishment to their enemies.”Footnote 3 This article contributes to a lively literature on clientelism by examining the mechanics of vote trafficking, one key subtype of clientelistic transaction that manifests around election time.
Vote trafficking, long “one of the banes of the Lebanese elections,”Footnote 4 is a pervasive phenomenon and an extremely sensitive one. As a consequence, studying the practice has been extremely challenging—most of what we know about it is anecdotal and based on unverifiable “rumors and accusations.”Footnote 5 This article breaks new ground by using a list experiment, a method designed to elicit truthful answers to sensitive questions, embedded within a nationally representative survey of the resident Lebanese electorate conducted in 2009.Footnote 6
The results of the experiment are stark. When asked directly, around one-quarter of the survey respondents admitted to selling their votes. When asked indirectly via the list experiment, however, over half actually sold their votes. Moreover, the evidence demonstrates that the conventional wisdom that vote trafficking concentrates in the Sunni community is unfounded: Sunnis are simply more willing to admit to it. Once we accommodate people's reticence to talk about the phenomenon, we see that members of all sectarian communities and political alliances sold their votes at similar rates in 2009.
The rest of the paper proceeds as follows. I first describe the run-up to Lebanon's 2009 parliamentary elections in terms of the main contestants and the issues around which they framed the contest. Next, I lay out the evolving phenomenon of vote trafficking as a specific form of clientelistic transaction in Lebanon. I then present the results of a list experiment to estimate the prevalence of vote selling in 2009. I conclude with considerations of why vote trafficking remains so persistent in Lebanon and of electoral reforms that could disrupt the practice.
BACKGROUND TO THE 2009 ELECTIONS
Lebanese politics have become increasingly tumultuous since the 2005 assassination of Rafik al-Hariri. The country's fiercely contested 2009 elections represent a particularly focal battle in the ongoing “dual game” struggle between Lebanon's two main alliances—an electoral game in which the March 14 and March 8 forces fought over votes and an institutional game in which they struggled with each other over the rules themselves. As of the 2009 elections, March 14 consisted of the (Sunni) Future Movement, the (Druze) Progressive Socialist Party, the (Christian) Lebanese Forces and Kataʾib Party, and numerous others. The March 8 forces consisted primarily of the two Shiʿi parties, Amal and Hizbullah, along with several small pro-Syrian parties. The Free Patriotic Movement and a few other small Christian parties ran as allies of March 8.Footnote 7
The Independence Intifada of 2005 helped push Syria to withdraw from the country, followed by a victory of the March 14 alliance in the 2005 elections. Since then, a dizzying array of events has buffeted the country, including a series of unsolved political assassinations; the 2006 Israel–Hizbullah war; a long-running opposition sit-in in downtown Beirut; the closing of parliament by its March 8 aligned speaker; and a constitutional vacuum that resulted from the inability of MPs to meet to elect a new president in 2007.
After Hizbullah's May 2008 armed takeover of West Beirut, Arab mediators brought the opposing alliances together in Qatar to resolve—or at least postpone decisions on—several of the ongoing points of dispute. The Doha Agreement elected a consensus president, adopted a modified version of the 1960 electoral law for the 2009 parliamentary elections, and forged a unity government with a “blocking/guaranteeing third” of cabinet seats for the opposition. Electoral posturing began almost immediately. March 14 politicians decried how Hizbullah's weapons had been turned on fellow Lebanese, stated that the majority should be allowed to govern, and declared that they would not submit to a blocking third after the elections. March 8 politicians, for their part, declared that they represented the country's “real majority”—in contrast to March 14's “artificial” or “missing” majorityFootnote 8—and that they would offer the guaranteeing third to March 14 in a postelection government.Footnote 9
The 2009 elections were, consequently, fiercely contested at the national level. Given the closely matched electoral strength of March 14 and March 8, most observers expected just a few seats to separate the eventual winning and losing blocs in parliament, making a unity government all but inevitable. Most obviously, then, the alliances battled over parliamentary seats, which would determine who would name the prime minister and the parties’ relative shares in the cabinet.Footnote 10 The two alliances competed not just for seats in the new parliament, however, but also for supremacy in the popular vote above and beyond how it translated into seats; each alliance sought to demonstrate that it spoke for the country's “real majority.” The popular vote thus became a powerful alternate symbol of legitimacy: one that was measured in raw votes rather than in seats. The more popular support each bloc could register in the ballot boxes, the more leverage it could gain in negotiations over government policy and in the country's national dialogue sessions—particularly in the negotiations over Hizbullah's weapons.
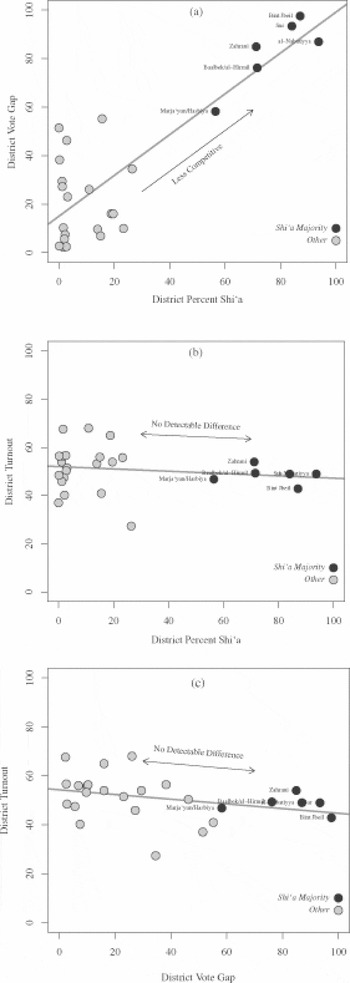
Fierce competition at the national level overlaid significant differences between electoral districts, however. Most parties and observers focused their attention on what they called the “hot” districts in which the outcomes were genuinely uncertain: the Christian districts of Mount Lebanon and Beirut, along with some of the mixed areas such as Zahla and West Bekaa.Footnote 11 District-level electoral returns, in turn, confirmed the widely held views that the demographically Christian and multisectarian districts were the most closely contested, while the Shiʿi districts were the least competitive (see Figure 1).Footnote 12Figure 1a plots the district-level data to illustrate the strong relationship between vote gaps and Shiʿi demography: the more Shiʿi the district, the less competitive the outcome. In fact, so dominant were the joint Hizbullah–Amal lists in the Shiʿi districts that March 14 did not even bother to run slates there. Analogously, March 8 did not run slates in the Sunni districts of Akkar and Miniyeh–Danniyeh; in such uncontested areas, voters had few obvious choices to make with their ballots.Footnote 13
District-level competitiveness and turnout. (a) Noncompetitiveness of Shiʿi districts, (b) turnout and Shiʿi demography, and (c) turnout and competitiveness.

What is puzzling is that voters in such uncontested areas went to the trouble of voting at all. Yet vote they did: there was virtually no relationship between district-level turnout and either Shiʿi demographics or electoral competitiveness (see Figure 1b and 1c).Footnote 14 With the results determined months in advance of the elections themselves, what possible motivations brought voters in uncontested districts out to the polls in numbers comparable to the hot districts? The most charitable interpretation is expressive voting. Hence, the Shiʿa responded to Hizbullah's campaign exhortations to “Resist with Your Vote,” turning out to register their support for March 8 and their solidarity with Hizbullah's militia (“The Resistance,” hence the campaign slogan). March 14 voters, for their part, turned out to vote “Lebanon First,” oppose Syrian and Iranian encroachments, and demand Hizbullah's disarmament. The alternative and less flattering answer is vote trafficking: people turned out because the parties paid them to do so.
CLIENTELISM IN LEBANON
Clientelistic relationships have connected elites to their constituents throughout Lebanon's history.Footnote 15 Patrons trade targetable, excludable rewardsFootnote 16 to clients for their political support—often their votes but also more demanding forms of support such as participating in demonstrations or fighting in militias. Payoffs include not only cash but also food baskets, jobs, mobile phone recharge cards, petrol coupons, scholarships, subsidized medical care, plane tickets, and protection from the law.Footnote 17 Quids pro quo define clientelistic exchanges—in principle, only compliant constituents receive benefits, while nonsupporters do not.Footnote 18
Vote trafficking is a prominent and much maligned form of clientelism, in which elites offer material inducements directly and explicitly in exchange for their constituents’ votes. Vote trafficking is thus “one aspect of the larger phenomenon” of clientelism—a narrow exchange of rewards for votes that is “episodic and election centered” in scope and emphasizes voter-by-voter “retail” transactions.Footnote 19 As a long-standing electoral practice, it fits within the richer story of clientelism in Lebanon.Footnote 20
Lebanon's sectarian power-sharing institutions perpetuate clientelism in Lebanese politics, while its electoral rules provide an environment within which vote trafficking thrives. The country's sectarian system reserves key executive offices to the largest confessional communities and allocates each seat in parliament to a specific sect. Although designed in part to mitigate intersect competition, this emphasis on checks and balances also encourages gridlock and prevents Lebanon's shifting alliances from enacting comprehensive programs. With “policy” largely off the table, politicians instead focus on divvying up state resources and distributing them to constituents.Footnote 21
Lebanese institutions severely restrict politicians’ efforts to implement policy platforms and contribute to the long-running critique that political life in the country is nonprogrammatic. Lebanon has parties but no party system, independents outnumber partisans in parliament, shifting coalitions of elites form on the basis of “Hobbesian motives of self-interest” to play “an endless game of musical chairs” in the cabinet, and short-term electoral alliances combine strange bedfellows that part ways as soon as the ballots are counted.Footnote 22 Although politicians “invariably speak of policies and platforms,” they usually couch their programs in “generalities and enigmatic slogans” that bear the “unmistakable traces of grandiloquent pathos” and promise voters “everything that [is] for their good.”Footnote 23
Lebanese parties, for all their rhetorical veneer, remain highly clientelistic in how they link elites to their constituents. In practice, politicians emphasize, and voters demand, material payoffs and services. One deputy observed that “here, constituents count on MPs to render them services. If they need a job they come to you, if they want to register their kids in school, if they're pregnant and need to get into a hospital . . . It's everything, from A to Z.”Footnote 24 One of his colleagues, in turn, dismissed the possibility that his constituents would judge him on the basis of his platform: “There's no accountability. No one asks what I've done for the last four years. It only matters whose list I'm on, that I went to funerals, that I got someone out of jail, and so on. No one cares about my voting record.”Footnote 25
By focusing on services and deemphasizing programs, most parties operate as nonideological political machines. The lack of credible programmatic content in the parties’ appeals comes out in the many unflattering characterizations of them. Hariri's “degenerate” Future Movement is “destitute of intellectual zeal . . . and lacking deep membership links”; it needs “some sort of program, something more than ‘they killed my dad.’” Amal is a “rickety patronage network” that “does not enjoy good standing even in its own constituency.” The Free Patriotic Movement is full of “middle managers” that support Aoun “for personal reasons”; the March 14 alliance is “just a headline” without a “spirit.”Footnote 26
Ideal-type parties engaged in programmatic competition both aggregate and express citizens’ policy preferences. Parties in Lebanon and throughout much of the developing world, in contrast, build up their capacity to distribute material benefits to constituents and to monitor those constituents’ behavior. To do so, the parties insert themselves deeply into people's social networks by leaning on kinship and sectarian links, organizing machines of their own, collaborating with local notables, and subcontracting with “electoral keys” (roughly analogous to the old “ward bosses” or “precinct captains” of American city machines) to deliver political support in the latters’ bailiwicks.Footnote 27 Politicians use the machines to direct different baskets of rewards to different types of supporters. Some benefits accrue to committed activists between election campaigns as compensation not just for their votes but also for more time-consuming and potentially dangerous services such as recruiting other clients, participating in demonstrations, and serving in militias.Footnote 28 The machines also play a key role in vote-trafficking operations during election time, when the parties attempt to mobilize and persuade weakly committed constituents with material payoffs for their votes.
THE LOGISTICS OF VOTE TRAFFICKING
In this section, I focus on the logistical components of buying and selling votes. I begin by describing the different forms the phenomenon can take—switch buying, turnout buying, and abstention buying. I next explain the incentives for parties to buy from weakly committed voters rather than only from their own activists and core supporters. Finally, I discuss Lebanese electoral rules and practices that help the machines monitor voters in order to confirm that the latter live up to their end of the bargain.
The loose term “vote buying” actually encompasses three related types of purchases that target different voters for different reasons. The first type is switch buying: persuading weakly committed opponents to switch their vote choice. The second type, turnout buying, mobilizes weakly committed supporters to come out to the polls on election day rather than stay home. The final type, abstention buying, demobilizes weakly committed opponents by paying them to stay home rather than turn out.Footnote 29 Anecdotal evidence from the 2009 elections suggests that the parties engaged in all three types of transactions, paying some people to switch their ballots, some to turn out, and some to stay home.
Why this preference for “weakly committed” voters when trafficking in votes? Conceptually, parties can only buy changes to ballot choices or turnout decisions—paying voters to do what they would do anyway in the absence of a payment is not vote buying by definition. Hence, parties focus on voters whose commitments are weak enough that a material inducement can change their minds about their ballot or turnout choices; their strong supporters would turn out anyway, and their intractable opponents would be too expensive to move. One campaign strategist illustrated the calculations behind the parties’ targeting efforts when he observed that “Mr. Kataʾib will vote no matter what, but Mr. Undecided will not if it's a big effort. And he'll decide the election.”Footnote 30 Rather than focus on core supporters (Mr. Kataʾib), competitive pressures push the parties to target unaligned and weakly committed voters (Mr. Undecided).
For vote trafficking to work, parties need to develop the capacity to monitor voters; otherwise, there would be nothing to deter the latter from taking the payoff and then voting as they please. Several features of Lebanese electoral practice contribute to the machines’ capacities to monitor vote choices with considerable precision. One of the most prominent tools is the ballot design itself. Although nominally secret, Lebanon does not use standardized, preprinted ballots (i.e., the “Australian ballot”). Instead, voters, upon entering the ballot booth, either handwrite their chosen candidates on a blank piece of paper and place it in the official envelope or, far more frequently, use one of the omnipresent “suggested” slates distributed by the parties. Figure 2 reproduces example lists from the Beirut first and third districts—note the small size and tiny margins, designed to discourage voters from scratching out names and writing in different ones (Figure 2). Legal regulations prohibit the most obvious markings that could identify ballots; nonetheless, the machines can design their lists to make it easy to match up voters with ballots after the fact. Parties vary, for example, the order of candidates on the list, the font choice and size, and titles or honorifics for the candidates.
Electoral lists, Beirut first and third districts.

As an illustration, officials of the Lebanese Association for Democratic Elections (LADE) recounted some of the ballot permutations that were possible in the 2007 by-elections in the district of al-Matn, in which former President Amin al-Gemayel narrowly lost to an Aounist challenger.Footnote 31 Ballots could read, in full, “His Excellency the President Shaykh Amin Pierre al-Gemayel.” They could include his name with or without “Pierre” (the patronymic), with or without “Shaykh” (the informal honorific), or with or without “President” (the formal title), or they could write either “His Excellency the President” (the formal honorific) or just plain “President.” This example applies to many other candidates, whether titled shaykh, wazīr, nāʾib, muhandis, muḥāmī, duktūr, or ustādh.Footnote 32
Ballot counting at very low levels of aggregation complements the identifiability of the ballots themselves. Individual voters are assigned to ballot boxes by extended family codes, with between 250 and 300 voters on average assigned to each box. Party representatives sit in the room all day observing the proceedings and in fact usually comprise one- to two-thirds of the actual polling officers that administer the balloting.Footnote 33 At the end of the day, the ballots are counted in the rooms in which they were cast before a full audience of party representatives, usually with laptops open to display the voter rolls in spreadsheet format. The head polling officer opens each ballot and places it on an overhead projector, which magnifies it onto a projection screen so that everyone in the room can confirm the vote choice.Footnote 34
These and other practices enable the electoral machines to observe individual vote choice with a high degree of precision. Systematic variations in ballot layout, assignment to ballot boxes by family code, and counting at low levels of aggregation that make it feasible to track the ballot variations combine to create a situation in which, as a senior LADE official remarked, the parties and candidates “can know, within a person or two, how an entire [extended] family voted.” The certainty with which vote buyers can conduct their transactions has, in turn, contributed to a widespread and lively vote market, allegedly worth hundreds of millions of dollars in an electorate of just over three million people.Footnote 35 These processes should not, however, be taken as prima facie evidence that the machines are necessarily strong-arming innocent and unwilling voters. Instead, many people willingly collude in the vote trafficking; families organize to vote as a bloc, for which the price paid per vote is higher.Footnote 36 One former candidate recalled of his experiences on the campaign trail: “Communities would organize to sell votes . . . I would go into neighborhoods and give my spiel. They would come up to me afterwards and say, look, we've got 260 votes and we need money. If you can't give it to us, we don't want to waste your time.”Footnote 37 The Lebanese state traditionally provides minimal services to its citizens; many constituents thus view the campaign season as one of the only times they can benefit from the political process. As one nongovernmental organization observer remarked, “It's not just the vote buying, it's the vote selling. People hold out for the most money . . . it's part of the culture, and it's directly related to the weak state that doesn't provide services.”Footnote 38
These electoral rules and practices often puzzle outsider observers but benefit the vote traffickers who write the laws under which they buy votes. One experienced but thoroughly startled foreign expert simply remarked that “I've never seen anything like this anywhere.” Another bemused elections expert called the electoral practices “rubbish, appalling, truly shocking” and concluded that “there's something about Lebanon where the universal world applies except elections.” In contrast, senior LADE officials note that “there's a backwards, archaic system for a purpose”: eliminating the practices that so amaze foreign technocrats “would make vote buying harder. No rich person is going to invest money in something without guarantees of returns.”Footnote 39
Virtually all Lebanese can recite stories about one party or another approaching people in their neighborhoods with illicit offers, but far fewer would admit to selling votes themselves. Conventional wisdom suggests that vote trafficking is pervasive and “acknowledged by all observers,” yet “no one knows exactly the extent” of the phenomenon.Footnote 40 A think-tank director observed that “it's a free-for-all . . . it's hard to say, but of the votes cast, 40, 50, 60 percent are bought, maybe 70 percent.” As senior officials in the Lebanese Transparency Association lamented, however, “vote buying is [very hard] to verify. It's mostly based on rumors and accusations . . . [it's] occurring in both services and cash, [and] it's very hard to validate.” Moreover, as the interior minister acknowledged, “electoral money is an epidemic about which there is a lot of talk, but there is rarely evidence.”Footnote 41 In the next section, I describe a survey research method that helps in collecting some of that rare evidence.
SENSITIVE TRANSACTIONS
Vote trafficking is extraordinarily difficult to study systematically due to its sensitivity. One scholar acknowledges that vote selling is likely to be much more extensive than survey research would imply because people are “understandably reluctant to admit that they had been approached with a forbidden offer, especially if they had subsequently entered an agreement and complied with its terms.” Another team of researchers concurs that “people who receive handouts and assistance from parties may be reluctant to acknowledge this and to acknowledge that the handout influenced their vote.”Footnote 42
In the absence of a way to neutralize the incentives for people to misrepresent themselves, we both underestimate the prevalence of vote trafficking and misjudge those among whom it is more or less pervasive. Fortunately, a method known as the list experiment has emerged as a promising technique to elicit truthful answers to sensitive questions by providing people with anonymity in their responses. The technique has been used extensively in the social sciences, including in studies of racism, sexism, and anti-Semitism in American society, electoral violence in Africa, and vote buying in Latin America.Footnote 43
The list-experiment data collection procedure, as applied here, works as follows. A randomly selected group of survey respondents (the “direct” group) receives a list of three nonsensitive yes/no items that may have influenced their votes (e.g., discussions with friends) and responds with yes/no answers. The other survey respondents (the “list group”) receive the same list plus one additional sensitive item related to vote selling and answer with a count of how many of the items influenced their votes, without specifying which ones. Answering with a count transparently provides respondents with anonymity on their answers to the sensitive item about vote selling. Hence, for example, an answer of “two” (out of the four items) does not reveal if the vote-selling item was one of the two items that influenced the vote. Yet, by comparing the aggregate responses from the direct and list groups, we can nonetheless learn about the prevalence of vote selling in the population, even though by design we do not know what the individual responses are.Footnote 44
I embedded a list experiment in a nationally representative survey of the resident Lebanese electorate conducted shortly after the June 2009 elections. The 2,500 interviewees were sampled randomly from each of Lebanon's thirty administrative districts (cazas) proportional to district population size and were interviewed face to face by members of the same sex and religion.Footnote 45 I began by randomly assigning half the respondents to the direct-question group and the other half to the list group.Footnote 46 The question itself began with a prompt delivered to both groups: “People decided who to vote for based on a lot of different reasons. I'll read you some of the reasons people have told us: please tell me if they influenced your decision to vote or your decision over who to vote for.” Respondents heard a list of four common influences on vote choice. Three of the items—newspaper coverage, platforms, talking with friends—were nonsensitive, while the other was sensitive. The four items were presented in this order, with the sensitive item (in italics) presented third:
• You read newspaper coverage of the campaign regularly.
• You read the candidates’ campaign platforms thoroughly.
• Someone offered you or a relative personal services [al-khidamāt al-shakhṣiyya], a job, or something similar.
• You and your friends discussed the election campaign and the candidates.
Respondents in the direct-question group gave yes/no answers to each of the list items one by one. Those in the list group received these additional instructions: “I'm going to read you the whole list, and then I want you to tell me how many of the different things influenced your choice. Don't tell me which ones, just tell me how many.” List-group respondents then gave a single count of list items that influenced their vote choice.
The nonsensitive items tap into routine aspects of electoral campaigning that are not politically delicate. The item of interest on vote selling cites al-khidamāt al-shakhṣiyya (imperfectly glossed in English as “personal services”), the local catch-all term for material payoffs received in exchange for votes.Footnote 47 Rather than being told whom they voted for specifically, we learn about whether or not clientelistic payoffs, of whatever kind, influenced voters’ decisions.Footnote 48
Among respondents who answered the direct questions about what influenced their votes, 37 percent answered positively for newspaper coverage, 42 percent for campaign platforms, and 53 percent for discussions with friends. In addition, 26 percent of the direct-question group admitted that offers of “personal services,” jobs, and other such inducements influenced their votes. Although this figure is substantial, it is roughly in the neighborhood of the upper bounds found in studies of vote trafficking elsewhere in the world.Footnote 49 Obviously, the figure only represents the proportion of Lebanese who are willing to admit to selling their votes, not how many actually do so. But by leveraging the information we gain from the direct-question group's responses to the nonsensitive items, we can infer from the treatment group how many Lebanese actually sold.
WHO SELLS THEIR VOTES?
How many people sold their votes? To analyze the experimental data, we momentarily set aside the direct-question group's responses to the sensitive item on vote selling and add up their responses to the three nonsensitive items. We then compare the average count from the direct-question group to the average count for the list group on the full list of four items. Because the four-item treatment count includes one more item (vote selling) than does the three-item control count, the difference in group averages falls between zero and one and represents the proportion of the treatment group that said “yes” to vote selling. The average count in the direct-question group was 1.29, and the list group's was 1.84, yielding a difference of 0.55 plus or minus some random sampling variation. We can thus infer that about 55 percent of the Lebanese electorate engaged in vote selling (see Figure 3).Footnote 50
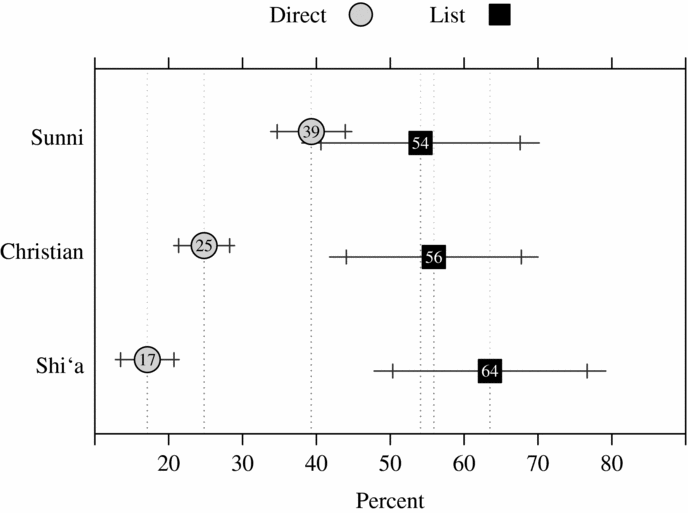
Admitted versus actual vote selling for the aggregate population. The grey circle indicates the estimated proportion of the electorate that admitted to vote selling, based on the direct-question group's responses to the sensitive question. The black square reports the analogous figure for actual vote selling based on the anonymous responses of those in the list-question group. The horizontal bars denote the conventional 95 and 90 percent confidence intervals around the estimates, the latter of which are indicated by the vertical bars.

Figure 3 summarizes the two key outcomes of interest. First, the grey circle indicates the estimated proportion of the electorate that admitted to vote selling, based on the direct-question group's responses to the sensitive question. Second, the black square reports the analogous figure for actual vote selling based on the anonymous responses of those in the list-question group. The horizontal bars denote the conventional 95 and 90 percent confidence intervals around the estimates, which are indicated by the vertical bars.Footnote 51Figure 3 reveals that more than twice as many people acknowledged selling their votes when given the opportunity to do so anonymously as were willing to admit it openly—55 versus 26 percent, respectively.
In the aggregate, then, over half of the resident Lebanese electorate sold its votes. The proverbial elephant in the room, of course, is whether or not there are any noticeable differences between key demographic and political sub-groups. Politicians across sects and on both sides of the March 14/8 divide accused each other of vote trafficking ad nauseam. Nonetheless, the Sunni community, and by extension the March 14 alliance, faced more (and more bombastic) allegations due to the size of Hariri's personal fortune and his connections to Saudi Arabia. The question, though, is whether vote trafficking actually concentrated in these sub-groups as their detractors contended (Figure 4 and Figure 5).
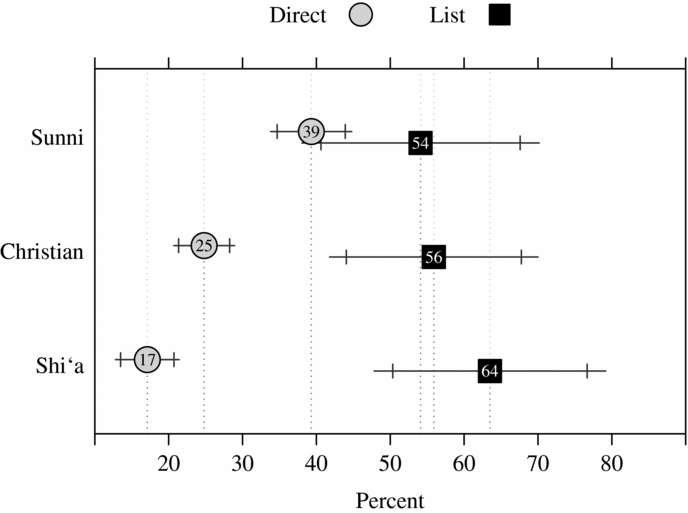
Admitted versus actual vote selling by sect. Grey circles indicate answers to the direct question, and black squares indicate anonymous responses from the list group.
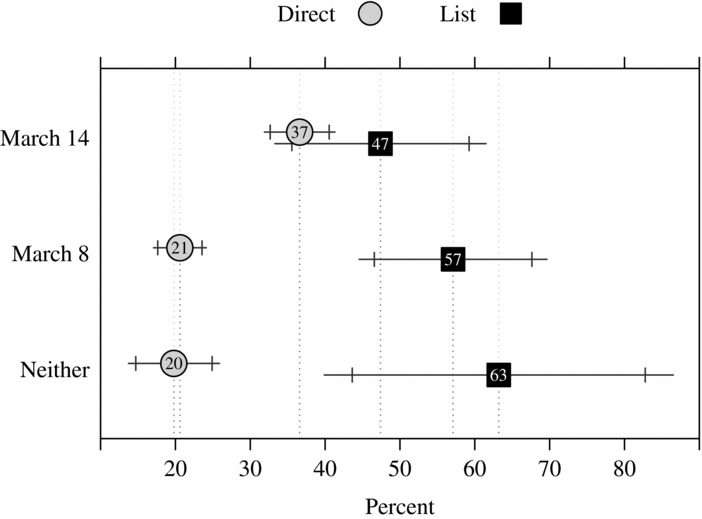
Comparisons of March 14, March 8, and unaligned voters. The grey circles indicate the answers to the direct questions, and the black squares indicate anonymous responses from the list group.
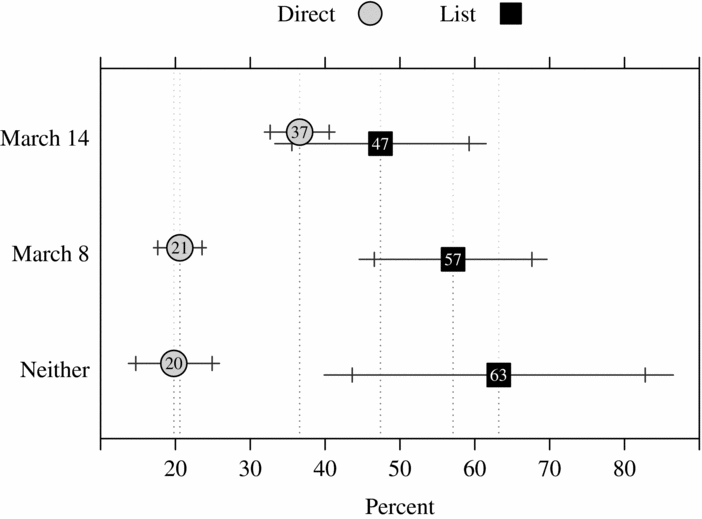
Figure 4 compares the three largest confessional communities. Answers to the direct question (grey circles) buttress the campaign rhetoric: a substantially higher proportion of Sunnis (39%) were willing to admit to selling votes than were their Christian or Shiʿi counterparts (25% and 17%, respectively). Anonymous responses from the list group (black squares), however, tell a dramatically different story. Members of all three communities are considerably more likely to sell their votes than they are to say they did so, and the disparity between Sunnis and Christians evaporates (54% and 56%, respectively, actually sold votes). Shiʿi respondents are nearly four times more likely to sell than they are to admit to it (64% versus 17%).Footnote 52
Figure 5 reports comparisons of March 14, March 8, and unaligned voters. These findings are a variation on the same theme from the sects. Answers to the direct questions (grey circles) conform to the campaign rhetoric that a substantially larger proportion of March 14 voters (37%) trafficked in votes than did either March 8 or independent voters (21% and 20%, respectively). Once again, however, the story changes dramatically when we examine the anonymous responses from the list group (black squares). All constituencies are noticeably more likely to sell than to admit it. Moreover, these data hint that higher proportions of March 8 voters (57%) and especially unaligned voters (63%) sell votes than their March 14 counterparts (47%); the confidence intervals around these estimates, however, are sufficiently wide that we should view these differences as no more than suggestive.Footnote 53
IMPLICATIONS OF THE FINDINGS
There are several important observations to take away from the list-experiment findings. The first and most obvious point is that voters are far more likely to sell their votes than they are to admit to it. Taking them at their word consequently means that we are likely to draw conclusions that dramatically miss the mark. To be more specific, we would underestimate how much vote selling occurs in the aggregate by a factor of two.
Second, some groups find vote trafficking to be significantly more sensitive than others. Conventional wisdom holds that March 14 supporters in general, and Sunnis in particular, are by far the most likely to sell their votes. Answers to the direct question conform to this expectation, but the anonymous responses via the list turn the conventional wisdom on its head, by showing that these voters are simply more willing to talk about it. More broadly, the list experiment reveals that high rates of vote trafficking prevail in all of the communities. These results suggest that no group enjoys a privileged standing in electoral ethics, notwithstanding the fiery rhetoric of various political leaders.
Finally, the list experiment raises questions about electoral dynamics within the Shiʿi community. When asked the direct question, Shiʿi respondents were the least likely to admit to selling their votes (17%). When given the opportunity to answer anonymously via the list, however, this rate nearly quadrupled to 64 percent—the highest of the three communities. Combined, these dynamics suggest that both vote trafficking and sensitivity are particularly pronounced among the Shiʿa. Several factors could contribute to explaining these dynamics, including the community's history of poverty and marginalization, voter intimidation by the two main Shiʿi parties, and the lack of competition in most Shiʿi districts.
The Shiʿi community has historically been the poorest and most marginalized in Lebanon. Studies of clientelism in general and vote trafficking in particular emphasize that parties prefer poor voters with low asking prices; Shiʿi poverty could therefore help to explain the high rate of vote selling. However, while the Shiʿa were indisputably Lebanon's poorest community at independence, they have progressively closed the socioeconomic gap with their counterparts in the other confessional communities.Footnote 54 Survey evidence reveals that the Shiʿa are, on average, somewhat less wealthy than Sunnis but equally if not better educated.Footnote 55 Community-level differences are slight, however, and additional analysis shows that socioeconomic differences on the individual level do not account for the observed differences in rates of selling between communities.Footnote 56
More marginalized voters may also be less trusting of outsiders and therefore less willing than their peers to confess to illicit activity; distrust could help to account for the wide gap between admitted and actual behavior. Shiʿi respondents are less trusting of government and of outsiders than are other Lebanese.Footnote 57 It is conceivable that this higher level of distrust could help explain the degree of prevarication among Shiʿi respondents; it is difficult to imagine how it could affect the rate of vote selling, however.
Voter intimidation could alternately help to explain Shiʿi reticence in discussing vote trafficking. In general, parties and candidates “try to make voters afraid” by telling them “that they can see everything, and they had better [support] them or there will be trouble.”Footnote 58 It is not surprising that Amal and Hizbullah officials dismiss allegations of intimidation. March 8 detractors, however, have cited direct and indirect forms of pressure in the Shiʿi areas and particularly in Hizbullah strongholds. One argued that “we shouldn't have elections until we solve the guns problem. It's unfair, and I'm speaking from the Shiʿi context. Could an independent Shiʿi run against [Amal leader] Berri and win? Not in the presence of guns.” Another explained: “You don't have to put a gun to people's heads, you only have to live in that area . . . [Hizbullah is] intelligent enough to give the impression that everything is normal there. But . . . people know that Hizbullah's security is there, even if discrete, and they behave as such.” Yet another stated that the problems that the Shiʿa could face include “violence as well as daily life issues.”Footnote 59 The latter include harassment of family members, restricted access to basic services, and concerns about livelihoods—particularly in localities dominated by the two parties. We should take care not to accept the hardly disinterested complaints of March 14 proponents uncritically, of course. To the degree they are accurate, though, fear of reprisals may be one reason why Shiʿi respondents were especially reticent to discuss vote trafficking openly.
It is intriguing that the lack of competition in many Shiʿi districts may have required the March 8 parties to buy more rather than fewer votes there. Depending on how one counts, half to three-quarters of Shiʿi voters live in districts dominated by the Amal–Hizbullah alliance.Footnote 60 March 8 dominance in these districts not only meant that who would win the parliamentary seats was a foregone conclusion but also removed the incentive for voters to bother casting their ballots at all. In effect, the 2009 contest was not just about seats but also about who spoke for the “real” majority, and a 20 percent turnout in the Shiʿi areas would not be read as a vote of confidence in March 8 or of solidarity with Hizbullah's militia. These combined dynamics in addition to the list-experiment results suggest that the Shiʿi parties bought a great deal of turnout in their electoral strongholds. One should not take widespread turnout buying to mean that the Shiʿa oppose March 8, of course, but rather that Shiʿi support for the alliance is considerably less zealous than is commonly portrayed. In this regard, the Shiʿa are more similar to their peers in the other confessional communities than Hizbullah and Amal leaders would likely care to acknowledge.
FAIR BUT DECIDEDLY NOT FREE
Were the elections fair, then? In one respect, yes—according to the “Wild West” rules that the contestants themselves had established. The two alliances had consented in 2008 to the president's choice of a neutral interior minister with impeccable democratic credentials, and the 2009 elections were among the few in Lebanese history in which the state acted as an impartial referee rather than an interested party. The two alliances thus enjoyed roughly the same amount of leeway to bend (or break) the rules that they themselves had written, and both received substantial foreign funds to help with their campaigns. As a former cabinet minister caustically observed, “In a system where you're buying half the electorate, you can still be free” according to widely used measures of democracy.Footnote 61
So what if they sell? While the Lebanese elections may have been a fair if not particularly genteel fight between the two main contestants, there can be little optimism about the degree to which the results reflect the will of the voters. In performing the idealized functions of aggregating preferences and expressing the will of the people, Lebanese elections are deeply flawed. From a normative perspective, it is difficult to imagine any Lebanese seriously taking pride in a process through which over half the electorate sold its votes. Beyond any normative discomfort, however, vote trafficking of this magnitude raises stark concerns about both the quality of representation and government accountability.
A sold vote is a silent voice because, once the price is paid, buyers have dispensed with their obligations to the sellers. People who sell their votes are engaging in a particularly destructive form of preference falsification because the systematic silencing of voices in the electorate distorts society's aggregate distribution of policy preferences. Skewed distributions of preferences are perhaps easiest to consider in the context of poor voters selling their votes to conservative parties that then go on to enact anti-poor government policies. More broadly, if sellers concentrate in particular groups, these groups’ preferences effectively disappear from the distribution of preferences to which the government responds.
Vote selling appears to be relatively diffuse across Lebanese society in that it does not vary much between the sects and political blocs. But with some 55 percent of the electorate selling, it appears that the government has little incentive to be attentive to anyone. A more unsettling logic applies here, however: the parties are buying not just votes but also polarization. People with the weakest partisan commitments and the lowest interest in political affairs are, by and large, the most likely to sell their votes. To the degree that these individuals are disproportionately moderate, middle-of-the-road voters, vote trafficking guts the middle of the electoral market. Many observers have remarked on what appears to be the keen and growing degree of polarization that Lebanon has experienced since 2005. If anything, the vote trafficking in 2009 exacerbated this trend.
Who, then, is now represented in the Lebanese parliament and cabinet? If less than half the electorate cast sincere votes in 2009, then one can argue that the financiers of the vote-trafficking campaigns have a majority stake in parliament. Theirs are the interests to which the parties must respond in order to keep the funds flowing that keep them in power. Saudi Arabia and Iran had, by most accounts, poured millions of dollars into the 2009 campaign. A Boutros Commission member described the state of campaign funding:
There's no law and no transparency. Hizbullah is funded by Iran. Future is funded by Saudi and some of Hariri's money. [For Jumblatt, it] depends on his phase, but currently it's probably Saudi. [For Aoun, it also] depends on his phase but currently Iran or Qatar. There's no fund-raising per se. It's all very top-down.Footnote 62
Given the degree to which the parties draw their funds from abroad, it may not be much of an exaggeration to suggest that foreign governments are better represented in the Lebanese parliament than are the Lebanese.
Vote trafficking is one part of a larger story about deficiencies in popular representation in Lebanon. Like clientelism more generally, vote trafficking makes it easier for politicians to hold office without attending to the policy preferences of their constituents. Even a sympathetic view of Lebanon's power-sharing institutions, moreover, must acknowledge that granting elites wide discretion to craft compromises between the communities comes at the expense of accountability to the voters on whose behalf they purport to speak. These institutions poorly represent the sects on a purely demographic basis while also serving as impediments to representation on nonsectarian issues. Although Lebanon can claim the Arab world's longest experience with electoral democracy, the quality of the representation its citizens enjoy seems inconsistent with their aspirations.
CONCLUSION
Lebanon, by virtually all accounts, supports a thriving vote market around election time. The list experiment I have presented in this paper provides a systematic assessment of how startlingly large that market actually is. Although one-quarter of the resident electorate admitted to selling their votes in 2009, over half acknowledged selling once we neutralized the sensitivity of the issue. Moreover, this 55 percent estimate almost certainly understates the magnitude of the market because it is based only on the resident electorate. In the absence of electoral provisions for expatriate or absentee voting, the parties faced widespread allegations that they were flying in thousands of voters from abroad—the logical if perverse extension of the traditional Lebanese practice of giving voters a ride to the polls.Footnote 63 It would be virtually impossible to sample this portion of the electorate, but if we assume that the bulk of those who returned to vote did so because their trips were being covered (turnout buying), then the number of sold votes exceeds the 55 percent estimate.Footnote 64
The evidence reveals that vote trafficking is, as one LADE official observed, Lebanon's “national sport,” one that transcends religious sect and political affiliation. March 14, and especially its Sunni component, was disproportionately attacked for vote trafficking in 2009—no doubt easy targets because of Hariri's immense personal fortune and his ties to Saudi Arabia and its oil money. According to the evidence presented in this article, however, neither March 14 voters in general nor Sunnis in particular were any more likely to sell votes than anyone else. Instead, they were simply more willing to admit to it. Thunderous allegations to the contrary may have made for good campaign rhetoric, but the evidence suggests that such claims were hypocritical at best.
Vote trafficking weakens representation and government accountability; why, then, do voters not stop selling and parties not stop buying? Each faces a collective action problem that Lebanon has not yet been able to overcome. Voters have a collective interest in better representation, a cleaner administration, and more moderate politics and hence a collective interest in quashing vote trafficking. Yet each voter also faces the individual incentive to accept a payment for his or her vote—because a single vote has only a vanishingly small chance of being decisive—while everyone else votes sincerely to provide the collective benefit of elections without vote trafficking. As in the classic collective action problem, everyone faces the same incentive to free ride on the public spiritedness of others, so the ride ends up being quite short.
The parties, in turn, face a similar free-riding dilemma. Each has acknowledged the widespread phenomenon of vote buying, and each has professed its willingness to forgo the expensive practice if its peers will do so as well.Footnote 65 Assuming this willingness is sincere—and it appears to be so among at least some elements of both major alliances—each individual party faces incentives to defect from a “no buying” pact. All else equal, a party that buys votes when its opponents abstain will win the election, and so a collective interest in cleaner campaigning loses out to the perverse necessity to buy votes.
In the absence of changes to the incentive structure to which parties and voters respond, we cannot reasonably expect either group to change its behavior. Reforms to the Lebanese electoral law are, for all practical purposes, the only way to change these incentives; moralizing will only change people on the margins but not in the main. Many of the recommendations put forward by the Boutros Commission and the Civil Society Campaign for Electoral Reform address the electoral practices that make vote trafficking attractive in the first place. These recommendations include preprinted ballots, centralized vote counting, provisions for expatriate voting, and more transparency of campaign expenditures and donations, especially from foreign sources.Footnote 66 One might also add to the list compulsory voting, lest parties simply shift tactics to emphasize abstention buying in place of turnout or switch buying.Footnote 67 Many of these provisions are dryly administrative in nature and, as such, do not evoke nearly the same passions as the more sensitive recommendations about large districts and proportional representation. Hence, the challenge is less likely winning over skeptics as it is convincing the public that it matters at all. Civil society organizations will thus need to continue to play their time-honored role of informed gadfly that pressures the government to fulfill its commitments to reform.
Some of the suggested reforms found their way into the 2009 law in watered-down form, and more may find their way into the 2013 law. Nonetheless, we should not hold out too much hope for dramatic change in the short term; if for no other reason, the parties that won under the old system are the ones that will write the new rules, and we can hardly expect them to do so in a disinterested fashion. The postwar Lebanese practice of writing new “one time only” electoral laws every four years shows little sign of changing this time around. Disputes constantly threatened to bring down Hariri's ill-fated unity government as they threaten to bring down the fractious coalition under his successor, Najib Mikati; neither government has been able to commit to significant policy choices. Because the electoral law is one of the types of legislation declared by the constitution to be “of national interest,” passing it will require a two-thirds majority in the cabinet. If past experience is any guide, many reforms will be excised or watered down before a new law comes into being.