Implications
This study demonstrates the ability of a visible/near-infrared spectrometer to determine online the quality of milk intended for cheese production. Cheese produced from the milk segregated by the spectrometer according to its clotting parameters resulted in better yield and better texture. The milk segregated by the spectrometer varied significantly in composition and somatic cell count, which were mainly influenced by the infecting bacteria and the stage of lactation of the cows.
Introduction
The dairy industry produces dairy products from bulk milk collected in the farms. The economical profitability of the industry has always been based on the qualities of the bulk milk as tested by the dairy laboratories. Cheese yield is one of the major factors influencing dairy economics and is usually calculated according to various equations (Emmons and Binns, Reference Emmons and Binns1990; Emmons et al., Reference Emmons, Ernstrom, Lacroix and Verret1990; Barbano et al., Reference Barbano, Rasmussen and Lynch1991; Emmons et al., Reference Emmons, Ernstrom, Lacroix and Verret1993 and Reference Emmons, Dube and Modler2003; Melilli et al., Reference Melilli, Lynch, Caprino, Barbano, Licitra and Cappa2002). The objective of producing the appropriate quality milk for cheese production has been achieved through genetic management and nutrition improvements, which have led to higher cheese yields from the bulk milk tank. However, all of the above have dealt with the herd level rather than with individual animals at real time.
Several studies in goat, sheep and cow milk have shown that the infection status of the animal's udder (Gonzalo et al., Reference Gonzalo, Carriedo, Baro and Primitivo1994; Auldist et al., Reference Auldist, Coats, Sutherland, Mayes and McDowell1996; Baudry et al., Reference Baudry, de Cremoux, Chartier and Perrin1997; Fantuz et al., Reference Fantuz, Plidori, Cheli and Baldi2001; Leitner et al., Reference Leitner, Chaffer, Shamay, Shapiro, Merin, Ezra, Saran and Silanikove2004a and Reference Leitner, Merin and Silanikove2004b; Merin et al., Reference Merin, Fleminger, Komanovsky, Silanikove, Bernstein and Leitner2008; Forsbäck et al., Reference Forsbäck, Lindmark-Månsson, Andrén, Åkerstedt and Svennersten-Sjaunja2009) and stage of lactation (Coulon, Reference Coulon1994; Leitner et al., Reference Leitner, Merin and Silanikove2011a) are directly related to milk quality, its composition and suitability for cheese making. Thus, some, but not all, bacteria causing mammary infection significantly reduce curd yield and quality, as well as in animals at late lactation. Although the above data are suitable for application on the herd level, it requires testing each animal separately and continuously for clotting parameters. Thus, if a decision to remove the milk from the bulk is made, all the animal's milk is removed, although in many cases the low-quality milk can be segregated to one gland only. Moreover, because of various factors, the low-quality milk can be temporarily secreted for a day or even one milking and also only for a small portion of the milk (Forsbäck et al., Reference Forsbäck, Lindmark-Månsson, Andrén, Åkerstedt and Svennersten-Sjaunja2009 and Reference Forsbäck, Lindmark-Månsson, Andrén, Åkerstedt, Andrée and Svennersten-Sjaunja2010). Recently, it was postulated that online equipment can estimate milk quality according to its clotting parameters, and thus result in better economical return for cheese making (Leitner et al., Reference Leitner, Lavi, Merin, Lemberskiy-Kuzin and Katz2011b).
The objective of this study was to further investigate the potential application of the AfiLab™ (S.A.E. Afikim, Israel) equipment to provide real-time analysis of milk-clotting parameters for cheese manufacture and cheese yield. The first part of the experiment tested the effects of lactation parameters, quarter (gland) and whole udder milk composition and bacterial infection on online sensing of milk-clotting parameters, whereas the second part tested a model of laboratory small-scale cheese production according to the parameters derived from the online AfiLab™ equipment.
Material and methods
The NIR milk analyzer
The analysis was carried out using the new online milk analyzers (Afilab™) developed by S.A.E. Afikim (Israel) providing real-time online analysis of fat, protein, lactose and milk coagulating properties during milking. The device is a commercial light emitting diode (LED-) based milk spectrometer in the visible (vis)–NIR regime, and it was calibrated at the beginning of the research with reference to the Optigraph as described previously (Leitner et al., Reference Leitner, Lavi, Merin, Lemberskiy-Kuzin and Katz2011b).
Animals
Israeli Holstein cows in a commercial dairy herd of 300 cows, producing approximately 11.500 l during 305 days, were selected for the study. The cows were milked three times daily (at 0300, 1100 and 1800 h) and were fed a typical Israeli total mixed ration containing 65% concentrate and 35% forage (17% protein). Feed was offered ad libitum in mangers located in the sheds. The milking parlor was double-sided parallel equipped with online milking stations with one station containing four AfiLab™ units connected to corresponding four milk meters. All quarters were simultaneously, but separately, milked using the AfiMilk (S.A.E. Afikim, Israel) quarter-milker apparatus, thus allowing online milk analysis of milk components, as well as clotting parameters on the glandular level. The milk was collected for reference sampling and quarter milk yield was established for each tested cow.
Study layout
Before the experiment, all the cows in the herd were sampled for bacteriology by quarter.
Milk samples on the quarter level were taken from seven cows, which were between 30 and 60 days after recovering from clinical infection caused by Escherichia coli.
During November 2009 and January 2010, 143 cows were sampled, focusing on the infected cows. Seven to nine cows were sampled on the glandular and the cow level on each sampling day one to seven times. At milking, udders were cleaned, disinfected and sterile milk samples were collected for bacteriology. Cows were milked by Afimilk online quarter-milker equipment. Quarter milk yield was recorded and the milk was gently mixed; 300 ml from each quarter was taken for analysis of milk composition and milk-clotting parameters, as well as a portion of the samples was taken for small-scale cheese making. The percent milk yield of each quarter of the total milk yield of the cow was calculated and the relative quantity was gently mixed and 300 ml was taken for the test on the cow level.
Milk analysis
In the experiment, days in milk (DIM), days in pregnancy (DIP) and milk quantity (kg/day) were recorded on the day of testing by the Afimik online data recording system. Bacterial identification was done according to International Dairy Federation (Oliver et al., Reference Oliver, Gonzalez, Hogan, Jayarao and Owens2004). Fat, protein, lactose and urea concentrations were analyzed by the Milkoscan 6000, and somatic cell count (SCC) with a Fossomatic 360 (Foss Electric, Hilleröd, Denmark). Casein (only for the samples for cheese making) was determined according to ISO (2002). Rennet clotting time (RCT, min) and curd firmness (CF, V) were tested using the Optigraph© (Ysebaert, Frepillon, France) and by the AfiLab™, as described by Leitner et al. (Reference Leitner, Lavi, Merin, Lemberskiy-Kuzin and Katz2011b). Afilab values for curd firmness (AfiLab™ online CF) are further referred to as Afi-CF.
Laboratory small-scale cheese making
Cow's milk (100 ml) was placed in two 50 ml plastic tubes (CentriStar, Corning, NY, USA). The milk was acidified to pH 6.2 using 0.08 ml of 44% lactic acid along with 0.1 ml CaCl2 solution (0.01 M). After temperature equilibration to 30°C, 2.5 ml of 1 : 100 diluted coagulating enzyme (Fromase 15 TL; Gist-Brocades nv, Delft, the Netherlands) was added, stirred and left undisturbed to achieve coagulation within approximately 30 min, and the coagulum was left to set for additional 30 min. The curd in each tube was then cut using a spatula and cooked by slowly increasing the water bath temperature to 36°C for 60 min (Kosikowski and Mistry, Reference Kosikowski and Mistry1997). The curd was transferred to perforated tubes (2 cm Ø) and flat-bottomed glass tubes filled with water served to press the curd (0.1 kg/cm2, 4°C) for 24 h. Curd was weighed after 24, 48 and 72 h to calculate yield according to dry matter (4 h at 105°C). Cheese texture firmness was analyzed using the Texture Analyzer TA XT2 (Stable Micro Systems, Godalming, Surrey, UK; Merin et al., Reference Merin, Fleminger, Komanovsky, Silanikove, Bernstein and Leitner2008).
Statistical analysis
All statistical analyses were carried out using JMP software (SAS Institute, 2000). The analyzed parameters were RCT and Afi-CF. The parameters were analyzed in two phases: (1) the quarter level and (2) the cow level. The ANOVA models included the udder infection status (UIS; NBF (no bacteria found) or INFECTED), lactation (first or second and up) and the interaction between them as fixed effects and the continuous variables as covariance. Interactions between the UIS and the continuous variables were also included in the model. The statistical model was
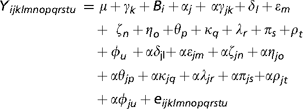
where μ is the grand mean; γk represents the fixed effect of lactation; Bi represents variance between cows; αj represents the fixed effect of the UIS; αγjk represents the UIS × lactation interaction; δl represents the covariance of percentage of fat; εm represents the covariance of percentage of protein; ζn represents the covariance of percentage of lactose; ηo represents the covariance of log SCC; represents the covariance of urea; κq represents the covariance of % milk; λr represents the covariance of milk (k/g); πs represents the covariance of Afi-CF; ρt represents the covariance of conductivity; φu represents the covariance of quarter-temperature; αδjl represents the UIS × crud interaction; αεim represents the UIS × percentage of protein interaction; αζin represents the UIS × log SCC interaction; αηio represents the UIS × milk/kg interaction; αθjp represents the UIS × percentage of fat interaction; ακjq represents the UIS × urea interaction; αλjr represents the UIS × percentage of milk interaction; απjs represents the UIS × Afi-CF interaction; αρjt represents the UIS × conductivity interaction; αφju represents the UIS × quarter-temperature interaction; and eijklmnopqrstu represent the residual variance between measurements (Random Error).
Note that the model for the whole cows’ (cow level) results did not include the variance between cows (therefore did not have a Split-plot design). In addition, in this model, the variables % milk, Afi-CF, conductivity and quarter-temperature were missing but the variables DIM and daily milk yield were included.
Comparison between infection status NBF or INFECTED and among the different bacteria on the analyzed parameters was done by t-test.
The proportion of quarter's milk production from cow's yield was calculated separately for each cow taking into account front or rear udder glands. Comparison between no infection and among the different bacteria was done by the t-test.
Results and discussion
Validation of Afi-CF calibration
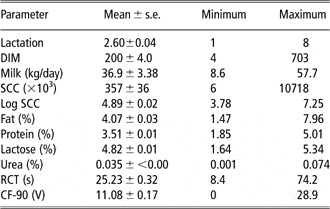
The milk samples tested in this study revealed a large distribution of the effects tested, which are summarized in Table 1.
Lactation number, DIM, milk yield, milk composition and milk clotting parameters (mean ± s.e. and minimum and maximum values of all the milk samples)

DIM = days in milk; SCC = somatic cell count; RCT = rennet clotting time; CF-90 = curd firmness (after 90 min).
Of the clotting parameters, CF was tested twice: in the laboratory using the Optigraph (CF-90) and online using the AfiLab™ (Afi-CF) with a significant correlation between them (r = 0.687). Therefore, further comparison between infection status and among the different bacteria on the analyzed parameters was conducted only for the value Afi-CF. Correlation between Afi-CF and RTC revealed technical problems in the interpretation of the Optigraph results: a value of Afi-CF < 1, which means no coagulation, was recorded at the same time for some of these samples using the Optigraph as a positive value of RCT. Therefore, in calculating the correlation between the two curd firmness parameters, only samples of Afi-CF > 1 were included (Figure 1). Logarithmic regression of r = 0.64 was found with a high variation for Afi-CF between 7 to 18 and RCT.
Logarithmic regression of curd firmness measured with Visible–NIR transmittance spectra Afilab (Afi-CF) and Optigraph rennet clotting time (RCT) of 1307 cow's milk samples. Encircled refer to samples which measured RCT but did not have true visible curd firmness.

Lactose, log SCC and udder infection were found to have a significant effect or were interrelated with RCT and Afi-CF, whereas fat and conductivity were found significant only on Afi-CF. There were also two significant interactions of lactation × UIS and log SCC × UIS. The other tested parameters had no significant effect on RCT and Afi-CF values (P > 0.05). There was a significant variance between cows, which represented more than 50% of RCT and 80% of Afi-CF from the total variance in this trial. Log SCC (effect of the bacterial infection) was interrelated with RCT; increase of log SCC increased RCT and decreased Afi-CF. Increase of fat level increased Afi-CF, whereas low lactose level increased RCT and decreased Afi-CF. Conductivity significantly interacted with Afi-CF: increased conductivity decreased Afi-CF. The significant interactions of log SCC and lactation with UIS were because of the different intensity of infections in the lactations and high variation in the infected quarters.
The implementation of the AfiLab™ for online discrimination of milk on the cow level according to pre-decided standards was shown previously in comparison with standard laboratory techniques (Leitner et al., Reference Leitner, Lavi, Merin, Lemberskiy-Kuzin and Katz2011b). The potential application of the equipment for providing real-time analysis of milk-clotting parameters for cheese manufacture and cheese yield was established in this study. RCT and CF are accepted industrial standards for the dairy industry to provide information on the expected coagulation (Bynum and Olson, Reference Bynum and Olson1982; Riddell-Lawrence and Hicks, Reference Riddell-Lawrence and Hicks1989; Ikonen et al., Reference Ikonen, Morri, Tyrisevä, Ruottinen and Ojala2004). Good statistical agreement between the clotting parameters tested online by the AfiLab™ carried out in real time on a whole herd milked using a 42 stalls polygon milking parlor proved and validated the capability of performing the claimed task by the AfiLab™ instrument.
The quarter level
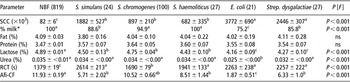
Udder bacteriology condition on the glandular level revealed 80.5% (819/1018) samples free of bacteria and 19.5% (199/1018) infected samples. Of the infected glands, the various bacteria were: E. coli – 21; coagulase-negative staphylococci (CNS) – 151 (Staphylococcus simulans – 24, Staphylococcus chromogenes – 100, Staphylococcus haemolyticus – 27); Streptococcus dysgalactiae – 27 (Table 2). No significant differences were found in fat and protein content between uninfected and infected glands, hence a combination of fat + protein of all samples were correlated with Afi-CF and a significant, but low, correlation was found (r = 0.415). Calculating the percentage of milk coming from the quarters infected by the different bacteria species in relation to the uninfected ones in the same cow revealed low milk production in S. simulans-, Strep. dysgalactiae- and with the lowest production in E. coli-infected quarters. The SCCs were significantly elevated in all the infected quarters with the highest and most significant in quarters infected by E. coli and Strep. dysgalactiae. Lactose was significantly lower in all the infected quarters than for the uninfected ones, and among the infected quarters those infected with E. coli and Strep. dysgalactiae had lower lactose levels than quarters infected with S. simulans, S. chromogenes and S. haemolyticus. Lactose had a significant effect on Afi-CF, corresponding mainly to infection. Moreover, milk with lactose <4% did not coagulate. Urea was significantly lower only in milk from glands infected with E. coli. As a result, RCT was significantly longer in all the infected quarters, and among the infected ones all were significantly higher than the ones infected with S. chromogenes. The Afi-CF was significantly lower for all the infected quarters except for S. chromogenes, whereas E. coli was significantly lower than the other infecting bacteria.
Quarter milk composition and milk clotting parameters of uninfected (NBF), and infected with Staphylococcus simulans, Staphylococcus chromogenes, Staphylococcus haemolyticus, Escherichia coli and Streptococcus dysgalactiae (mean ± s.e.)

NBF = no bacterial finding; SCC = somatic cell count; RCT = rennet clotting time; Afi-CF = AfiLab™ curd firmness.
*% milk – the proportion of quarter's milk production from cows yield calculated for each cow taking into account front or rear udder glands.
a,b,cParameters within rows with no common superscript differ significantly (P < 0.05).
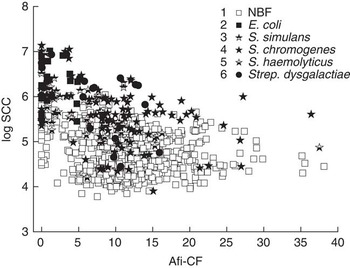
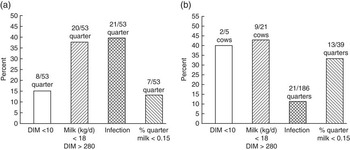
Overall correlation between log SCC and Afi-CF calculated from uninfected and infected quarters was r = 0.31 (Figure 2). No correlation was found between log SCC and the uninfected glands or S. chromogenes-, S. simulans- or S. haemolyticus-infected glands, whereas in the glands infected with E. coli and Strep. dysgalactiae a significant correlation of r = 0.55 was found. Dichotomy separation according to log SCC revealed that the probability of milk with log SCC >5.7 being infected and resulting in low curd firmness (Afi-CF 5) is >50%. Analyzing the source of samples that resulted in Afi-CF < 1 as summarized in Figure 3a revealed two main causes: udder infection and low milk yield at late lactation. The other two causes were days post partum and quarters that yielded low milk compared with the other quarters of the same cow.
Afilab (Afi-CF) v. log SCC of 1018 quarter milk samples. (1 – no bacterial finding [NBF], 2 – Escherichia coli, 3 – Staphylococcus simulans, 4 – S. chromogenes, 5 – S. haemolyticus, 6 – Streptococcus dysgalactiae).

Source of milk samples that resulted in Afi-CF < 1 of udder quarters (a), and relative cow or quarters in each of the four causative parameters (b). (DIM < 10; milk yield < 18 l and DIM > 280; infection; % quarter milk < 0.15).

The relative cow or quarters in each of the four causative parameters are also summarized in Figure 3b. It is important to note that in a quarter producing <0.15% of the milk, the Afi-CF range was ‘between’ 0 and 5.
The cow level
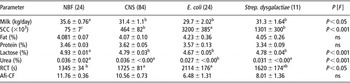
On the cow level, 24/143 cows were uninfected in all four glands, whereas when infected, the infecting bacteria were: E. coli – 24; CNS – 84; Strep. dysgalactiae – 11, most of them were infected only in one gland (Table 3). DIM, fat, lactose and log SCC were found as significant effects or interrelated to RCT and Afi-CF, whereas udder infection was found significant on RCT and protein on Afi-CF. There was also one significant interaction of DIM × UIS. The other tested parameters had no significant effect on RCT and Afi-CF values (P > 0.05). Increased percentage of fat decreased RCT and increased Afi-CF, whereas low lactose level increased RCT and decreased Afi-CF. Log SCC (effect of the bacterial infection) is interrelated to RCT; increase of log SCC increased RCT and decreased Afi-CF. The intensity of DIM effect was different in uninfected cows compared with infected cows; however, as lactation progressed, RCT increased and Afi-CF decreased. UIS had a borderline effect on RCT and no significant effect on Afi-CF because of the high variation in the infected cows.
Whole udder level milk yield, milk composition and milk clotting parameters of uninfected (NBF), and infected with CNS, Escherichia coli and Streptococcus dysgalactiae (mean ± s.e.)

NBF = no bacterial finding; CNS = coagulase-negative staphylococci; SCC = somatic cell count; RCT = rennet clotting time; Afi-CF = AfiLab™ curd firmness.
a,b,cParameters within rows with no common superscript differ significantly (P < 0.05).
Milk yield of the uninfected cows was significantly higher than that of the infected cows. Because of the low number of cows each of the staphylococcal-infected bacteria, all were grouped into CNS. SCC was significantly elevated in all the infected quarters with the highest and most significant in E. coli- and Strep. dysgalactiae-infected quarters. Lactose level was significantly lower in all the infected quarters compared with the uninfected ones. Urea was significantly lower only in milk from glands infected with E. coli. As a result of all the above, RCT was significantly longer in all the infected quarters but significant from uninfected only in CNS and E. coli-infected quarters. The Afi-CF was higher in uninfected quarters, but because of high variation in each of the bacterial infection the mean value was not significant. No correlation was found between log SCC and Afi-CF of uninfected quarters. In contrast, negative correlations were found with each of the bacterial group with the strongest in E. coli-infected quarters.
The results of this study reinforce the findings that bacterial infection in general and certain bacteria species in particular are the major causes of impaired coagulation properties of milk from infected glands, either of the gland or the cow level (Leigh and Lincoln, Reference Leigh and Lincoln1997; Leitner et al., Reference Leitner, Krifucks, Merin, Lavi and Silanikove2006; Merin et al., Reference Merin, Fleminger, Komanovsky, Silanikove, Bernstein and Leitner2008). Of the bacteria species, E. coli and Strep. dysgalactiae had the major impact; however, it should be kept in mind that all Strep. dysgalactiae-infected glands shed these microorganisms, whereas E. coli-infected glands were several weeks post proved infection. The resulting effects of the latter bacteria are in agreement with other reports (Le Roux et al., Reference Le Roux, Laurent and Moussaoui2003; Moussaoui et al., Reference Moussaoui, Vangroenweghe, Haddadi, Le Roux, Laurent, Duchateau and Burvenich2004). Moreover, the results also indicate that impact of bacterial infection within species is inconsistent. Therefore, bacteriology alone is not sufficient for predicting milk quality intended for cheese making. The other major effect on milk-clotting parameters appeared to be the combination of milk volume and stage of lactation (Davis et al., Reference Davis, Farr and Stelwagen1999; Silanikove et al., Reference Silanikove, Shapiro and Leitner2005 and Reference Silanikove, Shapiro and Shinder2009; Leitner et al., Reference Leitner, Merin and Silanikove2011a). Therefore, bacteriology alone or stage of lactation are insufficient parameters for predicting milk quality intended for cheese making.
Small-scale cheese making
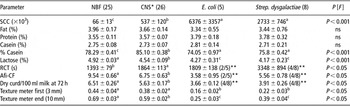
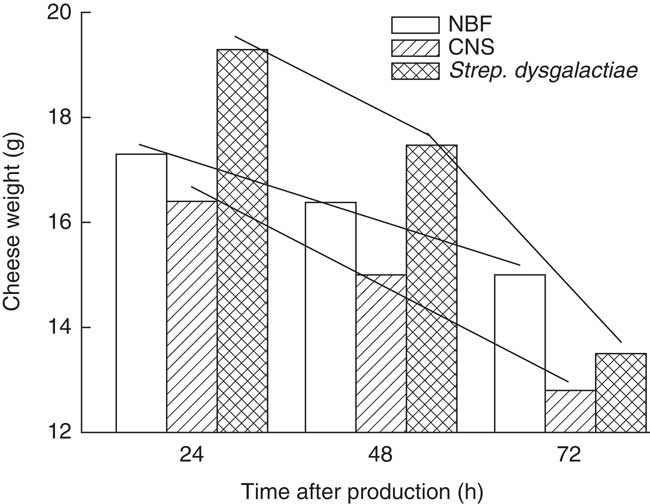
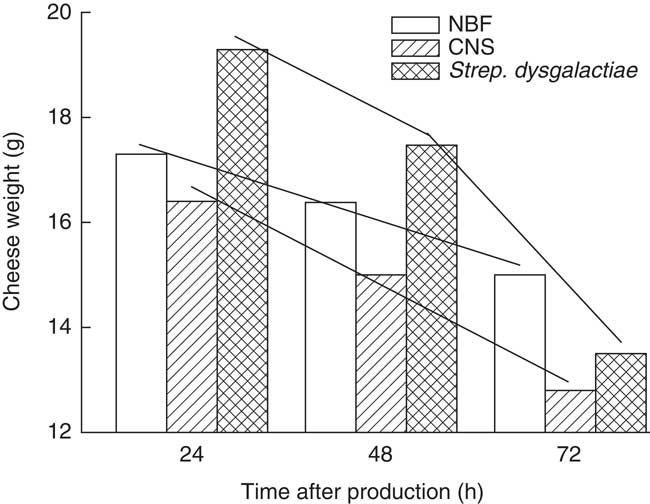
Small cheese blocks were produced from a representative part of the milk samples collected for the study. As summarized in Table 4, it shows that regarding SCC and milk composition, the milk samples followed the same trend found for all the milk sampled for the study, as reported above. The parameters that were related to cheese production showed distinct differences arising from the milk origin. RCT was longer according to the different infecting bacteria, with S. dysgalactiae being the longest. Afi-CF recorded for the samples revealed decreasing values according to the different bacteria, where E. coli resulted in the lowest value. It should be noted that for Strep. dysgalactiae and E. coli about 50% of the milk samples did not coagulate at all (** in Table 4) indicating a major influence on the milk of these two bacterial species. Curd yield, calculated after 72 h, revealed a significant yield reduction in all cheese made from infected milk, with the lowest from the 50% of the milk of Strep. dysgalactiae- and E. coli-infected animals that did coagulate. The dynamics of water loss from the cheese blocks during 72 h are presented in Figure 4. Of the Strep. dysgalactiae-infected quarters, the milk coagulated only in four of the eight cows. Cheese weight was reduced over time in a different manner for the different groups. The cheese made from Strep. dysgalactiae-infected milk resulted in the highest initial yield and lost water fast. It should be noted that only four samples of that milk coagulated and resulted in a single cheese block (thus, there are no error bars). Cheese made from milk from quarters infected by CNS resulted in the lowest yield, whereas cheese made from milk of uninfected quarters was intermediate at 24 h. However, the slope of the CNS was steeper (b = −1.8) than that of the uninfected (b = −1.15). Final dry curd in cheese made from 100 ml milk at 72 h showed a significant difference among the three milk sources, 38% lower in Strep. dysgalactiae-infected and E. coli, and 13% in CNS compared with the uninfected milk. Texture analyzer results at 72 h, as determined from the penetration curves at 3 and 10 mm depth (Merin et al., Reference Merin, Fleminger, Komanovsky, Silanikove, Bernstein and Leitner2008), showed that cheese firmness was lower for cheese made from milk of infected quarters, whereas Strep. dysgalactiae- and E. coli-infected milk resulted in softer cheese (Table 4).
Milk composition, milk clotting parameters and cheese yield and texture of uninfected (NBF), and infected with CNS, Escherichia coli and Streptococcus dysgalactiae (mean ± s.e.)

NBF = no bacterial finding; CNS = coagulase-negative staphylococci; SCC = somatic cell count; RCT = rennet clotting time; Afi-CF = AfiLab™ curd firmness.
*Pooled CNS.
**Only x/y Afi-CF > 1.
a,b,cParameters within rows with no common superscript differ significantly (P < 0.05).
Changes in weight of cheese made from milk of uninfected (no bacterial finding; NBF), coagulase-negative staphylococci (CNS)-infected and Streptococcus dysgalactiae-infected quarters until 72 h from production. Lines over bars show the slope of weight loss.
The differences in cheese yield in relation to bacterial infection were demonstrated before (Leitner et al., Reference Leitner, Krifucks, Merin, Lavi and Silanikove2006; Merin et al., Reference Merin, Fleminger, Komanovsky, Silanikove, Bernstein and Leitner2008) and the deleterious effect of the different bacteria was further highlighted in this study. It is assumed that parts of the effects noted in these studies are strongly related to the milk-clotting parameters as influenced by the different infecting bacteria. However, other research papers have pointed out other variables as related to low cheese yield, such as genetic correlations (Ikonen et al., Reference Ikonen, Morri, Tyrisevä, Ruottinen and Ojala2004; Malacarne et al., Reference Malacarne, Summer, Fossa, Formaggioni, Franceschi, Pecorari and Mariani2006; Vallas et al., Reference Vallas, Bovenhuis, Kaart, Pärna, Kiiman and Pärna2010), relative composition of caseins (Wedholm et al., Reference Wedholm, Larsen, Lindmark-Månsson, Karlsson and Andrén2006; Penasa et al., Reference Penasa, Cassandro, Pretto, De Marchi, Comin, Chessa, Dal Zotto and Bittante2010) and cows producing noncoagulating milk (Ikonen et al., Reference Ikonen, Ahlfors, Kempe, Ojala and Routtinen1999). As there are no indications on the health status of the cows, or in certain cases cows with at least 106 cells/ml and higher were included in the studies, the influence of the presence of infecting bacteria on their findings could not be ruled out. However, Ikonen et al. (Reference Ikonen, Morri, Tyrisevä, Ruottinen and Ojala2004) suggest that ‘… the loci causing noncoagulation of milk and increasing SCC of milk are closely linked or partly the same’. It is therefore strongly suggested that future studies on the relation of milk quality to its clotting parameters will always be accompanied by a full report on the animal's gland/udder health status.
The textural properties of cheese produced from milk infected by various bacteria was discussed earlier, where it was reported that the softer texture was noted not only in cheese but also in yoghurt, as well and bacteria were the major influencing parameter. Similarly, loss of water from cheese curd is well known to be influenced by milk quality (Merin et al., Reference Merin, Fleminger, Komanovsky, Silanikove, Bernstein and Leitner2008).
It is well established that dry matter in milk, mainly fat and protein, are the major components affecting cheese yield, and thus served as the parameters used in the various yield prediction formula (Emmons et al., Reference Emmons, Ernstrom, Lacroix and Verret1990; Fenelon and Guinee, Reference Fenelon and Guinee1999; Verdier-Metz et al., Reference Verdier-Metz, Coulon and Pradel2001). This point was further discussed regarding the exact major fraction to be used in the calculations (Emmons and Modler, Reference Emmons and Modler2010). Indeed, using such equations on milk coming from uninfected animals during the major part of their lactation, as well as using bulk tank milk resulted in good agreement between experimental and calculated results (van den Berg et al., Reference van den Berg, van den Berg and van Boekel1996; Melilli et al., Reference Melilli, Lynch, Caprino, Barbano, Licitra and Cappa2002; Emmons et al., Reference Emmons, Dube and Modler2003). However, a certain number of animals in a herd at each point of time are infected or are at certain physiological conditions that lead to production of milk that deviates from what is accepted as ‘normal milk’ (Pitkälä et al., Reference Pitkälä, Haveri, Pyörälä, Myllys and Honkanen-Buzalski2004; Sampimon et al., Reference Sampimon, Barkema, Berends, Sol and Lam2009; Leitner et al., Reference Leitner, Merin and Silanikove2011a).
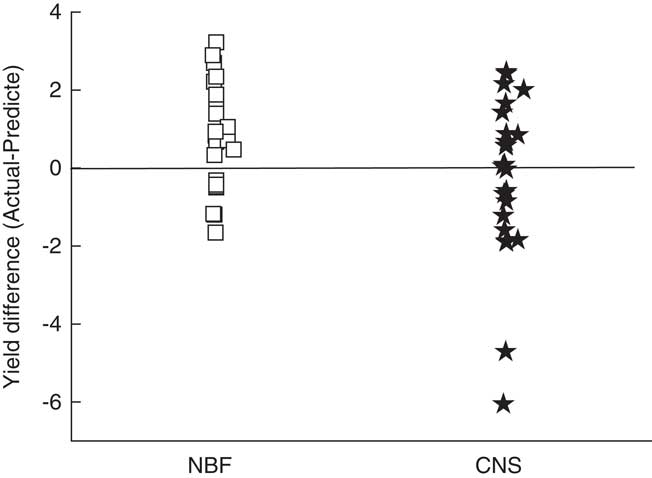
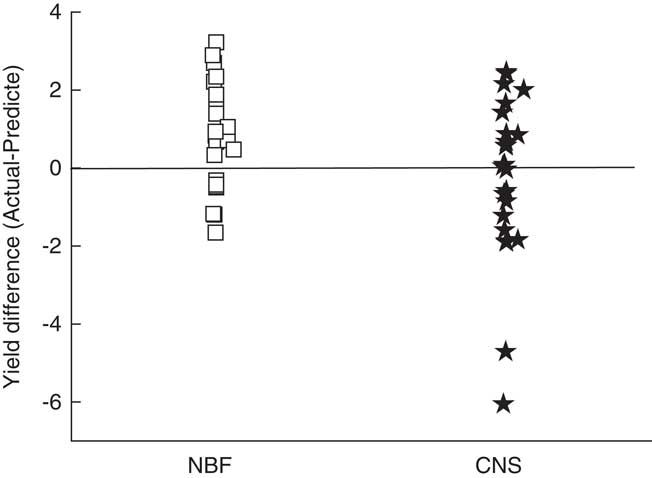
In this study, under one of the latter conditions, for example, udder infection, the empirical equations developed resulted in a lower predicted cheese yield, whereas cheese made from milk of uninfected udders resulted in a somewhat higher yield than the predicted (Figure 5). Hence, Afi-CF was calibrated against the Optigraph values, which gives a predictive value for CF beyond the factors taken into account by the various formulae.
Difference in cheese yield between milk from uninfected glands and coagulase-negative staphylococci (CNS-) infected glands at 72 h, calculated according to van Slyke (55% moisture).
Concluding remarks
The quality of milk, the raw material for the dairy industry, is the key for high-quality products, repeatability of texture and taste, as well as economic benefit. In modern dairy farming with large numbers of animals, quality control of milk shifts from the individual animal to the bulk milk; that is, SCC, bacterial count, etc. Online milking equipment provides an opportunity to shift back to controlling each individual animal at real time. So far the milking equipment can signal and alert deviation from normal and provide the farmer with tools for a decision-making by monitoring each cow every milking (Katz et al., Reference Katz, Arazi, Pinsky, Halachmi, Schmilovitz, Aizinbud and Maltz2007).
The results clearly indicate that: (a) the parameter Afi-CF determined with the AfiLab™ is suitable for assessing milk quality for its clotting parameters, a value that is not provided by merely measuring fat and protein on the gland and the cow levels; (b) bacterial type is the single major cause of reduced milk quality, however, it is bacteria–species related. In that manner, it is important to realize that S. chromogenes, the most common bacteria causing infection, had only a minor influence on Afi-CF. Moreover, S. simulans, which also belongs to the CNS group, had an effect similar to streptococcus; (c) early and late lactation also had negative effects on clotting parameters (Leitner et al., Reference Leitner, Merin and Silanikove2011a). Overall, it is important to note that not all the glands and cows categorized as infected or at late lactation produce ‘low-quality milk’ and also not all the milk from a particular animal is of low quality.
Currently, on the basis of the above study and the previous work of Leitner et al. (Reference Leitner, Lavi, Merin, Lemberskiy-Kuzin and Katz2011b), online milking parlor, which will be equipped with two parallel milk lines, has the potential to control the milk properties in the bulk milk tank based on online optical detection of its coagulation parameters by the AfiLab™ and to channel it into two separate collecting tanks. Such a system will be able to segregate milk online according to the predetermined needs of the collecting dairy.