





1. Introduction
The classic pipe flow with no-slip boundary condition has been proved linearly stable to axisymmetric perturbations (Herron Reference Herron1991, Reference Herron2017), and numerical studies suggest that the flow is linearly stable to any perturbations at arbitrary Reynolds numbers (Meseguer & Trefethen Reference Meseguer and Trefethen2003). The recent work of Chen, Wei & Zhang (Reference Chen, Wei and Zhang2019) presented a rigorous proof of the linear stability of the flow to general perturbations at high-Reynolds-number regime. Therefore, transition to turbulence in pipe flow is subcritical via finite-amplitude perturbations (see e.g. Eckhardt et al. Reference Eckhardt, Schneider, Hof and Westerweel2007; Avila et al. Reference Avila, Moxey, De Lozar, Avila, Barkley and Hof2011).
However, velocity slip of viscous fluid can occur on superhydrophobic surfaces (Voronov, Papavassiliou & Lee Reference Voronov, Papavassiliou and Lee2008; Rothstein Reference Rothstein2010), for which slip boundary condition instead of the classic no-slip condition should be adopted for the momentum equations, and the slip boundary condition can potentially influence the stability of the flow. A simplified and widely used slip boundary condition is the Navier slip boundary condition, which has been shown to apply to many flow problems and is frequently adopted for linear stability studies (Vinogradova Reference Vinogradova1999; Lauga & Cossu Reference Lauga and Cossu2005; Min & Kim Reference Min and Kim2005; Gan & Wu Reference Gan and Wu2006; Ren, Chen & Zhu Reference Ren, Chen and Zhu2008; Ghosh, Usha & Sahu Reference Ghosh, Usha and Sahu2014; Seo & Mani Reference Seo and Mani2016; Chattopadhyay, Usha & Sahu Reference Chattopadhyay, Usha and Sahu2017, to list a few). For pipe geometry, although many studies have investigated the linear stability of immiscible and miscible multifluid flows with either no-slip or Navier slip boundary condition (Hu & Joseph Reference Hu and Joseph1989; Joseph Reference Joseph1997; Li & Renardy Reference Li and Renardy1999; Selvam et al. Reference Selvam, Merk, Govindarajan and Meiburg2007; Sahu Reference Sahu2016; Chattopadhyay et al. Reference Chattopadhyay, Usha and Sahu2017, etc.), far fewer studies were dedicated to the linear stability of single-phase pipe flow with slip boundary condition. Průša (Reference Průša2009) investigated this problem and showed that, subject to Navier slip boundary condition, pipe flow becomes less stable compared with the no-slip case, however, the destabilization effect is constrained to small Reynolds numbers and is not sufficient to render the flow linearly unstable. Their results indicated that the stability property of pipe flow is not qualitatively affected by the slip boundary condition, regardless of the slip length. For its counterpart in plane geometry, i.e. channel flow, on the contrary, Min & Kim (Reference Min and Kim2005) and Lauga & Cossu (Reference Lauga and Cossu2005) reported a stabilizing effect of velocity slip on the linear stability.
Usually, slip length is assumed homogeneous and isotropic, i.e. independent of position and direction at the wall in stability analysis. However, anisotropy in the effective slip length can be incurred by anisotropy in the texture pattern on superhydrophobic surfaces, such as parallel periodic slats, grooves and grates (Lecoq et al. Reference Lecoq, Anthore, Cichocki, Szymczak and Feuillebois2004; Bazant & Vinogradova Reference Bazant and Vinogradova2008; Ng & Wang Reference Ng and Wang2009; Belyaev & Vinogradova Reference Belyaev and Vinogradova2010; Asmolov & Vinogradova Reference Asmolov and Vinogradova2012; Pralits, Alinovi & Bottaro Reference Pralits, Alinovi and Bottaro2017). For example, Ng & Wang (Reference Ng and Wang2009) reported a ratio of down to approximately 0.25 between the transverse slip length (in the direction perpendicular to the slats) and longitudinal slip length (parallel to the slats). The linear stability of channel flow with anisotropic slip caused by parallel micrograves was analysed by Pralits et al. (Reference Pralits, Alinovi and Bottaro2017) using the tensorial formulation of slip boundary condition proposed by Bazant & Vinogradova (Reference Bazant and Vinogradova2008). Their results showed possibilities of linear instability using special alignment of the micrograves. Recently, Chai & Song (Reference Chai and Song2019) studied the linear stability of single-phase channel flow subject to anisotropy in slip length by considering streamwise and azimuthal slip separately as the limiting cases, which can potentially be realized or approximated by using specially designed surface texture, e.g. specially aligned microgrates/graves, according to Bazant & Vinogradova (Reference Bazant and Vinogradova2008). Their results showed that streamwise slip mainly stabilizes the flow (with increased critical Reynolds number), although it surprisingly destabilizes the flow slightly in a small Reynolds number range, and that azimuthal slip can greatly destabilize the flow and reduce the critical Reynolds number given sufficiently large slip length. The critical Reynolds number can be reduced to a few hundred with a dimensionless azimuthal slip length of  $O(0.1)$, in contrast to
 $Re_{cr}=5772$ for the no-slip case. Their study also indicated that Squire's theorem (Squire Reference Squire1933) ceases to apply when the wall-normal velocity and vorticity are coupled via the slip boundary condition, such that the leading instability becomes three-dimensional (3-D) rather than two-dimensional (2-D) when slip length is sufficiently large, in agreement with Pralits et al. (Reference Pralits, Alinovi and Bottaro2017). The stability of 3-D perturbations was not considered by Min & Kim (Reference Min and Kim2005) and Lauga & Cossu (Reference Lauga and Cossu2005) in which Squire's theorem was seemingly assumed.
Differing from channel flow, linear instability is absent at arbitrary Reynolds numbers in classic pipe flow. This raises the question of whether the anisotropy in slip length can also cause linear instability in pipe flow. To our knowledge, this problem has not been studied in pipe geometry. The pseudospectrum analysis of classic pipe flow of Schmid & Henningson (Reference Schmid and Henningson1994) and Meseguer & Trefethen (Reference Meseguer and Trefethen2003) suggests that, despite the linear stability, at sufficiently large Reynolds numbers, a small perturbation to the linear operator associated with the governing equation can possibly change the stability of the system. The slip boundary condition can be thought of as a perturbation to the linear operator with no-slip boundary condition. However, Průša (Reference Průša2009) showed that homogeneous and isotropic slip does not change the spectrum qualitatively no matter how large the slip length (i.e. operator perturbation) is. Following Chai & Song (Reference Chai and Song2019), in this work, we still consider anisotropic slip length in the limiting cases and explore the possibility of linear instability for pipe flow. Aside from the critical Reynolds number as focused on by Chai & Song (Reference Chai and Song2019), here we also investigate the effects of the slip on the spectrum and on the scaling of the leading eigenvalues with Reynolds number. In addition to numerical calculations, we also perform analytical studies on the eigenvalues and eigenvectors of the 3-D yet streamwise-independent modes, and discuss their structure as well as their dependence on the slip length on a theoretical basis, which to our knowledge has not been reported in the literature.
2. Numerical methods
The non-dimensional incompressible Navier–Stokes equations read
 \begin{equation} \dfrac{\partial \boldsymbol{u}}{\partial t}+{\boldsymbol{u}}\boldsymbol{\cdot}\boldsymbol{\nabla} {\boldsymbol{u}}=-{\boldsymbol{\nabla}p}+\dfrac{1}{Re}{\nabla^2}{\boldsymbol{u}}, \quad \boldsymbol{\nabla}\boldsymbol{\cdot}{\boldsymbol{u}}=0, \end{equation}
where  $\boldsymbol {u}$ denotes velocity and
 $p$ denotes pressure. For pipe geometry, cylindrical coordinates
 $(r, \theta , x)$ are considered, where
 $r$,
 $\theta$ and
 $x$ denote the radial, azimuthal and streamwise coordinates, respectively. Velocity components
 $u_r$,
 $u_{\theta }$ and
 $u_x$ are normalized by
 $2U_b$ where
 $U_b$ is the bulk speed (the average of the streamwise velocity on the pipe cross-section), length by pipe radius
 $R$ and time by
 $R/U_b$. The Reynolds number is defined as
 $Re=U_bR/\nu$ where
 $\nu$ is the kinematic viscosity of the fluid. In order to eliminate the pressure and impose the incompressibility condition, we adopt the velocity–vorticity formulation of Schmid & Henningson (Reference Schmid and Henningson1994), with which the governing equations of disturbances reduce to only two equations about the wall-normal velocity
 $u_r$ and wall-normal vorticity
 $\omega$. With a Fourier-spectral-Chebyshev-collocation discretization, considering perturbations of the form of
 $\{u_r,\omega \}=\{\hat {u}_r(r), \hat{\omega} (r)\}\exp ({-\textrm {i}(\alpha x+n\theta )})$, the governing equations in the Fourier spectral space read
 \begin{equation} L{\boldsymbol{q}}+\dfrac{\partial}{\partial \tau}M{\boldsymbol{q}}=0, \end{equation}
where
 \begin{equation} L= \left( \begin{array}{@{}cc@{}} \textrm{i}\alpha ReU\varGamma +\textrm{i}\dfrac{\alpha Re}{r}\left(\dfrac{U'}{k^2r}\right)'+\varGamma(k^2r^2\varGamma) & 2\alpha n^2Re\varGamma\\ -\dfrac{\textrm{i}U'}{r}+\dfrac{2\alpha}{Re}\varGamma & \textrm{i}\alpha Rek^2r^2U+\phi \end{array} \right ), \end{equation}
 \begin{equation} M= \left( \begin{array}{@{}cc@{}} \varGamma & 0 \\ 0 & k^2r^2 \end{array} \right ), \end{equation}
where  $\tau ={t}/{Re}$ is the scaled time and unknowns are
 \begin{equation} \boldsymbol{q}= \left(\begin{array}{@{}c@{}} \hat{\varPhi} \\ \hat{\varOmega} \end{array} \right)= \left(\begin{array}{@{}c@{}} -\textrm{i}r{\hat{u}_r} \\ \dfrac{\alpha r{\hat{u}_{\theta}}-n{\hat{u}_x}}{nRek^2r^2} \end{array} \right)= \left(\begin{array}{@{}c@{}} -\textrm{i}r{\hat{u}_r} \\ \dfrac{\hat{\omega}}{\textrm{i}nRek^2r} \end{array} \right). \end{equation}
The real number  $\alpha$ is the axial wavenumber and
 $n$, which is an integer, is the azimuthal wavenumber. The base flow is denoted as
 $U$,
 $k^2=\alpha ^2+{n^2}/{r^2}$,
 $\mathrm{i}=\sqrt {-1}$ and the prime denotes the derivative with respect to
 $r$. The operators
 $\varGamma$ and
 $\phi$ are defined as
 \begin{equation} \varGamma=\dfrac{1}{r^2}-\dfrac{1}{r}\dfrac{\text{d}}{\text{d}r}\left(\dfrac{1}{k^2r}\dfrac{\text{d}}{\text{d}r}\right) \end{equation}
and
 \begin{equation} \phi=k^4r^2-\dfrac{1}{r}\dfrac{\text{d}}{\text{d}r}\left(k^2r^3\dfrac{\text{d}}{\text{d}r}\right). \end{equation}
The other two velocity components  $\hat {u}_{x}$ and
 $\hat {u}_{\theta }$ can be calculated as
 \begin{equation} \hat{u}_x=-\dfrac{\alpha}{k^2r}\dfrac{\partial \hat{\varPhi}}{\partial r}-n^2r\hat{\varOmega},\quad \hat{u}_{\theta}=-\dfrac{n}{k^2r^2}\dfrac{\partial \hat{\varPhi}}{\partial r}+\alpha nrRe\hat{\varOmega}. \end{equation}
We use the Robin-type Navier slip boundary condition at the pipe wall for streamwise and azimuthal velocities separately, i.e.
 \begin{equation} \left. \left(l_x\dfrac{\partial{u_x}}{\partial r}+u_x\right)\right|_{r=1}=0, \quad \left.\left(l_{\theta}\dfrac{\partial{u_{\theta}}}{\partial r}+u_{\theta}\right)\right|_{r=1}=0, \end{equation}
where  $l_x\geqslant 0$ and
 $l_{\theta }\geqslant 0$ are streamwise and azimuthal slip lengths, respectively, and are independent of each other. In spectral space, these boundary conditions apply identically to
 $\hat {u}_{x}$ and
 $\hat {u}_{\theta }$ given the homogeneity of the slip length. We use the no-penetration condition for the wall-normal velocity component at the wall, i.e.
 $u_r(1,\theta ,x,t)=0$. Lauga & Cossu (Reference Lauga and Cossu2005) and Chai & Song (Reference Chai and Song2019) considered the same boundary conditions for slip channel flow. Note that in the isotropic slip case considered by Průša (Reference Průša2009),
 $l_x$ and
 $l_{\theta }$ are related as
 $l_{\theta }={l_x}/({1+l_x})$, which gives
 $l_{\theta }\approx l_x$ for small slip lengths. With boundary condition (2.9a,b), given that we impose the same volume flux as in the no-slip case, i.e.
 \begin{equation} \int_0^1U_x(r)r\,{\text d}r=\frac{1}{4}, \end{equation}
the velocity profile of the constant-volume-flux base flow reads
 \begin{equation} \boldsymbol{U}(r)=\dfrac{1-r^2+2l_x}{1+4l_x}\hat{\boldsymbol{x}}, \end{equation}
where  $\hat {\boldsymbol {x}}$ represents the unit vector in the streamwise direction. Note that the base flow is independent of
 $l_{\theta }$. Converting to the
 $(\hat {\varOmega },\hat {\varPhi })$ system, the boundary condition (2.9a,b) reads
 \begin{equation} \dfrac{\alpha}{k^2}\dfrac{\partial \hat{\varPhi}}{\partial r}+n^2Re{\hat{\varOmega}}+l_x\left(n^2Re\dfrac{\partial \hat{\varOmega}}{\partial r}+\dfrac{\alpha}{k^2}\dfrac{\partial^2{\hat{\varPhi}}}{\partial r^2}+\alpha\dfrac{n^2-\alpha^2}{(n^2+\alpha^2)^2}\dfrac{\partial {\hat{\varPhi}}}{\partial r}\right)=0 \end{equation}
and
 \begin{equation} \alpha nRe{\hat{\varOmega}} -\dfrac{n}{n^2\!+\!\alpha^2}\dfrac{\partial {\hat{\varPhi}}}{\partial r}\!+\! l_{\theta}\left( \alpha nRe{\hat{\varOmega}}\!+\!\alpha nRe\dfrac{\partial{\hat{\varOmega}}}{\partial r} -\dfrac{n}{n^2\!+\alpha^2}\dfrac{\partial^2{\hat{\varPhi}}}{\partial r^2}\!+\!\dfrac{2n\alpha^2}{(n^2 +\alpha^2)^2}\dfrac{\partial {\hat{\varPhi}}}{\partial r}\right)=0. \end{equation}
It can be seen that  $\hat {\varOmega }$ and
 $\hat {\varPhi }$, i.e.
 $\hat {u}_r$ and
 $\hat{\omega}$, are coupled via the slip boundary condition.
In order to avoid the singularity at the pipe centre, i.e.  $r=0$, the domain [0, 1] is extended to
 $[-1, 1]$ and an even number of Chebyshev grid points over
 $[-1, 1]$ are used such that there is no grid point at
 $r=0$. This extension also allows us to use the Chebyshev collocation method for the discretization in the radial direction and the resulted redundancy is circumvented by setting proper parity conditions on
 $\hat {\varPhi }$ and
 $\hat {\varOmega }$ with respect to
 $r$ (Trefethen Reference Trefethen2000; Meseguer & Trefethen Reference Meseguer and Trefethen2003). In this way, no explicit boundary condition is imposed at the pipe centre.
To determine whether a mode  $(\alpha ,n)$ is linearly stable or not, one only needs to calculate the eigenvalues of the operator
 $-M^{-1}L$ and check if any eigenvalue has a positive real part,
 $\lambda _r$, which determines the asymptotic growth/decay rate of the corresponding eigenvector as
 $t\to \infty$.
3. Streamwise slip
We consider the case of  $l_x\neq 0$ and
 $l_{\theta }=0$ as the limiting case of streamwise slip being significant and azimuthal slip being negligible.
The effect of the slip on the spectrum is investigated for  $Re=3000$ and is shown in figure 1 for the modes
 $(\alpha ,n)=(0,1)$ and
 $(0.5,1)$. First, figure 1(a) shows that the eigenvalues of the
 $(\alpha ,n)=(0,1)$ mode visually all fall on the
 $\lambda _i=0$ line (
 $\lambda _i$ denotes the imaginary part of the eigenvalue) and in the left half-plane, which suggests that the eigenvalues are all real and negative. Meseguer & Trefethen (Reference Meseguer and Trefethen2003) reported the same finding for the no-slip case in a large Reynolds number range up to
 $10^7$. In fact, the eigenvalues being real and negative can be rigorously proved, see our proof in § 5.1. Second, as
 $l_x$ increases, it can be observed that there are two groups of eigenvalue, one of which remains constant and the other of which shifts to the right, see the two insets in figure 1(a). Specifically, as
 $l_x$ is increased to 0.5, the left eigenvalue in the left inset has moved from the circle to the triangle and finally to the square while the right eigenvalue remains constant. Nonetheless, the rightmost eigenvalue increases as
 $l_x$ increases (see the right inset) which indicates that the flow becomes less stable. In § 5.2, we will show that the former group corresponds to disturbances with
 $\varPhi \not \equiv 0$, i.e.
 $u_r\not \equiv 0$ and the latter group, on the contrary, is associated with disturbances with
 $\varPhi \equiv 0$, i.e.
 $u_r\equiv 0$ and, the rightmost eigenvalue belongs to the latter group. Figure 1(b) shows the case for the mode
 $(\alpha ,n)=(0.5,1)$. The slip does not qualitatively change the shape of the spectrum. As
 $l_x$ increases, the eigenvalues overall move to the right. In addition to a horizontal shift there is a shift in the vertical direction and, meanwhile, the spectrum is compressed in the vertical direction, see the comparison between the
 $l_x=0.5$ and the other two cases. Using the term of Schmid & Henningson (Reference Schmid and Henningson1994) and Meseguer & Trefethen (Reference Meseguer and Trefethen2003), the horizontal branch of the spectrum (the part with
 $\lambda _r\lesssim -600$) corresponds to mean modes, the upper branch corresponds to wall modes and the lower branch to centre modes. Note that the speed of a wave is given by
 $({-\lambda _i})/{\alpha Re}$ in our formulation. It has been known that the wave speed of the mean modes follows the mean velocity of the ‘2-D’ axial base flow, i.e.
 $\int _0^1U_x(r)\,\text {d}r$ in pipe flow (see e.g. Drazin & Reid Reference Drazin and Reid1981), which gives
 ${2}/{3}$ in the no-slip case (Schmid & Henningson Reference Schmid and Henningson1994). In our case, the wave speed of the mean modes is decreased by the slip, reducing to 0.5559 for
 $l_x=0.5$ (
 ${833.868}/({0.5\times 3000})$, see the eigenvalue in table 1) which is very close to
 ${5}/{9}$ given by
 $\int _0^1U_x(r)\,\text {d}r$ with the base flow shown in (2.11). The wall modes, which are located close to the wall, move at lower speed than the centre modes, which are located close to the pipe centre and move at speeds close to the centreline velocity. Since we fix the volume flux of the flow while the slip length is varied, the speed of the base flow close to the wall increases as
 $l_x$ increases, whereas the speed near the pipe centre decreases, i.e. the velocity profile becomes flatter, see the base flow given by (2.11). Therefore, it can be expected that as
 $l_x$ increases, the speed of the wall modes increases and that of the centre modes decreases, and all three types of modes move at closer speeds. This is exactly what the compression in the vertical direction of the spectrum reveals. The other noticeable effect is that the slip brings the adjacent eigenvalues associated with the mean modes closer as the slip length increases, causing a seeming degeneracy of the spectrum, see figure 1(b).
Spectrum of the flow at  $Re=3000$ with
 $l_x=0.005$ (circles), 0.05 (triangles) and 0.5 (squares). (a) The mode
 $(\alpha ,n)=(0,1)$. (b) The mode
 $(\alpha ,n)=(0.5,1)$.

The convergence of the eigenvalue corresponding to the mean mode (arbitrarily selected) and the rightmost wall mode and centre mode as the radial grid number  $N$. The streamwise slip cases of
 $l_x=0.005$, 0.05 and 0.5 for
 $Re=3000$,
 $\alpha =0.5$,
 $n=1$ and
 $l_{\theta }=0$ are listed.

Figure 2 shows the maximum of the real part of the eigenvalue,  $\max {\lambda _r}$, as a function of the streamwise wavenumber,
 $\alpha$, for
 $Re=3000$ and
 $10^4$. For each
 $Re$, slip lengths
 $l_x=0.1$ and 1.0, and azimuthal wavenumbers
 $n=0$, 1, 2, 3 and 4, are considered. The trend shown in the figure suggests that, for both Reynolds numbers,
 $\alpha =0$ is nearly the least stable mode, i.e. the slowest decaying mode given that all
 $\max {\lambda _r}$ are negative, regardless of the slip length. At small
 $\alpha$, where
 $\max {\lambda _r}$ is largest, the results suggest that
 $n=1$ is always the least stable one. At larger
 $\alpha$, however,
 $n=1$ is still the least stable when
 $l_x$ is small, see the case of
 $l_x=0.1$ in figure 2(a,c), but is not in a range of
 $\alpha$ around
 $\alpha =1$, see the case of
 $l_x=1.0$ in figure 2(b,d). Nevertheless, in this range,
 $\max {\lambda _r}$ is much smaller than that in the small
 $\alpha$ regime. Therefore, as we are most interested in the least stable mode, in the following, we will focus on the
 $n=1$ modes. In fact, for the
 $\alpha =0$ modes, we can rigorously prove that
 $n=1$ is the least stable azimuthal wavenumber, see appendix B.
The maximum eigenvalue,  $\max {\lambda _r}$, as a function of
 $\alpha$, for
 $Re=3000$ (a,b) and
 $10^4$ (c,d). For each Reynolds number, azimuthal wavenumbers
 $n=0$, 1, 2, 3, 4 and slip lengths
 $l_x=0.1$ and 1.0 are shown.

Figure 3 shows  $\max {\lambda _r}$ as a function of
 $\alpha$ of the
 $n=1$ modes for (a)
 $Re=3000$ and (b)
 $Re = 10^4$. For each
 $Re$, overall
 $\max {\lambda _r}$ increases as
 $l_x$ increases, i.e. the
 $n=1$ modes decay more slowly as
 $l_x$ increases. The insets show the close-up of the small
 $\alpha$ region, in which the dependence of
 $\max {\lambda _r}$ on
 $\alpha$ is not monotonic, with the maximum appearing at some small but finite
 $\alpha$ instead of
 $\alpha =0$. Nevertheless, the difference between the peak value and the value for
 $\alpha =0$ is very small, i.e.
 $\alpha =0$ is nearly the least stable mode, as aforementioned. In fact, the dependence on
 $l_x$ is not fully monotonic either, see the very small region around
 $\alpha =0.03$ for the
 $l_x=0.005$ (the thin black line) and
 $l_x=0.05$ (the blue line) cases as shown in the inset in figure 3(a) and around
 $\alpha =0.01$ in the inset in figure 3(b). However, for
 $\alpha =0$ and in most range of
 $\alpha$, our results show a monotonic increase of
 $\max {\lambda _r}$ as
 $l_x$ increases.
The influence of streamwise slip on  $\max {\lambda _r}$ of
 $n=1$ modes for (a)
 $Re=3000$ and (b)
 $Re = 10^4$. Slip lengths of
 $l_x=0.005$ (thin black), 0.05 (blue) and 0.5 (bold red) are shown. The insets show the close-up of the regions with very small
 $\alpha$.

Figure 4 illustrates the dependence of  $\max {\lambda _r}$ of the
 $n=1$ modes on
 $l_x$ in a broader range of
 $l_x$. For each
 $Re$,
 $\alpha =0$, 0.1, 0.5, 1 and 2 are shown. The trend shows that as
 $l_x$ keeps increasing,
 $\max {\lambda _r}$ seems to asymptotically approach a plateau with a negative value, i.e. all the modes shown in the figure appear to be linearly stable, for both Reynolds numbers.
The  $\max {\lambda _r}$ of
 $n=1$ modes with
 $\alpha =0$, 0.1, 0.5, 1.0 and 2.0 as a function of
 $l_x$ for (a)
 $Re=3000$ and (b)
 $Re=10^4$.

The above results suggest that, with streamwise slip, the flow is linearly stable to any perturbations, regardless of the slip length. In order to show evidence in a broader parameter regime, we numerically searched for the global maximum of  $\max {\lambda _r}$ over
 $\alpha$ and
 $n$ and explored a wider range of
 $l_x$ up to 10 and of
 $Re$ up to
 $10^6$. Practically, based on our analysis, we only need to search in a small range of
 $\alpha$ immediately above zero (see the insets in figure 3) while setting
 $n=1$. Specifically, we search the range of [0, 1.2] at
 $Re=100$, and the range is decreased as
 $Re^{-1}$ for higher Reynolds numbers. Then we plotted the global maximum of
 $\max {\lambda _r}$, still denoted as
 $\max {\lambda _r}$, as a function of
 $l_x$, for a few Reynolds numbers ranging from
 $10^2$ to
 $10^6$ in figure 5(a).
(a) The global maximum of  $\max {\lambda _r}$, i.e. the maximum of
 $\max {\lambda _r}$ over
 $\alpha$ and
 $n$, for
 $Re=100$, 1000,
 $1\times 10^4$,
 $1\times 10^5$ and
 $1\times 10^6$ (symbols). The bold black line shows the maximum
 $\max {\lambda _r}$ of the
 $\alpha =0$ modes, which is associated with the
 $(\alpha , n)=(0, 1)$ mode and is independent of
 $Re$. The dashed line marks the value for the
 $(\alpha , n)=(0, 1)$ mode in the no-slip case (Meseguer & Trefethen Reference Meseguer and Trefethen2003). The inset shows the close-up at
 $l_x=0.005$. (b) The product of
 $Re$ and
 $\alpha _{max{\lambda _r}}$ (the
 $\alpha$ at which
 $\max {\lambda _r}$ takes the maximum) plotted against
 $Re$.

It is interesting to note that our data for high Reynolds numbers all collapse over the whole  $l_x$ range investigated, see the cases with
 $Re$ above
 $1\times 10^4$ in figure 5, suggesting that the maximum eigenvalue of the system is independent of
 $Re$. At lower Reynolds numbers, e.g.
 $Re=100$ and
 $10^3$ in the figure, there is almost a collapse for small
 $l_x$ (
 $\lesssim 0.1$) but a small deviation from the high Reynolds number cases can be seen, see the inset that shows the close-up at
 $l_x=0.005$. As
 $l_x$ increases further, the maximum eigenvalue for
 $Re=100$ and
 $10^3$ approaches that of
 $\alpha =0$ modes, which is strictly
 $Re$-independent (see the proof in § 5.1). In addition, the figure also shows that the global maximum of
 $\max {\lambda _r}$ is slightly larger than the maximum of the
 $\alpha =0$ modes over the whole
 $l_x$ range and the difference is most significant at small
 $l_x$. We did not explore further larger
 $l_x$ considering that the range we investigated is already much larger than the slip length that can be encountered in applications (
 $\lesssim 0.1$ in set-ups with characteristic length of one millimetre or larger, because so far the maximum slip length achieved in experiments is
 $O(100)\ \mathrm {\mu }\textrm {m}$, see Lee, Choi & Jim (Reference Lee, Choi and Jim2008), Voronov et al. (Reference Voronov, Papavassiliou and Lee2008) and Lee & Jim (Reference Lee and Jim2009)). Nevertheless, the
 $S$-shaped trend as
 $l_x$ increases suggests that the flow remains stable no matter how large the slip length is. In fact, as
 $l_x\to \infty$, the full-slip boundary condition is recovered, and the velocity profile of the base flow will be completely flat and no mean shear exists, in which case linear stability can be expected for any perturbations. Figure 5(b) shows the product of
 $Re$ and the
 $\alpha$ at which
 $\max {\lambda _r}$ maximizes globally, denoted as
 $\alpha _{max{\lambda _r}}$. Interestingly, it seems that this product is a constant when
 $l_x$ is small (
 $\lesssim 0.1$) for all the
 $Re$ investigated, and approaches a constant as
 $Re$ is sufficiently high (
 $\gtrsim 10^4$) if
 $l_x\gtrsim 0.1$. This indicates that
 $\alpha _{max{\lambda _r}}$ scales as
 $Re^{-1}$ for either not very large
 $l_x$ or in high-Reynolds-number regime. It should be noted that we observed a non-monotonic dependence of
 $\alpha _{max{\lambda _r}}\cdot Re$ on the slip length, which minimizes at around
 $l_x=0.1$.
That the global  $\max {\lambda _r}$ is
 $Re$-independent, as our results suggest, indicates that the slowest exponential decay rate (referred to as decay rate for simplicity hereafter) of perturbations scales as
 $Re^{-1}$ given that the scaled time
 $\tau ={t}/{Re}$ is used in our formulation, see (2.2). The same scaling was observed by the calculation of Meseguer & Trefethen (Reference Meseguer and Trefethen2003) for the
 $(\alpha ,n)=(0,1)$ mode of the classic pipe flow. Therefore, our results suggest that, as
 $Re\to \infty$, the decay rate of perturbations asymptotically approaches zero and remains negative, i.e. the flow is linearly stable at arbitrary Reynolds number. The
 $Re^{-1}$-scaling of the slowest decay rate can be rigorously proved for the
 $\alpha =0$ modes, see § 5.1.
In a word, in the pure streamwise slip case, we did not observe any linear instability in the large ranges of  $l_x$ and
 $Re$ that we considered, and based on the data shown in figure 5, we propose that streamwise slip destabilizes the flow but does not cause linear instability, regardless of the slip length and Reynolds number. A similar destabilizing effect was reported by Průša (Reference Průša2009) for the isotropic slip case.
4. Azimuthal slip
We consider the case of  $l_{\theta }\neq 0$ and
 $l_x=0$ as the limiting case of azimuthal slip being significant and streamwise slip being negligible.
The effect of azimuthal slip on the spectrum is investigated for  $Re=3000$ and is shown in figure 6 for the modes
 $(\alpha ,n)=(0,1)$ and
 $(0.5,1)$. Similar to the streamwise slip case, the eigenvalues of the
 $\alpha =0$ mode also fall on the
 $\lambda _i=0$ line and in the left half-plane, see figure 6(a). This suggests that the eigenvalues of streamwise-independent modes are all real and negative. We provide a rigorous proof of this observation in § 5.1. As
 $l_{\theta }$ increases, similar to the streamwise slip case, we also observed two groups of eigenvalues. One group remains constant as the azimuthal slip length changes and the other shifts to the right, see the inset in figure 6(a). As we theoretically show in §§ 5.2 and 5.3, the former group is associated with the disturbances with
 $\varPhi \equiv 0$ and is independent of
 $l_{\theta }$, and the latter group is associated with the disturbances with
 $\varPhi \not \equiv 0$. The rightmost eigenvalue belongs to the former group for
 $l_{\theta }<1$ and can only be overtaken by the latter group if
 $l_{\theta }>1$ (the two groups precisely overlap when
 $l_{\theta }=1$), i.e. the rightmost eigenvalue can only increase with
 $l_{\theta }$ if
 $l_{\theta }>1$. For the
 $\alpha =0.5$ and
 $n=1$ mode, the mean mode branch overall does not show either a vertical or horizontal shift, but adjacent eigenvalues are brought closer by the increasing slip length, and for
 $l_{\theta }=0.5$ there is almost an eigenvalue degeneracy (see the inset in figure 6b). The centre mode branch is nearly unchanged as
 $l_{\theta }$ increases. However, the wall mode branch is significantly affected. As
 $l_{\theta }$ increases, the wall mode overtakes the centre mode and becomes the least stable perturbation, and as
 $l_{\theta }$ is sufficiently large, the rightmost eigenvalue appears in the right half-plane, indicating the onset of a linear instability. In contrast to the streamwise slip case, the wave speed of the mean modes does not change because the speed follows
 $\int _0^1U_x(r)\,\text {d}r$, as aforementioned, and the base flow
 $\boldsymbol {U}(r)$ is not affected by the azimuthal slip. The speed of the centre modes is also not affected, whereas the wave speed of the wall modes is considerably decreased by the slip. This is reasonable because the slip boundary condition should mostly affect the flow close to the wall and should not affect significantly the flow far from the wall.
Spectrum of the flow at  $Re=3000$ with
 $l_{\theta }=0.005$ (circles), 0.05 (triangles) and 0.5 (squares). (a) The mode
 $(\alpha ,n)=(0,1)$. (b) The mode
 $(\alpha ,n)=(0.5,1)$.

Figure 7 shows  $\max {\lambda _r}$ maximized over
 $\alpha$ (over [0, 2] in practice), still denoted as
 $\max {\lambda _r}$, as a function of
 $l_{\theta }$ for
 $n=0$, 1, 2, 3 and 4 at
 $Re=3000$. Overall,
 $\max {\lambda _r}$ increases monotonically as
 $l_{\theta }$ increases, while the
 $n=0$ case seems to remain constant until it starts to increase at around
 $l_{\theta }=0.4$. In the small
 $l_{\theta }$ regime, all modes are linearly stable. As
 $l_{\theta }$ is increased to around 0.1,
 $\max {\lambda _r}$ of the
 $n=1$ mode becomes positive, indicating a linear instability. As
 $l_{\theta }$ increases further,
 $n=2$ and 3 also become unstable. In the whole range of
 $l_{\theta }$ investigated,
 $n=1$ is the least stable/most unstable one, which is also the case for other Reynolds numbers we investigated. Therefore, in the following, we mainly discuss the
 $n=1$ modes.
The  $\max {\lambda _r}$ maximized over
 $\alpha$, still denoted as
 $\max {\lambda _r}$, as a function of
 $l_{\theta }$. Modes with
 $n=0$, 1, 2, 3 and 4 are shown for
 $Re=3000$.

Figure 8 shows  $\max {\lambda _r}$ of modes
 $\alpha =0.1$, 0.5, 1.0 and 2.0 for
 $Re=3000$ and
 $n=1$ as a function of
 $l_{\theta }$. The results show that when
 $l_{\theta }$ is small, overall
 $\max {\lambda _r}$ decreases as
 $\alpha$ increases. As
 $l_{\theta }$ is increased, some moderate
 $\alpha$ turns to be the least stable/most unstable mode, see the crossover of
 $\alpha =0.1$ (cyan thin line) and 0.5 (red dashed line) cases in the figure. Figure 8(b) shows the small
 $l_{\theta }$ range, in which it appears that
 $\max {\lambda _r}$ first remains nearly unchanged and then starts to increase, and the trend shows that the larger
 $\alpha$, the later
 $\max {\lambda _r}$ starts to increase as
 $l_{\theta }$ is increased. The same behaviour is also observed for
 $\alpha =0$ modes and we will show a rigorous proof of this behaviour in § 5.3. Interestingly, the case of
 $\alpha =2$ seems to remain unchanged up to
 $l_{\theta }=2.0$.
(a) The  $\max {\lambda _r}$ of modes
 $\alpha =0.1$, 0.5, 1.0 and 2.0 for
 $Re=3000$ and
 $n=1$ as a function of
 $l_{\theta }$. (b) The details in the small
 $l_{\theta }$ regime.

The dependence of  $\max {\lambda _r}$ on
 $\alpha$ is more comprehensively shown in figure 9. The smallest
 $l_{\theta }=0.005$ shows a monotonic decrease with increasing
 $\alpha$, which completely collapses onto the curve for
 $l_{\theta }=0$, i.e. the classic no-slip case. However, as
 $l_{\theta }$ increases,
 $\max {\lambda _r}$ significantly increases in the region of
 $0<\alpha \lesssim 1$ such that a bump appears in the curves, see those for
 $l_{\theta }=0.05$, 0.1 and 0.5. At a certain point, the bump reaches
 $\max {\lambda _r=0}$ and the flow starts to become linearly unstable if
 $l_{\theta }$ increases further, see the cases of
 $l_{\theta }=0.1$ and 0.5. As observed in figure 8 for the
 $\alpha =2$ case, the results suggest that
 $\max {\lambda _r}$ of sufficiently large
 $\alpha$ seems unaffected by azimuthal slip in the
 $l_{\theta }$ range investigated, see the collapse of all curves above
 $\alpha \simeq 1.2$ in figure 9. It should be noted that as
 $l_{\theta }$ becomes larger, the bump widens up, i.e.
 $\max {\lambda _r}$ is affected by the slip in a wider range of
 $\alpha$.
The  $\max {\lambda _r}$ of the
 $n=1$ modes as a function of
 $\alpha$ for
 $Re=3000$. The data for
 $l_{\theta }=0$, 0.005, 0.05, 0.1 and 0.5 are plotted. Note that the curves for
 $l_{\theta }=0$ (the black bold dotted line) and
 $l_{\theta }=0.005$ (the green thin solid line) coincide.

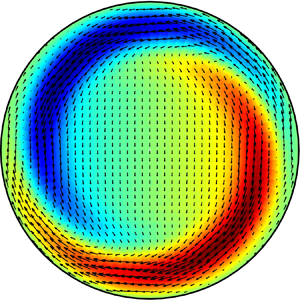
Figure 10 shows the velocity field of the most unstable perturbation of mode  $(\alpha ,n)=(0.383, 1)$ for
 $Re=3000$ with
 $l_{\theta }=0.1$. Figure 10(a) shows the in-plane velocity field in the
 $r-\theta$ pipe cross-section and figure 10(b) shows the pattern of the streamwise velocity in the
 $x-r$ cross-section. The patterns shown suggest that the flow manifests with a pair of helical waves. The flow structures are mostly located near the wall (
 $r\gtrsim 0.5$), indicating that the most unstable mode is a wall mode, which can also been seen in figure 6(b).
Visualization of the most unstable mode  $(\alpha ,n)=(0.383,1)$ for
 $Re=3000$ with
 $l_{\theta }=0.1$: (a) the
 $r\text{--}\theta$ cross-section and (b) the
 $x\text{--}r$ cross-section. In both panels, the streamwise velocity is plotted as the colourmap with red colour representing positive and blue representing negative values with respect to the base flow. In panel (a), the in-plane velocity field is plotted as arrows.

Obviously, azimuthal slip can cause linear instability given sufficiently large slip length. We can search in the  $l_{\theta }$–
 $\alpha$ plane to obtain the neutral stability curve for given
 $Re$ and
 $n$. Figure 11(a) shows the neutral stability curves for
 $Re=3000$ and
 $n=1$, 2 and 3 (
 $n=4$ and higher are all stable, see figure 7). It can be seen that, as
 $n$ increases, the unstable region shifts to the right and upward. However, as the results in figure 7 show,
 $n=1$ is the most unstable based on the eigenvalue maximized over
 $\alpha$ and, therefore, we only investigate the
 $n=1$ case in the following. Figure 11(b) shows the neutral stability curves for
 $n=1$ and
 $Re=3000$, 5000 and 7000. As
 $Re$ increases, the neutral stability curve moves towards the smaller
 $l_{\theta }$ region, indicating that, for a given
 $l_{\theta }$, the flow becomes more unstable as
 $Re$ increases, as expected. The data show that the wavelength of the unstable modes is comparable or significantly larger than the pipe diameter, whereas very long waves (
 $\alpha \to 0$) and short waves (
 $\alpha \gg 1.0$) are generally stable. That the flow is always stable to perturbations with
 $\alpha =0$, regardless of the value of
 $l_{\theta }$ and
 $Re$, can be rigorously proved (see § 5.1).
(a) The neutral stability curves for  $Re=3000$ and
 $n=1$, 2 and 3 in the
 $l_{\theta }$–
 $\alpha$ plane. (a) The neutral stability curves for
 $n=1$ and
 $Re=3000$, 5000 and 7000. (b) The critical Reynolds number
 $Re_{cr}$ as a function of
 $l_{\theta }$.

Further, for each  $l_{\theta }$, a critical Reynolds number
 $Re_{cr}$ can be determined by searching the first appearance of a positive
 $\max {\lambda _r}$ in the
 $l_{\theta }$–
 $\alpha$ plane by varying
 $Re$. Figure 11(c) shows
 $Re_{cr}$ as a function of
 $l_{\theta }$. As shown,
 $Re_{cr}$ is a few hundred if
 $l_{\theta }$ is large (
 $l_{\theta }\gtrsim 0.3$), but the trend suggests that it does not reduce to zero if
 $l_{\theta }\to \infty$. Since the classic pipe flow is linearly stable for arbitrary Reynolds number, there is an explosive increase in
 $Re_{cr}$ as
 $l_{\theta }$ decreases, which can be expected because the classic pipe flow will be recovered if
 $l_{\theta }\to 0$. We also explored the limit of
 $l_{\theta }\to \infty$, in which case the boundary condition for the azimuthal velocity becomes the full slip condition of
 \begin{equation} \dfrac{\partial u_{\theta}}{\partial r}=0. \end{equation}
The neutral stability curve for  $n=1$ in the
 $Re-\alpha$ plane is shown in figure 12, which shows that the unstable modes are still long waves with
 $\alpha$ approximately between 0 and 0.8. The critical Reynolds number (the nose of the curve) appears approximately at
 $Re_{{cr}}=260$.
The neutral stability curve in the  $Re-\alpha$ plane for
 $l_{\theta }=\infty$ and
 $n=1$.

5. Eigenvalues and eigenvectors of streamwise independent modes
We can rigorously prove the linear stability of the base flow to perturbations with  $\alpha =0$. In the following, we do not consider the
 $(\alpha ,n)=(0, 0)$ mode, which should be strictly stable as it is purely dissipative and there can be no energy production mechanism associated with it. In fact, the stability of the classic pipe flow to streamwise independent perturbations has already been proved by Joseph & Hung (Reference Joseph and Hung1971) using an energy analysis. Nevertheless, here we also account for the effect of the velocity slip and perform analytical studies on the eigenvalues and eigenvectors of
 $\alpha =0$ modes.
5.1. Proof of linear stability to  $\alpha =0$ modes

For  $\alpha =0$, the eigenvalue
 $\lambda$ of the operator
 $-M^{-1}L$ satisfies
 \begin{equation} \varGamma(n^2\varGamma)\varPhi+\lambda\varGamma\varPhi=0 \end{equation}
and
 \begin{equation} \dfrac{2\textrm{i}}{1+4l_x}\varPhi+\phi\varOmega+\lambda n^2\varOmega=0, \end{equation}
where  $\varPhi$ and
 $\varOmega$ compose the eigenvector
 $\boldsymbol {q}$ associated with
 $\lambda$ (see the definition of
 $q$ in (2.5)). The boundary conditions (2.12) and (2.13) reduce to
 \begin{equation} l_x\varOmega'+\varOmega=0 \end{equation}
and
 \begin{equation} l_{\theta}\varPhi''+\varPhi'=0. \end{equation}
It can be seen that for  $\alpha =0$ modes,
 $\varOmega$ and
 $\varPhi$ are decoupled in the boundary conditions (5.3) and (5.4).
We define a space  $\varTheta =\{\,f|\,f\in C^2[0, 1], f(0)=f(1)=0\}$ and an inner product associated with this space
 \begin{equation} (\,f_1,\,f_2)=\int_0^1r\,f_1\bar{f}_2\,\textrm{d}r, \end{equation}
where the overbar represents the complex conjugate. Then the operator  $\varGamma$ has the following two properties:
(a)
(5.6)\begin{equation} (\varGamma \,f_1, \,f_2)=(\,f_1, \varGamma \,f_2),\quad \forall\, f_1, \,f_2\in \varTheta, \end{equation}

 \begin{align} (\varGamma \,f_1,\, f_2)&=\int_0^1r\left(\, \dfrac{f_1}{r^2}-\dfrac{1}{r}\dfrac{\text{d}}{\text{d}r}\left(\dfrac{r}{n^2}\dfrac{\text{d}\,f_1}{\text{d}r}\right)\right)\bar{f}_2\,\text{d}r =\int_0^1\,\dfrac{f_1\bar{f}_2}{r}\text{d}r-\int_0^1\bar{f}_2\text{d}\left(\dfrac{r}{n^2}\dfrac{\text{d}\,f_1}{\text{d}r}\right) \nonumber\\ &=\left.\int_0^1\,\dfrac{f_1\bar{f}_2}{r}\text{d}r-\bar{f}_2\left( \dfrac{r}{n^2}\dfrac{\text{d}\,f_1}{\text{d}r}\right)\right|_0^1+\int_0^1\dfrac{r}{n^2}\dfrac{\text{d}\,f_1}{\text{d}r}\,\text{d}\bar{f}_2 =\int_0^1\,\dfrac{f_1\bar{f}_2}{r}\text{d}r +\! \int_0^1\dfrac{r}{n^2}\dfrac{\text{d}\bar{f}_2}{\text{d}r}\,\text{d}\, f_1 \end{align}
and similarly, using integration by parts, it can be derived that
 \begin{equation} (\,f_1, \varGamma\, f_2)=\!\int_0^1r\left( \dfrac{\bar{f}_2}{r^2}-\dfrac{1}{r}\dfrac{\text{d}}{\text{d}r}\left(\dfrac{r}{n^2}\dfrac{\text{d}\bar{f}_2}{\text{d}r}\right)\right)\,f_1\,\text{d}r \!=\!\int_0^1\,\dfrac{f_1\bar{f}_2}{r}\text{d}r +\! \int_0^1\dfrac{r}{n^2}\dfrac{\text{d}\bar{f}_2}{\text{d}r}\text{d}\, f_1\!=\!(\varGamma\, f_1,\, f_2); \end{equation}
(b)
(5.9)\begin{equation} (\varGamma f, f)\geqslant 0,\quad \forall\, f\in\varTheta, \end{equation}

Proof. taking  $f=\,f_1=\,f_2$ in proof 5.1,
 \begin{equation} (\varGamma f, f)=\int_0^1\dfrac{f\bar{f}}{r}\,\text{d}r + \int_0^1\dfrac{r}{n^2}\dfrac{\text{d}\bar{f}}{\text{d}r}\,\text{d}f =\int_0^1\dfrac{f\bar{f}}{r}\text{d}r+\int_0^1\dfrac{r}{n^2}\dfrac{\text{d}\bar{f}}{\text{d}r}\dfrac{\text{d}f}{\text{d}r}\,\text{d}r \geqslant 0. \end{equation}
Note that property (5.9) still holds for those  $f$ with
 $f(1)\neq 0$ but satisfies
 $f(1)+bf'(1)=0$, where
 $b>0$ is a constant, because
 \begin{align} (\varGamma f, f)&=\left.\int_0^1\dfrac{f\bar{f}}{r}\,\text{d}r-f\left(\dfrac{r}{n^2}\dfrac{\text{d}\bar{f}}{\text{d}r}\right)\right|_0^1 +\int_0^1\dfrac{r}{n^2}\dfrac{\text{d}\bar{f}}{\text{d}r}\,\text{d}f \nonumber\\ &=\int_0^1\dfrac{f\bar{f}}{r}\,\text{d}r +\int_0^1\dfrac{r}{n^2}\dfrac{\text{d}\bar{f}}{\,\text{d}r}\dfrac{\text{d}f}{\text{d}r}\,\text{d}r + \dfrac{1}{b n^2}f(1)\bar{f}(1)\geqslant0. \end{align}
First, for the case of  $\varPhi \equiv 0$ (i.e. the wall-normal velocity component
 $u_r\equiv 0$) and
 $\varOmega \not \equiv 0$, (5.2) becomes
 \begin{equation} \phi\varOmega+\lambda n^2\varOmega=0 \end{equation}
and the operators  $\phi$ and
 $\varGamma$ are related as
 \begin{equation} \phi=\dfrac{n^4}{r^2}-\dfrac{1}{r}\dfrac{\text{d}}{\text{d}r}\left(n^2r\dfrac{\text{d}}{\text{d}r}\right) =n^4\varGamma. \end{equation}
Therefore, (5.12) becomes
 \begin{equation} n^4\varGamma\varOmega+\lambda n^2\varOmega=0. \end{equation}
Taking the inner product of (5.14) with  $\varOmega$, we have
 \begin{equation} (n^4\varGamma\varOmega, \varOmega)+(\lambda n^2\varOmega, \varOmega)=0. \end{equation}
According to property (5.9),  $(n^4\varGamma \varOmega , \varOmega )\geqslant 0$ given
 $\varOmega (1)=0$ (without streamwise slip) or
 $\varOmega (1)+l_x \varOmega '(1)=0$ (with streamwise slip), which leads to
 $\lambda <0$, i.e. the eigenvalue is real and negative.
Second, we discuss the  $\varPhi \not \equiv 0$ case, i.e. the wall-normal velocity component
 $u_r\not \equiv 0$. From (5.1), by denoting
 $g=n^2\varGamma \varPhi +\lambda \varPhi$, we have
 $\varGamma g=0$, i.e.
 \begin{equation} n^2g=r(rg')', \end{equation}
from which it can be obtained that
 \begin{equation} r^ng=Cr^{2n}+C_1, \end{equation}
where  $C$ and
 $C_1$ are constants. Note that for
 $n=2$,
 $r^2g=n^2r^2\varGamma \varPhi +\lambda r^2\varPhi =n^2\varPhi -nr(r\varPhi ')'$ has to vanish at
 $r=0$, because
 $\varPhi$ vanishes, and
 $\varPhi '$ and
 $\varPhi ''$ are finite at
 $r=0$. The same applies to
 $n>2$. If
 $n=1$,
 $rg={\varPhi }/{r}-(r\varPhi ')'+\lambda r\varPhi ={\varPhi }/{r}-\varPhi '-r\varPhi ''+\lambda r\varPhi$, which also vanishes when
 $r\to 0$ (using L’H
 $\hat{{\rm o}}$pital's rule). Therefore,
 $C_1\equiv 0$ and
 $r^ng =Cr^{2n}$, i.e.
 \begin{equation} n^2\varGamma \varPhi + \lambda\varPhi =Cr^n. \end{equation}
5.1.1. The case without azimuthal slip, i.e. $l_{\theta }=0$

In case of  $l_{\theta }=0$, the boundary condition (2.13) or (5.4) becomes
 $\varPhi '=0$. Taking the inner product (5.5) of (5.18) and
 $\varGamma \varPhi$, we have
 \begin{equation} n^2(\varGamma\varPhi, \varGamma\varPhi)+\lambda(\varPhi,\varGamma\varPhi)=C(r^n,\varGamma\varPhi)=C(\varGamma r^n, \varPhi)=C(0, \varPhi)=0. \end{equation}
The second equality in (5.19) holds in spite of the fact that  $r^n\notin \varTheta$ and thus, property (5.6) cannot be applied directly. Nevertheless, as
 $\varPhi =\varPhi '=0$ at
 $r=1$ in the case of
 $l_{\theta }=0$, property (5.6) still holds (this can be seen by taking
 $\varPhi$ as
 $\,f_2$ and
 $r^n$ as
 $\,f_1$ in proof 5.1). What follows is that the eigenvalue
 $\lambda$ is real and
 $\lambda < 0$ because
 $(\varGamma \varPhi , \varGamma \varPhi )>0$ and
 $(\varPhi , \varGamma \varPhi )>0$.
5.1.2. The case with azimuthal slip, i.e. $l_{\theta }\neq 0$

In the case of  $l_{\theta }\neq 0$, (5.19) does not hold, except for
 $C=0$, because
 $\varPhi '=0$ at
 $r=1$ does not necessarily hold and therefore the second equality in (5.19) does not hold either. For
 $C\neq 0$, consider the special case of
 $C=1$ (if
 $C\neq 1$, a rescaling of
 $\tilde \varPhi =\varPhi /C$ can easily convert to this special case), (5.18) can be written as
 \begin{equation} (n^2+\lambda r^2)\varPhi -r(r\varPhi')'=(n^2+\lambda r^2)\varPhi -r(\varPhi'+r\varPhi'')=r^{n+2}. \end{equation}
As  $r\to 1$, (5.20) turns to
 \begin{equation} -(\varPhi'+\varPhi'')=1. \end{equation}
Further, the azimuthal slip requires
 \begin{equation} \varPhi'(1)+l_{\theta} \varPhi''(1)=0, \hspace{2mm} l_{\theta}\in(0,+\infty). \end{equation}
It follows that, for  $l_{\theta }=1$,
 $C$ has to be zero, otherwise (5.21) and (5.22) would conflict with each other. That
 $C=0$ leads to
 $\lambda <0$, see (5.19). For
 $l_{\theta }\neq 1$, one can solve for
 $\varPhi '(1)$ from (5.21) and (5.22) as
 \begin{equation} \varPhi'(1)=\dfrac{l_{\theta}}{1-l_{\theta}}, \end{equation}
which indicates that  $\varPhi '(1)$ is real and
 $\varPhi '(1)\in (-\infty , -1)\cup (0, +\infty )$.
It can be verified that (5.20) has a special solution
 \begin{equation} \varPhi=\dfrac{r^n}{\lambda} \end{equation}
and its corresponding homogeneous differential equation is
 \begin{equation} r^2\varPhi''+r\varPhi'-(n^2+\lambda r^2)\varPhi=0. \end{equation}
From the theory of ordinary differential equations, this equation has two linearly independent solutions in  $(0, 1]$. One of the two solutions can be represented as a generalized power series
 \begin{equation} \varPhi_1=\sum_{m=0}^{\infty}B_mr^{m+\rho} \quad (B_0\neq 0), \end{equation}
in which it can be obtained that  $\rho =n$,
 $B_{2k+1}=0$ and
 $B_{2k}=({\lambda }/{4})^k({B_0}/{k!(n+k)!})$ using the standard method of undetermined coefficients. Denoting
 $a_n=B_0$, (5.26) can be written as
 \begin{equation} \varPhi_1=a_n r^n\sum_{k=0}^{\infty} \left(\dfrac{\lambda}{4}\right)^k\dfrac{r^{2k}}{k!(n+k)!}. \end{equation}
The other solution of (5.25) has the following form:
 \begin{equation} \varPhi_2=\varPhi_1\int_1^r\dfrac{1}{\varPhi_1^2(s)}\exp{\left(-\int_1^s\dfrac{1}{t}\,\text{d}t\right)}\,\text{d}s=\varPhi_1\int_1^r\dfrac{1}{s\varPhi_1^2(s)}\,\text{d}s. \end{equation}
However, by L’H $\hat{{\rm o}}$pital's rule,
 \begin{equation} \lim_{r\to 0}\varPhi_2(r)=\lim_{r\to 0}\dfrac{\int_1^r\dfrac{1}{s\varPhi_1^2(s)}\,\text{d}s}{\dfrac{1}{\varPhi_1(r)}}=\lim_{r\to 0}\dfrac{\dfrac{1}{r\varPhi_1^2(r)}}{\dfrac{\varPhi_1'(r)}{\varPhi_1^2(r)}}=\infty, \end{equation}
which is unphysical, and therefore  $\varPhi _2$ should not appear in the general solution of (5.20), i.e. the general solution of (5.20) can be solved as
 \begin{equation} \varPhi=\dfrac{1}{\lambda}r^n+a_n r^n\sum_{k=0}^{\infty}\left(\dfrac{\lambda}{4}\right)^k\dfrac{r^{2k}}{k!(n+k)!}. \end{equation}
For simplicity, denoting  $\mu ={\lambda }/{4}$ and using the boundary condition
 $\varPhi (1)=0$, one can solve for
 $a_n$ as
 \begin{equation} a_n=-\dfrac{1}{4\mu}\left(\sum_{k=0}^{\infty}\dfrac{\mu^k}{k!(n+k)!}\right)^{-1}, \end{equation}
consequently,
 \begin{equation} \varPhi'(1)=\dfrac{n}{4\mu}+a_n\sum_{k=0}^{\infty}\dfrac{\mu^k(n+2k)}{k!(n+k)!} \nonumber\\ =-\dfrac{1}{4\mu}\left(\sum_{k=0}^{\infty}\dfrac{\mu^k}{k!(n+k)!}\right)^{-1}\sum_{k=0}^{\infty}\dfrac{2k\mu^k}{k!(n+k)!}, \end{equation}
i.e.  $\mu$ satisfies
 \begin{equation} \sum_{k=1}^{\infty}\dfrac{k\mu^{k-1}}{k!(n+k)!}+2\varPhi'(1)\sum_{k=0}^{\infty}\dfrac{\mu^k}{k!(n+k)!}=0. \end{equation}
In the following, we prove that  $\mu$ has to be real and
 $\mu <0$ given (5.33). For simplicity, let
 $s=\varPhi '(1)$ and define
 $f(z)$ as
 \begin{equation} f(z)=\sum_{k=0}^{\infty}\dfrac{z^k}{k!(n+k)!}, \end{equation}
where  $z$ is complex. Then, (5.33) states that
 $\mu$ is a root of the equation
 $f'(z)+2sf(z)=0$. Note that
 \begin{align} \left(z^{n+1}f'(z)\right)'&=\left(\sum_{k=1}^{\infty}\dfrac{kz^{n+k}}{k!(n+k)!}\right)' = z^n \sum_{k=1}^{\infty}\dfrac{z^{k-1}}{(k-1)!(n+k-1)!}\nonumber\\ &=z^n\sum_{k=0}^{\infty}\dfrac{z^k}{k!(n+k)!}=z^nf(z). \end{align}
Then, defining  $\,f_{\mu }(z)=f(\mu z)$, it can be verified that
 \begin{equation} (z^{n+1}\,f_{\mu}'(z))'=\mu z^n\,f_{\mu}(z), \end{equation}
in which the prime denotes the derivative with respect to  $z$. Further, note that
 $\bar {\mu }$ is also a root of (5.33), because the coefficients are all real. That is to say,
 \begin{equation} (z^{n+1}\,f_{\bar{\mu}}'(z))'=\bar{\mu} z^n\,f_{\bar{\mu}}(z), \end{equation}
where  $\,f_{\bar {\mu }}=f(\bar {\mu } z)$. Then, the difference between (5.36) multiplied by
 $\,f_{\bar {\mu }}(z)$ and (5.37) multiplied by
 $\,f_{\mu }(z)$, integrated along the real axis from 0 to 1, gives that
 \begin{align} &\int_0^1(z^{n+1}\,f_{\mu}'(z))'\,f_{\bar{\mu}}(z)\,\text{d}z-\int_0^1(z^{n+1}\,f_{\bar{\mu}}'(z))'\,f_{\mu}'(z)\,\text{d}z\nonumber\\ &\quad \left.= z^{n+1}\,f_{\mu}'(z)\,f_{\bar{\mu}}(z)\right|_0^1 \left.-\!\int_0^1z^{n+1}\,f_{\mu}'(z)\text{d}\,f_{\bar{\mu}}(z)-z^{n+1}\,f_{\bar{\mu}}'(z)\,f_{\mu}(z)\right|_0^1\!+\!\int_0^1z^{n+1}\,f_{\bar{\mu}}'(z)\,\text{d}\,f_{\mu}(z) \nonumber\\ &\quad=\int_0^1z^{n+1}|\,f_{\mu}'(z)|^2\,\text{d}z - \int_0^1z^{n+1}|\,f_{\mu}'(z)|^2\,\text{d}z + \,f_{\mu}'(1)\,f_{\bar{\mu}}(1) -\,f_{\mu}(1)\,f_{\bar{\mu}}'(1) \nonumber\\ &\quad = 2s(\bar{\mu}-\mu)|\,f_{\mu}(1)|^2 =(\mu-\bar{\mu})\int_0^1z^n|\,f_{\mu}(z)|^2\,\text{d}z, \end{align}
where the condition  $f'(z)+2sf(z)=0$ is used to derive
 $\,f_{\mu }'(z)+2\mu s\,f_{\mu }(z)=0$ and
 $\,f_{\bar {\mu }}'(z)+2\bar {\mu } s\,f_{\bar {\mu }}(z)=0$. Then we have
 \begin{equation} (\mu-\bar{\mu})\left(\int_0^1z^n|\,f_{\mu}(z)|^2\text{d}z+2s|\,f_{\mu}(1)|^2\right)=0. \end{equation}
Similarly, the sum of (5.36) multiplied by  $\,f_{\bar {\mu }}(z)$ and (5.37) multiplied by
 $\,f_{\mu }(z)$, integrated along the real axis from 0 to 1, gives that
 \begin{equation} (\mu+\bar{\mu})\left(\int_0^1z^n|\,f_{\mu}(z)|^2\,\text{d}z+2s|\,f_{\mu}(1)|^2\right)=-2\int_0^1z^{n+1}|\,f_{\mu}'(z)|^2\,\text{d}z, \end{equation}
which indicates  $\int _0^1z^n|\,f_{\mu }(z)|^2\,\text {d}z+2s|\,f_{\mu }(1)|^2\neq 0$ because the right-hand side is non-zero. Consequently, (5.39) indicates that
 $\mu -\bar {\mu }=0$, i.e.
 $\mu$ is real.
Subsequently, we can deduce that  $\mu <0$ if
 $s\in (0, \infty )$ because the term in the parentheses and the integral on the right-hand side of (5.40) are all positive. In case of
 $s\in (-\infty , -1)$, if
 $\mu$ were positive, one would obtain
 \begin{equation} -2s\sum_{k=0}^{\infty}\dfrac{\mu^k}{k!(n+k)!}=\sum_{k=1}^{\infty}\dfrac{k\mu^{k-1}}{k!(n+k)!}=\sum_{k=0}^{\infty}\dfrac{\mu^k}{k!(n+k+1)!}\leqslant \sum_{k=0}^{\infty}\dfrac{\mu^k}{k!(n+k)!} \end{equation}
and consequently  $-2s\leqslant 1$, which would conflict with
 $s\in (-\infty , -1)$. Therefore,
 $\mu <0$. Finally, we obtain that
 $\mu <0$ for
 $s\in (-\infty , -1)\cup (0, +\infty )$, i.e. for any value of
 $l_{\theta }\neq 1$. Since we have shown before that
 $\lambda <0$ for
 $l_{\theta }=1$ and for
 $l_{\theta }=0$, now we reach the conclusion that
 $\lambda$ is real and
 $\lambda <0$ for any
 $l_{\theta }\in [0, +\infty )$, regardless of
 $l_x$, i.e. the flow is rigorously linearly stable to perturbations with
 $\alpha =0$ with or without velocity slip.
5.2. Analytical solution of the eigenvalue and eigenvector for $\alpha =0$ modes

We consider the general case with both streamwise and azimuthal slip. For  $\varPhi \not \equiv 0$, if
 $C\neq 0$, we obtain from (5.33) that
 $\mu ={\lambda }/{4}$ satisfies
 \begin{equation} (1-l_{\theta})\sum_{k=1}^{\infty}\dfrac{k\mu^{k-1}}{k!(n+k)!}+2l_{\theta}\sum_{k=0}^{\infty}\dfrac{\mu^k}{k!(n+k)!}=0, \end{equation}
where (5.23) is used. The Bessel functions of integer order  $n$ and
 $n+1$ read
 \begin{equation} J_n(z)=\sum_{k=0}^{\infty}\dfrac{(-1)^k}{k!(n+k)!}\left(\dfrac{z}{2}\right)^{2k+n}=\left(\dfrac{z}{2}\right)^n\sum_{k=0}^{\infty}\dfrac{1}{k!(n+k)!}\left(-\dfrac{z^2}{4}\right)^k, \end{equation}
 \begin{equation} J_{n+1}(z)=\sum_{k=0}^{\infty}\dfrac{(-1)^k}{k!(n+1+k)!}\left(\dfrac{z}{2}\right)^{2k+n+1}=\left(\dfrac{z}{2}\right)^{n+1}\sum_{k=0}^{\infty}\dfrac{1}{k!(n+k+1)!}\left(-\dfrac{z^2}{4}\right)^k. \end{equation}
Denoting  $\mu =-({\eta ^2}/{4})$, i.e. the eigenvalue
 $\lambda =4\mu =-\eta ^2$, it can be observed that
 $\eta$ is a root of the equation
 \begin{equation} (1-l_{\theta})J_{n+1}(z)+l_{\theta} z J_n(z)=0. \end{equation}
Next, we show that  $C\neq 0$ if
 $l_{\theta }\neq 1$. Assuming
 $C=0$ and
 $l_{\theta }\neq 1$,
 $\varPhi '(1)+\varPhi ''(1)=0$ and the boundary condition
 $\varPhi '(1)+l_{\theta }\varPhi ''(1)=0$ would give
 $\varPhi '(1)=\varPhi ''(1)=0$. Recall that the solution to the homogeneous equation (5.25) is
 \begin{equation} \varPhi_1=a_n r^n\sum_{k=0}^{\infty} \left(\dfrac{\lambda}{4}\right)^k\dfrac{r^{2k}}{k!(n+k)!}, \end{equation}
where  $a_n$ is a constant. Using the notation of (5.34),
 \begin{equation} f(\mu)=\sum_{k=0}^{\infty}\mu^k\dfrac{1}{k!(n+k)!}=0 \end{equation}
results from  $\varPhi _1(1)=0$ (note that
 $\varPhi =\varPhi _1$ if
 $C=0$), which would indicate that the corresponding
 $\eta$ satisfies
 $J_n(z)=0$. Further,
 $\varPhi '(1)=0$ gives
 \begin{equation} \sum_{k=0}^{\infty}\mu^k\dfrac{n+2k}{k!(n+k)!}=0. \end{equation}
In combination with  $f(\mu )=0$, we would obtain that
 \begin{equation} \sum_{k=1}^{\infty}\mu^k\dfrac{1}{(k-1)!(n+k)!}=\sum_{k=0}^{\infty}\mu^k\dfrac{1}{k!(n+k+1)!}=0, \end{equation}
which means that  $\eta$ would also be a zero of
 $J_{n+1}(z)$, i.e.
 $\eta$ would be a zero of both
 $J_n(z)$ and
 $J_{n+1}(z)$. This would conflict with the fact that there exists no common zero of
 $J_n(z)$ and
 $J_{n+1}(z)$. Therefore,
 $C\neq 0$ and
 $\eta$ is a root of (5.45) if
 $l_{\theta }\neq 1$.
We have proved before that  $C=0$ if
 $l_{\theta }=1$, which gives
 $\varPhi =\varPhi _1$. Consequently,
 $\varPhi (1)=\varPhi _1(1)=0$ gives
 $f(\mu )=0$, which means
 $\eta$ is a root of
 $J_n(z)=0$, i.e.
 $\eta$ is also a root of (5.45) (note that the first term disappears if
 $l_{\theta }=1$). Therefore,
 $\eta$ is a root of (5.45) for any
 $l_{\theta }\geqslant 0$.
For the case of  $\varPhi \equiv 0$, (5.14) and the corresponding boundary condition
 $\varOmega (1)+l_x \varOmega '(1)=0$ (see (2.13) and (5.3)) imply that the eigenvector
 $\varOmega$ has the same form as the solution
 $\varPhi _1$, and we can deduce that
 $\lambda =-\gamma ^2$, in which
 $\gamma$ is a root of
 \begin{equation} (1+nl_x)J_n(z)-l_x z J_{n+1}(z)=0. \end{equation}
For an eigenvalue  $\lambda =-\eta ^2$, the corresponding eigenvector can be solved as
 \begin{gather} \varPhi=J_n(\eta r)-J_n(\eta)r^n, \end{gather}
 \begin{gather} \varOmega=b_nJ_n(\eta r)+\frac{2{\rm i}}{(1+4l_x)n^2}\left(\frac{r}{2\eta}J_{n+1}(\eta r)-\frac{J_n(\eta)}{\eta^2}r^n\right), \end{gather}
where  $b_n$ is a constant and should be determined by the boundary condition (5.3). For an eigenvalue
 $\lambda =-\gamma ^2$, the eigenvector can be solved as
 \begin{equation} \varPhi\equiv 0, \quad \varOmega=J_n(\gamma r). \end{equation}
To sum up, there are always two groups of eigenvalues, corresponding to  $\varPhi \equiv 0$ (given by (5.50)) and
 $\varPhi \not \equiv 0$ (given by (5.45)), respectively. Particularly, for the no-slip case, (5.45) reduces to
 $J_{n+1}(z)=0$ and (5.50) reduces to
 $J_n(z)=0$, and it is known that the zeros of
 $J_n(z)$ and
 $J_{n+1}(z)$ distribute alternately. Therefore, in the no-slip case, these two groups of eigenvalues distribute alternately. For the streamwise slip case, (5.45) still reduces to
 $J_{n+1}(z)=0$, i.e. the
 $\varPhi \not \equiv 0$ eigenvalues do not change with
 $l_x$, whereas the
 $\varPhi \equiv 0$ eigenvalues will change with
 $l_x$. However, there cannot be common roots between
 $J_{n+1}(z)=0$ and (5.50), otherwise there would be common zeros between
 $J_n(z)$ and
 $J_{n+1}(z)$, which conflicts with the fact that there are no common zeros between the two. Therefore, as
 $l_x$ changes, the two groups of eigenvalues distribute in the same alternating pattern as in the no-slip case and there is no overtaking between the two groups, see figures 1(a) and 13(a). However, this behaviour is not guaranteed in the azimuthal slip case as there can be common roots between (5.45) and (5.50) given
 $l_x=0$ and
 $l_{\theta }=1.0$, i.e. the roots of
 $J_n(z)=0$. Nonetheless, it should be noted that the common roots can only exist at
 $l_{\theta }=1.0$. This implies that, when eigenvalues change with
 $l_{\theta }$, an overtaking between the two groups may occur at precisely
 $l_{\theta }=1.0$.
Validation of the analytical eigenvalues against the numerical calculation for the case of  $Re=3000$,
 $n=1$,
 $l_x=1.0$ and
 $l_{\theta }=0$. In panel (a) the first 20 eigenvalues are shown as squares and circles, and the numerical results are shown as crosses. The circles are the first 10 eigenvalues (in descending order) for the cases with
 $\varPhi \equiv 0$ and the squares are the first 10 eigenvalues (in descending order) for the
 $\varPhi \not \equiv 0$ case. The abscissa shows the indices of the eigenvalues. (b) The relative error
 $\epsilon$ between the analytical and numerical ones.

Figure 13 shows the comparison between our analytical solution of the two groups of eigenvalues and numerical calculation for the streamwise slip case of  $Re=3000$,
 $n=1$,
 $l_x=1.0$ and
 $l_{\theta }=0$. In figure 13(a), blue circles are analytical solutions of the first 10 largest eigenvalues given by (5.50), i.e. the corresponding eigenvectors all have
 $\varPhi \equiv 0$, and red squares represent the first 10 largest eigenvalues given by (5.45), i.e. the corresponding eigenvectors all have
 $\varPhi \not \equiv 0$. Clearly, the leading eigenvalue is and will always be associated with
 $\varPhi \equiv 0$ disturbances because no overtaking between the two groups of eigenvalues can occur as
 $l_x$ varies, as we concluded in § 5.2. These analytical solutions agree very well with the numerical calculations (the crosses) with relative errors of
 $O(10^{-11})$ or lower, see figure 13(b). The eigenvector associated with the leading eigenvalue (the leftmost circle in figure 13a) is plotted in figure 14(a). The black line shows the analytical solution given by (5.53a,b) and the circles show the numerical calculation. The
 $\varPhi$ part of the eigenvector is not shown because
 $\varPhi \equiv 0$. Figure 14(b) shows the eigenvector associated with the second largest eigenvalue (the leftmost red square in figure 13a), which has a non-zero
 $\varPhi$ part. The figure shows that, for both
 $\varPhi$ and
 $\varOmega$, our analytical solutions (lines) agree very well with the numerical calculations (symbols). This comparison validates our theory about the eigenvalue and eigenvector.
Validation of the analytical eigenvectors against the numerical calculation for the case of  $Re=3000$,
 $n=1$,
 $l_x=1.0$ and
 $l_{\theta }=0$. (a) The
 $\varOmega$ component of the eigenvector associated with the leading eigenvalue (the leftmost blue circle in figure 13a). The
 $\varPhi$ component is zero and is not shown. (b) The
 $\varOmega$ and
 $\varPhi$ component of the eigenvector associated with the second largest eigenvalue (the leftmost red square in figure 13a).

The two groups of eigenvalues of the azimuthal slip cases of  $l_{\theta }=0.05$ and 2.0 for
 $Re=3000$,
 $n=1$ and
 $l_x=0$ are also shown in figure 15. Again, perfect agreement between the analytical and numerical ones is observed. We can see that, for
 $l_{\theta }=0.05$, the
 $\varPhi \not \equiv 0$ group is entirely below the
 $\varPhi \equiv 0$ group, which is independent of
 $l_{\theta }$, whereas it is entirely above the
 $\varPhi \equiv 0$ group for
 $l_{\theta }=2.0$, indicating that an overtaking indeed occurs between the two groups as
 $l_{\theta }$ increases. Therefore, for
 $l_{\theta }<1.0$, the leading eigenvalue is associated with
 $\varPhi \equiv 0$ disturbances and does not change with
 $l_{\theta }$ (see also figure 6a), whereas it is associated with
 $\varPhi \not \equiv 0$ disturbances and increases with
 $l_{\theta }$ for
 $l_{\theta }>1.0$.
Eigenvalues for  $Re=3000$,
 $n=1$ and
 $l_x=0$ with
 $l_{\theta }=0.05$ and 2.0. The abscissa shows the indices of the eigenvalues in descending order. In panel (a) analytical eigenvalues are shown as circles (
 $\varPhi \equiv 0$, for which eigenvalues are independent of
 $l_{\theta }$), squares (
 $\varPhi \not \equiv 0$ and
 $l_{\theta }=0.05$) and triangles (
 $\varPhi \not \equiv 0$ and
 $l_{\theta }=2.0$), and the numerical calculations are shown as crosses. Panels (b,c) show the close-up of the two ends of the spectrum shown in panel (a).

5.3. The dependence of the leading eigenvalue on slip length for $\alpha =0$ modes

Denoting  $F(z,l_{\theta })=(1-l_{\theta })J_{n+1}(z)+l_{\theta } zJ_n(z)$, it can be obtained that, as
 $z\to 0$,
 \begin{equation} J_n(z)\sim\dfrac{z^n}{2^n n!},\quad F(z,l_{\theta})\sim\left(\dfrac{1-l_{\theta}}{2^{n+1}(n+1)!}+\dfrac{l_{\theta}}{2^n n!}\right)z^{n+1}. \end{equation}
It can be seen that
 \begin{equation} \dfrac{1-l_{\theta}}{2^{n+1}(n+1)!}+\dfrac{l_{\theta}}{2^n n!}>0 \end{equation}
for  $l_{\theta }\geqslant 0$, therefore,
 $F(z,l_{\theta })$ is positive for sufficiently small
 $z$. Let
 $z_1$ be the minimum root of
 $F(z,l_{\theta 1})=0$ and
 $z_2$ be the minimum root of
 $F(z,l_{\theta 2})=0$. If
 $l_{\theta 1}<l_{\theta 2}$, it can be derived that
 \begin{align} F(z_1,l_{\theta 2})&=(1-l_{\theta 2})J_{n+1}(z_1)+l_{\theta 2} z_1J_n(z_1) = (1-l_{\theta 2})J_{n+1}(z_1)-\dfrac{1-l_{\theta 1}}{l_{\theta 1}}l_{\theta 2}J_{n+1}(z_1) \nonumber\\ &= \dfrac{l_{\theta 1}-l_{\theta 2}}{l_{\theta 1}}J_{n+1}(z_1)<0. \end{align}
In (5.56),  $J_{n+1}(z)>0$ follows from that, at the minimum positive zero of
 $J_{n+1}(z)$, denoted as
 $z_0$, we have
 $F(z_0,l_{\theta 1})<0$ because
 $J_n(z_0)<0$. We showed before that
 $F(z,l_{\theta 1})>0$ at sufficiently small
 $z$, therefore, the minimum positive zero of
 $F(z,l_{\theta 1})$,
 $z_1$, should be smaller than
 $z_0$ given that
 $F(z,l_{\theta 1})$ is continuous with respect to
 $z$, i.e.
 $z_1<z_0$, and therefore
 $J_{n+1}(z_1)>0$. Consequently, given
 $F(z_1,l_{\theta 2})<0$, there must be a zero in
 $(0, z_1)$, i.e.
 $z_2<z_1$ because the function
 $F(z,l_{\theta 2})$ is continuous with respect to
 $z$. This states that, for the case of
 $\varPhi \not \equiv 0$, the maximum eigenvalue
 $\lambda$, denoted as
 $\lambda _1$ in the following, increases as
 $l_{\theta }$ increases and is independent of
 $l_x$. Similarly, one can deduce that the minimum root of (5.50) decreases as
 $l_x$ increases, consequently, the maximum eigenvalue for the
 $\varPhi \equiv 0$ case, denoted as
 $\lambda _2$, increases as
 $l_x$ increases and is independent of
 $l_{\theta }$. For the special case of
 $l_x=0$, (5.50) becomes
 $J_n(z)=0$ and for the case of
 $l_{\theta }=1$, (5.45) turns into
 $zJ_n(z)=0$. Clearly, these two cases share the non-zero roots, i.e.
 $\lambda _1=\lambda _2$. Therefore, the minimum root of (5.50) is always greater than that of (5.45), i.e.
 $\lambda _1>\lambda _2$, when
 $l_{\theta }<1$. This explains why, for a given
 $l_{\theta }\leqslant 1$,
 $\max {\lambda }$ increases monotonically as
 $l_x$ increases from zero, whereas for a given
 $l_{\theta }>1$,
 $\max {\lambda }$ first remains constant and only starts to increase until
 $l_x$ is increased above a threshold, see figure 16(a). If only azimuthal slip is present, i.e.
 $l_x=0$,
 $\max {\lambda }$ first remains constant and only starts to increase precisely at
 $l_{\theta }=1$, see figure 16(b). The data shown in the inset of figure 6(a) also support this conclusion, see that
 $\max {\lambda }$ for
 $l_{\theta }=0.005$, 0.05 and 0.5 are identical. It can also be inferred that, given a fixed
 $l_x>0$ and that
 $\lambda _2$ increases with
 $l_x$,
 $\max {\lambda }$ can only start to increase as
 $l_{\theta }$ increases at some
 $l_{\theta }>1$.
The dependence of  $\max {\lambda }$ on slip length for
 $Re=3000$ and
 $n=1$. (a) Both streamwise and azimuthal slip are present. The black line shows the dependence on
 $l_x$ given
 $l_{\theta } \leqslant 1$. Symbol lines show two cases for
 $l_{\theta } > 1$. (b) The dependence on
 $l_{\theta }$ in case of
 $l_x=0$.

In summary, the maximum eigenvalue of  $\alpha =0$ modes is an increasing function of
 $l_{\theta }$ or
 $l_x$ (may not be strictly increasing, depending on the slip length setting, as figure 16 shows) and is independent of the Reynolds number, which is obvious as
 $Re$ does not appear in (5.45) and (5.50). Nevertheless, the eigenvalues remain negative.
6. Non-modal stability
It has been known that in many shear flows (e.g. pipe, channel and plane-Couette flows), small disturbances can be transiently amplified due to the non-normality of the linearized equations, despite their asymptotic linear stability (Schmid & Henningson Reference Schmid and Henningson1994; Meseguer & Trefethen Reference Meseguer and Trefethen2003; Schmid Reference Schmid2007). This transient amplification is believed to play an important role in the subcritical transition in shear flows. Here, we also investigated the effects of the anisotropic slip on the non-modal stability of the flow. The same method for calculating the transient growth described by Schmid & Henningson (Reference Schmid and Henningson1994) is adopted. The transient growth at time  $t$ for a mode
 $(\alpha , n)$ is defined as
 \begin{equation} G(t;\alpha,n)=\max_{{E(0)\neq 0}}\frac{E(t)}{E(0)}, \end{equation}
where  $E(t)=\int _V\boldsymbol {u}(t)^2\,\textrm {d}V$ is the kinetic energy of the perturbation
 $\boldsymbol {u}$ integrated in the whole flow domain at time
 $t$. For linearly stable flow,
 $G$ will reach the maximum,
 $G_{max}$, at a certain time and monotonically decay at larger times. For linearly unstable flow,
 $G$ can be either non-monotonic or monotonic at early stages, depending on the competition between the modal and non-modal growth, and will be dominated by the exponential growth of the most unstable disturbance at large times.
Figure 17 shows  $G_{max}$ at
 $Re=3000$ in the
 $l_x$–
 $\alpha$ plane (
 $l_x=0$) for
 $n=1$ and
 $n=2$ (low azimuthal wavenumbers are generally most amplified by non-normality). From the contour lines we can see that streamwise slip reduces
 $G_{max}$ and the decrease is monotonic as
 $l_x$ increases. Intuitively, streamwise slip reduces the background shear such that the lift-up mechanism (Brandt Reference Brandt2014) is subdued. Therefore, the transient growth should be reduced as our results show. The most amplified mode is still the
 $(\alpha ,n)=(0,1)$ mode (streamwise rolls) as in the no-slip case (Schmid & Henningson Reference Schmid and Henningson1994; Meseguer & Trefethen Reference Meseguer and Trefethen2003).
The maximum transient growth,  $G_{max}$, at
 $Re=3000$ plotted in the
 $l_x$–
 $\alpha$ plane for
 $n=1$ (a) and
 $n=2$ (b). Azimuthal slip length
 $l_{\theta }$=0. The contour level step is 80 in both panels.

Figure 18 shows  $G_{max}$ for the azimuthal slip case at
 $Re=3000$ in the
 $l_{\theta }$–
 $\alpha$ plane. Azimuthal wavenumbers
 $n=1$ and
 $n=2$ are considered. From the orientation of the contour lines we can see that azimuthal slip increases
 $G_{max}$. Presumably, azimuthal slip can enhance streamwise vortices because it reduces wall friction and allows finite azimuthal velocity at the wall, and therefore, the lift-up mechanism can be enhanced exhibiting increased transient growth as our results show. For
 $n=1$, in the
 $l_{\theta }$ range investigated, the most amplified mode is still the
 $(\alpha ,n)=(0,1)$ mode as in the no-slip case. However, for
 $n=2$, as
 $l_{\theta }$ increases, the most amplified mode is no longer the streamwise independent one but one with a small finite streamwise wavenumber (long wavelength), see figure 18(b). For example, the most amplified mode is approximately
 $\alpha =0.05$ for
 $l_{\theta }$ above approximately 0.1. Similar behaviour has also been reported for channel flow (Chai & Song Reference Chai and Song2019). The two bold lines in the figure enclose the linearly unstable regions in which
 $G_{max}$ is theoretically infinite, therefore, the linearly unstable region is left blank. Unlike the streamwise slip case where the slip length significantly reduces the transient growth throughout the
 $\alpha$ and
 $l_x$ ranges investigated (see figure 17), azimuthal slip only significantly affects the transient growth for small
 $\alpha$ and nearly does not affect that of larger
 $\alpha$, see the nearly horizontal contour lines for relatively large
 $\alpha$. In addition, even for small
 $\alpha$,
 $G_{max}$ quickly saturates as
 $l_{\theta }$ increases. To sum up, azimuthal slip only affects the transient growth of the modes with small streamwise wavenumbers and the effect saturates as the slip length increases.
The maximum transient growth,  $G_{max}$, at
 $Re=3000$ plotted in the
 $l_{\theta }$–
 $\alpha$ plane for
 $n=1$ (a) and
 $n=2$ (b). Streamwise slip length
 $l_x$=0. The bold lines enclose the linearly unstable regions.

Figure 19 shows the time instant when  $G_{max}$ is reached,
 $t_{max}$, for the cases shown in figures 17 and 18. In the streamwise slip case (figure 19a,b), for both
 $n=1$ and 2, the slip increases
 $t_{max}$ and the effect is more significant for larger
 $\alpha$. In the azimuthal slip case (figure 19c,d), for small
 $\alpha$ (
 $\lesssim 0.2$),
 $t_{max}$ is also slightly increased by the slip, whereas for larger
 $\alpha$,
 $t_{max}$ is slightly decreased by the slip, in contrast to the streamwise slip case. Overall, for the modes with small
 $\alpha$, i.e. most amplified modes due to non-normality, both streamwise and azimuthal slip only mildly increase
 $t_{max}$.
The time instant when  $G_{max}$ is reached,
 $t_{max}$, in the
 $l_x$–
 $\alpha$ plane for
 $n=1$ (a) and
 $n=2$ (b) and in the
 $l_{\theta }$–
 $\alpha$ plane for
 $n=1$ (c) and
 $n=2$ (d).

In the no-slip case, the global  $G_{max}$ (maximized over
 $\alpha$ and
 $n$) is known to scale as
 $Re^2$ when
 $Re$ is large (Meseguer & Trefethen Reference Meseguer and Trefethen2003). In the presence of streamwise and azimuthal slip, the scaling is also investigated and shown in figure 20. In the streamwise slip case (figure 20a), the lines for
 $l_x=0.005$, 0.05 and 0.5 appear to be parallel to the no-slip case with a downward vertical shift, suggesting a
 $Re^2$-scaling for any streamwise slip length. Similarly, for azimuthal slip, the scaling also seems to be
 $Re^2$. For this case, we only investigated
 $l_{\theta }=0.005$ and 0.02 in the linearly stable regime because larger
 $l_{\theta }$ will cause linear instability.
The scaling of global  $G_{max}$ with
 $Re$. (a) Streamwise slip
 $l_x=0.005$, 0.05 and 0.5. (b) Azimuthal slip
 $l_{\theta }=0.005$ and 0.02. In both panels, the bold black line shows the scaling for the no-slip case. The inset in (b) is a close-up around
 $Re=3000$.

7. Conclusions and discussions
It has been well established that the classic pipe flow is (asymptotically) linearly stable. In this paper, we studied the effect of velocity slip on the linear stability of pipe flow. Our results show that the leading eigenvalue increases with streamwise slip length  $l_x$ but remains negative, i.e. streamwise slip renders the flow less stable but does not cause linear instability, similar to the effect of isotropic slip length on the flow (Průša Reference Průša2009). Interestingly, our results suggest that the leading eigenvalue is independent of
 $Re$, or equivalently, the slowest decay rate of disturbances scales as
 $Re^{-1}$ (note that time is scaled by
 $Re^{-1}$ in our formulation). It should be pointed out that this scaling holds at sufficiently high Reynolds numbers (
 $\gtrsim 10^4$). For relatively low Reynolds numbers (100 and 1000 in our study), there is a very slight deviation from the scaling for
 $l_x\lesssim 0.1$ and the deviation is substantial at larger
 $l_x$. The
 $Re^{-1}$-scaling of the decay rate is the same as what was observed for the mode
 $(\alpha ,n)=(0,1)$ of the classic pipe flow by Meseguer & Trefethen (Reference Meseguer and Trefethen2003). In addition, our results show that the streamwise wavenumber at which the eigenvalue maximizes is not
 $\alpha =0$ but also scales as
 $Re^{-1}$. However, if
 $l_x$ is very large (
 $\gtrsim 1.0$, and note that in applications the slip length is generally much smaller), the eigenvalue maximizes at
 $\alpha =0$ at relatively low Reynolds numbers (100 and 1000 in our study) and this scaling also only holds at high Reynolds numbers (
 $\gtrsim 10^4$).
This destabilizing effect appears to be opposite to the stabilizing effect of streamwise slip reported for channel flow (the stabilizing effect is mainly observed for 2-D perturbations) (Lauga & Cossu Reference Lauga and Cossu2005; Min & Kim Reference Min and Kim2005; Chai & Song Reference Chai and Song2019). Here, we only provide a possible explanation for the least stable/most unstable perturbation (referred to as the leading perturbation for simplicity) of the two flows. We speculate that the different flow structures of the leading perturbations of the two flows are responsible. For pipe flow, we proved that the  $u_r$ component of the leading perturbation for
 $\alpha =0$ modes vanishes. The globally leading perturbation has very small
 $\alpha$ (
 ${\sim }{1}/{Re}$), which indicates that
 $u_r$ should be nearly vanishing. Therefore, the production rate of kinetic energy
 \begin{equation} -\int_Vu_ru_x\frac{\text{d}U_x}{\text{d}r}\,\textrm{d}V \end{equation}
should be also very small and the decay rate of disturbances should be dominated by the dissipation rate. Intuitively, velocity slip reduces the dissipation rate due to the reduced wall friction, therefore, the decay rate of the least stable perturbation decreases, i.e. the flow appears to be destabilized. In contrast, for channel flow, the leading perturbations are 2-D Tollmien–Schlichting waves for small slip length, which have a substantial wall-normal velocity component (comparable to the streamwise component). Therefore, the kinetic energy production is significant and even dominant in the variation of the kinetic energy. Streamwise slip reduces the base shear ( ${\text {d}U_x}/{\text {d}r}$) and therefore subdues the production. If the reduction in the production rate outweighs the decrease in the energy dissipation rate due to the reduced wall friction, the flow will be stabilized. This is probably why the stabilizing effect of the streamwise slip on channel flow was observed.
On the contrary, azimuthal slip, given sufficiently large slip length, causes linear instability, similar to the findings of Chai & Song (Reference Chai and Song2019) for channel flow. Our results show that azimuthal slip destabilizes helical waves with wavelengths considerably larger than the pipe diameter, whereas it does not affect the stability of waves with much shorter wavelengths and in the long wavelength limit, i.e.  $\alpha \to 0$. The critical Reynolds number decreases sharply as
 $l_{\theta }$ increases and gradually levels off at around a few hundred as
 $l_{\theta }\gtrsim 0.3$ and at approximately 260 as
 $l_{\theta }\to \infty$. A similar destabilizing effect was reported for channel flow (Chai & Song Reference Chai and Song2019). Azimuthal slip serves as an example for a perturbation to the linear operator associated with the linearized Navier–Stokes equations with the no-slip boundary condition that destabilizes the originally stable system.
Regarding the stability of the classic pipe flow to streamwise independent perturbations, using an energy analysis, Joseph & Hung (Reference Joseph and Hung1971) concluded the absolute and global stability of the flow, i.e. the flow is asymptotically (as  $t\to \infty$) stable to such perturbations with arbitrary amplitude. Here, for the linear case and from a mathematical point of view, we rigorously proved that the eigenvalues of streamwise independent modes (
 $\alpha =0$) are real and negative, for arbitrary slip length and arbitrary Reynolds number. In addition, the eigenvalue of the
 $\alpha =0$ modes is proved to be strictly independent of Reynolds number in our formulation, in agreement with the numerical calculation by Meseguer & Trefethen (Reference Meseguer and Trefethen2003). We derived analytical solutions to the eigenvalue and eigenvector for
 $\alpha =0$ modes and verified our theory by numerical calculations. We also proved that, the eigenvalues of
 $\alpha =0$ modes consist of two groups: one group is associated with disturbances with
 $\varPhi \equiv 0$, i.e.
 $u_r\equiv 0$, and the other is associated with disturbances with
 $\varPhi \not \equiv 0$, i.e.
 $u_r\not \equiv 0$ (see figures 13 and 15). The two groups distribute alternately. For the streamwise slip case, the latter group remains constant while the former group changes with
 $l_x$. It is the other way round for the azimuthal slip case. Interestingly, for the streamwise slip case, the leading eigenvalue belongs to the
 $\varPhi \equiv 0$ group and does not switch group as
 $l_x$ changes, whereas for the azimuthal slip case, it switches from the
 $\varPhi \equiv 0$ group to the
 $\varPhi \not \equiv 0$ group as
 $l_{\theta }$ crosses 1.0 from below (see figure 15). When both
 $l_x$ and
 $l_{\theta }$ are non-zero,
 $l_x$ dominates the leading eigenvalue if
 $l_{\theta }<1$. If
 $l_{\theta }>1$, the leading eigenvalue first remains constant and can only start to increase at a threshold as
 $l_x$ increases (see figure 16). Such analytical solutions might inspire asymptotic analysis in the limit of small streamwise wavenumber.
Non-modal analysis shows that streamwise slip greatly reduces the transient growth, whereas azimuthal slip significantly increases the transient growth for disturbances with very small streamwise wavenumbers but nearly does not affect that for disturbances with larger streamwise wavenumbers, aside from the linear instability caused by the slip. Both streamwise slip and azimuthal slip give the  $Re^2$-scaling of the maximum transient growth, the same as in the no-slip case (Schmid & Henningson Reference Schmid and Henningson1994; Meseguer & Trefethen Reference Meseguer and Trefethen2003). Similar effects were observed for channel flow (Chai & Song Reference Chai and Song2019).
Linear instability caused by anisotropic slip at low Reynolds numbers is of interest for small flow systems, such as microfluidics, in which the Reynolds number is usually low but the non-dimensional slip length can be significantly large using advanced surface texturing techniques. The instability can be exploited to enhance mixing or heat transfer in applications involving small flow systems. Larger non-modal growth caused by azimuthal slip can potentially cause earlier subcritical transition to turbulence. In addition, introducing modal instability into originally subcritical flows may also help to better understand the transition mechanism in such flows.
Acknowledgements
The authors acknowledge financial support from the National Natural Science Foundation of China under grant number 91852105 and 91752113 and from Tianjin University under grant number 2018XRX-0027. The comments from the reviewers are also highly appreciated.
Declaration of interests
The authors report no conflict of interest.
Appendix A. Numerics
First, we briefly explain the implementation of the boundary condition (2.12) and (2.13) in the eigenvalue problem for the linear system (2.2).
The eigenvalue equation reads
 \begin{equation} -L^{-1}M{\boldsymbol{q}}=\lambda {\boldsymbol{q}}, \end{equation}
where  $q$ is the unknown vector composed of
 $\hat {\varPhi }$ and
 $\hat {\varOmega }$, see (2.5). Boundary conditions (2.12) and (2.13) couple
 $\hat {\varPhi }$ and
 $\hat {\varOmega }$, unlike in the no-slip case. In our Fourier-spectral-Chebyshev-collocation discretization,
 $\boldsymbol {q}$ is a
 $2N\times 1$ vector and the operator
 $-L^{-1}M$ is discretized as a
 $2N\times 2N$ matrix, where
 $N$ is the number of collocation grid point on the radius. Adopting the Chebyshev differentiation matrix of Trefethen (Reference Trefethen2000) which is of spectral accuracy, the matrix is dense and the radial differentiation of
 $\boldsymbol {q}$ at a single grid point is calculated using the value of
 $\boldsymbol {q}$ at all collocation points on the radius. Given that
 $\hat {\varPhi }$ is known at
 $r=1$, i.e.
 $\hat {\varPhi }=0$ at
 $r=1$, the size of the system can be reduced by one. The boundary conditions (2.12) and (2.13) give two linear algebraic equations about
 $\hat {\varPhi }$ and
 $\hat {\varOmega }$ at the collocation points, from which we can further eliminate two unknowns. By doing so, the system size is reduced by three, i.e. to
 $(2N-3)\times (2N-3)$, from which the eigenvalue problem can be solved with the boundary conditions being taken accounted for.
Second, we show the convergence test of our numerical calculation. We consider the case of  $Re=3000$,
 $\alpha =0.5$ and
 $n=1$, as presented in figures 1(b) and 6(b). We change the number of Chebyshev points and check the convergence of the mean mode, wall mode and centre mode separately. Tables 1–3 show the resolutions and the eigenvalue of an arbitrarily selected mean mode and the rightmost eigenvalues corresponding to the wall mode and centre mode. It can be seen that grid numbers
 $N=32$, 64 and 128 give very close values of the eigenvalues, which differ only after approximately seven digits after the decimal point (the relative difference is
 $O(10^{-11})$), for all the slip length of 0.005, 0.05, 0.5 and the case of
 $l_{\theta }=\infty$. The convergence test shows that, for the calculation of the rightmost eigenvalues and for calculating the mean mode at
 $Re=3000$, 32 points are sufficient. Solely for calculating the rightmost eigenvalue, we used 32 points for
 $Re=100$, 1000 and 10 000, and 64 points for
 $Re=10^5$ and
 $Re=10^6$. We checked the convergence by doubling the number of grid points and found these numbers sufficient. It should be noted that, although 32 points are sufficient for calculating both of the rightmost eigenvalue and the spectrum at
 $Re=3000$, more grid points may be needed for accurately calculating the spectrum than for calculating the rightmost eigenvalue at higher Reynolds numbers (Trefethen Reference Trefethen2000; Meseguer & Trefethen Reference Meseguer and Trefethen2003).
The convergence of the eigenvalue corresponding to the mean mode (arbitrarily selected) and the rightmost wall mode and centre mode as the radial grid number  $N$. The azimuthal slip cases of
 $l_{\theta }=0.005$, 0.05 and 0.5 for
 $Re=3000$,
 $\alpha =0.5$,
 $n=1$ and
 $l_x=0$ are listed.

The convergence of the eigenvalue corresponding to the mean mode (arbitrarily selected) and the rightmost wall mode and centre mode as the radial grid number  $N$. The azimuthal slip case of
 $l_{\theta }=\infty$ for
 $Re=3000$,
 $\alpha =0.5$,
 $n=1$ and
 $l_x=0$ is listed.

Appendix B. The dependence of the leading eigenvalue on the azimuthal wavenumber $n$ for $\alpha =0$


Our numerical calculations in §§ 3 and 4 showed that  $n=1$ modes are the least stable/most unstable modes. Here we show the dependence of
 $\max {\lambda }$ of
 $\alpha =0$ modes on the azimuthal wavenumber
 $n$ and prove that
 $n=1$ is indeed the least stable azimuthal mode. For this purpose, we only need to prove that the minimum non-zero roots of (5.45) and (5.50) all increase with
 $n$.
Note that the root of (5.45) is independent of  $l_x$. Because the zeros of
 $J_n(z)$ and
 $J_{n+1}(z)$ distribute alternately, it can be easily seen that, if
 $l_{\theta }\leqslant 1$, the minimum positive root of (5.45) is located between the minimum positive zeros of
 $J_n(z)$ and
 $J_{n+1}(z)$. Therefore, the minimum positive root of (5.45) increases with
 $n$ because the positive zeros of
 $J_n(z)$ and
 $J_{n+1}(z)$ all increase with
 $n$, i.e.
 $\lambda _1$ decreases as
 $n$ increases if
 $l_{\theta }\leqslant 1$.
If  $l_{\theta }>1$, we need to prove that the minimum positive root of
 \begin{equation} g_n(z)=(1-l_{\theta})J_n(z)+l_{\theta} zJ_{n-1}(z)=0, \quad n\geqslant 2 \end{equation}
is smaller than that of  $g_{n+1}(z)=0$, i.e. (5.45). We already showed in (5.54a,b) that
 $F(z, l_{\theta })>0$ at sufficiently small
 $z$, i.e.
 $g_n(z)>0$ for sufficiently small
 $z$. Denoting the minimum positive root of (5.45) as
 $z_0$, we only need to show that
 $g_n(z_0)<0$. Using the property of Bessel functions, namely
 \begin{equation} J_{n+1}(z)+J_{n-1}(z)=\frac{2n}{z}J_n(z) \end{equation}
and (5.45),  $g_n(z)$ can be rewritten as
 \begin{equation} g_n(z_0)=(1-l_{\theta})J_n(z_0)+l_{\theta} z_0\left(\frac{2n}{z_0}-\frac{l_{\theta}}{l_{\theta}-1}z_0\right)J_n(z_0). \end{equation}
It is easily seen that  $J_n(z_0)>0$, therefore, we need to show that
 \begin{equation} (1-l_{\theta})+l_{\theta} z_0\left(\frac{2n}{z_0}-\frac{l_{\theta}}{l_{\theta}-1}z_0\right)<0 \end{equation}
or, equivalently,
 \begin{equation} z_0^2>(1-l_{\theta}^{-1})\left(2n-1+l_{\theta}^{-1}\right), \end{equation}
in order to prove that  $g_n(z_0)<0$, given
 $l_{\theta }>1$. Noticing that
 $(1-l_{\theta }^{-1})(2n-1+l_{\theta }^{-1})<2n-1$ if
 $l_{\theta }>1$, we can prove
 $g_n(z_0)<0$ if we can show that
 $z_0^2>2n-1$.
In § 5.3 we proved that the minimum positive root of (5.45) decreases as  $l_{\theta }$ increases, therefore,
 $z_0$ is minimized at
 $l_{\theta }=+\infty$. To prove that
 $z_0^2>2n-1$ for any
 $l_{\theta }>1$, we only need to show that
 $z_0^2>2n-1$ holds for
 $l_{\theta }=+\infty$, with which (5.45) reduces to
 $J_{n+1}(z)-zl_{\theta } J_n(z)=0$. That
 $F(z,l_{\theta })>0$ at sufficiently small
 $z$ indicates that
 $J_{n+1}(z)-zJ_n(z)<0$ at sufficiently small
 $z$ given
 $l_{\theta }=+\infty$. Therefore,
 $J_{n+1}(z_0)-z_0 J_n(z_0)=0$ requires that
 $J_{n+1}(z)-zJ_n(z)<0$, i.e.
 $J_{n+1}(z)<zJ_n(z)$ for any
 $z<z_0$. In fact, we can show that
 $J_{n+1}(z)<zJ_n(z)$ if
 $0<z^2<2n-1$ such that
 $z_0$ has to satisfy
 $z_0^2>2n-1$. Using the series form of Bessel function,
 $J_{n+1}(z)<zJ_n(z)$ means
 \begin{equation} \sum_{k=0}^{+\infty}\frac{(-1)^2}{k!}\frac{1}{(n+k+1)!}\left(\frac{z}{2}\right)^{2k+n+1}<z\sum_{k=0}^{+\infty}\frac{(-1)^2}{k!}\frac{1}{(n+k)!}\left(\frac{z}{2}\right)^{2k+n}. \end{equation}
Because of the absolute convergence of the two infinite series in (B6), we only need to show that for any positive even number  $k$,
 \begin{align} &\frac{1}{k!}\frac{1}{(n+k+1)!}\left(\frac{z}{2}\right)^{2k+n+1} -\frac{1}{(k+1)!}\frac{1}{(n+k+2)!}\left(\frac{z}{2}\right)^{2k+2+n+1} \nonumber\\ &\quad < \frac{z}{k!}\frac{1}{(n+k)!}\left(\frac{z}{2}\right)^{2k+n}-\frac{z}{(k+1)!}\frac{1}{(n+k+1)!}\left(\frac{z}{2}\right)^{2k+2+n}, \end{align}
if  $0<z^2<2n-1$. Rearranging (B7), we have
 \begin{equation} z^2<4(k+1)(n+k+2), \end{equation}
which obviously holds because  $z^2<2n-1<4n+4k+8\leq 4(k+1)(n+k+2)$. To sum up, we have proved that
 $J_{n+1}(z)<zJ_n(z)$ if
 $z^2<2n-1$, therefore,
 $z_0$, which satisfies
 $J_{n+1}(z_0)-z_0 J_n(z_0)=0$, must satisfy
 $z_0^2>2n-1$. Consequently, (B5) and
 $g_n(z_0)<0$ hold, and thus the minimum positive root of (B1) is smaller than
 $z_0$, which indicates that the minimum positive root of (5.45) increases with
 $n$, i.e.
 $\lambda _1$ decreases with
 $n$.
Next, we prove that the minimum positive root of (5.50) also increases with  $n$. The equation
 \begin{equation} h_n(z)=(1+nl_x)z^nJ_n(z)-l_xz^{n+1}J_{n+1}(z)=0 \end{equation}
shares the non-zero roots with (5.50), therefore, we only need to prove the same statement for (B9). Denoting the minimum positive zero of  $h_{n-1}(z)$ as
 $z_0$, we next show that
 $h_{n}(z)$ monotonically increases in
 $[0, z_0]$ such that there is no positive root of (B9) in
 $[0, z_0]$, i.e. the minimum positive root of (B9) increases with
 $n$. Using the property of Bessel functions, namely
 $(z^{n+1}J_{n+1}(z))'=z^{n+1}J_n(z)$, where ‘
 $'$’ denotes the derivative with respect to
 $z$, we take the derivative of
 $h_n(z)$ with respect to
 $z$ and obtain
 \begin{equation} h_n'(z)=(1+nl_x)z^nJ_{n-1}(z)-l_xz^{n+1}J_{n}(z)=z\left(h_{n-1}(z)+l_xz^{n-1}J_{n-1}(z)\right). \end{equation}
It is easy to see that  $h_{n-1}(z)$ is positive at sufficiently small
 $z$ (the derivation is similar to that of
 $F(z, l_{\theta })$ being positive at sufficiently small
 $z$, see (5.54a,b)), consequently,
 $h_{n-1}(z)> 0$ in
 $(0, z_0)$. As
 $z_0$ is smaller than the minimum positive zero of
 $J_{n-1}(z)$, we have
 $J_{n-1}(z)> 0$ in
 $(0, z_0)$. Therefore,
 $h_n'(z)> 0$ in
 $(0, z_0)$, i.e.
 $h_n(z)$ monotonically increases and there is no positive root of (B9) in
 $(0,z_0]$. In other words, the minimum positive root of
 $h_{n}(z)=0$ is always larger than that of
 $h_{n-1}(z)=0$, i.e. the minimum positive root of (5.50) increases with
 $n$, and therefore
 $\lambda _2$ decreases with
 $n$. Now, we reach the conclusion that
 $\max {\lambda }=\max \{\lambda _1,\lambda _2\}$ decreases with
 $n$ for
 $\alpha =0$ modes because
 $\lambda _1$ and
 $\lambda _2$ both decrease with
 $n$.



