


Introduction
Research into snowdrifting has been tied to the development of specific instruments. One of the principal aims of researchers is to determine the mass flux in order to quantify the process. During the last 30 years several gauges have been developed to study snowdrifting phenomena. The first generation, in the 1960s, were mechanical particle traps, improvements to which were made by Reference MellorMellor (1965) (self-directional gauge), Reference JairellJairell (1975) (self-acting weighing system) and Reference Bolognesi, Daultier, Naaim-Bouvet and OussetBolognesi and others (1995) (multidirectional gauge).
Through the 1980s the second generation of snowdrifting traps were developed, based on optical and image-processing principles. Initially elaborated as a research gauge by Reference SchmidtSchmidt (1977), the snow-particle counter (SPC) is today operational in the U.S.A. (interstate highway 80, Colorado; Reference Martinelli, Schmidt and TablerMartinelli and others, 1981), because it allows the operators to determine visibility conditions (tied to snowdrifting phenomena) in real time along the road. These safety devices are very complex and expensive. The SPC was improved in Japan (Reference Sato, Kimura, Ishimaru and MaruyamaSato and others, 1993).
The acoustic detector generation began in the 1990s with a prototype developed at CEMAGREF, Grenoble, France, with the Auteg Company and tested in the Spanish Pyrenees (Reference Font, Naaim-Bouvet and RousselFont and others, 1998a). Reference ChritinChritin (1998) developed the second generation of acoustic gauges, the Flowcapt. This gauge allows the measurement of wind speed and drifting snow through acoustic detectors.
These instruments measure a representative amount of the mass flux. Differences in their design and conception may lead to differences in collection efficiency In order to compare their efficiency we carried out several field experiments under strong-wind conditions with three mechanical gauges (Reference Font, Mases and VilaplanaFont and others, 1998b). In 1997, in the framework of a stay at the Shinjo Branch of Snow and Ice Studies using their new facility, we performed several experiments with the three mechanical gauges used in the field and a fourth trap designed byReference TakeuchiTakeuchi (1980), and also with an optical detector, the SPG-S7.
Aim of the Experiments
The aim of the laboratory tests was to evaluate the collection efficiency of the different gauges used in field measurements under various conditions. We simulated drifting-snow processes in a cold wind tunnel and measured mass flux with the gauges. Simultaneously we measured mass flux with an SPC sensor. The experiments took place in the large cold room where we used the snow produced artificially and we controlled the wind speed and the transport rate of drifting snow.
Description of the Gauges
The gauges tested were the ones used at the La Molina experimental site, northeast Spain (Reference Font, Mases and VilaplanaFont and others, 1998b):
Snow-collector column
This is a column of six collectors piled up, which allow us to obtain vertical mass-flux profiles. The snow is collected through a 1.54 cm2 frontal horizontal inlet tube, and the air escapes through a rear aperture of 12.5 cm2. Inside the collectors there are three baffles that reduce the speed of airflow and facilitate the deposition of the transported particles. The capacity of the collectors is 40 L (Fig. 1). For the laboratory experiments we constructed a scale model in wood, half the size of the real one, since the full-sized snow collector is too big to be used in the wind tunnel. The dimensions of the snow particles used are comparable to real ones, so the dimensions of the inlet and outlet apertures were made equal to the real ones.
Sketch of the snow collector. (a) Original size, and (b) scale model.

Type A snow trap
The type A snow trap is fixed between two aluminium poles each 2 m long. It has a solid aluminium rectangular part, which fits into the poles, with a nylon bag attached. The pores of the bag are 0.110 mm in diameter. The inlet area is 50 cm2, and the capacity of the bag is 2 L. The trap’s position varies from 0 to 2 m above the snow surface.
During snowdrifting, the snow traps are situated in an open area where transport is the main process. The flux, a mixture of air and snow grains, goes through the traps, and while the snow is collected in the bag, the air escapes through the pores. The other net-type collectors work in the same way (Fig. 2).
Sketch of the net-type traps: A trap, B trap andT trap.

Type B snow trap
Like the other traps, this gauge is also a metal structure with a nylon bag attached. The metal part has two cones and an elbow. The nylon bag is attached to one of the cones, while the other faces the wind. The inlet of the trap is 7 cm in diameter. The pores of the nylon bag are 0.110 mm in diameter. The minimum distance between a trap and the one above is 0.25 m, which limits the vertical mobility of the traps, so we can only use four traps per vertical mass-flux profile (Fig. 2).
Type T snow trap
This is also a net-type collector that has a solid part and a nylon bag attached to it. The solid part is a film case with a diameter of 3 cm, and the pores of the nylon bag have a diameter of 0.110 mm. We had the opportunity to compare this streamer-type trap to the other traps in the laboratory tests (Fig. 2). The snow collectors and the type A and B snow traps were the gauges that the first author used in the field in the Spanish Pyrenees to quantify mass flux.
SPC
The SPG observes the diameter and the number of blowing-snow particles by their shadows on photosensitive semiconductors (Reference SchmidtSchmidt, 1977; Reference Sato, Kimura, Ishimaru and MaruyamaSato and others, 1993). The processor of the model used, SPG-S7, classifies the particle diameter from 50 to 500 μm in 32 subclasses, and records the particle numbers every Is. From the mean diameter and the number of particles we can estimate the mass flux (gcm–2 s–1).
Methodology of the Experiments
The wind tunnel has a total length of 14 m, and at its leeward end we placed the gauges and the SPG side by side (Fig. 3). The limited width of the wind tunnel (1 m) is the main control in setting the traps for each experiment. The windward half of the floor of the wind tunnel (7 m) was covered with snow in order to reproduce real conditions.
An example of the trap’s setting in the wind tunnel (cross-section). Example of the A trap + T trap + SPC.

We suspected that there might be an anomalous contribution to the mass flux measured with the snow collector (box-type). To test for this, we performed some experiments by closing the inlet of the collector. We detected some snow particles invading the snow collector through the space between the cover and the body (Fig. 1). The invasion rate was a function of SPG mass flux, and its contribution to the snow-collector mass flux is given by:

where F is the contribution to the snow-collector mass flux (g cm–2 s-1) and f SPC is the mass flux measured with the SPC (g cm–s–1) and the error of the estimate is within ±10% except for low-transport conditions. The measured snow-collector mass flux was corrected according to Equation (1).
The SPG was fixed to the traverse system which was constantly moving from the lowest height of the gauge’s inlet to the highest and so on. Although the gauges were set in the suspension layer of blowing snow in the field, they were set closer to the snow surface in the wind tunnel. In order to obtain the averaged mass-flux value to compare with the gauge, the mass-flux values with the SPG in this height range were integrated over the cross-sectional area of the inlet of the gauge. The observed particle diameters were mainly concentrated in the range 100–250μm.
Mass flux in the wind tunnel was controlled by changing both the wind speed and the amount of seeded snow. Situated at the windward end of the wind tunnel, the snow seeder inputs snow particles into the airflow. The snow seeder consists of a cube of 0.7 × 0.3 × 1 m3 which is filled with disintegrated snow. Under the metal cube there is a hydraulic system that lifts it. Above the snow cube a movable stick cuts the snow surface. The velocities of the lifting and the moving of the stick are changeable and controlled by computer.
All tests were divided into runs, each characterized by a different wind speed. In every test we did four runs at wind speeds of U = 6,10,14 and 18 ms–1. The duration of each run was 2–4 min, in function of the transport intensity. Measurements were performed at –14°C in order to avoid the effect of sublimation, which increases as temperature rises (Reference SatoSato, 1991).
After each run, before changing the wind speed we emptied the traps and calculated the amount of collected snow and thus the mass flux (g cm–2 s–1). At each run we could test two gauges plus the SPG. Normally we tested together the A trap + T trap, B trap + T trap or snow collector (box) + T trap, and in all cases the SPG.
Results
Comparison of the four mechanical traps
Comparison of the four traps tested showed that the box type (snow collector) is generally more efficient than the net-type collectors, as shown in Figure 4. Note that the box-type values are obtained with Equation (1) assuming that fSPC is equal to the corrected mass flux.
Results of the mass-flux measurements obtained in the cold wind tunnel with the three net-type traps plus the snow collector at three different wind speeds (U =10,14 and 18 ms–1).

Some factors are proposed for the net-type traps, i.e. the ratio of the mass fluxes measured with the snow collector to those measured with net-type traps. These values in Table 1 show a similar tendency to, but are smaller than, those in the field (Reference Font, Mases and VilaplanaFont and others, 1998b). This means that the collection efficiencies of the net-type traps are larger in the wind tunnel than in the field. The estimate error of these measurements is within ±15% except in low-transport conditions.
Factors obtained from the comparison of the net-type values with the snow collector’s
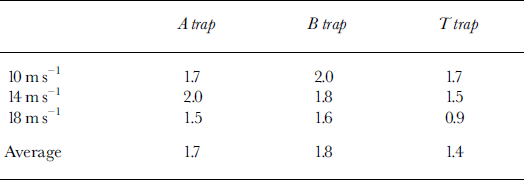
The average values in Table 1 show that theT trap is the most efficient of the net trap gauges, followed by the A trap and the B trap. However, the mass-flux values for theT trap should be corrected by a factor of 1.4 according to the snow-collector mass-flux values. The accuracy of these ratios is within 75–80%.
Because of its aerodynamic design, the snow collector disturbs the flow less than the net-type traps, making it more efficient. Comparing the net-type traps, the bigger the trap (B > A > T) the more the flow is disturbed, which decreases the trapping efficiency.
Comparison of the Mechanical Traps with the SPC
In order to compare the SPC with the mechanical traps, we plotted the ratio (SPC mass flux/gauge mass flux) vs gauge mass flux for all the mechanical traps (Fig. 5). We observe that when transport is low (< 2.5 E−02 g cm−2 s−1) the ratios show scattering, and the collectors underestimate the average mass flux, and as transport increases, the ratio tends to unity. In high-transport conditions the ratio falls slightly below 1, which means that the SPC values are somewhat less than the gauge values.
Comparison of the ratio (SPC mass-flux values/net traps mass flux values) vs net traps mass flux.

Detailed behaviour of the ratio is shown below:
low-transport conditions (< 1.0 E−02 g cm−2 s−1): there are several measurements with the B trap which almost agree with the SPC, and one measurement where the transport measured by the T trap is double that measured by the SPC, while in the other cases the mass flux is underestimated by 40% using the net traps and by 50% or more using the A trap. This scattering may be attributed in part to the error in weighing the small amount of collected snow;
moderate-transport conditions (< 1.0 E−02 g cm−2 s−1) mass flux > 4.0 E−02 g cm−2 s−1 the A and T net traps underestimate the mass flux by around 30%, and the B trap agrees with the SPC;
high-transport conditions > 4.0 E−02 g cm−2 s−1 B and T traps almost agree with the SPC.
In the snow-collector (box-type) experiments, the mass flux corrected by Equation (1) almost agrees with that measured by the SPC, as shown by the square in Figure 6.
Snow-collector mass flux vs SPC mass flux.

The additional experiment was performed by covering the upper half of the box with a plastic sheet to prevent the invasion of snow particles through the space between cover and body. Since there was no invasion of snow particles, the measured mass flux is considered to be accurate. Results of the second additional experiment are plotted as diamonds in Figure 6.
We believe that with the real snow collector (Reference Font, Mases and VilaplanaFont and others, 1998b) there is no possibility of snow particles invading the space between the cover and the body of the collector, because they are piled up into a column of six unities and tied down with cables in order to prevent their movement by wind effects.
The two experiments shown in Figure 6 reveal somewhat different tendencies. This may may be due to the difference in experimental conditions such as the size distribution of supplied snow particles.
Conclusions
We tested the collection efficiency of each of the four drifting-snow measuring gauges-three net types and a box-type collector-in the laboratory under various transport-rate conditions. The box-type collector was found to be more efficient than the A and B traps, confirming the findings of the field measurements (Reference Font, Mases and VilaplanaFont and others, 1998b). The collection-efficiency ratios for the A and B traps compared to the box-type collector were larger in the laboratory than in the field.
From the use of the SPC to calibrate the net-type traps we observed that these traps underestimate transport in low-transport conditions, but as transport increases, the underestimation decreases. Comparing the SPC with the B andT traps in high-transport conditions (>4.0E–02 g cm–2 s–1), we observe that they almost agree with each other. Comparison of the snow collector with the SPC showed good agreement between the two gauges.
Acknowledgements
This work was funded by a Research and Development Project (AMB93–0837 and AMB97–0374 CICYT) and the Projects of the “Comissionat per Universitats i Recerca” 1995SGR-00198 and 1997SGR-00225 in the study and analysis of Avalanches in the Catalan Pyrenees. Thanks are due to T. Takeda, from the Shinjo Branch of Snow and Ice Studies, for technical support and advice given during management of the laboratory experiments. The authors thank D. McClung and the anonymous reviewers for critically reviewing the manuscript. Their comments were insightful and informative.



