I. INTRODUCTION
The intermetallic phase NiAl has been considered as a promising candidate for the next generation of high temperature structural materials owing to a number of attractive properties, such as high melting temperature (1638 °C), low density (5.95 g/cm3), good oxidation and corrosion resistance, and high thermal conductivity. Reference Darolia1,Reference Miracle2 However, low ductility (<2%), poor fracture toughness at room temperature (between 2 and 4 MPa m1/2), and poor creep behavior Reference Darolia1,Reference Miracle2 limit the use of NiAl in real world applications. To overcome these issues, several studies have focused on improving the properties of NiAl by alloying NiAl with refractory metals, such as Cr, Va, Mo, or Hf. Reference Liu and Horton3–Reference Yang5 Directional solidification of eutectics of NiAl alloyed with refractory metals results in a highly aligned microstructure, which has been shown to improve the ductility and fracture toughness of the alloy. Reference Bei and George6–Reference Qi, Ma and Guo8 However, alloying additions and processing conditions have significant effects on the final microstructure of the alloy which then determines the properties of the material. Reference Cline and Walter9–Reference Hu, Hu, Gottstein, Bogner, Hollad and Bührig-Polaczek11 With suitable composition and processing conditions, in situ composites, where NiAl forms the matrix and the refractory metal will form either lamellae or fibers, are obtained with characteristic length scales of fiber or lamellae in the sub-micrometer regime. These small dimensions and the fact that the refractory metal fibers are almost free of dislocations after processing may lead to very high strength of the fibers as was shown by microcompression experiments Reference Bei, Shim, Pharr and George12 and tensile testing. Reference Phani, Johanns, Duscher, Gali, George and Pharr13,Reference Johanns, Sedlmayr, Sudharshan Phani, Mönig, Kraft, George and Pharr14 The role of the individual phases and interfaces as well as alloying additions and processing conditions on the deformation process and mechanical properties is not yet fully understood. Therefore, it is critical to characterize the material on these length scales to fully understand the role of the individual phases and the interface in the deformation of directionally solidified eutectics. In this work, directionally solidified NiAl–Cr eutectic alloys prepared at three different solidification speeds were studied. NiAl forms the matrix with continuous Cr fibers aligned in the growth direction. Due to the partitioning of Ni, Al, and Cr between the fiber and the matrix, the matrix and the fibers are actually alloyed, as has been shown previously for NiAl alloyed with refractory metals. Reference Liu and Horton3
We conducted a set of different experiments to address this issue: (i) nanoindentation, to investigate the effect of processing conditions on the overall mechanical properties of the alloys, (ii) in situ tensile tests on individual Cr fibers, to evaluate the strength for different diameters, and (iii) microcompression tests to investigate the behavior of the matrix and the composite containing one as well as multiple fibers.
II. EXPERIMENTAL DETAILS
A. Materials
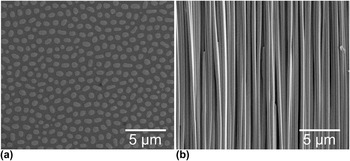
In this study, the role of Cr as alloying addition to NiAl was investigated. Cr was chosen owing to its good oxidation properties and low density. Three materials of the same composition Ni–33Al–34Cr (written as at.%) but prepared at three different solidification speeds, i.e., 20, 50, and 80 mm/h, were produced by directional solidification in a zone melting device. Reference Bei and George6 The as-received directionally solidified samples were cold mounted, ground with SiC paper, and polished with diamond paste down to 0.25 µm grain size. A representative microstructure of the 20 mm/h sample in the transversal and longitudinal planes is shown in Figs. 1(a) and 1(b), respectively. As expected, NiAl forms the matrix and Cr solidifies in the form of continuous fibers. The diameter of the Cr fibers varies inversely with the solidification speed and ranges from 700 to 300 nm for 20 and 80 mm/h, respectively. The spacing between the fibers decreases from ∼1.1 μm for the 20 mm/h samples to ∼0.4 μm for the 80 mm/h samples.
Scanning electron micrographs of the microstructure of a NiAl–Cr directionally solidified eutectic alloy (a) in transversal and (b) in longitudinal planes. NiAl forms the matrix and Cr solidifies in the form of continuous fibers. The sample shown was solidified at 20 mm/h.

B. Nanoindentation and microcompression testing
The nanoindentation and microcompression experiments were carried out using a nanoindenter G200 XP (Keysight Technologies, Santa Rosa, California). The material was indented with a diamond Berkovich tip to a maximum indentation depth of 2000 nm, such that a large enough volume was probed for averaging over the matrix and many fibers. The continuous stiffness measurement option Reference Oliver and Pharr15,Reference Oliver and Pharr16 was used to determine the hardness and Young’s modulus. For the microcompression tests, a flat punch diamond tip of 10 µm diameter was used. For each test, the displacement rate was adjusted to achieve a strain rate corresponding to 1 × 10⁻³ s−1. A maximum indenter displacement of 500 nm was selected to ensure that all pillars were plastically deformed.
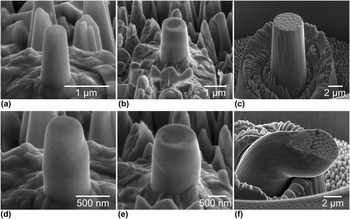
For the microcompression tests, three types of pillars were prepared. First, single-phase single-crystalline NiAl pillars were prepared in the region between the fibers termed as matrix-only (M.O.) pillars [Fig. 2(a)]. Second, pillars consisting of a single Cr fiber surrounded by the NiAl matrix, termed single-fiber (S.F.) composite pillars, were prepared such that the pillar diameter was about twice the fiber diameter [Fig. 2(b)]. This implies that the size of the pillars cannot be identical for all solidification speeds and had to be reduced for increasing speed and, thus, the corresponding smaller fiber diameters and spacing between the fibers. For example, M.O. pillars and S.F. pillars prepared from the 20 mm/h and the 80 mm/h samples, respectively, had comparable dimensions. Third, composite pillars containing several fibers, termed as multiple-fiber (M.F.) composite pillars, were prepared. The M.F. pillars [Fig. 2(c)] had a nominal diameter of 4 µm for all three materials.
SEM micrographs of different types of microcompression pillars prepared by FIB milling: (a) single-crystalline NiAl M.O. pillars, (b) NiAl–Cr S.F. composite pillars, and (c) NiAl–Cr M.F. composite pillars. After deformation, typical deformation characteristics were observed: (d) distinct slip steps on deformed M.O. pillars, (e) co-deformation of fiber and matrix in S.F. pillars, (f) buckling in M.F. pillars possibly due to misalignment.

All pillars were prepared by focused ion beam (FIB) milling (Dual Beam FIB/SEM Workstation, Nova NanoLab 200, FEI Company, Hillsboro, Oregon) following the procedures outlined in Reference Greer, Oliver and NixRef. 17. Briefly, the pillars were machined in a two-step process starting with a ring of 35 µm outer diameter and 5 µm or 10 µm inner diameter for M.O./S.F. and M.F. pillars, respectively, at a beam current of 5 nA. In the second step, the pillars were machined into the resulting island at a beam current of 100 pA to minimize Ga+-ion damage. The height-to-diameter ratio was kept between 2 and 3; the taper angles in all pillars were below 5°. All the pillars in one sample were prepared in one FIB session and were tested in one run to minimize the effect of possible variations in the tip-sample alignment. The actual dimensions of each pillar were measured in the scanning electron microscope (SEM) prior to testing. For this study, we tested more than 100 pillars (38 S.F. pillars, 39 M.O. pillars, and 26 M.F. pillars).
C. In situ tensile testing
The in situ tensile tests were conducted in an SEM (Nova NanoLab 200) using a custom-built setup, Reference Gianola, Sedlmayr, Mönig, Volkert, Major, Cyrankowski, Asif, Warren and Kraft18 which was used previously to investigate the mechanical properties of Si Reference Boles, Sedlmayr, Kraft and Mönig19 and Au Reference Ensslen, Brandl, Richter, Schwaiger and Kraft20 nanowires. The setup is equipped with X, Y, and Z nano-positioning stages (Attocube Systems AG, Munich, Germany), a 3-axis nanomanipulator (Kleindiek Nanotechnik GmbH, Reutlingen, Germany) to move, align, and manipulate the fibers, and a nanomechanical force sensor (FemtoTools AG, Buchs, Switzerland). SEM images were captured at regular intervals during the tensile tests and were used to determine the strain by digital image correlation (DIC) using the code developed by Eberl and coworkers. Reference Eberl, Gianola and Thompson21 The Cr fibers were extracted from the alloy by selective chemical etching of the matrix using a mixture of 100 mL H2O, 40 mL HCl, and 5 g CrO3 for 30 s. After the etching, the sample was examined in the SEM, a suitable fiber having the most uniform cross section selected, cut by the FIB, and transferred to the test setup. The fibers were attached to the grips by depositing Pt stripes using the gas injection system of the microscope in combination with the electron beam. All tensile tests were carried out at a nominal strain rate of 1 × 10⁻³ s−1.
D. Transmission electron microscopy
Transmission electron microscopy (TEM) examinations of both the undeformed and deformed NiAl–Cr samples were performed. The undeformed samples were prepared by standard TEM preparation methods, dimple grinding followed by ion polishing. The TEM lamellae of the deformed composite pillars were prepared by FIB milling (Nova NanoLab 200) following standard procedures. The lamellae were prepared from S.F. pillars to observe the dislocation structure resulting from the deformation process. The TEM examinations were carried out with a Tecnai F20 (FEI Company) operated at 200 kV acceleration voltage and a CM30 (Philips, Eindhoven, The Netherlands) operated at 300 kV. TEM micrographs were obtained for the samples oriented with the zone axis [001] except for Fig. 6(d), which was recorded close to the [001] zone axis with a
 $\overrightarrow {\bf{g}}$
of
 $[\overline 1 10]$
.
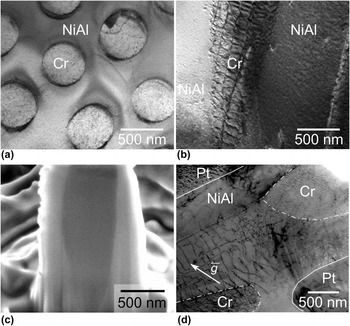
(a) TEM bright-field micrograph of the transversal section of an undeformed NiAl–Cr composite. (b) TEM micrograph of the longitudinal section of an undeformed specimen. (c) SEM micrograph of a FIB cross section through the center of a deformed S.F. pillar. (d) Cross-sectional TEM bright-field micrographs of a deformed S.F. composite pillar with the deformed Cr fiber. The solid lines indicate the boundaries of the pillar, which was sectioned at an angle revealing both the bulk of the fiber (inside dashed-dotted lines) and the interface dislocations.

III. RESULTS AND DISCUSSION
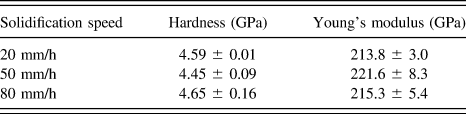
The hardness and Young’s modulus of the alloys were found to be independent of the solidification speed during the directional solidification. The results of the nanoindentation study are summarized in Table I. Assuming Poisson’s ratio of 0.33, Young’s modulus was determined to be around 215 GPa, which agrees well with values reported in the literature. Reference Frommeyer, Rablbauer and Schäfer22 The constant value of the modulus for different solidification speeds is expected since the volume fraction of the two phases, i.e., NiAl and Cr, is the same for all three materials. However, the hardness of around 4.5 GPa was also found to be independent of the solidification speed, which is surprising since it could be expected that with a decrease of the characteristic microstructural length scale the strength of the materials would increase.
Hardness and Young’s modulus of the three directionally solidified alloys produced at three different solidification speeds. The average of 10 indents per sample together with one standard deviation is shown.

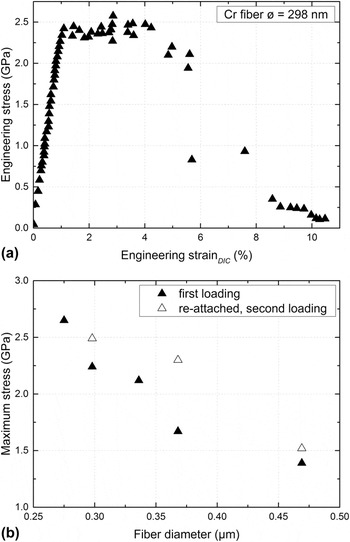
A typical stress–strain curve of a Cr fiber with a diameter of 298 nm tested in situ in tension is shown in Fig. 3(a). Several fibers having different diameters were tested. All fibers deformed plastically before fracture and reached high maximum strength values in the range of 1–3 GPa [Fig. 3(b)]. After fracture, if the length of one or both parts of the fiber was sufficiently long, the fractured specimen was re-attached and tested again. It was observed that during the in situ tensile test a layer of carbon had been deposited onto the Cr fibers preventing a detailed observation of the deformation process. Typically, this carbon layer cracked at a certain strain, and the fracture of the fiber was observed shortly after. It is conceivable that necking of the fiber leads to the fracture of the carbon layer. The carbon layer may cause an over-estimation of the fiber diameter measured by SEM. This implies that the determined stresses can be considered as lower bounds since the carbon layer does not carry much load.
(a) Typical stress–strain curves of a Cr fiber having a diameter of 298 nm. All fibers showed plastic deformation before fracture. (b) High maximum stresses in the range between 1 and 3 GPa were observed. Some fractured fibers were re-attached to the grips and tested second time (open symbols).

The measured strength of the tested fibers decreases with increasing diameter as shown in Fig. 3(b). Similar size effects on the strength have been previously reported for micropillars and fibers many times as reviewed in Ref. Reference Kraft, Gruber, Mönig and Weygand23 and were attributed to the truncation or the lack of dislocation sources with decreasing crystal size. Reference Kraft, Gruber, Mönig and Weygand23 Therefore, it is argued that the high strength of the individual fibers tested here relates to a very small number of initially present dislocations as suggested for Mo fibers Reference Senger, Weygand, Motz, Gumbsch and Kraft24 and indeed observed for Al fibers Reference Mompiou, Legros, Sedlmayr, Gianola, Caillard and Kraft25 and for Mo fibers. Reference Chisholm, Bei, Lowry, Oh, Syed Asif, Warren, Shan, George and Minor26 Accordingly, the plastic deformation of the fiber is initiated at the weakest site having the most favorable dislocation configuration. As a result, the strength would obey weakest-link statistics and may be described by a Weibull distribution, as also discussed in Ref. Reference Senger, Weygand, Motz, Gumbsch and Kraft24. This argument is supported by the observation that the strength of a fractured and re-attached fiber is higher than that of the pristine ones. In the pre-deformed fiber, the next weakest site will determine the strength. Nevertheless, strength values close to the theoretical limit as found for Mo fibers extracted from a similar eutectic alloy Reference Bei, Shim, Pharr and George12,Reference Johanns, Sedlmayr, Sudharshan Phani, Mönig, Kraft, George and Pharr14 were not observed.
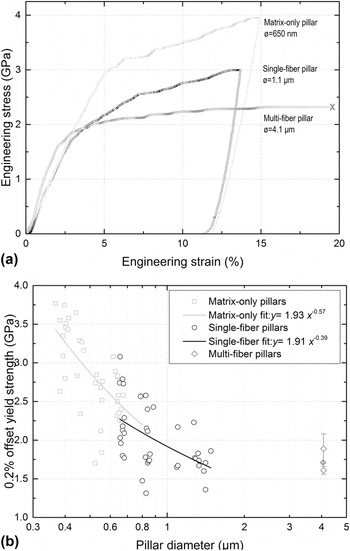
The load–displacement data obtained from microcompression tests were converted to engineering stress–strain data as described in Reference Fei, Abraham, Chawla and JiangRef. 27. The top diameter was used to determine the cross-sectional area for the stress calculation, and the indenter displacement was divided by the total height of the pillar to obtain the strain values. Typical stress–strain curves of the M.O., S.F., and M.F. pillars are presented in Fig. 4(a).
Three different types of pillars were tested, i.e., matrix-only, single-fiber, and multiple-fiber pillars. (a) Typical stress–strain curves of the M.O., S.F., and M.F. pillars. All M.F. pillars failed through buckling, while M.O. and S.F. deformed uniformly. (b) 0.2% offset yield stress versus the diameter for all pillars tested. The scaling behavior of the M.O. and S.F. pillars was determined by fitting using a two-parameter power law.

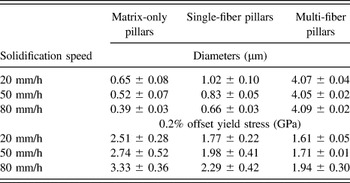
The 0.2% offset stress of all the M.O. and S.F. pillars is plotted against the diameter in Fig. 4(b). Each pillar group was fitted with a power law to determine their scaling behavior. As can be seen in Fig. 4(b), both types of pillars exhibit a size effect. It is notable, though, that the fitted curve of the S.F. pillar strength shows a significantly flatter trend. Comparing the strength levels in the diameter range of ∼600 nm, it is evident that the strength of the M.O. pillars is higher than the strength of the S.F. pillars for similar diameters. For the M.F. composite pillars, it is found that the strength increased with the increase in the solidification speed or decrease in the fiber diameters and fiber spacing. The postmortem examination of the M.F. composite pillars revealed that all pillars had failed by buckling [Fig. 2(f)]. This could be related to some misalignment between the indenter tip and the pillar surface during the tests. Nevertheless, from the stress–strain curve of the M.F. pillars [Fig. 4(a)], it is clear that the plastic instability occurred at sufficiently high strains and, therefore, the misalignment will not have a significant effect on the offset yield strength as also discussed by Schwaiger et al. Reference Schwaiger, Weber, Moser, Gumbsch and Kraft28 The average diameter and average 0.2% offset strengths of the different pillar types with respect to the solidification speed are summarized in Table II. The increase in strength values observed for the M.F. pillars may be attributed to the sharp increase in the strength values of Cr fibers for such small length scales and the fact that the 80 mm/h samples contained a larger number of these higher strength fibers compared to the 20 mm/h samples. It can also be seen that the strengths of the M.F. pillars are lower than the strengths of the S.F and M.O. pillars prepared from the same sample, as expected due to the increase in size. This indicates that the strength of the bulk samples might be even lower. Due to FIB preparation methods, which are known to have some effect on the mechanical behavior of materials particularly at small length scales, Reference Kiener, Motz, Rester, Jenko and Dehm29 a comparison of the values reported in this study with the bulk behavior might not be valid, though. However, the main focus of this study is to understand the mechanisms involved in the deformation of these eutectics and their dependence on the processing conditions.
Pillar diameters and 0.2% offset yield stress of NiAl and NiAl–Cr composite pillars for the three different solidification speeds. The average values and the corresponding standard deviation are shown.

A rule-of-mixture analysis combining NiAl and Cr was performed to estimate the strength of the S.F. composite pillars from the strengths of the M.O. pillars and individual Cr fibers. The analysis was performed for the fiber-matrix top-surface-area ratio of 0.5, since for all the pillars the ratio was in the range of 0.5 ± 0.2. The strengths were calculated for the Cr fiber diameters tested. The procedure was as follows:
-
(i) For each Cr fiber tested, the corresponding composite pillar diameter was calculated for an area ratio of 0.5. Accordingly, the diameter of the equivalent NiAl pillar was calculated.
-
(ii) The experimentally obtained stress versus diameter data of the M.O. and S.F. pillar tests were fitted with a power law
 $y = a \cdot {x^{\rm{b}}}$
[Fig. 4(b)].
-
(iii) From the power law fits, the strength values of the M.O. and S.F. pillars were then estimated for the diameters calculated in step 1.
-
(iv) Based on the strength
${\sigma _{{\rm{NiAl}}}}$
of M.O. pillars thus obtained and the strength
${\sigma _{{\rm{Cr}}}}$
of the Cr fibers, the rule-of-mixture strength
${\sigma _{{\rm{ROM}}}}$
of the S.F. pillar was calculated following the rule-of-mixture,


 $${\sigma _{{\rm{ROM}}}} = {{({\sigma _{{\rm{Cr}}}} \cdot {A_{{\rm{Cr}}}} + {\sigma _{{\rm{NiAl}}}} \cdot {A_{{\rm{NiAl}}}})} \over {{A_{{\rm{comp}}}}}}\quad ,$$
where
 ${A_{{\rm{Cr}}}}$
,
 ${A_{{\rm{NiAl}}}}$
, and
 ${A_{{\rm{comp}}}}$
are the top-surface-areas of the fiber, NiAl, and composite pillars, respectively.
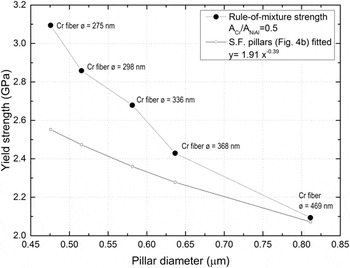
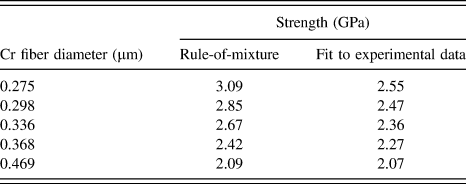
The calculated rule-of-mixture composite pillar stress was compared to the values determined from the experiments for different pillar diameters (Fig. 5). It was found that the rule-of-mixture calculations predict a higher strength value for the composite pillars than observed experimentally. The results are summarized in Table III.
The pillar strength (full symbols) was calculated based on a simple rule-of-mixture argument for the Cr fiber diameters tested in this study. The experimental values [open symbols, determined from the power law fit of Fig. 4(b)] are significantly lower than the values determined by combining the strength values of the individual materials.

Comparison of the strength of single-fiber composite pillars with different fiber diameters. The strength was calculated following a rule-of-mixture approach and determined from a power-law fit to the experimental data.

For example, a yield strength value of 3.09 GPa is predicted for a fiber diameter of 275 nm, which is higher than the yield strength value of 2.55 GPa determined from fitting the experimental data. This would suggest that the interface between the fiber and matrix influences the strength values obtained in the composite pillars and therefore plays an important role in the deformation process. It should also be noted that for the rule-of-mixture analysis, the compressive strength of the pillars is used with the tensile strength of Cr fibers as compressive strength values of single-crystalline Cr at the adequate length scales were not available in the literature. However, if a 20% increase in compressive strength values compared to tensile strength values is considered, assuming a similar behavior as observed in other refractory metals, Reference Duesbery and Vitek30 the predicted values for the composite pillars from the rule-of-mixture calculation would be even higher.
Transmission electron microscopy showed that the matrix of the undeformed sample contained a small number of dislocations. Very few dislocations were found in the Cr fibers [Fig. 6(a)], while a network of dislocations resulting from the lattice mismatch between NiAl and Cr can be seen at the interface in the longitudinal section [Fig. 6(b)]. The lattice mismatch was estimated as 0.31, which is in general agreement with the literature. Reference Cline, Walter, Koch and Osika31
After the deformation experiments, the pillars were examined by SEM/FIB. Examination of the M.O. and S.F. pillars reveals slip steps on the surface [Figs. 2(d) and 2(e)]. Cross sections of the S.F. pillars were prepared by FIB to examine the deformation along the interfaces. As shown in Fig. 6(c), the interface between the fiber and the matrix showed no sign of delamination or fracture indicating that the fiber-matrix interface is fairly strong and that both materials co-deform.
The deformed composite pillars had higher dislocation densities in both phases as well as at the interface [Fig. 6(d)]. The TEM lamella shown in Fig. 6(d) was cut at an angle through the pillar showing both the bulk of the deformed Cr fiber and the interface dislocations. Most of the dislocations were identified to have 〈100〉 Burgers’ vectors, while other dislocations of mixed Burgers’ vector were also observed. Similar interface dislocation structures around the fiber in NiAl–Cr directionally solidified eutectics were observed previously Reference Cline, Walter, Koch and Osika31,Reference Walter, Cline and Koch32 ; dislocations of the 〈100〉-type were observed in the NiAl matrix in samples deformed to low strains (less than ∼0.5%) and preferentially emitted from the NiAl/Cr interface. Reference Misra and Gibala33
Recently, the dislocation evolution and deformation mechanisms in directionally solidified NiAl–Mo alloys were discussed. Reference Kwon, Bowers, Brandes, McCreary, Robertson, Phani, Bei, Gao, Pharr, George and Mills34 All three types of 〈100〉 dislocations were observed in the NiAl matrix surrounding the Mo fiber in undeformed specimens. The Mo fibers were predominantly dislocation-free and exhibited very high strength values close to the theoretical strength. It was suggested that the deformation started in the NiAl matrix leading to the accumulation of the 〈100〉-type dislocations at the interface, which then would activate 〈111〉-slip in the Mo fibers with increasing strains. At very high strains, the 〈111〉-slip in the Mo fibers would then trigger the 〈111〉-type dislocations in the NiAl matrix. This behavior appears to be different from our observations on NiAl–Cr alloys. First, the Mo fibers are much stronger than the NiAl matrix, and it can, thus, be expected that in the case of NiAl–Mo plastic deformation starts in NiAl. The Cr fibers in the NiAl–Cr alloys, though, exhibited comparable or even lower strengths compared to the NiAl matrix [Fig. 3(b) and Table II]. Furthermore, we observed a network of misfit dislocations surrounding the Cr fibers [Fig. 6(b)], which was absent in the NiAl–Mo alloy. Reference Kwon, Bowers, Brandes, McCreary, Robertson, Phani, Bei, Gao, Pharr, George and Mills34 Along with the mechanical behavior observed in this study, it is thus conceivable that the NiAl–Cr interface plays an important role in the deformation of the composites. As pointed out by Noebe et al., Reference Noebe, Misra and Gibala35 the constrained deformation of the ductile phase may lead to dislocation generation at the interface thereby enabling the plastic deformation of the brittle matrix, which may then improve ductility and toughness of the composites. Such a mechanism would not work for weak interfaces because the stress concentration at the interface might nucleate cracks rather than initiate plastic deformation. Reference Noebe, Misra and Gibala35
Assuming the interface between the NiAl-matrix and the Cr fiber controls the deformation process, the independence of the hardness values on the processing conditions of the directionally-solidified eutectics (Table I) can be rationalized. The strength of the matrix and the fibers increases with increasing solidification speed (Fig. 5, Table III), while the interface area per unit volume also increases providing more sites for dislocation generation. Such an interface-mechanism would counteract the strength increase inherent to the smaller dimensions of the fiber and the matrix in-between. However, M.F. pillar compression tests show an increase in strength values with increasing solidification speed (Table II). This apparent contradiction regarding both the strength levels and their dependence on the microstructural dimensions might be related to homogenous versus heterogenous dislocation nucleation in nanoindentation and microcompression, Reference Bei, Gao, Shim, George and Pharr36,Reference Battaile, Boyce, Weinberger, Prasad, Michael and Clark37 respectively.
IV. CONCLUSIONS
In this work, we have presented a consistent picture of an interface contribution to the strength and deformation of directionally solidified eutectic NiAl-Cr alloys based on the results from micromechanical testing. The interface appears to be strong allowing for strain transfer from the ductile to the brittle phase likely due to the generation of mobile dislocations at the interface which provide additional ductility of the matrix. The Cr fibers, with diameters of 300–700 nm deformed up to several percent in plastic strain, even when freestanding. In the alloy, the two phases exhibited co-deformation without cracks or delamination at the fiber-matrix interface. This argument is supported by the fact that the M.O. pillars as such have a higher strength than the S.F. pillars containing an interface. This also explains our findings that the hardness does not depend on the fiber diameter and is thus the same for the alloys produced at different solidification speeds.
ACKNOWLEDGMENTS
This research was financially supported by the Helmholtz Association of German Research Centers under the framework of the Helmholtz Research School on “Integrated Materials Development for Novel High Temperature Alloys”. We would also like to thank Ms. Daniela Exner (KIT) for preparing the FIB lamellae of the deformed pillars for TEM examination.