



1 Introduction
The natural language data that forms the input for learning by children and adults almost invariably gives rise to multiple competing generalisations. Even when their focus is restricted to only a particular segmental co-occurrence pattern, it becomes immediately apparent that there are multiple possible generalisations that are consistent with the pattern. Of course, this is not a novel insight, and many have grappled with the question in the past. However, the observation does raise the question that is of primary importance to this article. That is, how exactly do speakers generalise in the face of data that is ambiguous between generalisations of varying complexity? The experiments presented in this article suggest that, at least for phonotactic sequence patterns, learners are able to keep track of multiple generalisations related to the same segmental co-occurrences; however, the generalisations they learn are only the simplest ones consistent with the data, where the ‘simplest’ generalisation is the one whose definition uses the fewest representational primitives.
With regard to phonotactic patterns, there is considerable evidence that both infants and adults possess phonotactic knowledge of their native languages. This knowledge has been probed on the basis of phonotactic judgements of nonce words (Scholes Reference Scholes1966, Jusczyk et al. Reference Jusczyk, Friederici, Wessels, Svenkerud and Jusczyk1993), word-segmentation tasks (Friederici & Wessels Reference Friederici and Wessels1993, McQueen Reference McQueen1998) and perceptual illusions (Dupoux et al. Reference Dupoux, Kakehi, Hirose, Pallier and Mehler1999, Kabak & Idsardi Reference Kabak and Idsardi2007). There is further evidence that this phonotactic knowledge involves not just segmental patterns, but also more abstract natural class or featural patterns (Moreton Reference Moreton2002, Albright Reference Albright2009).
The paradigm of artificial language learning has been especially fruitful in probing the kinds of patterns that both children and adults learn in the domain of phonotactic learning.Footnote 1 There is again substantial evidence that exposure to words with particular patterns during a training phase of an artificial language learning experiment is sufficient for children and adults to generalise the patterns to novel words (Chambers et al. Reference Chambers, Onishi and Fisher2003). Results from such experiments also suggest that, in line with typological asymmetries, speakers are able to employ ‘substantive biases’ in generalising from the training data (Wilson Reference Wilson2006, Moreton Reference Moreton2008, Becker et al. Reference Becker, Ketrez and Nevins2011). As well as substantive biases that are in line with typological asymmetries, learners in such experiments also appear to exhibit what might be called ‘structural biases’; i.e. they exhibit different phonotactic learning biases over different representations (Bergelson & Idsardi Reference Bergelson, Idsardi, Chandlee, Franchini, Lord and Rheiner2009, Chambers et al. Reference Chambers, Onishi and Fisher2011). Finally, in line with what has been observed for natural language phonotactics, participants in artificial language learning experiments also seem to learn featural generalisations; i.e. they are able to access more abstract generalisations than segment-sequence generalisations (Finley & Badecker Reference Finley and Badecker2009, Cristià et al. Reference Cristià, Seidl and Gerken2011). One common theme in much of the research on biases just discussed is that they are more directly related to substantive issues, involving either typological asymmetries or representational issues.
Given that artificial language learning experiments show such similarity to research on natural language phonotactics, they provide an additional source of evidence, alongside modelling, for understanding formal inductive biases employed by a learner during the acquisition of phonotactic patterns. Here, too, some recent work has probed the issue. Research suggests that, for both adults and children, simpler (particularly single-feature) generalisations are easier to learn than more complex generalisations (Pycha et al. Reference Pycha, Nowak, Shin and Shosted2003, Saffran & Thiessen Reference Saffran and Thiessen2003, Cristià & Seidl Reference Cristià and Seidl2008, Kuo Reference Kuo2009). Other research has focused on issues of formal computational complexity, and has shown that adults are able to learn patterns that belong to only a subset of the patterns describable by finite-state automata, labelled subregular classes (Lai Reference Lai2015, McMullin Reference McMullin2016).
As mentioned at the outset, our interest in this article is in determining what kind of bias, if any, learners impose on data that is consistent with multiple phonotactic generalisations. However, none of the experimental results reviewed very briefly above – i.e. neither the experimental results showing that patterns mirror typological tendencies nor those showing that simpler generalisations are learned better than more complex generalisations – directly address the question of what speakers learn in the face of ambiguity. Furthermore, while there are quite a few approaches espoused for theoretical or logical reasons in the literature, there is far less experimental work on the issue. We describe the few experimental studies that we are aware of that address this question in more detail below, and then we discuss them again in the context of the different theoretical approaches.
Gerken (Reference Gerken2006) gave 9-month-old infants training stimuli that consisted of syllables that had the pattern AAB (or ABA), e.g. jidiji or jijidi.Footnote 2 Furthermore, in one training condition, the B syllable was always di (e.g. leledi, wiwidi, jijidi, dededi) and, in a second training condition, it varied between four different syllables, di, je, li and we (e.g. leledi, wiwije, jijili, dedewe). The infants were then tested on novel items that were consistent with the AAB (or ABA) pattern (e.g. kokoba, popoga). In response to the second training condition, the infants had significantly different looking times compared to controls for test stimuli that consisted of AAB (or ABA) syllables with a different set of B syllables. This did not hold for the first training condition (where all the training words had the same B syllable, namely di). However, in a follow-up experiment in which the B syllables in the test stimuli were also di, the infants had significantly different looking times even with the first condition. In both experiments, for the first condition there were two competing generalisations possible during training; one possible generalisation was that all words were AAB (or ABA) and the B was always di (the more specific generalisation), and a second possible generalisation was that all the words were AAB (or ABA) (the less specific generalisation). Gerken interprets the results of their experiment as evidence for infants forming the subset (or most specific) generalisation.
A second relevant study is that of Linzen & Gallagher (Reference Linzen and Gallagher2014, Reference Linzen and Gallagher2017). The authors were interested in the time-course of generalisation, but some of the results in their experiments are relevant to the question of how generalising proceeds when the data is consistent with multiple different generalisations. They conducted four experiments; we focus here on the aspects of their results that are crucial in this paper. For example, in their Experiment 1, they gave one group of participants training words with an initial voiced obstruent and another group words with an initial voiceless obstruent. In the testing phase, there were three types of stimuli: those whose initial consonants were the same as in the training set (which Linzen & Gallagher call conforming–attested), those whose initial consonants had the same voicing as the training set but were not experienced during the training (conforming–unattested), and those whose initial consonants were inconsistent with the training data (non-conforming–unattested). Overall, across the experiments, Linzen & Gallagher observed that, with sufficient training, participants accepted conforming–attested more often than conforming–unattested, which in turn were accepted more often than non-conforming–unattested, meaning that they were able to learn generalisations, but still had a preference for items encountered in the training set. They interpret their results as evidence that, with sufficient exposure, participants learn not only featural (or class level) generalisations, but also specific segmental generalisations.
A third relevant study is that of Cristià et al. (Reference Cristià, Mielke, Daland and Peperkamp2013), who present evidence from an artificial language learning experiment that participants do not learn a more complex generalisation if simpler generalisations are available. As with many artificial language learning experiments, participants were auditorily presented with non-words in a training phase. The test-phase stimuli combinations were more complicated than presented below; we highlight the crucial aspects of their results. In the test phase, there were four types of stimuli: onsets already encountered in the training phase (‘exposure’), new onsets that had the same phonological features as the narrowest class that described the training set (‘within’), new onsets that differed in one feature from the narrowest class that described the training set (‘near’) and new onsets that differed in two features from the narrowest class that described the training set (‘far’). Participants rated how frequently they thought the test stimuli had occurred in the training phase. They gave the highest frequency ratings to the old onsets (‘exposure’); the ‘within’ and ‘near’ stimuli received similar frequency ratings and the ‘far’ onsets the lowest ratings. Since there was generalisation beyond the exposure set of consonants to those outside the set, the results suggest the target grammar was not the subset grammar (i.e. the more complex generalisation in our terms). Similarly, the fact that the participants gave similar frequency ratings to the ‘within’ and ‘near’ stimuli is evidence that the subset generalisation was not learned.
Finally, another set of studies suggests local generalisations are privileged (Finley Reference Finley2011, Reference Finley2012, Lai Reference Lai2015, McMullin Reference McMullin2016). For example, Finley (Reference Finley2011) shows that speakers have a bias to learn patterns that are transvocalic (also called ‘first-order local’). When presented with training stimuli that contain a version of sibilant harmony across a vowel (e.g. [pisasu], [piʃaʃu]), learners do not extend the pattern to transsegmental (‘second-order non-local’) occurrences (e.g. [sipasu], [ʃipaʃu]), but are willing to extend the pattern from the latter stimuli to the former. This could be argued to show that learners have a bias for the more specific (or complex) generalisation, under the assumption that transsegmental non-local patterns are simpler to represent than transvocalic non-local patterns, as the latter make specific reference to ignoring only vowels, while the former make no such fine-grained distinction.
Before discussing the different viewpoints on generalisation under ambiguity and seeing how they are informed by the above results, we think it is helpful to break down the question of how learners generalise from data that is ambiguous between multiple different generalisations into the two subquestions in (1).
(1)


The questions might be easier to follow with a concrete example. Assume the exposure stimuli all have consonants that agree in both voicing and continuancy (e.g. [fisu], [pita], [badi]). There are multiple generalisations that are consistent with the input, including a voicing harmony generalisation (which we will notate as ‘[α voice]’), a continuancy harmony generalisation (‘[β cont]’) and a complex voicing + continuancy harmony generalisation (‘[α voice, β cont]’). Note that [α voice] here stands for the feature-sequence generalisation [α voice … α voice], and [β cont] for the feature-sequence generalisation [β cont … β cont]; i.e. both generalisations are over two (albeit identical) features. Similarly, the conjoined generalisation [α voice, β cont] involves four features, and therefore counts as more complex.Footnote 3 (We will use the shorter descriptions throughout the paper, to make the text more readable.) The first question, (1a), asks whether speakers learn just a single one of the possible generalisations or more than one generalisation consistent with the data, and the second, (1b), asks whether speakers learn the more complex [α voice, β cont] generalisation (where the generalisation is that both voicing harmony and continuancy harmony have to be present in a stimulus for it to be acceptable), given that the data is consistent with the simpler independent generalisations [α voice] and [β cont].
There are two important things worth bearing in mind with regards to the terminology we use. First, we follow Hayes & Wilson (Reference Hayes and Wilson2008) in applying the notions of simplicity and specificity to individual rules and constraints instead of whole grammars. Second, we conflate the terms ‘most complex’ and ‘most specific’, and use them interchangeably. These are of course separate notions, where the former refers to the intensional description, and the latter to the extension set. We adopt this conflation largely because it simplifies the discussion of the previous literature. However, we return to this issue in §5, and elaborate on how our results bear on the distinction.
One response to the above questions is to suggest that speakers learn just a single, simplest generalisation in response to ambiguous data (i.e. just [α voice] or [β cont] in our example above). In one of the earliest discussions of the topic, Halle (Reference Halle1961) and Chomsky & Halle (Reference Chomsky and Halle1968) suggest something similar. They propose that the learner acquires the simplest generalisation consistent with the data, where they define the ‘simplest’ generalisation to be one that uses the fewest representational primitives (e.g. features, segments, etc.).Footnote 4 We call this the Simplest Generalisation principle. Throughout this paper, echoing Halle (Reference Halle1961) and Chomsky & Halle (Reference Chomsky and Halle1968), we use ‘simplicity’ to refer to simplicity in terms of representational primitives. Furthermore, we use ‘simplest’ to refer to one extreme on the scale of simplicity, and the phrase ‘most complex’ to refer to the other extreme of the same scale. Simplicity is therefore based on the intensional description, not on the extensional sets that result from the description. For example, a generalisation that utilises one feature is simpler than one that utilises more features; similarly, a generalisation that invokes the representation of just a syllable is simpler than one that invokes the representation of a syllable along with that of a segment simultaneously.
A second approach, which goes in the opposite direction of the Simplest Generalisation principle, is one where the learner keeps track of a single most specific generalisation that is consistent with the data (i.e. the complex generalisation [α voice, β cont] in our example above). This has been termed the Subset principle (Dell Reference Dell1981, Berwick Reference Berwick1985).Footnote 5 There is some experimental evidence directly arguing for the Subset principle. As mentioned above, Gerken (Reference Gerken2006) interprets their results as evidence that infants formed the subset (or most specific) generalisation; however, Cristià et al. (Reference Cristià, Mielke, Daland and Peperkamp2013) argue against this viewpoint.
A third view that is very close in spirit to the Simplest Generalisation principle is that the speaker learns the simplest generalisation, and, in case there is more than one such generalisation that can lay claim to being the ‘simplest’, then keeps track of all such ‘simplest’ generalisations (i.e. in our example above, the learner acquires both the independent generalisations [α voice] and [β cont]). In fact, the Chomsky & Halle (Reference Chomsky and Halle1968) approach discussed above could be extended along these lines, given that they assume a single ‘simplest’ generalisation in their own discussion. This viewpoint is also espoused by Hayes & Wilson (Reference Hayes and Wilson2008) in their attempt to develop a baseline Maximum Entropy phonotactic learner model. We call this the Multiple Simplest Generalisations principle.
A fourth possible approach is one that suggests that learners are also able to keep track of all generalisations consistent with the ambiguous data (i.e. the learner acquires all the generalisations [α voice], [β cont] and [α voice, β cont] in our example above). However, such approaches differ in how they weight the most specific or simplest generalisations. One variation of this approach aligns itself to the Simplest Generalisation principle, instead of the Subset principle; i.e. learners keep track of multiple (potentially, all) generalisations that are consistent with the data, but are biased to weight the simpler generalisations more highly than the more specific ones. We call this the Proportional to Simplicity principle. Although not direct, some evidence for this position comes from the artificial language learning experiments conducted by Linzen & Gallagher (Reference Linzen and Gallagher2014, Reference Linzen and Gallagher2017). For their experiments, greater acceptability of the conforming–unattested items over the non-conforming–unattested items can be regarded as due to the learning of a simpler pattern involving voicing; however, any increase in acceptability of the conforming–attested items over the non-conforming–unattested items could be due to both the learning of a simpler featural generalisation and/or a more complex/specific segmental generalisation.Footnote 6 In other words, if both the complex and the simple generalisations are learned, then the acceptability of the conforming–attested could be an additive effect of the two generalisations. Overall, Linzen & Gallagher showed that, with sufficient training, participants accepted conforming–attested more than conforming–unattested, which in turn were accepted more than non-conforming–unattested, meaning that they were able to learn generalisations but still had a preference for items from the training set. Furthermore, if we look carefully at the relative magnitudes of the acceptability judgements in their Experiments 1 and 2, it seems that, for the largest exposure groups, the difference between the conforming–unattested items compared to the non-conforming–unattested items was larger than the difference between the conforming–attested items and the conforming–unattested items. This suggests that, for these groups of participants, the simpler (featural) generalisation had a higher weighting than the more specific (segmental) generalisation. The logic behind this potential understanding of their results is further fleshed out below in the context of a discussion of the predictions of the different principles for our own experiments (see Fig. 1 below).
Predicted proportion of ‘yes’ responses (averaged over multiple participants) to the test stimuli under the different principles. The dashed line indicates the baseline proportion of ‘yes’ responses to Disharmony stimuli, [αvoice] indicates the weight of the voicing harmony generalisation, [βcont] indicates the weight of the continuancy harmony generalisation and [αvoice, βcont] indicates the weight of the complex harmony generalisation. Predictions for the relative magnitudes of these weights under each principle are given on the right. The relative weights are identical here for the Simplest Generalisation and Multiple Simplest Generalisations principles because of averaging over participants; we discuss this issue in the text.
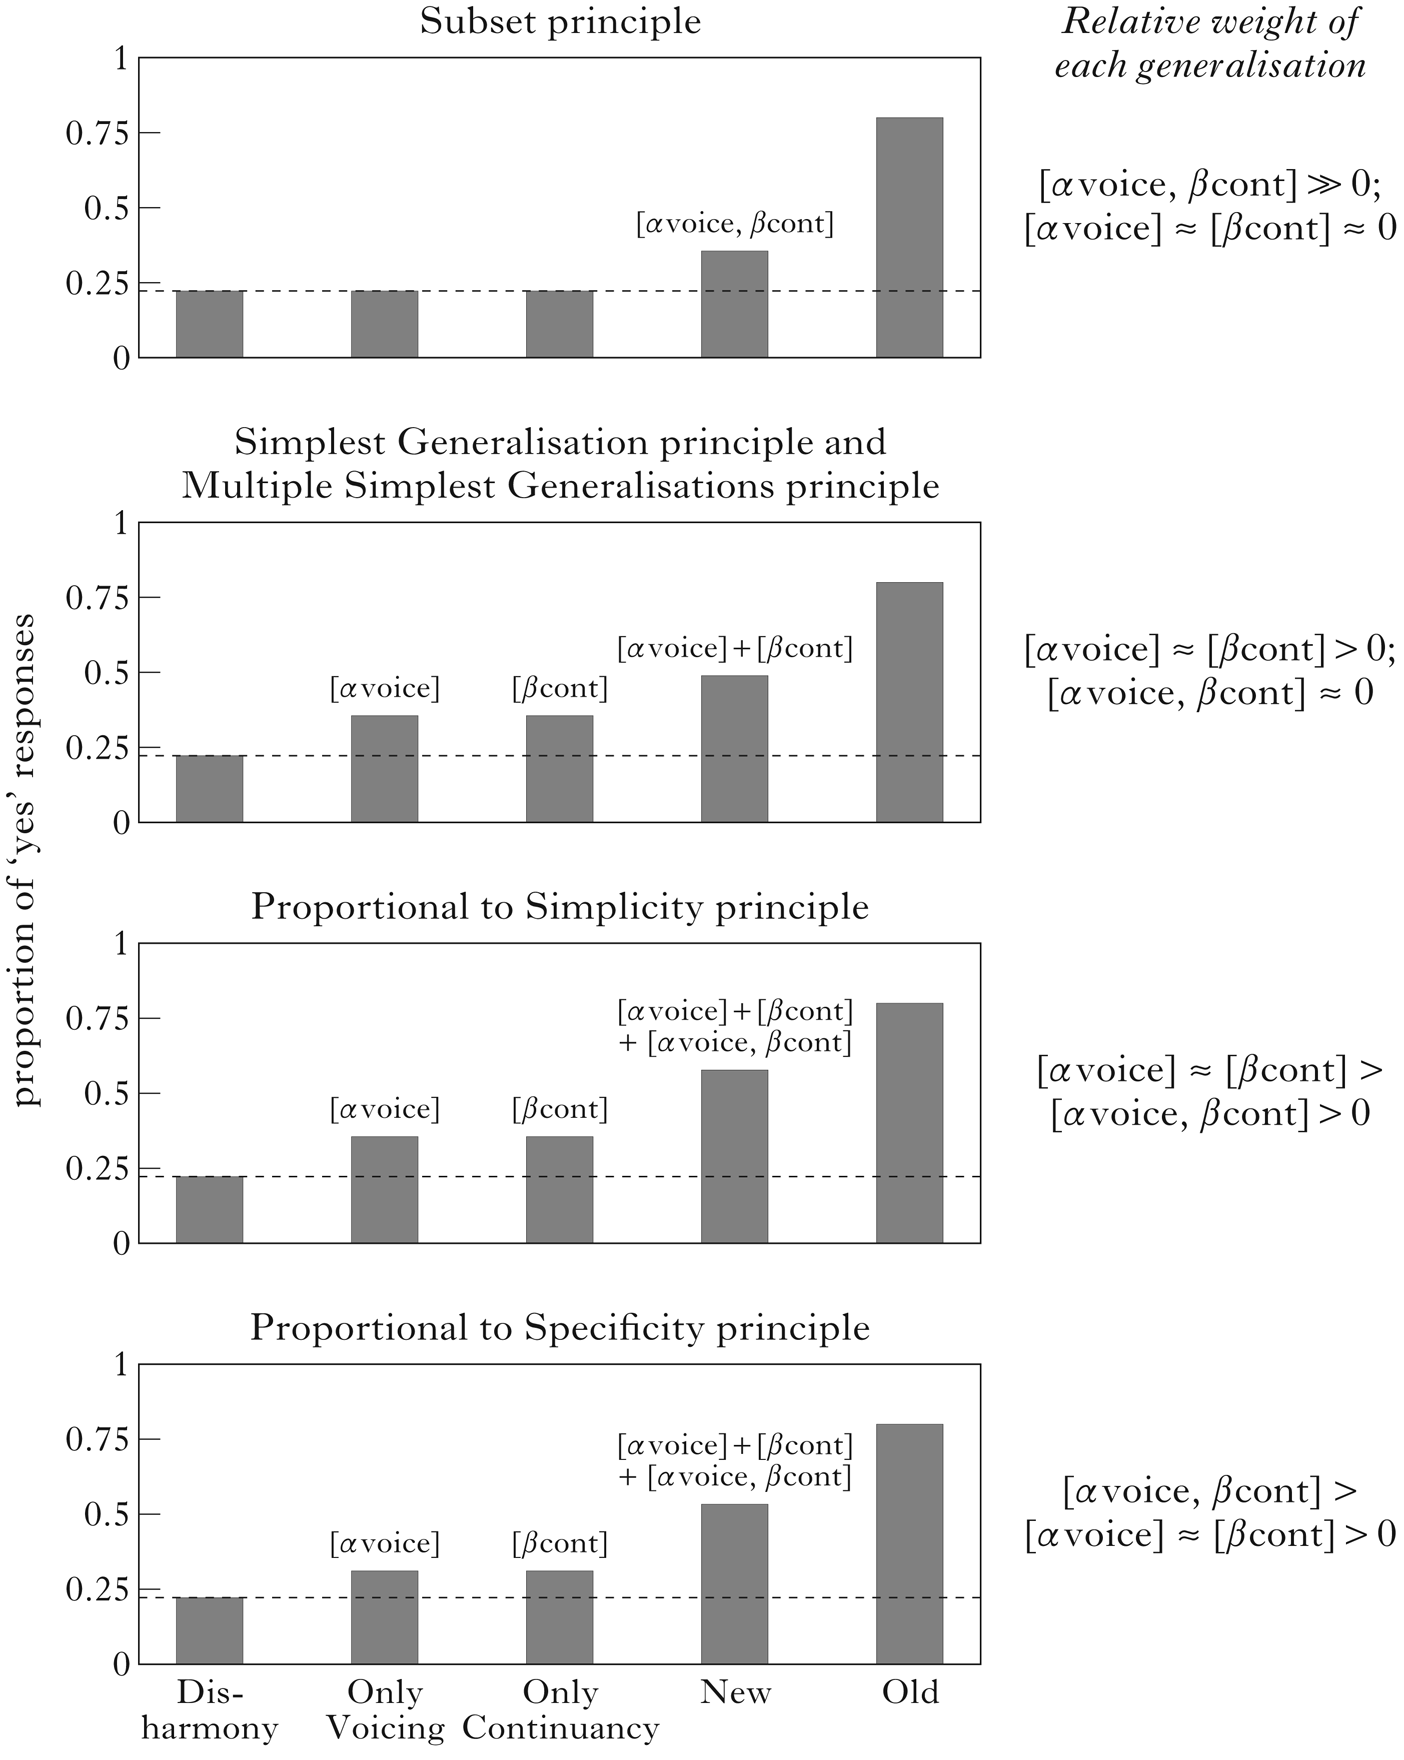
A second variant of the fourth principle is instantiated in Bayesian models. In a probabilistic formulation of the Subset principle, it has been suggested that learning is proportional to the specificity of the generalisation; i.e. a generalisation that is more specific is more highly valued or weighted (Tenenbaum & Griffiths Reference Tenenbaum and Griffiths2001, Xu & Tenenbaum Reference Xu and Tenenbaum2007, Linzen & O'Donnell Reference Linzen and O'Donnell2015).Footnote 7 Researchers who argue for this approach (typically) take a specific generalisation to be a generalisation whose extension is a set of possible forms that is closest in size to that of the data encountered through experience (in our case, the training data). We call this the Proportional to Specificity principle. It should be pointed out that some of these claims are made in the context of word learning, and there is no clear experimental evidence supporting the model's claim for the learning of phonotactic sequences. Furthermore, while Linzen & O'Donnell (Reference Linzen and O'Donnell2015) set out to explain the artificial language learning results related to the phonotactic patterns in Linzen & Gallagher (Reference Linzen and Gallagher2014, Reference Linzen and Gallagher2017) using their model, a crucial prediction of the model – namely, that the weight (or posterior probability) associated with the simplest generalisation will decrease with an increasing number of training items – was not observed in Linzen & Gallagher's experimental results. So, it is unclear that the experimental evidence from Linzen & Gallagher can be interpreted as clear evidence in favour of their model.
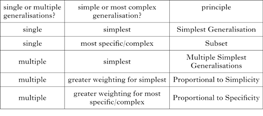
These different approaches are summarised in Table I, by way of answering the two different subquestions laid out above in (1).
Generalisation in the face of ambiguity under the different principles.
In this article, we present three artificial language learning experiments that provide evidence for the Multiple Simplest Generalisations principle, which states that learners do acquire multiple generalisations in the face of ambiguous data, but the generalisations they learn are only the simplest ones that are consistent with the data, i.e. there is no evidence that learners acquire the more complex/specific generalisations in the presence of simpler possibilities. In the following sections we first present the details of the respective experiments, and then flesh out more detailed predictions for each of the above principles. Briefly, in Experiment 1, we look at how participants learn from training words that are ambiguous between the two simple featural generalisations ([α voice] and [β cont]) and the more complex featural generalisation ([α voice, β cont], in which the two simple generalisations are satisfied simultaneously). While the experiment presents clear evidence that learners acquired the multiple simple generalisations, the evidence for them acquiring the more complex generalisation is confounded, as they could also have simply kept track of a simple generalisation over segmental representations. To overcome this confound, in Experiments 2 and 3 we specifically tested participants on stimuli that could not be accepted based simply on the segmental sequences in the training stimuli. The results of Experiments 2 and 3 argue clearly that there is no evidence that the participants kept track of a more complex featural generalisation when simpler generalisations were possible for the training data.
2 Experiment 1
2.1 Methods
2.1.1 Participants
25 English-speaking undergraduates at Michigan State University participated in this experiment for extra credit; however, two of the participants were excluded because they always responded ‘yes’ both to stimuli that were present during the training and to those that violated the crucial phonotactic generalisations in training data, making it difficult to ascertain whether they had learned anything at all. Only the data from the remaining 23 participants is presented and analysed in what follows (18 female, 5 male; mean age = 19.9, SD = 1.5).
2.1.2 Materials
In this experiment, participants were trained on a language that consisted of CVCV nonce words. The vowels in the language were /a i u/ and the consonants /p b t d f v s z/. All possible CVCV combinations of these vowels and consonants (8 × 3 × 8 × 3 = 576 items) were recorded by a native speaker of American English from Michigan. Having all possible stimuli allowed us to randomise the training and testing stimuli on a participant-by-participant basis at the runtime of the experiment, which was predicated on the hope that by randomising we would control against any unintended generalisations in any single stimulus set.
The experiment consisted of two phases, a training phase and a testing phase, and lasted about 10–15 minutes in total.
Training. For the experiments in the paper, we chose to focus on obstruent consonants differing in voicing and continuancy, because there are a large enough number of contrasts in English to allow us to have a sufficient number of training and testing stimuli without there being other concomitant (phonological) featural changes. In the training phase of the experiment, participants were given only CVCV nonce words where the consonants simultaneously agreed in both voicing and continuancy. For example, [tipa] was a possible word in the language, since [t] and [p] are both voiceless and non-continuant.Footnote 8 Similarly, [fisa] was a possible word in the language, since [f] and [s] are both voiceless and continuant. On the other hand, [tisa] and [fiza] were not possible, since [t] and [s] disagree in continuancy, and [f] and [z] disagree in voicing. The input data was therefore consistent with at least the three following generalisations: (i) a voicing harmony generalisation, (ii) a continuancy harmony generalisation and (iii) a simultaneous voicing + continuancy harmony generalisation. Thus the input data was consistent with multiple generalisations, with different levels of complexity.
The training phase consisted of exposure to 100 possible CVCV nonce words in the language. The set of 100 words that a participant was exposed to during the training phase was chosen randomly from the 144 words in the target language on a participant-by-participant basis, using the statistical software R (R Development Core Team 2014).Footnote 9
Each participant was exposed to their list of 100 words twice, in an order that was pseudo-randomised at the runtime of the experiment by the software used for the experiment, PsychoPy (Peirce et al. Reference Peirce, Gray, Simpson, MacAskill, Höchenberger, Sogo, Kastman and Lindeløv2019). The pseudo-randomisation was constrained in such a way that a complete pass through the list of 100 words was completed before any repetitions were allowed. The words were presented both orthographically and auditorily on an iMac desktop computer; auditory presentation occurred through headphones.
Participants were asked to silently mouth the words, in order to ensure that they were paying attention to the training items, which would likely facilitate their learning of the language. For a given training trial, participants saw a grey screen with small white writing near the top that gave the instructions to ‘silently mouth the following word’; the word was presented orthographically in a larger font in the centre of the screen, and played over headphones. The training trials progressed automatically, with an intertrial interval of 0.5 seconds. The orthographic rendition of the CVCV word was displayed for one second; the duration of each trial was therefore equal to either the duration of the auditory presentation of the word or the one-second duration of the orthographic version, whichever was longer. The sound files for the CVCV words were on average 0.73 seconds. For all but four sound files, the duration of each trial was one second. The remaining four sound files had a trial duration of at most 1.03 seconds.
Testing. After the training, participants were given a randomised list containing five different types of testing stimuli: (i) Old, (ii) New, (iii) OnlyVoicing, (iv) OnlyContinuancy and (v) Disharmony. There were twelve items in each of these five categories, giving 60 test items in all. Participants were asked to determine whether the words they heard were possible words in the language that they had learned in the training phase. The two possible responses were ‘yes’ and ‘no’. As with the training stimuli, the testing stimuli were randomly chosen on a participant-by-participant basis.
The Old stimuli had actually occurred in that participant's training list. The New stimuli had not occurred in that participant's training list, but did conform to both the voicing harmony and the continuancy harmony generalisations. The OnlyVoicing stimuli had consonants that only agreed in voicing (i.e. they disagreed in continuancy); an example of a possible OnlyVoicing stimulus would be [tisa]. The OnlyContinuancy stimuli had consonants that only agreed in continuancy (i.e. they disagreed in voicing); an example of a possible OnlyContinuancy stimulus would be [zifa]. Lastly, the Disharmony stimuli had consonants that disagreed in both voicing and continuancy; an example of such a test stimulus would be [tiva].
2.2 Predictions
Given that the training data was consistent with both voicing and continuancy harmony, there were three different generalisations that were consistent with the data: (a) voicing harmony ([α voice]), (b) continuancy harmony ([β cont]) and (c) voicing + continuancy harmony ([α voice, β cont]), as shown in (2). Note that the third generalisation is the most complex and most specific, while the first two are equally simple, where simplicity is defined in terms of representational primitives used for the generalisation.
(2)

Since there are multiple generalisations consistent with the training data, the different principles presented earlier make different predictions about how the learners will generalise from the data, as shown in Fig. 1. The figure gives the predicted proportion of ‘yes’ responses (averaged over multiple participants) for the different types of test stimuli for each of the different principles. There is evidence of learning any of the relevant generalisations only if the proportion of ‘yes’ responses to any type of stimuli extends above the dashed line, which represents the baseline proportion of ‘yes’ responses for Disharmony stimuli. For example, OnlyVoicing and OnlyContinuancy stimuli would be above the line only if the learner has acquired a voicing harmony generalisation ([α voice]) and a continuancy harmony ([β cont]) generalisation respectively. The predictions related to the different principles are elaborated further below.
The Subset principle suggests that the learners would prefer only New and Old stimuli to Disharmony stimuli, as these are the only stimuli that are consistent with [α voice, β cont], the more complex/specific generalisation. The learners should not find OnlyVoicing and OnlyContinuancy stimuli more acceptable than Disharmony, as neither of them are consistent with the most specific generalisation.
The Simplest Generalisation principle predicts that some learners will generalise to voicing harmony ([α voice]), while others will generalise to continuancy harmony ([β cont]). Therefore, some learners should prefer OnlyVoicing stimuli to Disharmony stimuli, and others should prefer OnlyContinuancy stimuli. Furthermore, since New stimuli are consistent with either generalisation, they should be as acceptable for any single speaker as either OnlyVoicing or OnlyContinuancy. As a consequence, when averaged over multiple speakers, it seems as if the acceptance of New stimuli arises from an additive effect resulting from learning voicing and continuancy harmony separately. Crucially, however, there should be a negative correlation between learning voicing and continuancy harmony; i.e. as the acceptance for OnlyVoicing stimuli increases, the acceptance for OnlyContinuancy stimuli should decrease, since any given participant should have only learned one of the simple generalisations, not both.
The Multiple Simplest Generalisations principle predicts that learners acquire voicing harmony and continuancy harmony as separate generalisations. Therefore, both OnlyVoicing stimuli and OnlyContinuancy stimuli should be preferred over Disharmony stimuli. As a consequence, there is a predicted additive effect on New stimuli, which are consistent with both voicing and continuancy harmony (i.e. New ≈ OnlyVoicing + (OnlyContinuancy ― Disharmony)). Furthermore, based on the assumption that more successful learning of each generalisation is driven by greater overall learning (due to performance factors such as more attention to or greater aptitude for the task), there should be a positive correlation between learning voicing and continuancy harmony; i.e. as the acceptance for OnlyVoicing over and above Disharmony stimuli increases, the acceptance for OnlyContinuancy over and above Disharmony stimuli should also increase.
The Proportional to Simplicity principle predicts that learners acquire all three generalisations, but the importance given to each of them is expected to be directly proportional to their simplicity; therefore, the simpler generalisations ([α voice] and [β cont]) should be learned better than the more specific generalisation ([α voice, β cont]). As a consequence, learners will prefer OnlyVoicing and OnlyContinuancy stimuli over Disharmony stimuli. Furthermore, since the New stimuli are in the extension of all three generalisations, the preference for New stimuli should be more than just an additive effect of the preference for OnlyVoicing and OnlyContinuancy over Disharmony; i.e. a superadditive (or interactive) effect is predicted for New stimuli compared to OnlyVoicing stimuli and OnlyContinuancy stimuli. Finally, since the weight associated with the more specific generalisation is not as large as those with the simpler generalisations, the contribution of the more specific generalisation to the acceptability of the New stimuli will consequently also be smaller than the contributions of the simpler generalisations. Therefore, an interactive or superadditive effect observed for the preference for New stimuli over OnlyVoicing and OnlyContinuancy stimuli should be smaller than the preference for OnlyVoicing and OnlyContinuancy stimuli when compared to Disharmony (i.e. New ≈ (OnlyVoicing + (OnlyContinuancy ― Disharmony) + x), where x > (OnlyVoicing ― Disharmony) and x > (OnlyContinuancy ― Disharmony)).
Finally, the Proportional to Specificity principle makes similar predictions to the Proportional to Simplicity principle, as it too predicts that all three generalisations will be learned. However, the one difference is in the importance of the weight given to each of the generalisations. Where Proportional to Simplicity is biased towards simpler generalisations, Proportional to Specificity is biased towards more complex/specific generalisations. So, like Proportional to Simplicity, Proportional to Specificity predicts that the preference for New stimuli should be more than just an additive effect of the preference for OnlyVoicing and OnlyContinuancy stimuli over Disharmony stimuli (i.e. again a superadditive, or interactive, effect is predicted). However, since the most complex generalisation has greater weight than the simpler generalisations, the interactive effect observed should be larger than the preference for either the OnlyVoicing stimuli or the OnlyContinuancy stimuli when compared to Disharmony (i.e. New ≈ (OnlyVoicing + (OnlyContinuancy ― Disharmony) + x), where x > (OnlyVoicing – Disharmony) and x > (OnlyContinuancy ― Disharmony)).
2.3 Results
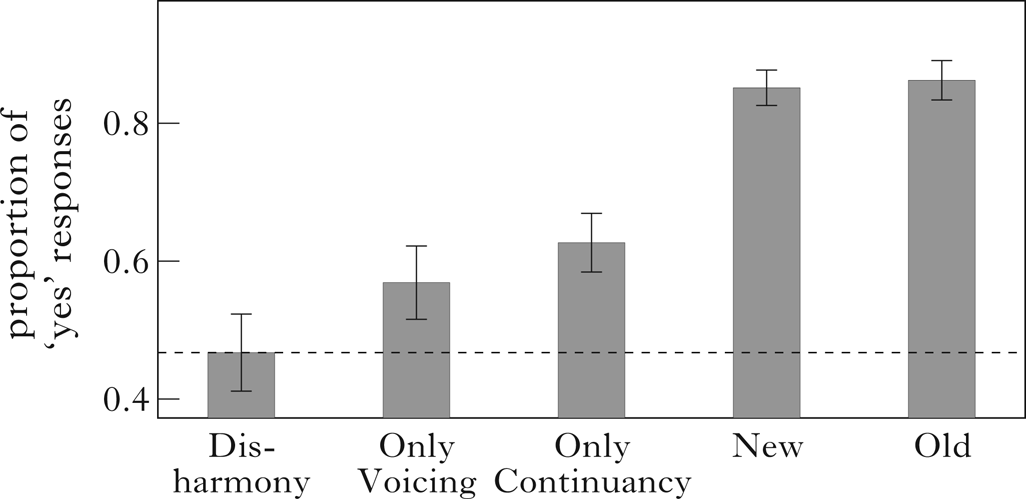
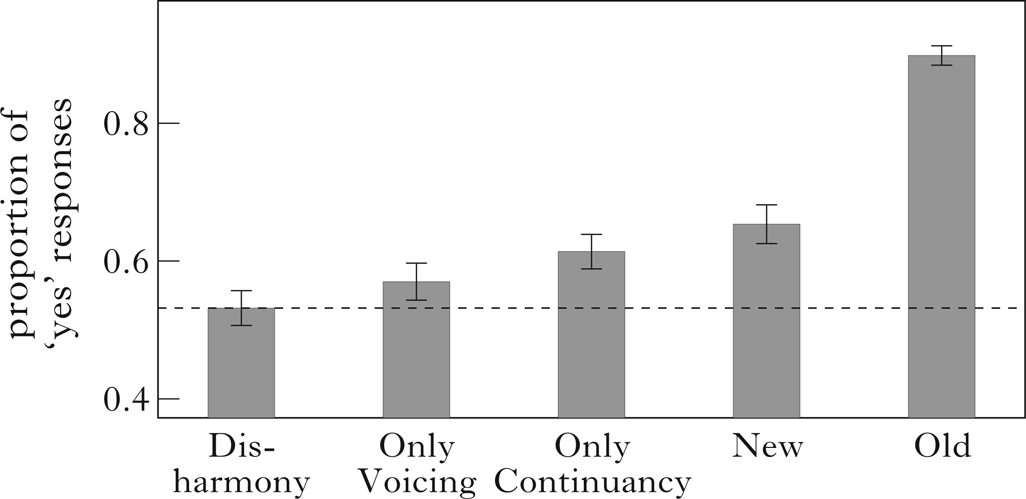
Visual inspection of the mean proportion of ‘yes’ responses in Fig. 2 suggests that all four types of test stimuli (OnlyVoicing, OnlyContinuancy, New and Old) are more acceptable to participants than Disharmony. Furthermore, the proportion of ‘yes’ responses for the New stimuli appears to be more than just an additive effect of the OnlyVoicing and OnlyContinuancy stimuli.
Proportion of ‘yes’ responses to the test stimuli in Experiment 1 (error bars represent standard errors).
In order to confirm the observations made by visual inspection of the results, we conducted a statistical analysis. In this article, wherever possible, participant responses were analysed using mixed-effects logistic regression models in R. The models were fitted using the glmer() function from the lme4 package (Bates et al. Reference Bates, Mächler, Bolker and Walker2015). We attempted to obtain the maximum possible random-effects structure (Barr et al. Reference Barr, Levy, Scheepers and Tilly2013). However, as is typical in psycholinguistic data, the models with the most complex random-effects structures did not converge. There is no general consensus on how to best proceed in identifying the best random-effects structure, especially when a model with a particular random-effects structure does not converge (Bolker Reference Bolker2014). In what follows, we describe the selection process for random-effects structure that we used for our experiments by following other experienced linear mixed-effects modellers in psycholinguistics (Barr et al. Reference Barr, Levy, Scheepers and Tilly2013).
We identified the appropriate random-effects structure by keeping the fixed effects constant; we used the full fixed-effects model for the experiment (i.e. with interactions for all the fixed effects, if relevant). We started with the most complex random-effects structure. In the case of non-convergence of the complex random-effects model, we systematically pared down the random-effects structure until convergence was reached. The least complex random-effects structure we considered was one with a varying intercept for both subjects and items. When convergence was reached, the corresponding random-effects model was identified as the maximal random-effects structure possible for the data. We then performed model comparison (using the maximal random-effects structure possible for the data identified in the manner just detailed), in order to identify the best combination of fixed effects; specifically, we compared models through backward elimination of non-significant terms, beginning with the interactions, using a chi-squared test of the log-likelihood ratios. The most complex fixed-effects model considered was the full model with all interaction terms, and the least complex was the model with only an intercept term and no fixed effects.
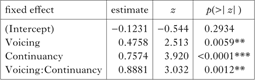
Using the above procedure, we attempted to fit logistic mixed-effects models for all the responses in Experiment 1, where the dependent variable was a binary variable that codes for whether participants responded with ‘yes’. To find out if the responses to the New stimuli were more than an additive effect of the OnlyVoicing and OnlyContinuancy responses (i.e. a superadditive effect), we coded the OnlyVoicing stimuli as Voicing, the OnlyContinuancy stimuli as Continuancy, the New stimuli as both Voicing and Continuancy and the Disharmony stimuli as neither Voicing nor Continuancy. The random-effects structure included a varying intercept for subjects and items. The best model was one with an interaction effect, shown in Table II. This suggests that the responses to the New stimuli cannot be modelled as simply an additive effect of the responses to the OnlyVoicing and OnlyContinuancy stimuli; crucially, the interaction effect is larger than either of the main effects.
Best-fitting logistic mixed-effects model for Experiment 1.
We include the comparison between the above model and a model without an interaction term in Table III. As can be seen, on the basis of the chi-squared test and the AIC/BIC, the model with the interaction term is the better model.
Model comparison with a model without an interaction term. Lower values for AIC (Akaike Information Criterion) and BIC (Bayesian Information Criterion) indicate better models.

2.4 Discussion
The results of Experiment 1 suggest that participants are able to learn the simpler generalisations even when the more complex generalisation is consistent with the training data. This must be true, as the OnlyVoicing and OnlyContinuancy stimuli were both rated higher than the Disharmony stimuli during training, which would not be predicted if participants had only learned the more complex generalisation. Therefore, the principle that suggests that the learner would acquire only the most complex/specific generalisation (i.e. the Subset principle) is inconsistent with the results.
Furthermore, the results also suggest that the ‘yes’ responses to the New stimuli cannot be modelled simply as an additive effect of the two simpler generalisations. Therefore, the results can be reasonably interpreted as support for the principles that claim that learners keep track of all the possible generalisations; i.e. the results can be seen as support for the Proportional to Simplicity and Proportional to Specificity principles.
However, it is possible that learners keep track of segment-sequence generalisations along with featural generalisations; i.e. segments, like features, are representational primitives. Note that such a view is independently needed to account for phonological patterns such as segment metathesis, segment epenthesis and segment deletion (see Albright Reference Albright2009 and Kazanina et al. Reference Kazanina, Bowers and Idsardi2018 for a similar claim that segment-sized representational primitives are needed). Furthermore, if consonant-sequence generalisations are considered to be as simple as featural generalisations by learners (provided they involve the same number of primitives), then the Multiple Simplest Generalisations principle would say that learners should be able to keep track of consonantal sequences separately from their featural content. In such a case, [p…t] would be simpler than a conjoined featural generalisation [α voice, β cont], because ‘simplicity’, as used in this paper, refers to the intensional description, and is established by counting the number of representations (features, segments, etc.) in the generalisation. As a consequence, since the responses to the New stimuli would be an additive effect of the voicing harmony, continuancy harmony and consonant-sequence generalisations learned during training, even the Multiple Simplest Generalisations view would say that the responses to the New stimuli would be more than an additive effect of just the responses to the OnlyVoicing and OnlyContinuancy stimuli. Given this potential confound from the possibility that segments themselves can independently be representational primitives, the evidence that the more complex featural generalisation is learned is not clear from Experiment 1.
Given that there is no clear evidence that the learners acquired the complex (conjoined) constraint, we cannot directly adjudicate between the Proportional to Specificity and Proportional to Simplicity principles. Assessing these two principles would be more appropriate in the case of Experiments 2 and 3, where the segmental generalisation confound is not present. However, foreshadowing the results, there is no evidence in these experiments that participants learned a more complex featural generalisation (i.e. [α voice, β cont]). Thus, adjudicating between the Proportional to Specificity and Proportional to Simplicity becomes unnecessary, as both principles predict that participants should learn the more complex generalisation, contrary to what we will find in our subsequent results.
The main findings in Experiment 1 are that speakers are able to keep track of the simple featural generalisations ([α voice] and [β cont]), as evidenced by the fact that they accept OnlyVoicing and OnlyContinuancy stimuli during the test phase. There is no clear evidence for whether they are learning the more complex featural generalisation ([α voice, β cont]), because the interaction result observed with New stimuli could also be explained if speakers use segments as representational primitives in forming generalisations. In Experiments 2 and 3 we focus specifically on avoiding this confound, to see if there is any evidence of participants learning complex featural generalisations, and we show that the interactive effect found in Experiment 1 for the New stimuli disappears when the possibility of using a segmental generalisation is removed. This suggests that learners are not acquiring the more complex featural generalisation when the simpler featural generalisations are present.
3 Experiment 2
In Experiment 1, learners’ responses to the New stimuli appeared to be more than an additive effect of their responses to the OnlyVoicing and OnlyContinuancy stimuli. However, the New stimuli contained consonant sequences that may have been heard during training, so the superadditivity could simply be a result of the learners keeping track of consonant-sequence generalisations alongside simple featural generalisations. To control for this possibility, in Experiment 2 we withheld certain pairs of consonants during training, and created New stimuli during testing using those withheld consonant sequences (as described below in §3.1.2). As a consequence, the responses to New stimuli could no longer be influenced by any consonant-sequence generalisations. Therefore, if the responses to the New stimuli are still superadditive over the responses to OnlyVoicing and OnlyContinuancy, this constitutes evidence that, when faced with ambiguous data, learners are able to keep track of not only the simpler featural generalisations [α voice] and [β cont], but also the more complex featural generalisation [α voice, β cont].
3.1 Methods
3.1.1 Participants
78 English-speaking undergraduates at Michigan State University participated in this experiment for extra credit. We decided that many more participants were needed in Experiment 2, to ensure that any lack of a superadditive effect observed was not due to a lack of statistical power, as discussed further in §3.3. A minimum of 50 participants was fixed in advance (this was not based on data peeking). However, since we couldn't precisely control the number of participants who signed up for extra credit, we ended up with 78.
Of these 78 participants, 15 were excluded due to non-learning (i.e. they always responded ‘yes’ to the Disharmony and Old test items). Only the data of 63 participants is presented and analysed in what follows (46 female, 17 male; mean age = 20.0, SD = 3.0).
3.1.2 Materials
The design of Experiment 2 was nearly identical to that of Experiment 1. The vowels and consonants were the same, and the experiment also took about 10–15 minutes.
Training. The only difference between Experiment 1 and Experiment 2 in the training phase was that we withheld certain consonant sequences in the training phase of Experiment 2. As mentioned above, this was to address a possible confound in Experiment 1, where participants may have been keeping track of consonant sequences. The consonant pairs we withheld were randomised on a participant-by-participant basis. For example, one participant would never receive [tVpV] or [pVtV] in their training input, while another participant would never receive [fVsV] or [sVfV]. These participants would never hear these consonant pairs, but would nonetheless still hear these consonants in other contexts in their training. For example, while the first participant would never hear words of the form [tVpV], this participant would hear words of the form [tVtV] and [pVpV]. We allowed for the possibility of the learners hearing identical consonant sequences consisting of each of the consonants in the withheld consonant sequences, to make sure that learners did not choose a ‘no’ response to the withheld consonant sequences in testing purely because the consonants themselves were novel to them.
Other than this constraint on the training stimuli, the training procedure for Experiment 2, including the presentation of the stimuli, was exactly the same as in Experiment 1.
Testing. As with the training, the testing phase in Experiment 2 was nearly identical to the testing phase in Experiment 1. There were the same five different types of testing stimuli, consisting of twelve items, each for a total of 60 test items. The only difference was that the New stimuli during the test phase of Experiment 2 consisted of words that used the consonant pairs withheld during training.
In other words, the New stimuli in Experiment 1 were novel words, but contained consonant sequences that a participant might have previously heard. For example, if a New test stimulus in Experiment 1 was [fasi], the participant would never have heard [fasi] in training, but might have heard [fisu]. This was no longer the case in Experiment 2. In Experiment 2, the New test stimuli were novel words that had novel consonant pairings (because the consonant pairings were withheld during training, as discussed immediately above).
3.2 Predictions
Since Experiment 2 controls for the possibility of participants using segmental generalisation for the test stimuli, the predictions of all the principles presented earlier are the same as discussed in §2.2.
3.3 Results
Visual inspection of the mean proportion of ‘yes’ responses in Fig. 3 suggests that, as in Experiment 1, all four types of test stimuli (OnlyVoicing, OnlyContinuancy, New and Old) are more acceptable to participants than Disharmony. Two further observations can be made. First, the proportion of ‘yes’ responses for New stimuli is much lower than in Experiment 1. Second, unlike in Experiment 1, the ‘yes’ responses for the New stimuli appear to be no more than an additive effect of the responses to the OnlyVoicing and OnlyContinuancy stimuli, over and above the Disharmony stimuli.
Proportion of ‘yes’ responses to the test stimuli in Experiment 2.
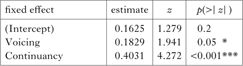
As in Experiment 1, to find out if the responses to the New stimuli were more than an additive effect of the OnlyVoicing and OnlyContinuancy responses (i.e. a superadditive effect), we attempted to fit a mixed-effects logistic regression model using the same coding as before. The random-effects structure, as in Experiment 1, included a varying intercept for subjects and items. The best model was one with two simple main effects in Table IV. The results of the modelling suggest that the responses to the New stimuli can in fact be modelled as simply an additive effect of the responses to the OnlyVoicing and OnlyContinuancy stimuli. This is consistent with what can be observed in Fig. 3. Given that the best model was one with two simple main effects, there appears to be no evidence of a superadditive effect for the New stimuli.Footnote 10
Best-fitting logistic mixed-effects model for Experiment 2.
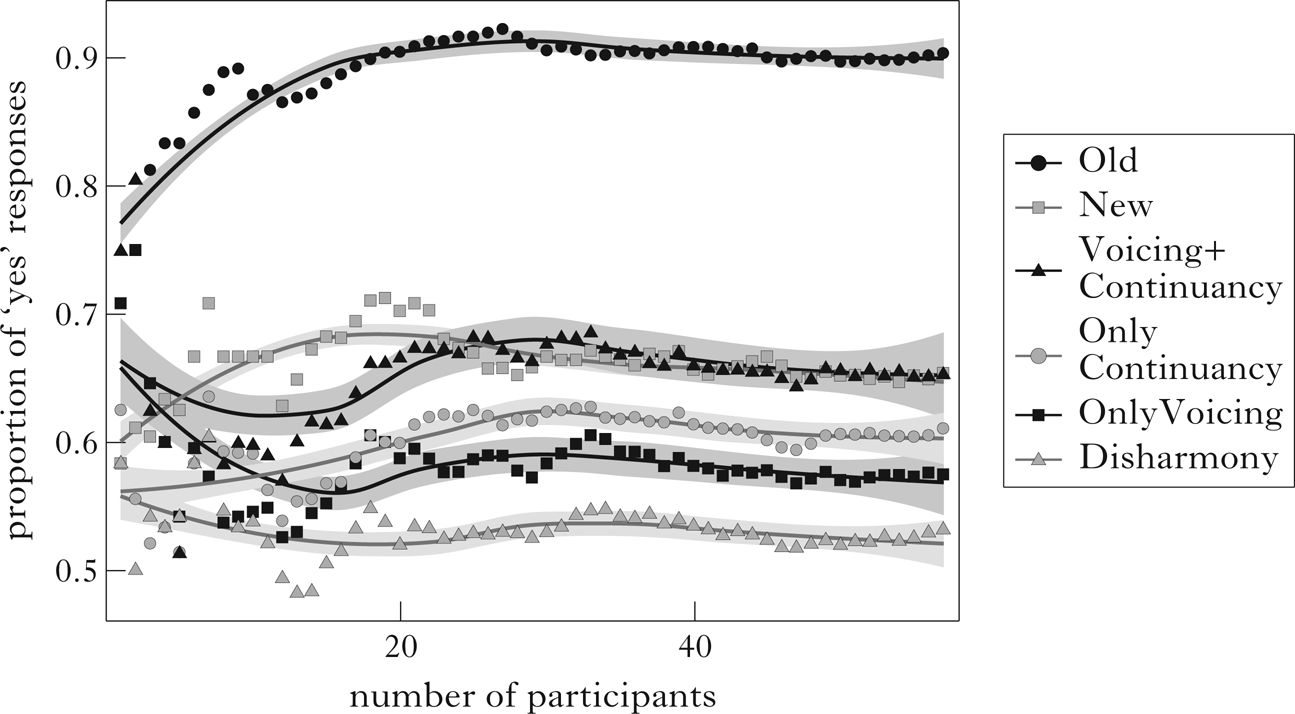
In order to better understand whether the lack of an interaction effect in Fig. 3 and Table IV is due either to the atypical responses of just a few participants or perhaps to a lack of sufficient statistical power in our experiment, we further plotted the cumulative proportions of ‘yes’ responses to each type of test stimulus with increasing number of participants (Fig. 4). The plot suggests that the relative differences in the cumulative effect sizes stabilise after about 25–30 participants, thereby suggesting that the non-interactivity is not due to a lack of power in Experiment 2. The plot also includes the putative additive effect of OnlyVoicing and OnlyContinuancy = (Voicing+Continuancy = OnlyVoicing + (OnlyContinuancy ― Disharmony)). As can be observed, the Voicing+Continuancy line almost perfectly coincides with the New responses after about 25–30 participants, thereby providing further evidence that the responses to New stimuli are indeed no more than an additive effect of the responses to the OnlyVoicing and OnlyContinuancy stimuli.
Cumulative proportions of ‘yes’ responses to test stimuli with increasing number of participants in Experiment 2 (ribbons represent 95% confidence intervals).
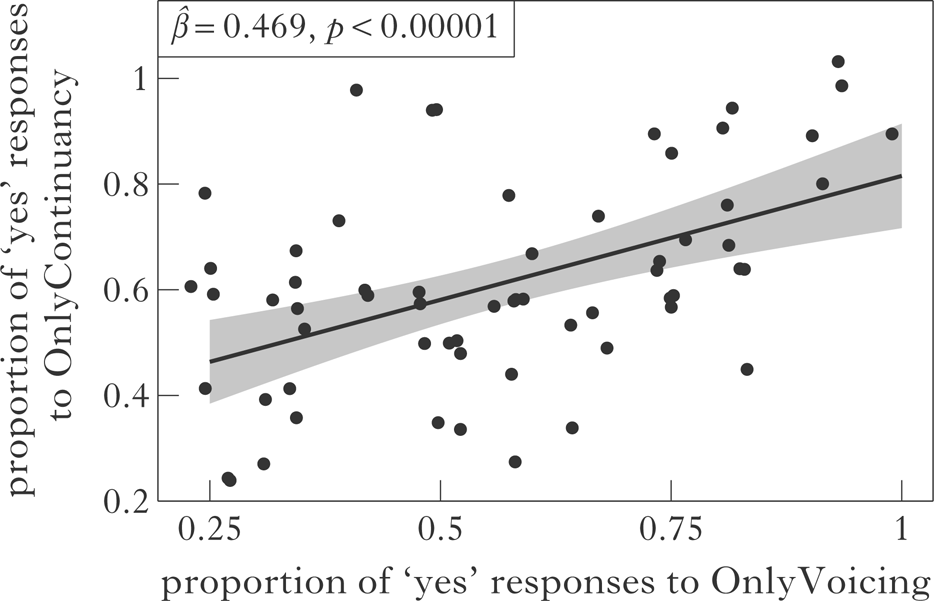
Finally, we also took a closer look at the data to see if participants were indeed learning both simple generalisations ([α voice] and [β cont]). It is possible to read the data presented so far for Experiments 1 and 2 as consistent with some participants learning voicing harmony, and others learning continuancy harmony. That is, since we presented only the overall mean proportion of responses, it is not clear if each participant was learning both simple generalisations. Therefore, to confirm that the participants were really learning both simple generalisations, we looked at the proportion of ‘yes’ responses both to OnlyContinuancy stimuli and to OnlyVoicing stimuli. Note that we could not make a similar comparison in Experiment 1, as 23 data points (one corresponding to each participant) are usually seen as insufficient to fit a simple linear regression model (Field Reference Field2013).Footnote 11 If each participant was really learning just one simple generalisation (at the cost of the other), then there should be a trade-off in their responses to the OnlyVoicing and OnlyContinuancy stimuli (i.e. there should be a negative correlation between the two responses). On the other hand, if each learner is acquiring both generalisations, there should be a positive correlation between the responses to the OnlyVoicing and OnlyContinuancy stimuli. In Fig. 5, we indeed see a positive correlation (β̂ = 0.469, p < 0.00001). This suggests that if a learner thought that the OnlyVoicing stimuli were more like the training data, they were also likely to think the same about the OnlyContinuancy stimuli.
Correlation between increase in ‘yes’ responses in Experiment 2 to OnlyVoicing compared to those of OnlyContinuancy (jitter has been added to the plot to reveal overlapping points).
3.3.1 Is there any evidence that the complex generalisation was learned?
The logistic regression models that we have presented cannot directly test whether a model without an interaction effect is supported by the data.Footnote 12 The issue is the following: it is possible for the learners to acquire a more complex generalisation along with the simpler generalisations, and for the interaction term in the logistic regression to still be non-significant. The fundamental problem is the indirect relationship between interaction terms in logistic regression and superadditive raw probability.
Since the original logistic regression analyses did not quite address the issue we are interested in probing, we ran a Monte Carlo simulation. In order to do Monte Carlo simulations, we have to be explicit about the underlying probability models, and about how learners would employ the multiple generalisations that they have learned. There are at least two ways, given in (3), in which one could flesh out the underlying probability models.
(3)

In our opinion, both of these are reasonable probability models, and it is not possible to decide a priori which is the more appropriate model. For this reason, we present the results of the Monte Carlo simulations with each underlying probability model.
The steps we used for the Monte Carlo simulation are given in (4).
(4)

In Table V we present the results based on two sets of 1000 simulations of the null models for Experiment 2 (simulations were repeated to ensure reliability). We present the proportion of interaction coefficients for data simulated from the null model that were further away from the mean of the interaction coefficients than the actual interaction coefficient observed in the experiments. This is essentially a p-value with the simulations giving us the sampling distribution of the interaction coefficients; a higher proportion means the interaction is closer to the mean of the interaction coefficients under the null model. Effectively, we ran a two-tailed test. We believe this is appropriate, as the interaction coefficient could have been either more than or less than the mean of the interaction coefficients for the simulated data from the null model.
Proportion of interaction coefficients for data simulated from the null models that were further away from the mean of the interaction coefficients than the actual interaction observed in Experiment 2, based on 1000 replications.

As can be seen from the results, there is simply no evidence of a more complex generalisation being learned. The model with only the simple generalisations captures the data almost perfectly; this is so because the interaction effect for the actual data is very close to the mean of the interaction coefficients for the simulated data from the null models.
3.4 Discussion
In Experiment 1, there was a possible confound that learners were also keeping track of consonant-sequence generalisations, which might have affected their responses to the New stimuli. If segments themselves are representational primitives, then the superadditive effect observed for the New stimuli in Experiment 1 could have been accounted for by multiple principles. In Experiment 2, once the segment-sequence confound was removed from the New test stimuli by withholding the relevant consonant sequences during training, the proportion of ‘yes’ responses to the New stimuli was no more than an additive effect of the proportion of ‘yes’ responses to the OnlyVoicing and OnlyContinuancy stimuli (see Fig. 3 and Table IV); that is, there was no superadditive effect. This suggests that learners do not keep track of more complex featural generalisations when simpler generalisations are available. Furthermore, a closer look at the cumulative proportion of ‘yes’ responses for each type of test stimulus (see Fig. 4) revealed that the lack of a superadditive effect for the New stimuli could not be due to insufficient statistical power, i.e. to an insufficient number of participants in our experiment. Finally, the results also clearly establish that learners were indeed acquiring both simple generalisations, since the higher the proportion of ‘yes’ responses to OnlyVoicing over and above Disharmony, the higher the proportion of ‘yes’ responses to OnlyContinuancy over and above Disharmony (Fig. 5).
There are three aspects of the data that deserve further consideration. First, the proportion of ‘yes’ responses to OnlyVoicing over and above Disharmony, while consistent in direction with the results in Experiment 1, was barely statistically significant. Second, the responses to the New stimuli in Experiments 1 and 2, while visually different, were not directly comparable, due to huge imbalances in the number of participants, and differences in the types of training and test stimuli. Finally, given that there can be subtle effects of the training data on potential generalisations, as discussed in Gerken & Knight (Reference Gerken and Knight2015), it is important to establish that the results are not due to accidental patterns in the (randomised) training stimuli. To address these concerns, we ran Experiment 3, which is in part a replication of Experiment 2.
4 Experiment 3
4.1 Methods
4.1.1 Participants
51 English-speaking undergraduates at Michigan State University participated in this experiment for extra credit (39 female, 12 male; mean age = 20.1; SD = 3.6). None of the participants were excluded due to non-learning.Footnote 14
4.1.2 Materials
The design of the Experiment 3 was nearly identical to those of Experiments 1 and 2. The vowels and consonants were the same, and the experiment again took about 10–15 minutes.
Training. The training phase for Experiment 3 was identical to that of Experiment 2. As in Experiment 2, we withheld certain consonant sequences in the training phase of Experiment 3. The training stimuli were presented in exactly the same manner as in Experiments 1 and 2.
Testing. The testing phase in Experiment 3 was nearly identical to the testing phase in Experiment 2. However, there were six different types of testing stimuli (instead of five), consisting of ten items each, giving a total of 60 test items.
As in Experiments 1 and 2, the test items consisted of Disharmony, OnlyVoicing, OnlyContinuancy and Old stimuli. Along with those four types, there were two other types of New stimuli, corresponding to the New stimuli of Experiments 1 and 2 respectively. Those new stimuli that consist of consonant sequences observed during training, as in Experiment 1, are labelled NewWord stimuli. To reiterate, these are novel stimuli because the vowels are different. For example, a participant might have heard [fusi] during training but not [fisa]; [fisa] could have therefore been a NewWord stimulus for this participant in the test phase. So while the consonant sequence is not new, the word itself is new to the participant. Furthermore, we again withheld random consonant sequences from participants on an individual basis in the training phase, just as in Experiment 2. The withheld consonant sequences were used for what we call the NewConsonant testing stimuli. For example, if a participant had never heard [bVdV] and [dVbV] during training, then any words of this form could have made up the NewConsonant stimuli for this participant in the testing phase.
4.2 Predictions
Since the experiment was carried out (a) to confirm the findings of the previous two experiments, (b) to allow for a more direct comparison of the ‘yes’ responses to the two types of New stimuli in Experiments 1 and 2 and (c) to ensure that the effect observed for OnlyVoicing stimuli in Experiment 2 was replicable, the predictions of all the principles presented earlier are effectively the same as discussed in §2.2. We furthermore predict that NewWord stimuli will be rated more highly than NewConsonant stimuli, because NewWord stimuli also conform to any segment-based generalisations a learner might have formed during training (in addition to the feature-based generalisations), whereas NewConsonant stimuli do not.
4.3 Results
Visual inspection of the mean ‘yes’ responses in Fig. 6 suggests that the five types of test stimuli of main interest (OnlyVoicing, OnlyContinuancy, NewConsonant, NewWord and Old) are more acceptable to participants than Disharmony, as shown in Fig. 6.
Proportion of ‘yes’ responses to the test stimuli in Experiment 3.
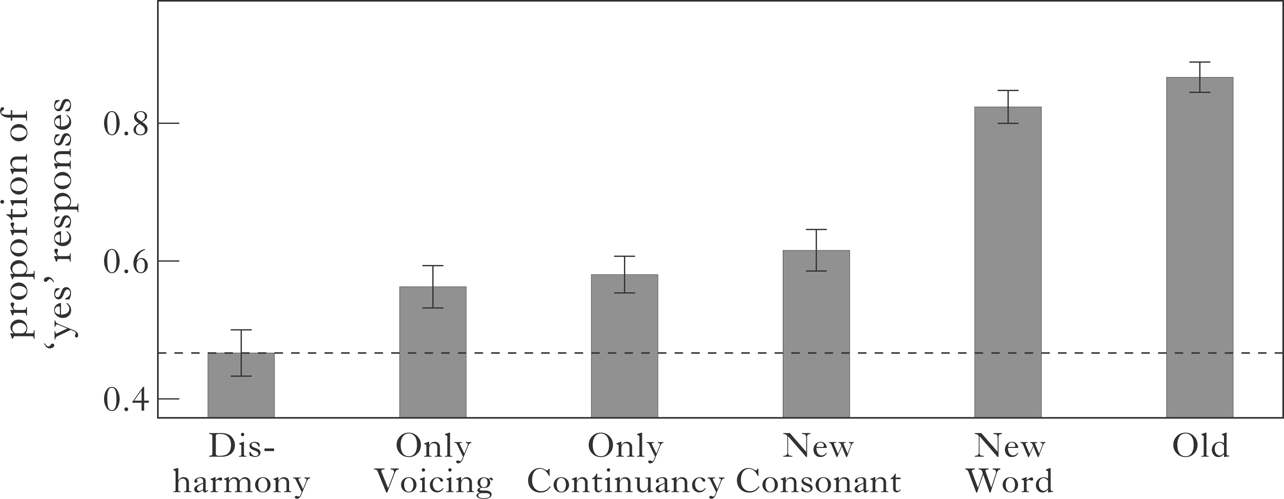
Three further observations can be made. First, the OnlyVoicing stimuli are clearly more acceptable than the Disharmony stimuli, thereby suggesting that the marginally significant results in Experiment 2 were not due to chance variation. Second, as in Experiment 1, the ‘yes’ responses for the NewWord stimuli appear to be the result of a superadditive effect of the ‘yes’ responses to the OnlyVoicing and OnlyContinuancy stimuli, over and above the Disharmony stimuli. Finally, as in Experiment 2, the ‘yes’ responses for the NewConsonant stimuli appear to be just an additive effect (if anything, a subadditive effect) of the ‘yes’ responses to the OnlyVoicing and OnlyContinuancy stimuli, over and above the Disharmony stimuli.
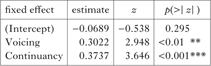
As in Experiments 1 and 2, to find out if the responses to the NewConsonant stimuli were more than an additive effect of the OnlyVoicing and OnlyContinuancy responses (over and above the Disharmony stimuli), we coded the OnlyVoicing stimuli as Voicing, the OnlyContinuancy stimuli as Continuancy, the NewConsonant stimuli as both Voicing and Continuancy, and the Disharmony stimuli as neither Voicing nor Continuancy. We again attempted to fit a mixed-effects logistic regression model (following the procedure discussed in §2.3). The random-effects structure included a varying intercept for subjects and items, as in Experiments 1 and 2. As in the case of Experiment 2, the best model was one with two simple main effects, as shown in Table VI.Footnote 15 The results of Experiment 3 therefore replicate those of Experiment 2.
Best-fitting logistic mixed-effects model for Experiment 3.
Next, to establish whether the proportion of ‘yes’ responses to NewWord stimuli was higher than that for NewConsonant stimuli, we fitted a logistic mixed-effects model with the data subsetted to only those two types of test stimuli, and with the responses to NewConsonant stimuli as the baseline. Therefore, the independent variable of Type has only two levels (NewConsonant, NewWord). The random-effects structure was one with a varying intercept for both subjects and items. The model with the independent factor for Type in Table VII was the best model for the above random-effects structure. The model clearly supports the earlier visual inspection in suggesting that there was indeed a higher proportion of ‘yes’ responses to NewWord stimuli than to NewConsonant stimuli.
Logistic mixed-effects model comparing NewConsonant and NewWord stimuli.

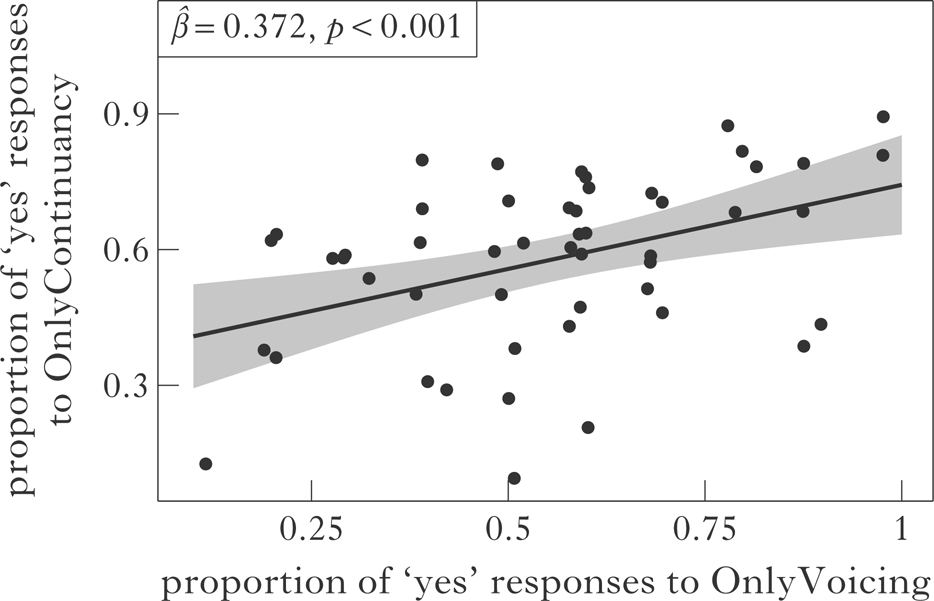
Finally, as with Experiment 2, we also took a closer look at the data to see if participants were indeed learning both simple generalisations. As can be seen in Fig. 7, there is a positive correlation between the preference for OnlyContinuancy and the preference for OnlyVoicing (β̂ = 0.372, p = 0.001), replicating the results of Experiment 2. Therefore, there is again no trade-off between learning the two generalisations for the learners. This suggests, in line with Experiment 2, that learners who acquired voicing harmony also learned continuancy harmony, clearly showing that participants are able to learn both simple generalisations simultaneously.
Correlation between increase in ‘yes’ responses in Experiment 3 to OnlyVoicing compared to those of OnlyContinuancy (jitter has been added to the plot to reveal overlapping points).
4.3.1 Is there any evidence that the complex generalisation was learned?
As with Experiment 2, to probe whether the more complex generalisation was also learned along with the simple generalisations, we ran a Monte Carlo simulation. Here, too, we ran the simulation with both the probability models described in §3.3.1.
Below, we present the results based on two sets of 1000 simulations of the null models for Experiment 3. Table VIII shows the results of the simulations. The second set of simulations for the second probability model (which assumes that averaging over the probabilities of all generalisations is appropriate) is based on 10,000 replications (this value is italicised). This is because the observed proportion in the first 1000 replications was very close to the 0.05 threshold, so we thought it prudent to have a larger set of interaction coefficients for comparison.
Proportion of interaction coefficients for data simulated from the null models that were further away from the mean of the interaction coefficients than the actual interaction observed in Experiment 3. Based on 1000 replications, except for the second set of simulations for the second model, which was based on 10,000 replications (see note 16).

As with Experiment 2, there is no clear evidence of an interaction effect beyond the simple model. There is at best a marginally significant effect under the second probability model (which assumes that the learner uses only one generalisation at any one time during evaluation). But, if we consider the full range of results, it is clear from Experiments 2 and 3 that they support the null models (i.e. the models with only the simple generalisations).Footnote 17
4.4 Discussion
In Experiment 3, we were able to replicate all the important aspects of the results in Experiment 2. First, there is a decrease in the preference for NewConsonant stimuli compared to NewWord stimuli, paralleling the decrease in the preference for the New stimuli in Experiment 2 compared to those in Experiment 1. This suggests that there are other generalisations (possibly consonant-sequence generalisations) that allowed the participants to rate the NewWord stimuli in Experiment 3 and the New stimuli in Experiment 1 so highly.
Second, the preference for OnlyVoicing stimuli over Disharmony stimuli was barely statistically significant in Experiment 2, so it was important to see that the effect was replicated in Experiment 3.
Finally, and most crucially, as in Experiment 2, the preference for the NewConsonant stimuli was no more than an additive effect of the preference for OnlyVoicing and OnlyContinuancy stimuli. Therefore, this reinforces the finding that the participants in our experiments were not learning the more complex generalisation when simpler generalisations were available.
5 General discussion and conclusion
We have presented the results of three artificial language learning experiments that probed the question of what learners do when faced with data that is consistent with multiple competing phonotactic generalisations. As mentioned earlier, it is more insightful to break down the question into the two subquestions in (1) in §1. The results of Experiments 1, 2 and 3 suggest that learners are indeed able to keep track of multiple generalisations. However, this does not mean they keep track of all available generalisations. While the results of Experiment 1 appeared to suggest that learners could be acquiring more complex generalisations, when the confounding possibility of using consonant-sequence patterns was removed from the relevant test items (New stimuli in Experiment 2, and NewConsonant stimuli in Experiment 3), participants showed no evidence of learning the more complex featural generalisation; instead, they were only keeping track of the simplest generalisations, where simplest is defined as the use of the fewest representational primitives needed to state the generalisation.
As briefly mentioned in §1, in the interest of expository convenience, we have conflated the terms ‘complex’ and ‘specific’, where the former refers to the intensional description, while the latter refers to the extension set. Crucially, the participants in our experiments were able to learn both simple featural generalisations and segment-based generalisations, but did not seem to be able to learn the complex featural generalisations. The fact that participants learned multiple simple featural generalisations, but were unable to learn the complex featural generalisation, suggests that simplicity is an important notion in understanding learnable and unlearnable patterns. In contrast, the fact that participants were able to learn both the most specific segmental generalisations and the least specific single-feature generalisations, but unable to learn the complex feature generalisation (which is intermediate on the specificity scale), suggests that specificity is not a useful notion in understanding learnable and unlearnable patterns.Footnote 18 To reiterate, our experiments suggest that the notion of simplicity is of relevance to the learner, but not the notion of specificity.
It is important to note that the results cannot be accounted for by just saying simpler generalisations are easier to learn (Pycha et al. Reference Pycha, Nowak, Shin and Shosted2003, Saffran & Thiessen Reference Saffran and Thiessen2003, Cristià & Seidl Reference Cristià and Seidl2008, Kuo Reference Kuo2009). Such a statement is insufficient to account for the results, as ample training data was provided to participants to learn the more complex generalisation (compared to previous research that showed that complex generalisations appear to be learned when there is no competition with simpler generalisations).Footnote 19 Therefore, even on this view, the complex generalisation could still have been learned, albeit with less weight attached to it. If so, there should have been a superadditive effect observed in participants’ preference for the relevant New (or NewConsonant) stimuli in Experiments 2 and 3. Furthermore, it has been suggested that the learning bias for simpler generalisations stems from what amounts to a sampling bias (Pierrehumbert Reference Pierrehumbert2001, Reference Pierrehumbert, Bod, Hay and Jannedy2003). Pierrehumbert suggests that one reason that simpler generalisations are learned better than more complex ones is possibly that more complex generalisations require a more specific set of data in order to be confirmed, and random sampling might not allow the learner to experience that particular set of data. However, in our experiments, the amount of training data that supported the more complex generalisation was equal to the amount of training data that supported the simpler generalisations; therefore, it is clear that the observed bias cannot be reduced to a sampling bias in the input data.
There are four other issues that we wish to touch upon. First, how do we square our results with those of Gerken (Reference Gerken2006) and Linzen & Gallagher (Reference Linzen and Gallagher2014, Reference Linzen and Gallagher2017), who argue that their results suggest that learners might be acquiring more complex (or specific) generalisations? As a reviewer points out, it is reasonable to reinterpret Gerken's (Reference Gerken2006) results as showing that learners need stimulus variation to infer a more abstract generalisation. For, if the learner were simply maintaining the subset grammar, they could still have memorised all the possible final syllables. Furthermore, in each of the above papers the comparisons were over generalisations with different representational primitives. For example, Linzen & Gallagher's (Reference Linzen and Gallagher2014, Reference Linzen and Gallagher2017) specific generalisation involved segments, while the simpler one involved features. However, the specific one is only more complex if we assume that segments are not themselves representational primitives, but nothing more than a collection of features. If this assumption is wrong, then equating specificity with the notion of complexity is not relevant to their experiments. As our experiments show, when the possibility of segment-sequence generalisations was removed (Experiments 2 and 3), there was no evidence for the claim that learners were keeping track of more complex (featural) generalisations. Similarly, Gerken (Reference Gerken2006) compared a simple syllabic generalisation (AAB) with one that involved both syllables and segments (AAdi, i.e. two identical syllables followed by di). Given that the putative complex generalisation involved both syllables and segments, it is possible that the more complex generalisation is actually decomposable into simpler generalisations involving syllables and segments separately. What we wish to primarily highlight from this discussion is that in order to test the learnability of simple vs. complex generalisations, the class of representational primitives used in the two types of generalisations needs to be kept constant, as in our Experiments 2 and 3. Otherwise, it is difficult to draw firm conclusions from the results, whatever they may be.
Second, how do our results relate to those of Finley (Reference Finley2011, Reference Finley2012), Lai (Reference Lai2015) and McMullin (Reference McMullin2016), which suggest that learners appear to be unwilling to accept a seemingly more general non-local pattern across both vowels and consonants (‘second-order non-local’) when trained on a transvocalic (‘first-order local’) pattern, but are willing to accept a transvocalic pattern when trained on a more general non-local pattern?Footnote 20 In our opinion, these results are actually unclear with respect to the issue of simplicity. The crux of the argument in such experiments is contingent on a comparison with chance (0.5), with the inference that a generalisation has not been used in novel contexts if the acceptability proportion is around 0.5; however, it is not clear that a proportion of 0.5 is the appropriate representation of chance (as the stimuli display other patterns that are consistent with the training data); instead, the results should, we believe, be seen in relative terms. That is, when trained on transvocalic patterns, participants accept transvocalic patterns more than the more general pattern, but when trained on the more general (transsegmental) pattern, there is no such clear difference. If the results are seen in this light, we can reinterpret the results. Following Heinz (Reference Heinz2010), we assume that a learner is equipped with the ability to acquire both n-gram generalisations (up to a suitable n; see Cowan Reference Cowan2010 for an argument that n ≈ 4 for short-term memory generally) and separate precedence and piecewise generalisations which make no reference to locality. If so, when presented with training stimuli with transvocalic harmony, learners can represent them with either an n-gram generalisation or a precedence generalisation. As a consequence, during testing, the acceptability of the transvocalic stimuli can be analysed as an additive effect of both types of generalisation, while the acceptability of the more general (transsegmental) generalisations is only due to the precedence grammar. In effect, we expect the latter to be more acceptable than the former. In contrast, when presented with the transsegmental pattern during training, learners can only acquire the precedence generalisation; as a consequence, during testing they show no difference between the transvocalic and transsegmental patterns.
Third, the fact that learners keep track of only the simplest generalisations consistent with the data in the face of ambiguity suggests that there is a certain structure to the search space of possible generalisations, as touched upon by Chomsky & Halle (Reference Chomsky and Halle1968) and Hayes & Wilson (Reference Hayes and Wilson2008); this structure, if present, dramatically decreases the computational challenge faced by the learner. Such a view leads to a slight reinterpretation of previous artificial language learning results that suggest that simpler generalisations are easier to learn than more complex generalisations (Pycha et al. Reference Pycha, Nowak, Shin and Shosted2003, Saffran & Thiessen Reference Saffran and Thiessen2003, Cristià & Seidl Reference Cristià and Seidl2008, Kuo Reference Kuo2009). More specifically, the results presented in this article suggest that the reason that simpler generalisations appear to be learned better in previous artificial language learning experiments is that learners attempt to acquire simpler generalisations first, and only in the absence of viable simpler generalisations do they attempt to learn more complex ones.
Fourth, a more speculative possibility, one that takes a substantial inductive leap from our results, is that learners are only able to keep track of simple phonotactic generalisations, by which we mean generalisations that involve the precedence relationships between at most a single pair of features, segments, syllables, etc. Therefore, the issue of complex vs. simple learned generalisations itself would vanish, as the learner simply cannot keep track of complex generalisations (of the relevant type).Footnote 21 For example, learners might be able to keep track of precedence relationships such as feature1 … feature2 or segment1 … segment2, etc., but not precedence relationships involving more than that, such as feature1, feature3 … feature2, feature3 or segment1 … segment2 … segment3. Such a possibility would automatically explain why our experiments found no evidence for participants learning the complex generalisation. It would further suggest that the reason that previous experiments seemed to show learning of a complex generalisation was just because they did not – or could not, given their design – test whether their results were merely the additive result of multiple simple generalisations. As mentioned above, this possibility requires a big inductive leap from the results presented in this article, and should at this point be seen as a speculation that is, at best, worthy of future analytical and/or experimental consideration.
In conclusion, we would like to reiterate the primary findings in the article. In the face of data that is ambiguous between many phonotactic sequence generalisations, learners keep track of multiple generalisations, as long as they are the simplest possible generalisations.



