



1. Introduction
One of the most effective methods for identifying the turbulent coherent structures around submerged cylinders is the three-dimensional (3-D) quadrant analysis of the bursting process (Keshavarzi, Melville & Ball Reference Keshavarzi, Melville and Ball2014; Khan et al. Reference Khan, Sharma, Garg and Biswas2022a,Reference Khan, Sharma, Lama, Hasan, Garg, Busico and Alharbib; Ikani et al. Reference Ikani, Pu, Taha, Hanmaiahgarib and Penna2023). Assessing the coherent turbulent flow around the cylinders aids in understanding the bed scouring process. In accordance with the quadrant analysis and detection of the bursting events, ejection events suggest that low-speed fluid moves into the main flow from the boundary layer, bringing the turbulent shear layer to the water surface (Khan et al. Reference Khan, Sharma, Garg and Biswas2022a,Reference Khan, Sharma, Lama, Hasan, Garg, Busico and Alharbib). In contrast, sweep events involve the fast transfer of fluid from the main flow downward into the transition zone (Khan et al. Reference Khan, Sharma, Pu, Aamir and Pandey2021). As a result, sweeps cause the formation of several minor vortices in the turbulent shear layer near the bed. Notably, the turbulent coherent structures around completely submerged obstacles are significantly different from unsubmerged ones (Das & Mazumdar Reference Das and Mazumdar2015; Przyborowski & Łoboda Reference Przyborowski and Łoboda2021; Pu Reference Pu2021; Bauri & Sarkar Reference Bauri, Sarkar and Maity2022; Khan et al. Reference Khan, Sharma, Garg and Biswas2022a,Reference Khan, Sharma, Lama, Hasan, Garg, Busico and Alharbib; Ikani et al. Reference Ikani, Pu, Taha, Hanmaiahgarib and Penna2023).
The sediment particle transport caused by fully submerged structures is different from that created by partially submerged structures (Wallwork et al. Reference Wallwork, Pu, Kundu, Hanmaiahgari, Pandey, Satyanaga, Amir Khan and Wood2022). Despite various investigations into the flow field surrounding different shapes of unsubmerged structures, clear evidence of the behaviour of turbulent coherent structures around fully submerged cylindrical structures with different shapes and alignments remains limited. Local scour near submerged vertical cylinders, such as bridge piers, can cause significant damage, particularly during extreme events (Vijayasree et al. Reference Vijayasree, Eldho, Mazumder and Ahmad2019; Franzetti et al. Reference Franzetti, Radice, Rebai and Ballio2022). The majority of the preceding studies focused on estimating equilibrium conditions and variation in scour depth over time, without correlating turbulent coherent structures with transport processes. However, it is very important to know how coherent structures affect the scour mechanism surrounding objects (Diplas et al. Reference Diplas, Dancey, Celik, Valyrakis, Greer and Akar2008; Diplas & Dancey Reference Diplas and Dancey2013; Manes & Brocchini Reference Manes and Brocchini2015; Pu Reference Pu2021; Ikani et al. Reference Ikani, Pu, Taha, Hanmaiahgarib and Penna2023). To characterise the bed scour process surrounding submerged structures and understand the key mechanisms, an accurate determination of the coherent structures surrounding the submerged cylinders is required.
One of the most active research topics in sediment transport is the study of quadrant analysis of bursting events and their impact on sediment transport. One of the most active research topics in the field of sediment transport is the study of quadrant analysis of the bursting events and their impact on sediment processes (Devi et al. Reference Devi, Hanmaiahgari, Balachandar and Pu2021; Khan et al. Reference Khan, Sharma, Pu, Aamir and Pandey2021; Pu Reference Pu2021; Yücesan et al. Reference Yücesan, Wildt, Gmeiner, Schobesberger, Hauer, Sindelar, Habersack and Tritthart2021; Gautam et al. Reference Gautam, Eldho, Mazumder and Behera2022). The distinctive characteristic of bursting analysis is its focus on the role of turbulence in initiating sediment movement (Devi et al. Reference Devi, Hanmaiahgari, Balachandar and Pu2021; Khan et al. Reference Khan, Sharma, Garg and Biswas2022a,Reference Khan, Sharma, Lama, Hasan, Garg, Busico and Alharbib). Bauri & Sarkar (Reference Bauri and Sarkar2019) studied two-dimensional (2-D) bursting events over a plane bed in the vicinity of cylinders. Also, researchers inferred flow and sediment dynamics around rigid structures in open channel flows using 2-D quadrant analysis (Mattioli et al. Reference Mattioli, Alsina, Mancinelli, Miozzi and Brocchini2012; Miozzi et al. Reference Miozzi, Corvaro, Pereira and Brocchini2019), and showed that the sweep is the most important event for the transport of particles from the bed surface (Pu Reference Pu2021; Rinoshika et al. Reference Rinoshika, Rinoshika, Wang and Zheng2021).
The flow surrounding submerged cylinders is inherently 3-D, making 2-D bursting analysis insufficient for accurately determining the sediment transport processes (Ikani et al. Reference Ikani, Pu, Taha, Hanmaiahgarib and Penna2023; Vahdati et al. Reference Vahidati, Ahmadi, Abedini and Heidarpour2023). Here, it is pertinent to mention that the 3-D bursting occurrences within the scour hole surrounding the cylinders at various stages of growth were not thoroughly explored. Recent investigations have examined coherent structures, bursting processes and flow characteristics around objects placed in open channels (Devi et al. Reference Devi, Hanmaiahgari, Balachandar and Pu2021; Khan et al. Reference Khan, Sharma, Pu, Aamir and Pandey2021; Pu Reference Pu2021; Bauri Reference Bauri2022). However, these studies did not discuss how to quantify 3-D bursting events and coherent structures or their impact on bed sediment transport within scour holes at different development phases around fully submerged circular, square and aligned square cylindrical structures. The turbulent flow surrounding submerged vertical cylinders having different shapes and alignment angles was investigated. Using the 3-D bursting analysis, the sweep events were classified into external and internal zones based on the sign convention of the transverse velocity fluctuations. In this context, it is important to note that based on the sign of the transverse velocity changes, Keshavarzi et al. (Reference Keshavarzi, Melville and Ball2014) also divided the sweep events around a bridge pier into external and internal zones. Additionally, the research by Ikani et al. (Reference Ikani, Pu, Taha, Hanmaiahgarib and Penna2023) and Vahdati et al. (Reference Vahidati, Ahmadi, Abedini and Heidarpour2023) shows that, for a 3-D flow, 2-D analysis of bursting events might be inadequate to identify the transport process.
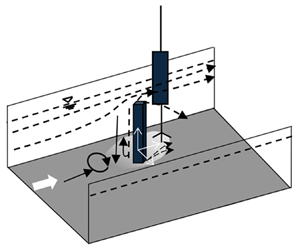
The vertical cylinders contract the flow, diverting it away from the central axis of the flume towards the sides. Consequently, the diverted flow to the flume sidewalls acts as an external ejection factor in the sediment transport process. Therefore, the secondary flow created by the transverse velocity should not be overlooked. The differences between internal and external sweep events were analysed using 3-D vortex rotations. The internal sweep vortex rotates clockwise, while the external sweep event rotates anticlockwise. These opposing vortices direct sediment particles in different directions. Unlike the 2-D quadrant analysis of the bursting process, which does not distinguish between clockwise and anticlockwise vortex motions, a 3-D study of bursting processes is better suited to detect turbulent flow features around the cylinders. This investigation examines the turbulent coherent structures of the eight bursting events surrounding submerged cylindrical objects in relation to sediment particle transport. The study aims to elucidate the impact of internal and external bursting events on sediment transport processes and their connection to bed scouring, investigating turbulent coherent structures within the scour hole at various stages of development.
A relationship between coherent turbulent flow and the processes of sediment transport is here proposed as coherent features such as necklace vortices at the cylinder base, significant movements behind the cylinders and vortices in the separated shear layers are all present in the 3-D flow around the submerged cylinders. Understanding these coherent structures and their interactions with bed materials is crucial for better modelling these phenomena. Moreover, when scour holes at different development stages form around vertical cylinders, the flow deviates significantly.
Building on the existing literature, this study aims to evaluate the following three key aspects: (i) the impact of turbulent coherent structures on the transport of sediments around fully submerged cylindrical structures; (ii) the influence of various parameters on the occurrence and distribution of these turbulent coherent structures over time; (iii) the effect of velocity on the dominant vortex shedding frequency, the transition probability of vortex detachment and the shear stress distribution around cylindrical structures.
2. Experimental data
2.1. Set-up
The experiments were conducted at the Hydraulics and Water Resources Engineering Laboratory, School of Infrastructure, Indian Institute of Technology (IIT), Bhubaneswar, Odisha, India, considering fully developed (equilibrium) and underdeveloped scoured bed conditions (Bauri Reference Bauri2022). The term ‘undeveloped scoured bed’ refers to a scoured bed that has begun to develop but has not yet fully developed, whereas ‘developed scoured bed’ refers to a scoured bed that has fully developed or has reached the maximum scour depth. The flume bed, characterized by a width of 0.8 m and length of 1.0 m, was filled with uniform sediment particles (d 50 = 1.6 mm) to a depth of 0.15 m. The sediment was uniformly spread surrounding the cylinder and levelled before the start of each experimental run. The levelling was checked using bubble gauges, point gauges (accuracy of ±0.1 mm) and flooding of the test section. The depth of the sediment bed was manually measured with a ruler from the bottom of the flume and kept uniform at 0.15 m (figure 1a). The trial experiments took into account a homogeneous sediment depth of 0.15 m around the cylinder (figure 1a). Several trial runs were carried out to derive the required sediment depth needed to avoid the washing out of the sediment surrounding the cylinders before they reach the equilibrium stage. For the preparation of different sediment samples, Indian Standard sieves were used (Dey et al. Reference Dey, Lodh and Sarkar2018a,Reference Dey, Swargiary, Sarkar, Fang and Gaudiob). The scour depth increased rapidly at the start of the experiment and steadily decreased as time went on. As a result, the measurement of scour depth was done more frequently at the beginning, ranging from 10 s to 0.5 h, whereas the interval was 0.5 h when the scour hole reached a pseudoequilibrium stage. Scour depth was measured for a period of 2 h and 12–16 h, in the case of underdeveloped and developed scoured bed conditions, respectively. For developed scoured bed conditions, experiments were continued until the scour depth increased by less than 1 mm over 2 h (Williams, Balachandar & Bolisetti Reference Williams, Balachandar and Bolisetti2019). The experiments were performed to measure the 3-D velocity around the cylindrical structures to determine the transverse velocity, 3-D bursting process and turbulent coherent structure within scour holes at various development stages. A schematic illustration of the experimental set-up on the equilibrium scoured bed is shown in figure 1(a,b) and the information about the various measurement sections for a square cylinder with α = 0°, α = 20° and circular cylinders are summarized in figure 1(c). The flow direction is also indicated in the figure with arrows. The sections 1–5 (such as sections 1 (A1 = 25 mm), 2 (A2 = 35 mm), 3 (A3 = 45 mm), 4 (A4 = 65 mm) and 5 (A5 = 85 mm)) for each line are assessed as indicated for line A: section 1 (A1) being the nearest and section 5 (A5) being the farthest. After sieve analysis, characteristic diameters like d 16, d 50 and d 84 (16 %, 50 % or median and 84 % finer particles, respectively) were obtained for the sediment samples. The geometric standard deviation σg = (d 84/d 16)0.5 of particle size distribution was 1.2, which is <1.4, therefore insignificant in terms of scour depth (Dey et al. Reference Dey, Lodh and Sarkar2018a,Reference Dey, Swargiary, Sarkar, Fang and Gaudiob). The specific gravity of sediment particles was 2.65. Various shapes (i.e. circular and square) of cylinders with sizes D 3.0–7.5 cm were installed in the middle of the flume. The cylinder sizes were selected equal to less than 0.1 times the flume width, such that there was no effect on the flume sidewall (Luo et al. Reference Luo, Si, Lu, Liang and Qi2022). In addition, the ratio of cylinder size to sediment particle size was less than 79, as a result of which the sediment particle size influences were not present (Izadinia, Heidarpour & Schleiss Reference Izadinia, Heidarpour and Schleiss2013; Luo et al. Reference Luo, Si, Lu, Liang and Qi2022). The literature evidence suggests that the scour intensification for skew angles is between 15° and 30° (Lança et al. Reference Lança, Fael, Maia, Pêgo and Cardoso2013; Dong et al. Reference Dong, Chen, Du, Fang and Jin2022). Therefore, the scour surrounding the cylinder was studied with a maximum angle of 20°.
(a) Experimental set-up of the flume installed at the Hydraulics and Water Resources Engineering Laboratory IIT Bhubaneswar, Odisha, India. (b) Scheme of the experimental set-up over an equilibrium scoured bed. Arrows indicate the flow direction. (c) Details of different sections of measurement for a circular cylinder.

The experimental flow and scour characteristics around submerged cylinders are shown in table 1. The time variation of scour depth around the submerged cylinders is compared with the field data of Lu et al. (Reference Lu, Hong, Su, Wang and Lai2008) an oblong-shaped cylinder in figure 2, and one can notice that the present experimental results fit rather well with the field data.
Experimental flow and scour characteristics around submerged cylinders.

Validation of experimental measurements with field measurements of scour depth (Lu et al. Reference Lu, Hong, Su, Wang and Lai2008). (Lu et al. (Reference Lu, Hong, Su, Wang and Lai2008) carried out field measurements on time-varying scour around bridge piers during floods. Cir/Sqr_0/Sqr_20 indicates circular, square and aligned square cylindrical structures, whereas 5 and 18.5 indicate the size of cylindrical structures and depth of water in cm, respectively.) In the figure,  $d_s^\ast= {d_s}/{d_{s\,max}}$,
 $d_s^\ast $ = non-dimensional scour depth, ds = time-varying scour depth, ds max = maximum scour depth. Similarly, T* = t/tmax, T* = non-dimensional time variation, t = time variation, tmax = maximum time to achieve the equilibrium scour depth.

2.2. Velocity measurement
A down-looking acoustic Doppler velocimeter (ADV) was used to measure the 3-D velocity around the cylinders in both developed and undeveloped bed conditions. After achieving scoured bed conditions, the water supply was stopped in the flume and water was drained out without disturbing the bed scour hole. To avoid the partial filling of the hole by sediments while draining out the water from the flume, the water was first drained out by opening a valve in the upstream end of the flume and adjusting the tailgate so that a minimum flow velocity occurred at the sediment recess. A sediment trap was constructed adjacent to the downstream wall of the sediment recess, having a clear length of 0.8 m to trap the scoured sediment. Finally, the water was drained out very slowly by opening the bottom at the downstream walls of the sediment recess, sediment trap and downstream gate. The stabilization of the loose scoured bed was required to ensure the flow field measurements without disturbing the scoured bed profiles. The sediment was sufficiently impregnated with the spraying of cement slurry, and it was left to set for 12 h, and further dried up to 24 h. Three small holes were also made at the bottom of the downstream wall of the sediment recess to drain out the water from the sediment bed. The scoured bed profile became `rock hard’, facilitating velocity measurements (William et al. Reference Williams, Balachandar and Bolisetti2019). After that, curing was also done for 24 h. Consequently, the ADV sensor was positioned 60 mm above the constructed bed, and the velocities were measured at a 5 mm level just above the bed's constant volume. Therefore, the velocity measurements using ADV were executed over the two stabilized beds. A down-looking ADV with an accuracy of ±0.1 mm at a frequency of 50 Hz was used to acquire 3-D velocity measurements under two different bed conditions. The main advantage of using an ADV is that it can acquire 3-D velocities with a relatively slight disturbance to the flow (Przyborowski et al. Reference Przyborowski, Nones, Mrokowska, Książek, Phan, Strużyński, Wyrębek, Mitka and Wojak2022). The water surface inside the flume was maintained using a downstream flume gate, which was measured using a pointer gauge with an accuracy of ±0.1 mm. The ADV device is an acoustic sensor in which the resulting acoustic signals are reflected towards the transducers by the flow's particles. Therefore, any external noises have an impact on the signal strength and velocity characteristics (Liu, Alobaidi & Valyrakis Reference Liu, Alobaidi and Valyrakis2022). During the experimental tests, a depth-averaged velocity or uniform velocity U (11.6 cm s−1) was imposed, where U is the depth-averaged velocity far upstream of the cylindrical structures. The depth-averaged velocity is taken as the resultant velocity. The resultant velocity U at various depths along the various directions around the cylindrical structures is calculated using the expression  $U = \sqrt {{u^2} + {v^2} + {w^2}} $, where u, v and w are the longitudinal, transverse and vertical direction velocities, respectively. To ensure uniformity, flow parameters well upstream of the submerged cylinder were measured and compared with the literature, such as the Nezu & Rodi (Reference Nezu and Rodi1986) profiles (figure 3).
Comparison of vertical distribution of  $\hat{u}$ velocity profile with Nezu & Rodi (Reference Nezu and Rodi1986) in the upstream of the submerged structure (umax = maximum velocity along the vertical, u* = shear velocity).

The patterns of velocity defect, turbulence intensities and Reynolds stress correspond pretty well to the distributions of Nezu & Rodi (Reference Nezu and Rodi1986). No flow blockage evolved due to the lateral flow restriction imposed in the present experiments, meaning that the scouring evolved similarly to clear-water regimes. Under two scoured bed conditions, the depth of water (h) varied from 18.5 to 97.5 cm, although the height of the cylinder (H) remained constant at 25 cm. Consequently, the flow depth to cylinder height ratio, hereafter called submergence depth (S), spanned between 1.85 and 9.75. Velocity data were accumulated for a few runs to check the submergence depths variation, but the trends remained the same while the magnitude of the scouring and velocity profiles varied, as indicated by Du et al. (Reference Du, Wu, Liang, Zhu and Wang2022) for scour at a submerged square pile in different flow depths under steady flow. Shear velocity (u *) and critical shear velocity (u *c) had a constant ratio of 0.75, where the critical shear velocity (u *c) was calculated as  ${u_{{\ast} c}} = \sqrt {\tau _0^2/\rho } $ (Beheshti & Ashtiani Reference Beheshti and Ataie-Ashtiani2008; Salim et al. Reference Salim, Pattiaratchi, Tinoco, Coco, Hetzel, Wijeratne and Jayaratne2017), where
 ${\tau _0}$ = critical shear velocity at the bed and
 $\rho $ = density of fluid, and the trend coincides well over the entire depth of flow. The undisturbed flow characteristics farther upstream of the submerged cylinder were also measured and compared with the logarithmic law (Bauri & Sarkar Reference Bauri and Sarkar2020). The Froude and Reynolds numbers of the flow were determined using the equations of (
 $U/\sqrt {gh} $) and (UR/υ), respectively, where υ and R are the kinematic viscosity and hydraulic radius, respectively, and g is the gravitational acceleration. For all the runs (underdeveloped and fully developed scour beds), the Froude number was 0.1, while the Reynolds number was 21 000 for all the experiment runs. The 3-D velocity data (u, v and w) under two-bed conditions were carried out surrounding the cylinders. The longitudinal, transverse and vertical velocity components are represented by the symbols u, v and w (x, y and z, respectively). The plots are made in non-dimensional
 $\hat{x}\hat{z}$,
 $\hat{x}\hat{y}$ and
 $\hat{r}\hat{z}$-planes in the upstream and downstream directions, where
 $\hat{x}$ is x/b,
 $\hat{y}$ is y/a,
 $\hat{r}$ is r/b, and where a is the transverse distance from the outer edge of the cylinder and b is the distance of the first section from the outer edge of the cylinder, r denotes radial directions and
 $\hat{r}$ denotes normalized radial directions. The velocity inaccuracies on the horizontal and vertical axes ranged from 0.22–0.38 cm s−1. Conversely, the transverse velocity error is noticeably smaller (0.1–0.18 cm s−1). With factory calibration, the accuracy of the probe geometry is required to be 1.0 % of the measured velocity (i.e. an accuracy of 1.0 cm s−1 on a measured velocity of 100 cm s−1) (Sontek 2001). This reflects the limits of the technique for calculating the angular alignment of the acoustic emitter and receivers. As a result, measuring velocity error is required to guarantee that the proper velocity is correctly acquired. The uncertainty and repeatability of the ADV data were also examined (Sadeque, Rajaratnam & Loewen Reference Sadeque, Rajaratnam and Loewen2009). The uncertainty quantification (i.e. 95 % confidence limit) was obtained from 15 sets of ADV data sampled at 25 Hz at three elevations (z = 0.5, 6 and 13 cm). The measurements were carried out on different days to determine the bias and random error of the experimental set-up and process. These experiments revealed that the relative confidence interval for the adjusted longitudinal variance is between 9.7 % and 2.9 %, whereas the ratio of the uncertainty varies between 10–15, 0.7–2.6 and 1.7–2.6 in the longitudinal, transverse and vertical velocity measurements in the present study. In this context, Fu et al. (Reference Fu, Guojian He, Huang, Dey and Fang2023) also reported the relative confidence interval for the adjusted longitudinal variance is between 15 % and 10 %; whereas Sadeque et al. (Reference Sadeque, Rajaratnam and Loewen2009) reported the standard deviations for longitudinal mean velocity were 1.2 to 1.8 %. In comparison with the free surface, which generated the high-velocity gradient in the vertical direction, the velocity near the bed was significantly lower. Given that the shallowest measured depth was 0.5 cm, the vertical intervals at which the data were taken were increased from 0.2 cm over the scoured bed to 5 cm under the two-scoured bed conditions, while it was fixed to 5 cm from the bed to the free surface. Before taking any velocity measurements, the flow was firstly allowed for 45 min under two-scoured bed conditions. Later, the ADV was fixed with a traverse mechanism, and it was managed using wheels and gears to take velocity readings for different depths of the water. The sampling duration was varied to capture statistically time-independent velocity data with location as per the level of turbulence, which was in the range of 4–6 min for different locations from the bed. Careful observation during the measurements showed that the time taken to collect the time-independent velocity measurements varies with the location, due to enhanced level of turbulence and reflections from the bed, as also reported in previous investigations (Ashtiani & Kordkandi Reference Ashtiani and Kordkandi2013). Based on turbulence intensity for different levels, the sampling durations at each location vary in the present studies. This assumption is in line with Beheshti & Ashtiani (Reference Beheshti and Ataie-Ashtiani2016), which considers 2–5-min intervals for the measurements with the same goal of collecting statistically time-independent velocity data. For every vertical section, approximately 30 points were taken for velocity measurement.
2.3. Three-dimensional bursting events
The usual progressive pattern of 3-D bursting occurrences is the shift from one state to another in time. The bursting phenomena are quasiperiodic systematized processes that occur in the quadrant zones at random times and locations (Khan et al. Reference Khan, Sharma, Garg and Biswas2022a,Reference Khan, Sharma, Lama, Hasan, Garg, Busico and Alharbib). Previous investigations (Rinoshika et al. Reference Rinoshika, Rinoshika, Wang and Zheng2021; Ikani et al. Reference Ikani, Pu, Taha, Hanmaiahgarib and Penna2023) focused on 2-D quadrant analysis for the various conditions in open channel flow. Given that the coherent flow structure in natural rivers and channels is 3-D, especially around in-channel structures, the transverse velocity cannot be ignored due to the production of significant secondary circulation (Khan et al. Reference Khan, Sharma, Garg and Biswas2022a,Reference Khan, Sharma, Lama, Hasan, Garg, Busico and Alharbib; Vahdati et al. Reference Vahidati, Ahmadi, Abedini and Heidarpour2023).
The quadrant analysis of the 3-D bursting occurrences is divided into eight orthogonal zones, which are classified on the sign convention of the 3-D velocity fluctuations including streamwise, vertical and transverse directions. The three velocity fluctuation components in longitudinal ( $u^{\prime}$), transverse (
 $v^{\prime}$) and vertical (
 $w^{\prime}$) directions are defined as follows:
 \begin{gather}u^{\prime} = {u_i} - \bar{u},\end{gather}
 \begin{gather}v^{\prime} = {v_i} - \bar{v},\end{gather}
 \begin{gather}w^{\prime} = {w_i} - \bar{w},\end{gather}
where the instantaneous velocities are  ${u_i}$,
 ${v_i}$ and
 ${w_i}$, and the time-averaged point velocities are
 $\bar{u}$,
 $\bar{v}$ and
 $\bar{w}\;$ in the longitudinal, transverse and vertical axes, respectively. Such the time-averaged velocities are calculated as
 \begin{gather}\bar{u} = \frac{1}{N}\sum\limits_{i = 1}^N {{u_i}} ,\end{gather}
 \begin{gather}\bar{v} = \frac{1}{N}\sum\limits_{i = 1}^N {{v_i}} ,\end{gather}
 \begin{gather}\bar{w} = \frac{1}{N}\sum\limits_{i = 1}^N {{w_i}} ,\end{gather}
where N is the number of velocity measurements at a specific point.
The quadrant analysis of the 3-D bursting process is categorized into internal (Zone A) and external (Zone B) events, following the conventions summarized in table 2. In addition, the classifications of the eight orthogonal events are also considered diagonally. Zone A represents the group of events where their deviations are in the direction of the internal or centreline direction, whereas Zone B represents the group of events where their deviation is in the direction of the sidewalls of the flume and away from the centreline. As a result, each zone of the bursting event has four different types of events, including four internal and four external events in Zone A and Zone B, respectively. Table 2 shows both internal and external bursting events, while the transverse direction velocity fluctuation is reflected on the right-hand side of the flume (figure 1a). As a result, for each given point in the flow, the eight distinct bursting occurrences are well-defined here. The eight bursting events have varied effects on the movement of sediment particles from the bed, particularly surrounding the cylinders, and these effects are linked to flow characteristics (Keshavarzi et al. Reference Keshavarzi, Melville and Ball2014; Vahdati et al. Reference Vahidati, Ahmadi, Abedini and Heidarpour2023). In addition, the different plan views of eight orthogonal zones of 3-D quadrant analysis and the associated bursting events with their definition are presented in figure 4(a–d).
Three-dimensional bursting events analysis from Zone A and Zone B for the left-hand side of the flume and classification of eight orthogonal zones.

The different plan view of eight orthogonal zones of 3-D quadrant analysis of the bursting process: (a) front side; (b) backside; (c) top side; (d) downside.

3. Results and discussion
The 3-D quadrant studies of the bursting process are here employed to classify the bursting occurrences into eight orthogonal zones (Vahdati et al. Reference Vahidati, Ahmadi, Abedini and Heidarpour2023). To quantify the coherent structures surrounding the cylinders and their interaction with bed particle transport, the turbulent kinetic energy (TKE), transition probabilities, occurrence probabilities, stress fraction and angles of inclination of 3-D bursting events are considered. The size and strength of the horseshoe vortices are related to the bed elevation around the cylindrical structures. Also, the measured turbulent flow parameters, the scour hole at various phases of its development profile, bed topography contours and Reynolds shear stress at different locations upstream and downstream of the cylinders are then examined. For the developed scoured bed condition, the maximum scour depths were 6.5, 5.0 and 5.8 cm for the square cylinder with α = 0°, square cylinder with α = 20° and circular cylinder, respectively. Whereas, the maximum scour depths were 4.2, 3.3 and 3.8 cm, respectively, for underdeveloped scoured bed conditions. Several trial runs were conducted to determine the progress of erosion and maximum equilibrium scour depth for various flow conditions. The maximum scour depth was then measured using a point gauge once the bed was completely dried. In addition, to associate the bed elevation with other flow features in the next sections, a contour plot of the submerged square cylinder's bed elevation, α = 20° is presented in figure 5. Additionally, contour plots for submerged circular and square shapes with α = 0° are also analysed. For all cases involving cylindrical structures, the highest bed elevation away from the cylinder had the least scour depth and the lowest bed elevation closest to the cylinder had the maximum scour depth due to the generation and action of the strong horseshoe vortices. The characteristics of horseshoe vortices are related to the bed elevation around the cylindrical structures, showing that, at the lower bed elevations, the strength of the horseshoe vortices is higher, whereas it decreases at the higher bed elevation. Hence, the horseshoe vortices entrain maximum sediment into the flow at lower bed elevation, whereas it decreases at the higher bed elevation. The maximum scour depth can be recognized closer to the upstream end of the cylindrical objects in line with Du et al. (Reference Du, Wu, Liang, Zhu and Wang2022). The maximum scour depths around different types of structures, such as circular, square and aligned cylindrical structures, can vary significantly due to differences in flow dynamics and structure geometry. The results show that the scour depths are greater for square cylinders with α = 0° compared with those with α = 20° and circular cylinders for both underdeveloped and developed scoured bed conditions. The square cylinder's larger circumference and the impact of its edges, contribute to the dominant scour depth (Chiew & Melville Reference Chiew and Melville1987; Sumer & Fredsøe Reference Sumer and Fredsøe2002; Gerami, Heidarpour & Ghalati Reference Gerami, Heidarpour and Ghalati2022; Vahdati et al. Reference Vahidati, Ahmadi, Abedini and Heidarpour2023). In general, the trend in maximum scour depth varies, with square structures experiencing the greatest depth, followed by circular structures and then aligned cylindrical structures.
Contour plot of bed elevation around a submerged square cylinder, α = 20°.

3.1. Turbulent kinetic energy of bursting occurrences
In the present investigation, the measured 3-D velocity from upstream to downstream of the cylindrical structures is analysed to identify the eight orthogonal zones (table 2), based on the sign convention of 3-D velocity fluctuations.
For each zone, the TKE of the flow from upstream to downstream is obtained as
 \begin{equation}\textrm{TK}{\textrm{E}_R} = {\textstyle{1 \over 2}}(\overline {{{u^{\prime}}^2}} + \overline {{{v^{\prime}}^2}\; } + \overline {{{w^{\prime}}^2}} ),\end{equation}
where  $\textrm{TK}{\textrm{E}_R}$ represents the total TKE of the flow in the three directions.
The TKE of the flow from upstream to downstream of the cylindrical structures for underdeveloped and equilibrium scoured bed conditions is presented in figures 6 and 7, respectively.
Variation of TKER profile from upstream and downstream for (a) circular, (b) square α = 0°, (c) square α = 20° cylinder over the underdeveloped scoured bed.

Variation of TKER profile from upstream and downstream for (a) circular, (b) square α = 0°, (c) square α = 20° cylinder over the equilibrium scoured bed.

In terms of magnitude, TKER is significant near the cylinders over the underdeveloped and equilibrium-scoured beds, and it decreases in the upstream and downstream directions. As a result, the coherent structure near the cylinders arises. An increase in TKE often signifies the generation or intensification of coherent structures. This occurs when the turbulent flow undergoes instabilities or energy transfer processes that lead to the formation of organized vortices, such as vortex tubes, hairpin vortices or other coherent structures. These structures are identified by their distinct energy and vorticity signatures, which contribute to the overall TKE of the flow (Davidson Reference Davidson2015). On the other hand, a decrease in TKE indicates the dissipation of coherent structures or a transition to a more chaotic, incoherent turbulent flow. This happens when the energy of coherent structures is dissipated due to viscous effects or when the structures interact with each other, leading to their breakdown. Such structures cause an amplification of sediment movements, resulting in maximum scour depths near the base of the objects. These maximum scour depths vary depending on the cylinder configuration since roughness increases drag. The square cylinder has a greater circumference than the circular cylinder and the dominant TKE is also impacted by the edges and rear side of the square cylinders with the angle of alignment. The results also reveal that the TKE is greater for internal ejection (II-A = >II-A), external ejection (II-B = >II-B) and internal sweep (IV-A = >IV-A) external sweep (IV-B = >IV-B) in the upstream of the circular and square cylindrical structures within scour holes at various development stages compared with internal outward and inward interaction (I-A = >I-A and III-A = >III-A) and external outward inward interaction events (I-B = >I-B and III-B = >III-B). On the other part, the TKE is significant for internal ejection (II-A = >II-A), external ejection (II-B = >II-B) and internal sweep (IV-A = >IV-A) external sweep (IV-B = >IV-B) in the downstream of the aligned square cylindrical structures. The TKE variations show anisotropy of the flow characteristics away from the submerged structures in the downstream direction, with the maximum TKE around the cylinders within the wake region immediately downstream of the cylinders due to the presence of strong rollers generated. This is due to the flow separation from the cylinder edges. Furthermore, the wake downstream of the square cylinders is greater in comparison with the circular cylinders due to the stronger rollers formed at the sharp edges of the square cylinders. The rollers become stronger with the increase in the alignment angle leading to the maximum value of TKE for the square cylinder with an alignment angle of 20°. This represents how a trailing vortex arises on both sides of the aligned square cylindrical object. The wake vortex system causes strong turbulence, which begins as a necklace vortex at the back of the cylindrical object and moves transversely. This behaviour, already noticed by Gerami et al. (Reference Gerami, Heidarpour and Ghalati2022) and Vahdati et al. (Reference Vahidati, Ahmadi, Abedini and Heidarpour2023), justifies the highest scour depth that occurred upstream of the circular and square cylindrical structures and downstream of the aligned square cylindrical structure.
3.2. Transition probability of bursting occurrences
A 3-D quadrant analysis of bursting events is here used to determine the probability that a sediment particle would move around cylindrical objects over time, provided its current configuration. The probability of moving from one zone to the next with time as well as the possibility of bursting events are both represented by the transition probability of 3-D bursting events. To determine the state of 3-D bursting events within the scour hole surrounding the cylinders at various stages of their development, a conditional transition probability is used to obtain the coherent turbulent flow.
In the present study, a second-order Markov process is employed to define the rate of change in the probability of moving from one zone to the next over time t and (t + 1), respectively, and is obtained as follows (Huang, Tsai & Mousavi Reference Huang, Tsai and Mousavi2021; Khan et al. Reference Khan, Sharma, Garg and Biswas2022a,Reference Khan, Sharma, Lama, Hasan, Garg, Busico and Alharbib):
 \begin{equation}{P_{p \to q}} = \frac{{{n_{p \to q}}}}{{{n_p}}}\quad p, q = 1, 2, 3,4,5,6,7,8,\end{equation}
where Pp →q indicates the probability of transitioning from Zone p to the following Zone q with time t and (t + 1), respectively, np →q is the number of movements of events and np is the number of events in the time series from Zone p to Zone q, so that  ${n_p} = {n_{p \to 1}} + {n_{p \to 2}} + {n_{p \to 3}} + {n_{p \to 4}} + {n_{p \to 5}} + {n_{p \to 6}} + {n_{p \to 7}} + {n_{p \to 8}}$. The experimental data were used to compute the 64 transition probabilities of 3-D bursting events at two regions near the upstream and downstream cylinders. Figure 8 shows the transition probability matrix of the movement of an event from one zone to eight bursting events. Three types of arranged coherent structures (i.e. marginal movements, cross-movements and stable movements) are classified for the quadrant analysis of the 3-D bursting processes (Keshavarzi et al. Reference Keshavarzi, Melville and Ball2014; Vahdati et al. Reference Vahidati, Ahmadi, Abedini and Heidarpour2023). As suggested by Khan et al. (Reference Khan, Sharma, Garg and Biswas2022a,Reference Khan, Sharma, Lama, Hasan, Garg, Busico and Alharbib), once an event in time step t and t + 1 remains in the same zone, a stable movement occurs (figure 4a–d). The present investigation considered only stable movements. Indeed, it is crucial to understand how stable events are distributed within the flow surrounding the cylindrical object in relation to the bed scouring pattern. The internal and external sweep events' stable movement transition probabilities are computed as P ( p, q), where p = q. For instance, the internal and external sweep events' stable movement transition probabilities are P ( p = IV-A, q = IV-A) and P ( p = IV-B, q = IV-B), respectively. As a result of the stability in its state, the event is stable in transition and does not tend to go to other zones. For instance, eight occurrence probabilities of bursting events were identified in an octant analysis of the 3-D bursting process, although, as reported in figure 8, there are 64 different categories for the transition probabilities in the octant analysis.
Transition probability matrix of the movement of an event from one zone of eight bursting events.

Tables 3–5 show the computed 64 bursting transition probabilities for measured experimental data at two locations upstream and downstream of the square with α = 0°, 20° and circular cylinders over an equilibrium scoured bed. Here, Δt in transition probability (time interval of the transition) indicates movement from one zone to the next with time t to t + 1. To put it more simply, when an event takes place at a specific time step (t) within a particular zone, then, the probability that the event remains within the same zone at the following time step (t + 1). This is essentially a measure of the event's tendency to stay within its current zone over successive time steps. In the present study, Δt (total duration/total event; 240 s/64 = 3.75 = 4 s, 360 s/64 = 5.63 = 6 s) was calculated to be 4–6 s for the movement from one zone to the next (tables 3–5). These results show that the stable movement is higher in comparison with the marginal and cross-movements. The transition probability of eight bursting events variation with time step (t) to (t + 1) along circular cylinder, square cylinder with α = 0°, 20° in upstream and downstream of a cylinder at a distance of 25 mm ( $\hat{x} = 1.0$) over equilibrium scoured bed conditions are discussed in figures 9 and 10. In other words, the probability of an event continuing in the same zone at time step t + 1 is higher in that zone than in the other zones, where it occurs at time step t. Additionally, compared with other movements, the movements of I-A ↔ I-A, II-A ↔ II-A, III-A ↔ III-A, IV-A ↔ IV-A, I-B ↔ I-B, II-B ↔ II-B, III-B ↔ III-B and IV-B ↔ IV-B are all greater (figures 9 and 10). The present results are in line with the studies performed by Keshavarzi et al. (Reference Keshavarzi, Melville and Ball2014) and Vahdati et al. (Reference Vahidati, Ahmadi, Abedini and Heidarpour2023). For square cylindrical structures (α = 0°, 20°), I-A ↔ I-A is a significantly high value in the upstream region, which is not observed in the downstream region (figures 9 and 10). The high transition probability of the I-A zone in the upstream region of a square cylinder is primarily due to the geometry-induced separation and flow acceleration at the sharp corners. The downstream region, however, exhibits a more complex and chaotic flow pattern, reducing the transition probability of a specific transition mode dominating the flow. Whereas this trend is not observed in the circular cylinder. For the circular cylinder case, I-A ↔ I-A is significantly high in the upstream and downstream regions (figure 10). The smooth, curved surface of a circular cylinder does not impose the same level of flow separation and turbulence as the sharp corners of a square cylinder. This reduces the likelihood of high transition probabilities in the upstream region (Brun et al. Reference Brun, Aubrun, Goossens and Ravier2008). Circular cylinders exhibit symmetry, which tends to promote more organized and predictable flow patterns. This symmetry reduces the complexity of the wake structure and makes it less favourable to the high transition probabilities seen in square cylinders. In line with the current knowledge, this investigation focuses exclusively on the change of stable transition probabilities and their significance in bed particle transport. Overall, stable movement predominates over marginal or cross-movement in the upstream compared with downstream of the circular and square cylindrical structures. In contrast, for aligned square cylinders, stable movement dominates marginal movement or cross-movement in the downstream direction compared with upstream due to a higher chance of it occurring in the downstream direction of aligned square cylinders (figures 9 and 10, tables 3 and 5). This shows how a trailing vortex forms on both sides of the aligned square cylindrical object. The wake vortex system causes intense turbulence, which begins as a necklace vortex at the back of the cylindrical object and expands transversely. The stable transition probability of external sweep and internal ejection events demonstrates the formation of a trailing vortex on both sides of the cylinder. The high stable transition probability upstream of the cylinder leads to the development of a strong horseshoe vortex and downflow. Whereas, the high stable transition probability downstream of the cylinder develops hairpin vortex motions in the wake of the cylinder.
Transition probability matrix of eight bursting events upstream and downstream of a circular cylinder at a distance of 25 mm ( $\hat{x} = 1.0$), over equilibrium scoured bed conditions.

Transition probability matrix of eight bursting events upstream and downstream of a square cylinder with α = 0° at a distance of 25 mm ( $\hat{x} = 1.0$), over equilibrium scoured bed conditions.

Transition probability matrix of eight bursting events upstream and downstream of a square cylinder with α = 20°, at a distance of 25 mm ( $\hat{x} = 1.0$), over equilibrium scoured bed condition.

Transition probability of eight bursting events variation with time step (t) to (t + 1) along square cylinder with α = 0° upstream and downstream of a cylinder at a distance of 25 mm ( $\hat{x} = 1.0$) over equilibrium scoured bed conditions.

Transition probability of eight bursting events variation with time step (t) to (t + 1) along circular and square cylinder with α = 20° upstream and downstream of a cylinder at a distance of 25 mm ( $\hat{x} = 1.0$) over equilibrium scoured bed conditions.

3.3. Transition probability of bursting occurrences and bed particles transport
As the flow transition from one zone to another is not taken into account by the occurrence probability, considering only this does not allow for describing bursting events (Vahdati et al. Reference Vahidati, Ahmadi, Abedini and Heidarpour2023). Figure 11 shows the stable transition probabilities for square cylinders with α = 0°, 20° and circular cylinders over underdeveloped and developed scoured beds, respectively. The transition probabilities are found to be the highest adjacent to the bed and cylindrical objects at a distance of 25 mm ( $\hat{x} = 1.0$) upstream and downstream from the cylindrical objects, and thereafter decline. The measurement was carried out in a vertical section at a distance of 25 mm (
 $\hat{x} = 1.0$), not a single point. There were several points. The horseshoe vortex oscillates around cylindrical structures moving from one point to another. For the flow around the submerged cylinder, the oscillation of the horseshoe vortex is identified from the sequential occurrence of the ejection and sweep events. The high gradient of transition probabilities was observed from −250 to 0 mm, locating the study area. In this context, Keshavarzi et al. (Reference Keshavarzi, Melville and Ball2014) also reported the horseshoe vortex oscillation around cylindrical structures moving from one point to another in the transverse direction and a high gradient of transition probabilities was observed from −150 to 0 mm, where the horseshoe vortex and downflow occur. The transition probability provides information regarding the movement and occurrence of the bursting events. The intensity of horseshoe vortices at the upstream is indicated by a high transition probability, where transition probability is directly related to the growth of horseshoe vortices. When the transition probability increases, the intensity of horseshoe vortices increases as well, and vice versa. The high transition probability at the upstream indicates strong horseshoe vortices associated with bed particle erosion. Whereas, strong wake vortices are also expected to form adjacent to the bed and cylindrical objects in the downstream part, leading to a high transition probability of the corresponding bursting events ultimately leading to the transport of the eroded sediments from the upstream. This process is due to the development of strong horseshoe vortices.
Stable transition probabilities for (a) circular, (b) square α = 0°, (c) square α = 20° cylinder over the underdeveloped and equilibrium scoured bed.

Downflow is predicted to form adjacent to the bed and cylindrical objects. Strong wake vortices are also expected to form adjacent to the bed and cylindrical objects and thereafter decline. Over the underdeveloped scoured bed, the maximum transition probabilities of P( p, q) (namely, 84 % and 88 %) for Zones II-B ↔ II-B and II-A ↔ II-A are identified at 25 mm ( $\hat{x} = 1.0$) downstream from the circular and square cylindrical structure, respectively. The highest transition probabilities are at a distance of 25 mm (
 $\hat{x} = 1.0$) upstream and downstream from the cylindrical objects, indicating dominating bed particle transport close to the cylindrical structure. Whereas, for the angular aligned square cylindrical structure, maximum transition probabilities of P ( p, q) (97 %) for Zone I-A ↔ I-A are identified at 25 mm (
 $\hat{x} = 1.0$) in the upstream structure. For over-developed scoured bed, the maximum transition probabilities of P ( p, q) (94 %) for Zones II-B ↔ II-B and II-B ↔ II-B are identified at 25 mm (
 $\hat{x} = 1.0$) downstream from the circular and square cylindrical structure, respectively. The high transition probabilities for external ejection (II-B ↔ II-B) suggest that sediment particles are being pushed away from the scour hole. This is because the formation of the lee-wake vortex pair is followed by particle mobilization and relocation upstream by the entering reverse flows downstream of the cylindrical structures. For the aligned square cylindrical structure, maximum transition probabilities of P ( p, q) (94 %) for Zone I-A ↔ I-A is identified at 25 mm (
 $\hat{x} = 1.0$) in the upstream structure. The high transition probabilities for internal outward interaction events (I-A ↔ I-A) specify a regressive flow mechanism because such forces cause the force vector to be directed towards the surface of the water (Nelson et al. Reference Nelson, Shreve, McLean and Drake1995). Hence, it only has a minimal impact on sediment transport as also reported by Ganapathisubramani et al. (Reference Ganapathisubramani, Hutchins, Hambleton, Longmire and Marusic2005). In a similar study, Keshavarzi et al. (Reference Keshavarzi, Melville and Ball2014) pointed out that, at a location of 65 mm downstream from the circular bridge pier, extreme values of transition probability were observed to be 68.1 % and 66.8 % for II-A ↔ II-A and IV-B ↔ IV-B, respectively. In comparison with the stable transition probability, the transition probabilities for other movements are smaller. As a result, only the fluctuation of stable transition probabilities and their impact on sediment transport are explored in this study.
The variation of stable transition probabilities for eight zones in the lateral direction is presented in figure 12 for the underdeveloped and the equilibrium scoured bed, respectively. These results indicate that the transition probability values for II-A and IV-B are higher than those for the other zones around the circular, square and aligned cylindrical structures for underdeveloped and equilibrium scoured beds. The transition probability values are higher close to cylindrical structures, and they decrease away from cylindrical structures (Vahdati et al. Reference Vahidati, Ahmadi, Abedini and Heidarpour2023). Further, the maximum transition probability values are found around aligned cylindrical structures in comparison with the circular and square cylindrical structures for the underdeveloped and equilibrium scoured bed conditions. This depicts the formation of a trailing vortex on both sides of the aligned square cylindrical object. The wake vortex system generates significant amounts of turbulence, which starts as a necklace vortex at the rear of the cylindrical object and extends transversely (Manes & Brocchini Reference Manes and Brocchini2015). Hence, maximum scour is developed around aligned square cylindrical structures in comparison with circular and square cylindrical structures.
Stable transition probabilities in the lateral direction for eight stable events for the underdeveloped and equilibrium scoured bed: (a) circular, (b) square α = 0°, (c) square α = 20° cylinder.

The patterns of transition probability for internal and external outward interaction events appear to play a minimal role in sediment transport because those forces cause the force direction to be directed towards the water surface. As a result, the transition probability contour line for the internal and external sweep and ejection events was considered to demonstrate the influence of sediment transport in the upstream and downstream for square α = 20° cylinders over underdeveloped and developed scoured beds, respectively. Further to the distribution of transition probabilities with the scouring pattern surrounding cylindrical structures, for the scoured bed, the contour lines of the transition probabilities of eight bursting events are presented. Considering a 450 mm strip, figures 13 and 14 show the transition probability contour line in the upstream and downstream for square α = 20° cylinders over underdeveloped and developed scoured beds, respectively.
Transition probability contour line in the upstream and downstream for square α = 20° cylinder over the underdeveloped scoured bed.

Transition probability contour line in the upstream and downstream for square α = 20° cylinder over the equilibrium scoured bed.

Besides the 450 mm strip reported in figures 13 and 14. Vahdati et al. (Reference Vahidati, Ahmadi, Abedini and Heidarpour2023) detected a significant gradient of transition probabilities in the zone from −250 to 0 mm, where the horseshoe vortex and downflow occur. There is a significant gradient of transition probabilities for internal sweep events close to the upstream of circular, square and angular square cylindrical objects, where the downflow is strongest, whereas significant gradient of transition probabilities for external ejection and internal sweep events close to the upstream of circular, square and angular square cylindrical structures. This is due to the development of a strong horseshoe vortex and downflow on the cylinder's upstream side, which spirals around cylindrical objects.
Behind the cylindrical object, the high transition probabilities for internal ejection (II-A ↔ II-A) and external sweep (IV-B ↔ IV-B) events prompt the flow in the direction of the open surface over an underdeveloped scoured bed (figures 11 and 13). The stable transition probability of external sweep and internal ejection events demonstrates the formation of a trailing vortex on both sides of the cylindrical structure. The strong turbulence trailing the wake vortex system occurs as a necklace vortex at the back of the cylindrical object, and then spreads transversely (Keshavarzi et al. Reference Keshavarzi, Melville and Ball2014). The high stable transition probability downstream of the cylinder develops hairpin vortex motions in the wake of the cylinder. When the transition probability increases, the intensity of the trailing horseshoe vortices increases as well, and vice versa. In a developed scoured bed, the high transition probabilities for internal ejection (II-A ↔ II-A) and external ejection (II-B ↔ II-B) events direct the flow towards the free surface (figures 11 and 14). This is because the wake vortex is created by the cylindrical structure. As can be observed, the stable transition probabilities of outward sweep and internal ejection events have identical probabilities at the channel centre and sides. External sweep (IV-B ↔ IV-B) and internal ejection (II-A ↔ II-A) events have the highest transition probability compared with other events (figure 11). As a result, it is possible to conclude that internal sweep pushes force towards the bed, while external ejection directs sediment particles away from the centreline. At a distance equal to 1d times the cylinder size from the channel centreline, internal inward interaction, internal sweep and external and internal ejection events are found to have higher values of transition probability (Kumar & Kothyari Reference Kumar and Kothyari2012).
Figures 13 and 14 also show that II-A ↔ II-A and IV-B ↔ IV-B have higher transition probabilities from upstream to downstream than other events within the scour hole surrounding the circular and square cylindrical objects at various stages of their development, indicating the highest possibility of occurrence (Vahdati et al. Reference Vahidati, Ahmadi, Abedini and Heidarpour2023). The horseshoe vortex formed on the upstream side of the cylinder causes this process, which is followed by particle motion and movement upstream to downstream by the trailing vortex and lee-wake vortex generated on the top and side of the cylindrical structures.
3.4. Angle of inclination of bursting occurrences
The magnitude of forces exerted on bed sediment particles is heavily influenced by the flow 3-D velocity fluctuations. Identifying bed particle transport mechanisms benefits from knowing the inclination angle of the bursting occurrences (Esfahani & Keshavarzi Reference Esfahani and Keshavarzi2013) surrounding the cylindrical structures. Khan et al. (Reference Khan, Sharma, Pu, Aamir and Pandey2021) stated that the force exerted on particles is proportional to the inclination angle of the force, emphasizing the link of inclination angle to bed particle transport and coherent structures.
The eight orthogonal zones' inclination angles for the undeveloped and equilibrium-soured bed studies are presented and discussed in this section. The turbulent shear stress' angle of inclination can be determined as follows (Keshavarzi et al. Reference Keshavarzi, Melville and Ball2014):
 \begin{equation}{\theta _k} = \left|{\textrm{arctan}\left( {\frac{{w^{\prime}}}{{\sqrt {{{u^{\prime}}^2} - {{v^{\prime}}^2}} }}} \right)} \right|,\end{equation}
where θk is the inclination angle from the horizontal plane in the bursting class k, and u′, v′ and w′ are the streamwise, transverse and vertical directions’ velocities fluctuation velocities, respectively. The inclination angles aid in determining the particle's trajectory flow at the underdeveloped and developed scouring bed. Figures 15 and 16 display the inclination angle of bursting events in the upstream and downstream for square α = 20° cylinder over underdeveloped and developed scoured bed, respectively.
The inclination angle of bursting events in the upstream and downstream for square α = 20° cylinder over the underdeveloped scoured bed.

The inclination angle of bursting events in the upstream and downstream for square α = 20° cylinder over equilibrium scoured bed.

The inclination angles for internal and external ejection (II-A, II-B) and internal and external sweep (IV-A, IV-B) are greater for underdeveloped and developed scoured beds at a location of 25 mm ( $\hat{x} = 1.0$) downstream of the aligned square cylindrical structure, where maximum scour occurred, than for internal and external outward interactions (I-A, I-B) and internal and external inward interactions (I-A, I-B) (III-A, III-B). As a result, the stable sweep and ejection events exhibit larger inclination angles than other events, with these mostly occurring 25 mm (
 $\hat{x} = 1.0$) downstream of the aligned square cylindrical objects.
The stable sweep and ejection events impose forces at comparable angles but in opposite directions, to eventually infer the presence of homogeneous 3-D turbulences. As a result, greater magnitudes of inclination angles towards the bed are associated with sediment transport zones. Additionally, the effect of the inclination angles for internal ejection (II-A) and internal sweep (IV-A) is greater and external ejection (II-B) and external sweep (IV-B) for both the scoured bed conditions. In line with what was reported by Khan et al. (Reference Khan, Sharma, Pu, Aamir and Pandey2021), the present results show that the effect of the inclination angles is higher from upstream to downstream for II-A and IV-B than for other events within the scour hole surrounding the cylindrical structures at different stages of development. This indicates that greater magnitudes of inclination angles towards the bed are connected with more prominent sediment transport zones. This process is caused by the evolution of the horseshoe vortex created on the upstream side of the cylinder and is followed by particle motion and transfer upstream by the downflow upstream of the cylindrical structures. According to Keshavarzi et al. (Reference Keshavarzi, Melville and Ball2014), significant scour occurs when the inclination angles for II-A, II-B, IV-A and IV-B are high, and the maximum inclination angle for outward and inward interactions is pushed upstream. As a result, the amplitude of inclination angles for stable sweep and ejection events is greater than for other events, especially 40 mm upstream of the pier.
3.5. Stress fraction of bursting occurrences
The stress fraction of each quadrant event represents the ratio of each quadrant event to the total number of events at the same time. For the calculation of the transition probability, data is divided into each quadrant, and it is further subdivided into zones with time step t to time step (t + 1) in the same zone. The transition probability of each turbulent event in each zone represents the ratio of each transition probability of that zone to the total number of the same events in the same quadrant and zone. The mean vertical Reynolds shear stress for the quadrant  ${\overline {u^{\prime}w^{\prime}} ^{i{H_S}}}$ for the hole size Hs is computed following Khan et al. (Reference Khan, Sharma, Garg and Biswas2022a,Reference Khan, Sharma, Lama, Hasan, Garg, Busico and Alharbib) and Ikani et al. (Reference Ikani, Pu, Taha, Hanmaiahgarib and Penna2023) as
 \begin{equation}{\overline {u^{\prime}w^{\prime}} ^{i{H_S}}} = \frac{1}{T}\int_0^T {u^{\prime}(x,z,t)w^{\prime}(x,z,t){\lambda _{i{H_S},t}}(u^{\prime},w^{\prime})\,\textrm{d}t} ,\end{equation}
where t is the running time while T indicates the sampling duration, i is a specific quadrant and  ${\lambda _{i{H_S},t}}(u^{\prime},w^{\prime})\; $ represents the conditional sampling function,
 \begin{equation}{\lambda _{i{H_S},t}} = \left\{ {\begin{array}{@{}l@{}} {1,}\ {\textrm{when}\;\textrm{fluctuations}\;\textrm{are}\;\textrm{in}\;\textrm{quadrant}\;i\;\textrm{and}\;\overline {|u^{\prime}w^{\prime}} |\ge {H_S}{{(\overline {{{u^{\prime}}^2}} )}^{0.5}}{{(\overline {{{w^{\prime}}^2}} )}^{0.5}},}\\ {0,}\ {\textrm{else}\textrm{.}} \end{array}} \right.\end{equation}
The stress fraction  ${S_{i,{H_S}}}$ is determined as
 \begin{equation}{S_{i,{H_S}}} = \frac{{{{\overline {u^{\prime}w^{\prime}} }^{i{H_S}}}}}{{\overline {u^{\prime}w^{\prime}} }},\end{equation}
where  $\overline {u^{\prime}w^{\prime}} $ is the mean Reynolds stress (Khan et al. Reference Khan, Sharma, Garg and Biswas2022a,Reference Khan, Sharma, Lama, Hasan, Garg, Busico and Alharbib; Ikani et al. Reference Ikani, Pu, Taha, Hanmaiahgarib and Penna2023), and can be computed as
 \begin{equation}\overline {u^{\prime}w^{\prime}} = \frac{1}{T}\int_0^T {u^{\prime}(x,z,t)w^{\prime}(x,z,t)\,\textrm{d}t} .\end{equation}
Here  ${S_{i,{H_s}}} > 0$ belongs to the second and fourth quadrants, whereas
 ${S_{i,{H_s}}} < 0$ indicates that it is located in the first and third quadrants. It is worth remembering that the overall stress fraction
 ${S_{i,{H_s}}}$ should be equal to one:
 \begin{equation}\sum\limits_{i = 1}^8 {{{[{S_{i,{H_S}}}]}_{{H_s} = 0}}} = 1.\end{equation}
The same procedure is used to get the additional parameters for transverse and longitudinal stress fractions.
Figures 17 and 18 illustrate the stress fraction ( ${S_{i,{H_s}}}$) distribution at three levels
 $\hat{z} = 0.02$, 0.28 and 0.5 closer to the upstream of cylindrical structures over underdeveloped and developed scoured beds, respectively.
Stress fraction ( ${S_{i,{H_s}}}$) distribution at three elevations Z = 0.02H, 0.28H and 0.5H closer to the upstream of a square cylinder with α = 0°, 20° and circular cylinder over the underdeveloped scoured bed.

Stress fraction ( ${S_{i,{H_s}}}$) distribution at three elevations Z = 0.02H, 0.28H and 0.5H closer to the upstream of a square cylinder with α = 0°, 20° and circular cylinder over the equilibrium scoured bed.

In the current study, quadrant hole sizes from 0 to 14 are examined (Izadinia et al. Reference Izadinia, Heidarpour and Schleiss2013; Khan et al. Reference Khan, Sharma, Garg and Biswas2022a,Reference Khan, Sharma, Lama, Hasan, Garg, Busico and Alharbib). The purpose of comparing the stress fraction depending on the hole size is to assess the impact of varying hole sizes on the stress distribution within structures, increasing hole size reduces the impact of individual events on stress production (Izadinia et al. Reference Izadinia, Heidarpour and Schleiss2013). All the events are quite effective at a lower hole size, but their contributions drop as the hole size increases (Dey et al. Reference Dey, Lodh and Sarkar2018a,Reference Dey, Swargiary, Sarkar, Fang and Gaudiob). In large values of the hole size, only strong events are considered (Ikani et al. Reference Ikani, Pu, Taha, Hanmaiahgarib and Penna2023). On the other hand, hole size allows the investigation of the contributions of events to the total Reynolds shear stress, whether they are large, small or frequent (Maity & Mazumdar Reference Maity and Mazumder2017). Because the transport is greatest near the bed, the measuring section is chosen at the bottom of the cylindrical structures. For 3-D shear stresses analysis, the organized coherent structures are categorized into marginal, cross- and stable movements. The instantaneous shear stress exists in time steps t and t + 1 and is located in the same octant cubic zone in the case of stable shear stress movements in the octant analysis. Each 3-D bursting event and shear stresses are connected and remain in place in this category of movements. Hence, they are stable in their current situation, and the instantaneous shear stresses in this category are stable in transition. These are situated in the main diagonal elements of the matrix M(I), such as Zones [I-A ↔ I-A], [II-A ↔ II-A], [III-A ↔ III-A], [IV-A ↔ IV-A], [I-B ↔ I-B], [II-B ↔ II-B], [III-B ↔ III-B]. In the present investigation, the stable movements of shear stress of 3-D bursting events and their influence on bed scouring are taken into consideration as it is noticed that stable zones are the most probable events. A similar observation was found by Keshavarzi et al. (Reference Keshavarzi, Melville and Ball2014) for probability analyses of instantaneous shear stress and entrained particles from the bed. The stress fraction ( ${S_{i,{H_s}}}$) patterns for internal and external outward interaction events appear to have little influence on sediment transport since those forces cause the force direction to be directed towards the surface of the water and then return to bed, face-sweeping patterns that represent swift, fluid motion downward.
Bursting events, characterized as ejection, sweep, inward and outward interaction events can have a significant impact on sediment dynamics (Rinoshika et al. Reference Rinoshika, Rinoshika, Wang and Zheng2021; Khan et al. Reference Khan, Sharma, Garg and Biswas2022a,Reference Khan, Sharma, Lama, Hasan, Garg, Busico and Alharbib). In particular, sweep and ejection events have a strong influence on sediment mobility and contribute significantly to Reynolds shear stress. As a result, the stress fraction for the internal and external sweep and ejection events were taken into account to determine the influence of sediment movement in the upstream and downstream of a square cylinder with α = 0°, 20° and circular over an underdeveloped and developed scoured bed, respectively (figures 17 and 18). Internal and external ejections have a higher stress fraction than internal and external sweeps for square cylinders with α = 0°, 20° and circular over underdeveloped and developed scoured beds, respectively. For all events, the stress fraction is likewise higher closer to the square cylinder's upstream having α = 0°, 20° and circular over underdeveloped and developed scoured beds, respectively. This process has a considerable influence on sediment transport, influencing the quantity of sediments moving in the region. In comparison with the others, the largest stress fraction is seen for internal and external ejection occurrences for structures adjacent to the circular cylindrical objects, these events are caused by coherent flow structures for structures adjacent to the circular cylindrical objects (Miozzi et al. Reference Miozzi, Corvaro, Pereira and Brocchini2019). Whereas the largest stress fraction is found for internal and external sweep occurrences close to aligned square cylindrical structures, as the dominating turbulent event is also affected by the edges and back side of the square cylinders with the angle of alignment.
The higher contribution to the Reynolds shear stress for I-A, II-A, III-A, IV-A, I-B, II-B, III-B and IV-B events at the bed is observed, while the contribution decreased away from the bed, indicating that the 3-D bursting events with sediment movement have a high occurrence probability. Close to the upstream of the circular cylindrical structures over the equilibrium scoured bed, the stress fraction occurrence probability of the eight orthogonal zones is 1.8 %, 23 %, 1.7 %, 23 %, 1.8 %, 23 %, 0.2 % and 24 % for I-A, II-A, III-A, IV-A, I-B, II-B, III-B and IV-B events, respectively. The stress fraction occurrence probability of the eight orthogonal zones is 0.8 %, 21 %, 0.7 %, 22 %, 0.8 %, 26 %, 0.7 % and 28 % for I-A, II-A, III-A, IV-A, I-B, II-B, III-B and IV-B events, respectively, close to upstream of the square cylindrical structure. Whereas, for those close to upstream of the aligned square cylindrical structures, the stress fraction occurrence probability of the eight orthogonal zones is 0.7 %, 28 %, 0.6 %, 23 %, 0.6 %, 26 %, 0.3 % and 21 % for I-A, II-A, III-A, IV-A, I-B, II-B, III-B and IV-B events, respectively, over equilibrium scoured beds.
Additionally, the stress fraction for internal (II-A) and external (II-B) ejections, and internal (IV-A) and external (IV-B) sweeps, increases close to the cylindrical structures and decrease away from the objects, indicating that high magnitudes of shear stress are concentrated in very turbulent zones surrounding these objects. The occurrences are caused by coherent flow structures, and this is related to the growth of the horseshoe vortex, and the wake vortex formed is greater near the cylindrical structures and decreases away from the objects. These findings are in line with observations of local scour around submerged circular cylindrical structures (Williams et al. Reference Williams, Balachandar, Roussinova and Barron2022). Vahdati et al. (Reference Vahidati, Ahmadi, Abedini and Heidarpour2023) also found that sweeps and ejections were formed mainly near the wake flow in the open channel upstream of the bridge piers group.
3.5.1. Stress fraction of bursting occurrences in various radial directions
The changes in stress fraction ( ${S_{i,{H_s}}}$) with respect to the angle of the radial lines β for various cylinders over underdeveloped and equilibrium scoured beds are reported in figure 19. The angle β has a range of 0°–360° and indicates the angle of the radial lines around the cylinders. By using the parameter β, it is possible to assess the fractional contributions in different radial directions surrounding the cylindrical structures. The patterns of stress fraction (
 ${S_{i,{H_s}}}$) with the angle of the radial lines β for internal and external outward interaction events appear to have little impact on sediment transport since those forces cause the force direction to be pushed towards the water surface. The parameter β is used here to formulate an equation for the representation of the stress fraction, which can be subsequently used for the determination of the stress fraction variations along the radial lines. The higher percentage of fractional contribution of the stress fraction indicates higher sediment movement. These variations of the stress fraction give an idea about the extension of the scour hole around the submerged cylinders.
Variations of  ${S_{i,{H_s}}}$ with the angle of the radial lines β for a square cylinder with α = 0°, 20° and circular cylinder over underdeveloped and equilibrium scoured beds.

The variations of stress fraction as a function of the radial lines β for the internal and external sweep and ejection events were investigated to determine the impact of sediment transport in the upstream and downstream of a square cylinder with α = 0°, 20° and circular across an underdeveloped and developed scoured bed, respectively (figure 19). A second-degree polynomial, as defined below, fits the plotted experimental data best,
 \begin{equation}{S_{i,{H_S}}} = j{\beta ^2} + l\beta + m,\end{equation}
where the coefficients j, l and m characterize the property of stress fraction variation in various radial directions around the cylindrical objects, also affecting the overall stress fraction. Indeed, if the value of these coefficients increases, the overall stress fraction also increases. However, it is pertinent to mention that the coefficients shown in tables 6 and 7 reflect data specific to these experiments. Therefore, more experiments may be conducted under various flow conditions to generalize the coefficients. Using the curve fitting techniques, the coefficients or constant values for different cylinders over scoured beds are computed. Tables 6 and 7 show the fluctuation of the coefficients for various cylinders over underdeveloped and equilibrium-scoured beds, respectively. Consequently, the fractional contributions for the internal and external sweep and ejection events are higher on the equilibrium scoured bed than on the underdeveloped scoured bed in all radial directions. Additionally, for the internal and external sweep and ejections events, the fractional contributions are maximum for the aligned cylindrical structures in comparison with square and circular cylindrical structures over both beds. Nevertheless, for internal and external sweep and ejection events, the fractional contributions are similarly higher near the upstream edge of the all-cylindrical objects, causing the development of coherent flow formations near the bed. These structures are in charge of amplifying the sediment dynamics that cause erosion at the base of the cylindrical structures (Miozzi et al. Reference Miozzi, Corvaro, Pereira and Brocchini2019). This is possibly caused by the formation of an intense horseshoe vortex and downflow on the upstream side of the cylinder, which packs around cylindrical objects. It aids in a better understanding of the interaction between the flow and the channel bed, and thus the sediment motion if it exists, as reported by Keshavarzi et al. (Reference Keshavarzi, Melville and Ball2014). The fractional contributions for square and circular cylindrical structures increase as β decreases; while, for an aligned square cylindrical structure, the fractional contributions to cylindrical structures increase as β increases downstream, with an opposite behaviour upstream.
Values of coefficients j, l, m over the underdeveloped scoured bed.

Values of coefficients j, l, m over the equilibrium scoured bed.

With the higher percentage of fractional contributions for the internal sweep, the external sweep is predicted close to the cylindrical objects in comparison with the internal ejection and external ejection events, suggesting a significant probability of 3-D bursting occurrences with sediment movement near the cylindrical structures.
4. Conclusions
In this study, a new approach is proposed to quantify probabilistic sediment bed dynamics in a laboratory flume, as a function of the flow turbulence created by submerged rigid obstacles. A 3-D quadrant analysis of the bursting process was undertaken to recognize the most probable coherent structure events over the scoured bed surrounding the cylinders at various stages of its development. The 64 transition probabilities of the 3-D bursting events taking place in the corresponding eight zones are obtained from laboratory investigation data. The data is utilized for determining the TKE, the transition probability, occurrence probabilities, angle of inclination and stress fraction of 3-D bursting events and coherent structure over the scoured bed surrounding the cylinders at various stages of its development. Results show that the TKE is higher upstream of the circular and square cylindrical structures for internal ejection, external ejection, and internal sweep, external sweep, whereas TKE has significance for internal ejection, external ejection, and internal sweep, external sweep downstream of the aligned square cylindrical structures. This indicates the maximum depth of scour that occurred downstream of the square cylindrical structures that are aligned and upstream of the circular and square cylindrical structures. It is noticed that the events with the highest transition probabilities among the others are external sweep and internal ejection. Also, it is revealed that a higher transition probability arises at the event of the external sweep and internal ejection, it resembles reality in terms of increasing sediment transport surrounding cylinders. The findings show that II-A ↔ II-A and IV-B ↔ IV-B have higher transition probabilities from upstream to downstream than other events within the scour hole surrounding the circular and square cylindrical objects at various stages of their development, signifying the greatest probability of its occurrence. This process is initiated by the horseshoe vortex created on the upstream side of the cylinder, which is followed by particle motion and movement upstream to downstream by the trailing vortex and lee-wake vortex formed on the top and side of the cylindrical structures. Whereas I-A ↔ I-A is more complex than other events between the upstream and downstream sides of the scour hole surrounding the aligned square cylindrical structures at various stages of its development. In the transverse direction, aligned cylindrical structures have the highest transition probability values compared with circular and square cylindrical structures. This shows the development of a trailing vortex on both sides of the aligned square cylindrical object. The stress fraction for internal and external ejections, as well as internal and external sweeps, increases close to the cylindrical objects and decreases away from the objects, indicating that high shear stress magnitudes are concentrated in very turbulent zones surrounding these structures. Additionally, with the larger percentage of fractional contributions for the internal sweep, the external sweep is predicted adjacent to the cylindrical structures in contrast to internal ejection and external ejection events, implying a significant possibility of 3-D bursting occurrences with sediment movement near the cylindrical structures. Internal and external sweep and ejection events have bigger fractional contributions on the equilibrium scoured bed than on the undeveloped scoured bed in all radial directions. For internal and exterior sweep and ejection events, aligned cylindrical objects have the highest fractional contributions compared with square and circular cylindrical structures for both beds. Moreover, links could be developed for determining each quadrant's fractional contribution to the stress fraction for complex shapes of cylindrical objects. The results presented here can be effectively used in numerical simulations, but limitations should be taken into account. For example, one should consider the assumptions made in the derivation of the deep or shallow-water equations, as well as the numerical dissipation inherent in the numerical schemes. These results can serve as a dataset for future numerical investigations. It is worth noticing that more research under varied flow and geometry conditions is required to generalize the present outcomes. Future investigations could also include alternative tandem pier arrangements and varied shaped cylindrical objects.
Acknowledgements
The authors would like to thank the three anonymous reviewers and the associate editor handling the manuscript for their comments, which were paramount to further developing the research and clarifying the key points of the study.
Funding
K.P.B. and A.S. would like to acknowledge the Department of Science and Technology, New Delhi, India, for funding this research (grants reference SR/S3/MERC/0029). The work of M.N. was supported by a subsidy from the Polish Ministry of Education and Science for the Institute of Geophysics, Polish Academy of Sciences.
Declaration of interests
The authors report no conflict of interest.
Authors contributions
K.P.B., experimental test, data analysis, manuscript preparation; A.S., formal analysis, study supervision, manuscript preparation; M.N., manuscript preparation. All authors contributed to drafting the first version and reviewing the manuscript.



