Membrane technologies are widely used in the dairy industry, not only to remove bacteria or concentrate milk solids, but also to increase protein concentration. The widespread application of membrane filtration has resulted in a number of novel ingredients with tailored processing and nutritional functionality. When concentrating milk proteins ultrafiltration (UF) is mostly used and, in this case, most of the proteins are retained, while lactose, non-protein nitrogen and soluble minerals are transmitted through the membrane (Waungana et al., Reference Waungana, Singh and Bennett1999). More recently, ultrafiltration using membranes with larger pore sizes has been used, often referred to as microfiltration (MF). With microfiltration, micellar casein concentrates or isolates are obtained, as the total ratio of casein to whey protein increases, depending on the processing conditions and the selectivity of the membrane (Nelson and Barbano, Reference Nelson and Barbano2005).
To further increase the concentration of protein and reduce unwanted components, water is often added during filtration, in a practice called diafiltration (DF). This improves flow rates and permeation, and ensures higher process efficiencies. However, DF also causes substantial modifications to the ionic equilibrium and affects the composition of the colloidal fraction, with important consequences to the functionality of the milk concentrates (Alexander et al., Reference Alexander, Nieh, Ferrer and Corredig2011; Renhe et al., Reference Renhe, Zhao and Corredig2019; Li and Corredig, Reference Li and Corredig2020). Milk protein concentrates and micellar casein concentrates have been suggested as ingredients in the standardization of cheese milk, to improve cheese production efficiencies (Requena et al., Reference Requena, Fontecha and Goude1999; Jaeggi et al., Reference Jaeggi, Martinelli, Johnson and Lucey2011). However, the details of the aggregation properties of caseins as a function of membrane processing history are yet to be fully understood.
During cheese making, the aggregation of casein micelles is induced, in most cases, by a colloidal destabilization mechanism caused by chymosin (rennet). The enzyme specifically acts on κ-casein, present on the surface of native micelles. The hydrolysis induced by chymosin decreases steric and electrostatic repulsion between the casein micelles, and the proteins are then able to approach one another and aggregate (De Kruif and Zhulina, Reference De Kruif and Zhulina1996). This gelation process includes two steps. The primary stage is the cleavage of κ-casein by chymosin at the Phe 105-Met 106 position on the polypeptide chain. This reaction causes the release of the soluble C-terminal region of κ-casein into the serum phase (Dalgleish, Reference Dalgleish1983). Once a sufficient amount of κ-casein is hydrolyzed, the casein micelles aggregate upon collision forming a gel network (Dalgleish, Reference Dalgleish1980).
During the concentration process, the average distance between casein micelles decreases and they collide with each other more frequently (De Kruif, Reference De Kruif1998). However, at neutral pH, the time of gelation is not affected by concentration, and destabilization occurs only when more than 85% of the κ-casein is released (Sandra et al., Reference Sandra, Cooper, Alexander and Corredig2011). In contrast, a large increase in the coagulation time is observed when milk is diluted (Dalgleish, Reference Dalgleish1980). A decrease of milk pH (i.e. to pH 6.5) results in the reduction of coagulation time, due to the decrease in electrostatic repulsion between the micelles (Waungana et al., Reference Waungana, Singh and Bennett1999). In native milk at pH 6.8, once at least 85%–90% of the casein-macropeptide is released the second stage of gelation, the aggregation of casein micelles, occurs (Dalgleish, Reference Dalgleish1980). A sufficient concentration of soluble calcium ions is essential for aggregation (Sandra and Corredig, Reference Sandra and Corredig2013). For example, reconstituted milk protein concentrate does not coagulate unless about 2 mm calcium is present (Martin et al., Reference Martin, Williams and Dunstan2010). The overall charge of the casein micelles is also critical. The addition of NaCl in milk inhibits the cleavage of κ-casein by chymosin, and decreases the stiffness of the gels formed (Zhao and Corredig, Reference Zhao and Corredig2016a). It has also been reported that an increase in the presence of non-micellar caseins could inhibit the aggregation of casein micelles by shielding the hydrophobic groups on the renneted casein micelles (Gaygadzhiev et al., Reference Gaygadzhiev, Massel, Alexander and Corredig2012; Krishnakutti Nair and Corredig, Reference Krishnakutti Nair and Corredig2015).
The kinetics of chymosin-induced gelation in concentrated casein micelles are significantly influenced by both processing history and serum composition (Corredig et al., Reference Corredig, Krishnakutti Nair, Li, Eshpari and Zhao2019). Any difference in the concentrates, which affects the equilibrium between soluble and colloidal components in the suspensions, the amount of free ions or the casein micelles' integrity, will modify the ability of the concentrates to gel. In practice, these effects are difficult to observe in isolation. The work described here focused on understanding differences in the concentrate's gelation behavior. The gelation induced by chymosin was employed as a means to understand the colloidal stability of the micelles in the concentrates, due to its specificity toward the surface properties of the micelles. We hypothesized that concentrates prepared using polymeric UF membranes will show profound differences in the gelation properties depending on the use of DF. Skim milk was concentrated 4× using filtration alone, or in combination with DF. Mixtures of such concentrates with untreated skim milk were also tested, to evaluate if the same behavior persisted once the initial environmental conditions were somewhat restored.
Materials and methods
Filtration and diafiltration of skim milk
Pasteurized (72 °C, 16 s) skim milk was provided by Gaylea Food Cooperative (Guelph, ON, Canada). A tangential flow filtration system using a large pore ultrafiltration (UF) spiral-wound polyvinylidene difluoride (PVDF) membrane module (nominal molecular weight cutoff 800 kDa; membrane area of 22.8 m2; 0.61 mm feed spacer) (Synder Filtration, Vacaville, CA, USA) was used to concentrate the milk at 20 °C. The transmembrane pressure was maintained at 1 bar and the milk feed flux was 5.68 m3/h.
Four times (4×) UF concentrates were obtained based on volume reduction, by measuring the permeate. Ultrapure water was then added, three times the retentate weight, and filtration continued under the same conditions until the permeate collected corresponded to the amount of water originally added. Sodium azide (0.02% w/v) was added immediately to the collected 4× UF and 4× DF samples to prevent microbial growth.
In separate experiments, the 4× UF and 4× DF concentrated micelles suspensions were added to untreated skim milk to reach a total protein concentration of 5% (w/v) to carry out the gelation experiments.
Protein analysis
Total and soluble protein concentration was determined using a Dumas nitrogen analyzer (FP-528, Leco Inc., Lakeview Avenue, St. Joseph, MI) using 6.38 as conversion factor. The soluble protein was defined as proteins present in the serum after ultracentrifugation at 100 000 × g for 1 h at 20 °C (Optima™ LE-80K ultracentrifuge with rotor type 70.1Ti, Beckman Coulter Canada Inc., Mississauga, Canada) and subsequent filtration through 0.45 μm filter (low protein binding, Fisher Scientific, Mississauga, Canada). To determine the amount of residual native whey protein in the soluble phase, 2 ml serum was mixed with 6 ml water and adjusted to pH 4.5 using 1 mol/l HCl. After adjusting the volume to 10 ml volumetric flask and then centrifuged at 10 000 × g for 30 min.
The average radius of the casein micelles was measured using dynamic light scattering (Zetasizer Nano-ZS, Malvern Instruments, Worcestershire, UK). The samples were diluted to the ratio 1 μl sample: 1 ml of their corresponding permeate from ultrafiltration, further filtered through 0.22 μm filters (PVDF filters, Fisher Scientific) and analyzed at 22 °C.
The protein composition of the serum phase was determined using RP-HPLC (Renhe and Corredig, Reference Renhe and Corredig2018). Centrifugal supernatant (400 μl) was dissolved in 1600 μl guanidine buffer, which contains 21.5 mm sodium citrate, 6 m guanidine hydrochloride, 19.5 mm dithiothreitol, and 0.1 m BisTris buffer (pH 7.0) (Bonfatti et al., Reference Bonfatti, Grigoletto, Cecchinato, Gallo and Carnier2008). The mixture was kept at room temperature (22 °C) for at least 1 h, and then filtered through a 0.45 μm filter. Analysis was performed using Ultimate3000 HPLC (Thermo Scientific, Burlington, ON, Canada) with degasser, pump, auto-sampler, and UV detector (set to 214 nm). The sample (20 μl) was injected on a column (Zorbax 300SB-C8, 3.5 μm, 300 Å 150 × 4.6 I.D., Agilent technologies, Santa Clara, CA, US, with a Vydac C-4 guard column, Mandel Scientific Co. Inc., Guelph, ON, Canada), and elution was carried out with solvent A 0.1% trifluoroacetic acid (TFA) in water and solvent B 0.1% TFA in acetonitrile at 40 °C. Gradient elution was carried out at a flow rate of 0.8 ml/min and the gradient was as follows: linear gradient from 33 to 35% B in 5 min, from 35 to 37% B in 4 min, from 37 to 40% B in 9 min, from 40 to 41% B in 4 min, 41% B for 5.5 min, from 41 to 43% B in 0.5 min, 43 to 45% B in 8 min, 45% B during 4 min, from 45 to 52% B in 5 min, 52% during 13 min. To further confirm the results from HPLC, the soluble fraction was also subjected to SDS-PAGE electrophoresis (Zhao and Corredig, Reference Zhao and Corredig2016b).
Determination of total, soluble and diffusible calcium and phosphate
Total, soluble and diffusible calcium and phosphate were measured. Concentrates and supernatants (1 ml) were placed in pyrex test tubes and heated at 100 °C overnight, followed by a mineralization at 500 °C for 6 h in an isotemp muffle furnace (Fisher Scientific). The ashes were dissolved with 1 m nitric acid and then diluted with HPLC water. As the soluble phase will contain a fraction of ions associated with the proteins, the concentration was also measure in the diffusible phase of the supernatants after ultracentrifugation (100 000 × g, 1 h). Supernatants were transferred to ultrafiltration tubes with molecular weight cutoff of 10 kDa and centrifuged at 4000 × g for 1 h. The permeate was then analyzed to determine the amount of diffusible ions.
The calcium and phosphate were measured using 861 Advanced Compact IC (Ω Metrohm ion analysis, Metrohm Ltd., Herisau, Switzerland). A cation column (Metrosep C4/150, Metrohm) packed with 5-μm silica gel with weakly acidic carboxyl acid functional groups (RCO2−) was employed to determine the calcium. An anion column (Metrosep A Supp5-150/4.0, Metrohm) packed with 5 μm polyvinyl alcohol with quaternary ammonium groups was employed to determine the phosphate (Rahimi Yazdi et al., Reference Rahimi Yazdi, Ferrer and Corredig2010).
Chymosin induced gelation
Chymosin (rennet) with average strength of 300 international milk clotting units (IMCU)/ml (Danisco, Madison, USA) was diluted 50-fold in MilliQ water immediately prior use. The samples were incubated at 30 °C for at least 30 min, to reach equilibrium before addition of the diluted enzyme solution, at a proportion of 5.7 μl/ml of milk, to obtain a final concentration of enzyme in milk of about 0.034 IMCU/ml. After addition of rennet, milk samples were stirred for 30 s and then incubated at 30 °C. The κ-casein hydrolysis was monitored as a function of time using HPLC (Lopez-Fandino et al., Reference López-Fandiño, Acedo and Ramos1993). After addition of chymosin to the milk or concentrates, samples were divided in 2-ml aliquots in different test tubes. Samples were incubated at 30 °C, and the reaction was stopped at designated times (every 10 min) by addition of 4 ml of 3% trichloroacetic acid, and stored overnight at 4 °C. The samples were centrifuged 4500 × g for 15 min at 22 °C (Eppendorf centrifuge, 5415D, Mississauga, Canada) and then filtered through using 0.45 μm filters (syringe driven filters, Fisher Scientific). The content of CMP was then determined using reverse phase-HPLC (Lopez-Fandino et al., Reference López-Fandiño, Acedo and Ramos1993).
The gel formation was followed using a controlled stress rheometer. After the addition of chymosin, the milk samples were immediately transferred to a controlled stress rheometer (Paar Physica MCR301, Anton Paar, Graz, Austria), which was equipped with a concentric cylinder and an external water bath (Isotemp 3016, Fisher Scientific). The gel formation process of all milk samples was followed by oscillatory measurements, using a constant strain of 0.01 and a frequency of 1 Hz. The gelation point was defined as the point when the elastic modulus (G′) and viscous modulus (G″) cross over (tan δ, where δ is the phase angle = 1).
Statistical analysis
At least three replicates were conducted for each measurement. ANOVA and Tukey HSD were carried out on the experimental measurements with 95% confidence level using Minitab statistical package release 15 (Minitab Inc., State College, PA, USA).
Results and discussion
Sample characterization
The concentrated milk reached 11% concentration of protein in both UF and DF samples, as shown in Table 1. All samples had a pH of about 6.7 apart from DF retentates, which showed a pH of 6.9. The concentrates were also mixed with untreated skim milk and the mixes had comparable pH and protein concentration (5%), as shown in Table 1. In spite of the large kDa cut-off of the polymeric membranes, the filtration treatment did not show a significant permeation of the whey proteins, as the amount of residual native whey protein remained around 20% of the total protein in the suspension. There was no significant permeation of whey proteins even during DF. The amount of protein present in the unsedimented fraction (soluble) is also shown in Table 1. There was a smaller amount of soluble protein in the DF compared to the UF concentrate.
pH, total and soluble protein, total calcium and phosphate content for pasteurized skim milk (control), 4× UF, 4× DF and the two mixes prepared with UF or DF concentrates and skim milk to a final concentration of protein of 5%

Values are means from triplicate experiments, ±standard deviation. Average values in the same column with a different superscript letter are significantly different (P < 0.05).
In these experiments the water was not added continuously to the concentrate during DF, and this may have had an impact on permeation efficiency due to a significant gel layer deposit. A more detailed study on the effect of mode of DF on the colloidal equilibrium of the casein micelles and the consequences on membrane selectivity is needed. The amount of soluble protein in the concentrates ranged from 3.4 in UF to 3.1% in the DF concentrate. Once the concentrates were mixed with skim milk, the amount of soluble protein decreased significantly, because of precipitation in the presence of a higher concentration of soluble calcium (Sandra and Corredig, Reference Sandra and Corredig2013). Concentrates had higher values of total calcium and phosphate, with DF showing lower values compared to UF, due to the increased permeation of the soluble fraction in these samples. Once the UF and DF concentrates were mixed with untreated milk, the two treatments showed comparable composition.
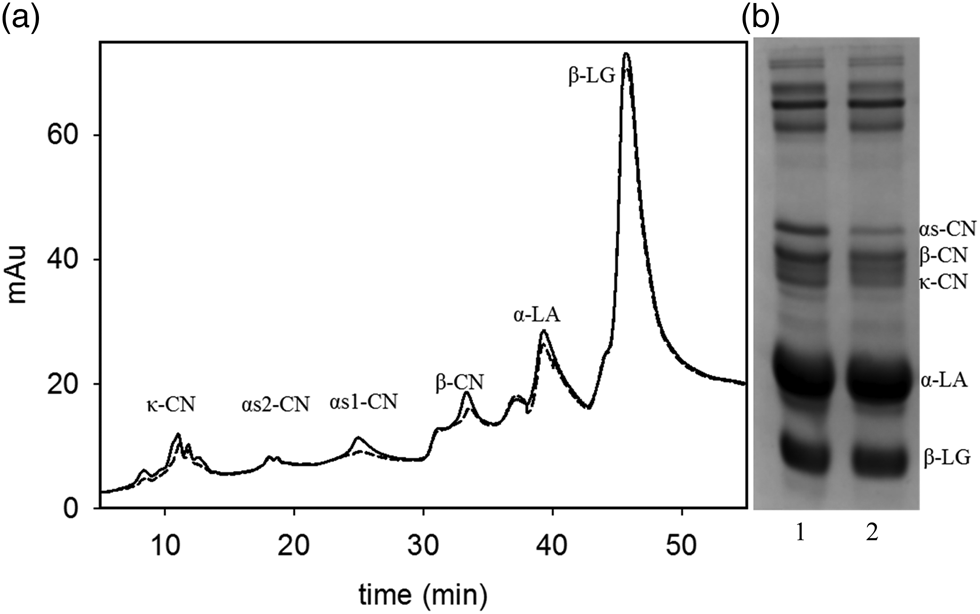
The composition in the unsedimented fraction of the concentrates was further characterized. The protein composition was measured using RP-HPLC and SDS-PAGE, as shown in Fig. 1. The main proteins present in the supernatant were β-lactoglobulin and α-lactalbumin, which accounted for about 73% of total protein area. A small fraction of dissociated caseins was also recovered in the unsedimentable fraction. There was a lower level in the DF concentrates, compared to UF, especially for the αs1- and β-casein. The difference in the casein ratios between UF and DF were also confirmed during the SDS PAGE analysis, as shown in Fig. 1b. The band intensities for αs1-, β- and κ-caseins decreased significantly for the DF sample compared to the UF samples. These differences were no longer observed once the concentrates were diluted with untreated skim milk at a final concentration of 5% protein.
Protein composition of supernatants separated after ultracentrifugation at 100 000 g for 1 h, measured by HPLC (a) and SDS-PAGE (b) for 4× UF (solid line and lane 1) and 4× DF (dotted line and lane 2). Representative samples.

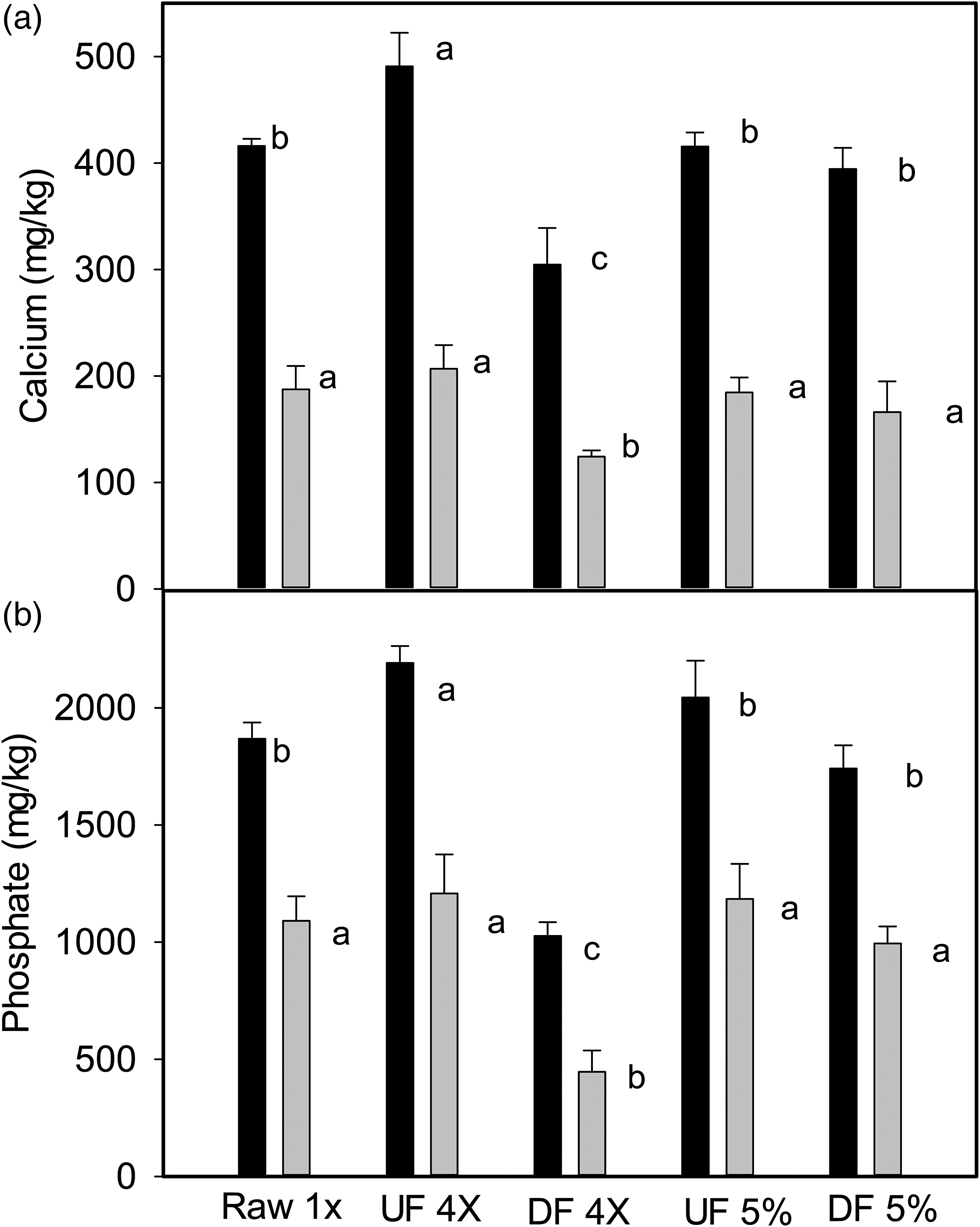
In addition to protein composition, the concentration of soluble and diffusible calcium and phosphate was also measured in the centrifugal supernatant, as shown in Fig. 2. As expected, due to the dilution with water, there was a clear decrease in the amount of diffusible calcium and phosphate after DF treatment. Soluble calcium and phosphate values were significantly higher than the concentration of diffusible ions, clearly indicating that both calcium and phosphate were associated with proteins, both soluble caseins and whey proteins, in the centrifugal supernatant. The UF suspensions showed a slightly higher level of soluble calcium and phosphate than the original untreated skim milk, in spite of the higher values of total calcium and phosphate, indicating a high extent of ionic permeation during the process of concentration. The free (diffusible) calcium and phosphate was comparable to that of the original skim milk, in spite of the higher amount of total ions present in the samples (see Table 1). This is of great significance, as the ratio of caseins to diffusible calcium in these samples is much higher than that of the original milk. Furthermore, diafiltration decreased both serum and diffusible ions. After diafiltration, for example, the soluble calcium decreased greatly, from 490 ± 31 mg/kg in the UF concentrate to 300 ± 34 mg/kg, and the concentration of diffusible calcium also showed a decrease. The same behavior was also shown for phosphate ions, which were significantly lower in the 4× DF samples compared to UF (Fig. 2b).
Concentration of soluble (black bars) and diffusible (gray bars) calcium (a) and phosphate (b) in pasteurized skim milk (control), 4× UF, 4× DF and the mixtures prepared with UF and DF concentrates added to skim milk control at a final protein concentration of 5% (w/v). Data are presented as means with bars indicating standard deviations. Within a group, letters indicate significant differences (P < 0.05).

Once the concentrates were mixed with untreated skim milk, there were no longer significant differences in the amount of soluble and diffusible ions (Fig. 2a and b), as well as the total ions which were higher than those of the original untreated milk. No significant difference in the amount of soluble calcium could be detected for the standardized milk samples (5%) using 4× DF and 4× UF milk.
It has previously been reported that the casein to calcium ratio, the colloidal calcium levels (much higher in the membrane filtration concentrates compared to skim milk) and the concentration of soluble proteins and free, diffusible calcium are all factors playing important roles in the formation of rennet-induced gelation of milk (Lucey et al., Reference Lucey, Gorry, Kennedy, Kalab and Fox1996; Sandra and Corredig, Reference Sandra and Corredig2013). The current study will shed more light on the factors affecting the gelation behavior of caseins, as the caseins in the UF concentrates contained a higher level of colloidal calcium and similar levels of free calcium in the serum phase, compared to untreated skim milk. After mixing the concentrates with untreated skim milk, compositionally, the mixtures did not show significant differences in the phase composition, and this should result in no effects in the gelation behavior of the caseins, in spite of the processing history.
Hydrolysis of κ-casein
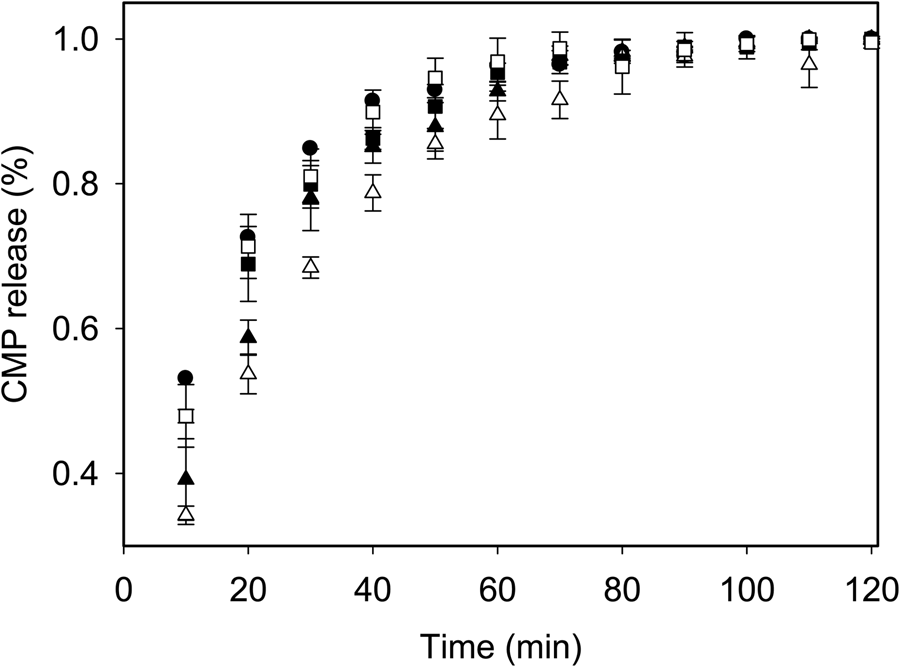
The hydrolysis of the κ-casein layer surrounding the native micelles during gelation is the first and critical step for inducing the coagulation of the casein particles. The enzymatic rate is affected by the ionic composition of the serum phase and the pH (Corredig and Salvatore, Reference Corredig, Salvatore, McSweeney and O'Mahony2016), albeit the final aggregation is not affected by the concentration of the casein micelles (Sandra et al., Reference Sandra, Cooper, Alexander and Corredig2011). Figure 3 illustrates the CMP release, as a % of the total κ-casein present, for different treatments. Skim milk, 4× UF and the standardized mixes at 5% protein, all showed similar hydrolysis behavior. The same amount of chymosin was added to all samples. The results indicate that the concentration of κ-casein may be rate determining when it is present in native casein micelles, but only at the early stages of hydrolysis, since it reaches plateau at a similar time as for pasteurized control skim milk. At the native pH of milk (about 6.8), chymosin induced gelation occurs when more than 85% of CMP is released into the serum phase (Dalgleish, Reference Dalgleish1983). When compared to skim milk (Fig. 3, filled circles), the concentrated samples (both DF and UF) showed a slower CMP release in the first 20 min. The UF samples, however, reached plateau at a similar time as pasteurized milk control. These samples had a higher level of colloidal calcium phosphate, due to the higher volume fraction of the casein micelles, but similar levels of diffusible calcium (Fig. 2). In contrast, the DF concentrate showed a slower hydrolysis rate. This delay can be attributed to the lower level of diffusible calcium (Fig. 2). As a result, a much longer time (about 60 min) was needed to reach 85% hydrolysis of κ-casein for DF milk compared to the UF milk (about 40 min).
Amount of caseinomacropeptide (CMP) released as a function of time after addition of chymosin. Control skim milk (filled circle), 4× UF (filled triangle), 4× DF (empty triangle), 5% UF (filled rectangle) and 5% DF (empty rectangle). Data, reported as % of total κ-casein, are presented as means ± standard deviation.

The mixes containing pasteurized skim milk and concentrates (UF or DF) at 5% protein showed similar hydrolysis rates as those of control skim milk, further emphasizing the role of soluble calcium in determining the rate of κ-casein hydrolysis by chymosin. The removal of minerals during the diafiltration process decreased the screening effect on the κ-casein surface layer.
To further understand the possible changes occurring to the casein micelles in UF and DF concentrates, the hydrodynamic radius of the micelles of DF and UF milk was measured using dynamic light scattering in their corresponding permeate. The casein micelles from UF concentrates showed an average radius of 83 ± 2 nm, similar to that of the original skim milk. In contrast, a smaller radius of 75 ± 3 nm was measured in the DF samples. The smaller size may be caused by a solubilization of casein from the colloidal phase. However, the light scattering analysis was performed after extensive dilution of the concentrates, so this could have also be attributed to a different stability to dilution of the micelles present in the two suspensions.
Rheological properties after addition of chymosin
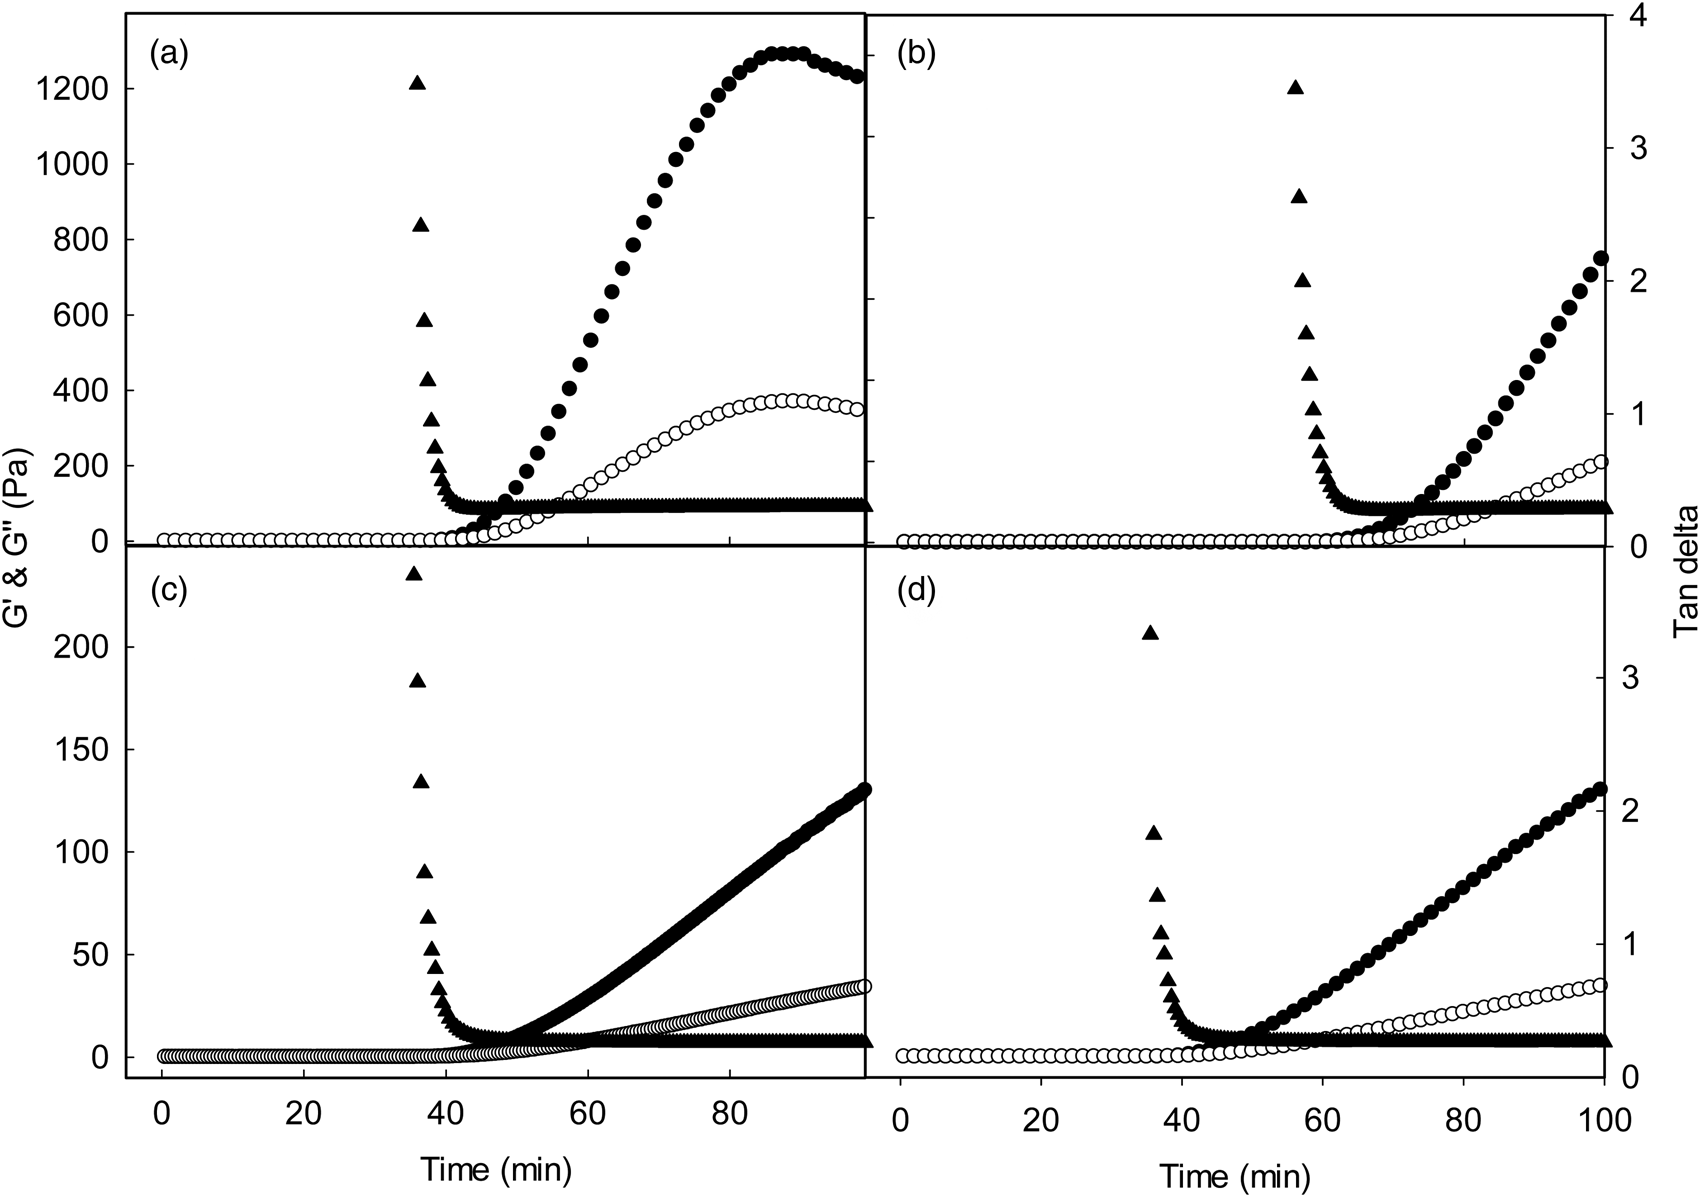
Although the average distance between the casein micelles decreases in concentrated milk, and there is an increase in particle-particle interactions, the gelation time induced by chymosin was not affected in the UF suspensions. This can be attributed to the fact that the charge and steric repulsion caused by κ-casein needs to be substantially decreased before the casein micelles will initiate coagulation (Sandra et al., Reference Sandra, Cooper, Alexander and Corredig2011). Figure 4 illustrates the development of structure for concentrates and concentrates mixed with untreated skim milk at a final protein concentration of 5%, after the addition of chymosin. The average values of G′, G″ and tan δ are also summarized in Table 2. Control pasteurized skim milk showed a gelation point of about 43 min. This gelation time was not different for 4× UF, in spite of the higher protein concentration. The firmness of the gel (indicated by the value of G′ measured 45 min after gelation) was much higher, due to the higher number of linkages present in the network. Once the casein micelles initiated aggregation (Fig. 3a) there was a steep increase of the G′ value indicating the formation of a stiff network. The value of tan δ did not differ from those for 1× skim milk gels, indicating a similar type of gel network, with similar viscoelastic properties. The values of tan δ at plateau indicated the final gel properties, such as the flexibility of the gel (Mishra et al., Reference Mishra, Govindasamy-Lucey and Lucey2005). The results confirmed that partial removal of whey proteins using UF has no significant influence on the development of rennet-induced gelation and final gel properties.
Rheological parameters measured after addition of chymosin to 4× UF (a), 4× DF (b), 5% protein UF mix (c), 5% protein DF mix (d). Representative runs showing Tan δ (triangles), G′ (filled circles), G″ (empty circles). For statistical analysis see Table 2.

Rennet gelation parameters measured by rheology after addition of chymosin for pasteurized skim milk (control), 4× UF, 4× DF and the two mixes prepared with UF or DF concentrates and skim milk to a final concentration of protein of 5% (w/v)

Values are means of triplicate experiments, ±standard deviation. Average values in the same column with a different superscript letter are significantly different (P < 0.05).
In contrast, the 4× DF sample showed a significant delay in gelation, with a much longer gelation point at 60 min, corresponding to the plateau reached in Fig. 3 where >85% of κ-casein was hydrolyzed after 60 min from addition of chymosin. The delay was, therefore, due to the delayed first stage of aggregation. However, even after the gel point, a lower elastic modulus was measured, with a value at 45 min in 4× DF milk significantly lower than that for 4× UF, in spite of a similar casein volume fraction. This is remarkable, as it indicates that the colloidal calcium phosphate content, and different amount of soluble protein (Table 1) will affect the number of linkages in the network. The Tan δ value of the gel network in this case was also higher, and this suggests also a greater extent of rearrangements and mobility within the network (Table 2) compared to UF concentrated suspensions. In sum, the decreased stiffness of the DF concentrates network is a result of a decreased soluble calcium level (as shown in Fig. 1), a change in the distribution of soluble and colloidal caseins, and the difference in the ratio between colloidal and soluble calcium, all of which have been demonstrated to be important in the formation of rennet-induced casein network (Choi et al., Reference Choi, Horne and Lucey2007; Sandra and Corredig, Reference Sandra and Corredig2013).
Figure 4 also shows the gelation behavior of UF and DF concentrates once added to pasteurized skim milk, to a final concentration of 5%. The effects shown above could, therefore, be reversed when DF concentrates were re-diluted in skim milk, and the diffusible calcium availability increased. In this case, no significant differences were shown in the gelation behavior between the two treatments. This is of practical significance, as often the concentrates are used to standardize cheese milk.
In conclusion, we demonstrated that diafiltration, because of the changes to the ionic equilibrium between the colloidal and the soluble phase, significantly affects the chymosin induced gelation of casein micelles. On the other hand, the microfiltration process, with the separation of the whey proteins from the caseins without DF, has no influence on the aggregation behavior of the suspensions. The DF process caused an impaired hydrolysis of the casein micelles, due to the decreased level of soluble calcium. In addition, the DF concentrates showed lower gel firmness ad higher viscoelastic properties compared to those of UF concentrates. This was caused by a change in the balance of soluble and colloidal composition in the suspensions. The results also show that these differences could be reversed when the concentrates were re-diluted with pasteurized skim milk, to a final concentration of 5% (w/v) of protein. In this case, they showed a comparable gelation behavior.
Acknowledgements
We gratefully acknowledge the financial and material supports from Gay Lea Foods Co-Operative Ltd and Mitacs Elevate program.