




No CrossRef data available.
Article contents
Executive functioning in children with autism and Tourette syndrome
Published online by Cambridge University Press: 12 May 2005
Abstract
The main aims of this study were to investigate if children with high-functioning autism (HFA) and children with Tourette syndrome (TS) can be differentiated in their executive functioning (EF) profile compared to normal controls (NCs) and compared to each other and to investigate whether children with HFA or children with TS and a comorbid group of children with both disorders are distinct conditions in terms of EF. Four groups of children participated in this study: HFA, TS, comorbid HFA + TS, and a NC group. All children were in the age range of 6 to 13 years. The groups were compared on five major domains of EF: inhibition, visual working memory, planning, cognitive flexibility, and verbal fluency. Children with HFA scored lower than NC children on all the EFs measured. Children with TS and NC children showed the same EF profile. The HFA group scored lower than the TS group for inhibition of a prepotent response and cognitive flexibility. Children with HFA performed poorer than children with comorbid HFA + TS on all functions, with the exception of inhibiting an ongoing response, interference control, and verbal fluency. Children with TS and children with comorbid HFA + TS could not be differentiated from one another in terms of EF. This study indicates that EF deficits are highly characteristic of children with HFA in comparison to children with TS and NC. The results suggest that for the comparison between HFA and TS groups, it is important to take into account comorbidity. A reevaluation of the EF hypothesis in children with TS is suggested.
We thank the children and parents without whose participation this research would not have been possible.
Information
- Type
- Research Article
- Information
- Copyright
- © 2005 Cambridge University Press
Autism is a lifelong developmental disorder with a triad of characteristic symptoms: (a) qualitative impairment in social interactions; (b) qualitative impairment in communication; and (c) restricted, repetitive, and stereotypic patterns of behaviors, interests, and activities (American Psychiatric Association [APA], 2000; Filipek et al., 1999). Autism is a part of the broader category of autism spectrum disorders. Multiple studies have identified executive functioning (EF) deficits in autism (Ozonoff, 1997; Russell, 1997; Sergeant, Geurts, & Oosterlaan, 2002). EF refers to cognitive functions mediated by the prefrontal cortex (Becker, Isaac, & Hynd, 1987; Cabeza & Nyberg, 2000; Fuster, 1997; Reitan & Wolfson, 1994; Rezai, Andreasen, Alliger, Cohen, Swayze, & O'Leary, 1993; Tranel, Anderson, & Benton, 1994), such as inhibition, working memory, cognitive flexibility or set shifting, planning, and verbal fluency (Ozonoff, 1997; Pennington & Ozonoff, 1996; Reader, Harris, Schuerholz, & Denckla, 1994; Weynandt & Willis, 1994). EFs are mental control processes that enable self-control necessary for the attainment of a future goal (Denckla, 1996; Lezak, 1995; Pennington & Ozonoff, 1996; Welsh & Pennington, 1988). Deficits have been found in studies of children, adolescents, as well as in adults with autism (e.g., Ozonoff, 1997; Ozonoff & Strayer, 1997; Pascualvaca, Fantie, Papageorgiou, & Mirsky, 1998; Russell, 1997; Shu, Lung, Tien, & Chen, 2001; Turner, 1999a). A wide variety of measures with subjects varying in chronological age and level of functioning have been used across EF studies in autism. It should be noted that EF deficits become more prominent with age. Usually, little EF problems are found in preschoolers with autism (Dawson, Munson, Estes, Osterling, McPartland, Toth, Carver, & Abbott, 2002; Griffith, Pennington, Wehner, & Rogers, 1999; Rogers & Bennetto, 2000). According to Dawson et al. (2002), autism-specific deficits become more apparent with the maturation of the frontal lobe. It appears that school age children with autism have problems in planning, cognitive flexibility, working memory, and verbal fluency. In contrast, children with autism have usually no difficulty with inhibition (Ozonoff, 1997; but see Geurts, Verté, Oosterlaan, Roeyers, & Sergeant, 2004).
However, deficiencies in EF have been linked to several other developmental disorders, including attention-deficit/hyperactivity disorder (ADHD), conduct disorder, obsessive–compulsive disorder (OCD), and Tourette syndrome (TS; for a review, see Ozonoff, 1997; Pennington & Ozonoff, 1996; Sergeant et al., 2002). Hence, one may ponder on the specificity of the EF hypothesis for developmental psychopathologies (Pennington, Bennetto, McAleer, & Roberts, 1996). The specificity problem can be partially resolved if there are differences in EF profiles between different disorders or in the degree of a deficit in a specific EF domain. A third possibility is that the EF deficits found in some groups are due to the comorbidity of that diagnosis with another diagnosis (Pennington & Ozonoff, 1996). The issue of comorbidity is a neglected aspect in many previous studies of EF in developmental psychopathology.
Multiple comparisons with other clinical groups are required to understand how EF deficits might be related to autism in a way that differentiates it from other disorders (Sergeant et al., 2002). An interesting comparison is between autism and TS. TS is a developmental disorder characterized by multiple involuntary motor tics and a least one vocal tic, with a duration of at least 1 year (APA, 2000). Until now, only one research group has reported comparisons between children with autism and TS (Ozonoff & Jensen, 1999; Ozonoff & Strayer, 1997; Ozonoff, Strayer, McMahon, & Filloux, 1994). TS is an interesting comparison group because of the following overlapping behavioral characteristics with autism: repetitive movements, stereotypes, echo phenomena, self-injurious, and compulsive behaviors are common in children with autism and in a subset of TS without autism (Barnhill & Horrigan, 2002; Turner, 1999b). Furthermore, according to Bradshaw (2001), both autism and TS are frontostriatal neurodevelopmental disorders. There are many differences between autism and TS, but the similarities they share make the comparison of these two clinical groups with respect to their specific EF profile an interesting one. One hypothesis is that the movements and utterances of TS reflect a failure of an inhibitory system mediated by executive and prefrontal dysfunction (Ozonoff, 1997; Ozonoff, Strayer, McMahon, & Filloux, 1998; Pennington & Ozonoff, 1996). Deficits in adults and children with TS have been reported for inhibition, letter fluency, and working memory. Hence, a difference on the inhibition domain for TS and high-functioning autism (HFA) may be expected. Subjects with TS appear to have relatively good capacity for cognitive flexibility and planning. Although deficits have been found, studies reveal inconsistent findings: some find evidence of EF deficits (De Groot, Yeates, Baker, & Bornstein, 1997; Harris, Schuerholz, Singer, & Reader, 1995; Mahone, Koth, Cutting, Singer, & Denckla, 2001), while others do not (Cirino, Chapieski, & Massman, 2000; Ozonoff & Jensen, 1999).
In this study, the operationalization of EF was based on Pennington and Ozonoff's classification (1996, p. 53) with five functions: inhibition, visual working memory, planning, cognitive flexibility, and verbal fluency. To deal with the inconsistent findings of earlier studies, some important innovations of this study are noted.
First, children with HFA and TS were compared on a battery of EF tasks covering five EF domains, while most studies covered only two or three domains. In this study, well-established EF tasks were selected. Most tasks have already been validated as measures of prefrontal functioning; including studies with brain-damaged subjects, and by reports using functional magnetic resonance imaging and positron emission tomography (e.g., Gaillard, Hertz–Pannier, Mott, Barnett, LeBihan, & Theodore, 2000; Riehemann, Volz, Stuetzer, Smesny, Gaser, & Sauer, 2001; Rowe, Owen, Johnsrude, & Passingham, 2001). Task selection was also determined by their previous use in EF studies of developmental psychopathology with one of the clinical groups (e.g., Ozonoff, 1997; Pennington & Ozonoff, 1996).
Second, a novel addition here was the inclusion of non-EF tasks. Performance on most EF tasks is dependent on other cognitive domains, such as attention, perception, aspects of language, and memory (Eslinger, 1996; Lezak, 1995; Pennington et al., 1996; Welsh & Pennington, 1988). It is important to show that poor performance on a specific EF task does not simply reflect generalized cognitive impairment, reflected in poor non-EF performance (Denckla, 1996).
Third, a limitation of most studies is that they generally made little or no verification of the diagnoses and did not exclude participants that used medication. In this study, an identical extensive selection procedure was used for the assignment to the specific groups. The attempt to distinguish disorders in their EF profile can only be established with thoroughly defined clinical groups (Sergeant et al., 2002). Only children who did not use medication (or had discontinued medication) participated in the study.
Fourth, a limitation of many previous studies is that they disregarded the issue of comorbidity. Although autism can co-occur with TS (Barnhill & Horrigan, 2002; Baron–Cohen, Mortimore, Moriarty, Izaguirre, & Robertson, 1999; Burd, Kerbeshian, Wilkenheiser, & Fisher, 1986; Kadesjoe & Gillberg, 2000; Ringman & Jankovic, 2000; Sverd, 1991; Sverd, Montero, & Gurevich, 1993), no study to date has made a direct comparison between children with autism, TS, and a comorbid group of children with both disorders. Examination of the contribution of ADHD and OCD as dimensions in disorders such as autism and TS is also important, because they are frequently found in both disorders (Brown & Ivers, 1999; Fombonne, 1998; Golden, 1990; Jankovic, 2001; Kadesjoe & Gillberg, 2000; Leckman & Cohen, 1999; McDougle, Kresch, Goodman, Naylor, Volkmar, Cohen, & Price, 1995; Sheppard, Bradshaw, Purcell, & Pantelis, 1999; Spencer, Biederman, Harding, O'Donnell, Wilens, Faraone, Coffey, & Geller, 1998; Volkmar, 1999). Unlike most previous research, we controlled for the presence of ADHD or OCD, because they are behavioral dimensions in which EF deficits have been implicated (Sergeant et al., 2002). How far earlier findings reflect deficits specific to autism or TS or are due to comorbidity is unclear. Although a diagnosis of autism excludes a comorbid diagnosis of ADHD or OCD according to the Diagnostic and Statistical Manual of Mental Disorders, Fourth Edition, Text Revision (DSM-IV-TR; APA, 2000), many children meet the criteria for both disorders (Clark, Freehan, Tinline, & Vostanis, 1999; Ghaziuddin, Weidmer–Mikhail, & Ghaziuddin, 1998; Muris, Steerneman, Merckelbach, Holdrinet, & Meesters, 1998; Turner, 1999b). Furthermore, comorbidity of TS and ADHD or OCD is possible (APA, 2000).
The present study had three major aims. The first aim of the study was to determine the EF profile of children with HFA and children with TS compared to normal control (NC) children as well as compared to each other. We had the following hypotheses for the HFA group: they were predicted to have deficits in visual working memory, cognitive flexibility, planning, and verbal fluency, but not in inhibition. Because of inconsistencies in findings for TS, we have proposed tentative hypotheses for the TS group (based on a conjunction of the most important studies in children with TS): they were expected to have deficits in inhibition, visual working memory, and verbal fluency, but not in cognitive flexibility and planning. The second aim was to investigate whether children with HFA or children with TS and a comorbid HFA + TS group are distinct conditions in terms of EF. We did not have specific hypotheses for this HFA + TS group. The third aim was to investigate the role of comorbid ADHD and OCD characteristics in HFA and TS, with respect to EF.
Method
Participants
Four groups of children are reported in this study: 61 children with HFA, 24 children with TS, 17 children with comorbid HFA and TS (HFA + TS), and 47 NC children. All children were in the age range of 6–13 years.
Prior to participation, parents were informed about the aims of the study, received a full description of the study, and written consents were obtained. Only children with a clinical diagnosis based on a multidisciplinary assessment and children who did not use medication (or used medication that could be discontinued, e.g., methylphenidate) participated in the study. Children were excluded if parents reported a history of epileptic seizures. Furthermore, a three-stage selection procedure was used. At the first stage, parents and teachers were asked to complete questionnaires to obtain a broad view on the overall functioning of the child. Parents completed the Children's Communication Checklist (CCC; Bishop, 1998; Dutch translation, Hartman, Guerts, Bennink, Verté, Roeyers, Sergeant, & Bishop, 1998), the Disruptive Behavior Disorder (DBD) rating scale (Pelham, Gnagy, Greenslade, & Milich, 1992; Dutch translation, Oosterlaan, Scheres, Antrop, Roeyers, & Sergeant, 2000), the Leyton Obsessional Inventory—Parent Version (LOI-PV; Berg, Whitaker, Davies, Flament, & Rapoport, 1988; Dutch translation, Scholing & Veenstra, 1997), and the TS Symptom List (TSSL; Cohen, Leckman, & Shaywitz, 1985; Dutch translation, Buitelaar & van de Wetering, 1996). Teachers completed the same questionnaires, except the LOI-PV. The questionnaires were used as selection instruments in the NC group only (see further). In the clinical groups, the questionnaires were used to obtain a description of possible comorbid disorders. Intellectual functioning was assessed at the second stage. Four subtests (vocabulary, arithmetic, picture arrangement and block design) of the Wechsler Intelligence Scale for Children—Revised (WISC-R; Van Haasen, De Bruyn, Pijl, Poortinga, Spelberg, Vander Steene, Coetsier, Spoelders–Claeys, & Stinissen, 1986) were administered. This short version of the WISC-R is standardly applied in our research group. The IQ estimated on the basis of these subtests has high correlations (r = .93 to r = .95) with full-scale IQ (FSIQ; Groth–Marnat, 1997). Children were excluded from the study if their estimated FSIQ was below 80. At the third stage, diagnoses of the children in the clinical groups were verified using the Autism Diagnostic Interview—Revised (ADI-R; Lord, Rutter, & Le Couteur, 1994) and the Diagnostic Interview Scale for Children for DSM-IV (DISC-IV; Shaffer, Fisher, Lucas, Dulcan, & Schwab–Stone, 2000; Dutch translation, Ferdinand, Van der Ende, & Mesman, 1998). Group assignment in the clinical samples was based on the assessment of the children in these interviews (see below).
Diagnostic measures
CCC
The CCC (Bishop, 1998; Dutch translation, Hartman et al., 1998) was developed to measure aspects of communicative impairment and covers mainly the pragmatic skills necessary in the use of social language. The CCC contains 70 items that are scored on a 4-point scale (does not apply, applies somewhat, definitely applies, and unable to judge). The items are grouped in nine scales: (a) speech output: intelligibility and fluency; (b) syntax; (c) inappropriate initiation; (d) coherence; (e) stereotyped conversation; (f) use of conversational context; (g) conversational rapport; (h) social relationships; and (i) interests. The pragmatic composite score is an overall measure of pragmatic skills and consists of the summed score of scales (c)–(g). Lower scores indicate greater impairment. Adequate psychometric properties have been reported and the pragmatic composite score is seen as a promising measure for the detection of children with an autism spectrum disorder (Bishop, 1998; Bishop & Baird, 2001). In this study, the CCC was used to assess the children's pragmatic abilities.
DBD
The DBD (Pelham et al., 1992; Dutch translation, Oosterlaan et al., 2000) was developed to measure externalizing disorders. The DBD contains 42 items that are scored on a 4-point scale (not at all, just a little, pretty much, and very much). The questionnaire contains four scales composed of the DSM-IV items for ADHD inattentive subtype, ADHD hyperactive/impulsive subtype, oppositional defiant disorder, and conduct disorder. The higher the score on the DBD, the more the child is impaired. Adequate psychometric properties have been reported (Oosterlaan et al., 2000). The DBD was used for additive information on possible comorbid externalizing disorders.
LOI-PV
The LOI-PV (Berg et al., 1988; Dutch translation, Scholing & Veenstra, 1997) searches for the presence or absence of a number of obsessions and compulsions. For each positive response, the respondent rates interference in personal functioning on a 4-point scale (no interference to interferes a lot). The 20 items are grouped into four domains: general obsessive, dirt contamination, numbers luck, and school. A composite score was calculated to establish an overall measure of possible comorbid obsessive–compulsive behavior. Higher scores indicate greater problems. Sound psychometric properties have been reported for the child version of this instrument (Berg et al., 1988; Flament, Whitaker, Rapoport, Davies, Berg, Kalikow, Sceery, & Shaffer, 1988; King, Inglis, Jenkins, Myerson, & Ollendick, 1995).
TSSL
The TSSL (Cohen et al., 1985; Dutch translation, Buitelaar & van de Wetering, 1996) measures the number, type, and severity of current and past tics. The TSSL is a 41-item symptom list and ratings are made on a 6-point scale from 0 (symptom-free) to 5 (symptoms almost always present). The ratings can be summed to provide a measure of the number and severity of simple as well as complex motor tics (e.g., blinking and grimacing, respectively) and of simple as well as complex vocal tics (e.g., noises and coprolalia, respectively). The total score of all the scales was calculated to establish an overall measure of the presence of tics. Higher scores indicate the presence of more tics. The TSSL was included to verify the presence of at least two motor tics and at least one vocal tic for all subjects with TS, as required by DSM-IV-TR criteria.
ADI-R
The ADI-R (Le Couteur, Rutter, Lord, Rios, Robertson, Holdgrafer, & McLennan, 1989; Lord, 1997; Lord et al., 1994; Lord, Storoschuk, Rutter, & Pickles, 1993) is a comprehensive semistructured interview for parents or principal caregivers that probes for symptoms of an autism spectrum disorder, and for the diagnosis of infantile autism in particular. The ADI-R focuses primarily on (a) qualitative impairment in social interactions; (b) qualitative impairment in communication; and (c) restricted, repetitive, and stereotypic patterns of behaviors, interests, and activities. The ADI-R also covers a variety of behaviors that frequently occur in autism spectrum disorders. Parent responses are coded on a 4-point scale according to the quality and severity of symptoms (0 = normal for developmental level, 3 = severely autistic). The scores are summed in each of the three domains listed above. If scores for all three domains reach specified cutoffs, and if there is evidence of developmental abnormality before the age of 36 months, an autism spectrum diagnosis is suggested. The ADI-R is currently considered as the “gold standard” diagnostic instrument for autism spectrum disorders (Filipek et al., 1999). The ADI-R was administered to confirm the autism spectrum diagnosis in the HFA groups and to exclude an autism spectrum disorder in the TS group. A diagnosis of HFA was made if the scores on the ADI-R reached the cutoffs for all three domains.
DISC-IV
The DISC-IV (National Institute of Mental Health [NIMH], Shaffer et al., 2000; Dutch translation, Ferdinand et al., 1998) is a structured diagnostic interview. The following sections were used: (a) DBDs (ADHD, oppositional defiant disorder [ODD], conduct disorder [CD]); (b) OCD, part of the anxiety disorders section; and (c) TS, part of the miscellaneous disorders section. Adequate reliability and validity have been reported for precursors of the DISC-IV (Schwab–Stone et al., 1996).
Group selection
HFA
Ninety-nine children with a clinical autism spectrum diagnosis were recruited for participation through rehabilitation centers, special school services, and other agencies specialized in the care of children with autism. Two children were excluded because of epileptic seizures. Eleven children were excluded because of medication use that could not be discontinued. Twelve children with an estimated IQ below 80 were also excluded. Based on the results of the ADI-R, two children were excluded because they did not meet the criteria for HFA. Based on the tic disorders section of the DISC-IV, 11 children were assigned to the HFA + TS group. Hence, 61 children were assigned to the HFA group. Of these 61 children, 14 met criteria for comorbid OCD, 15 for comorbid ADHD, and 6 for both OCD and ADHD on the basis of the DISC-IV. It should be noted that for most of the children, comorbidity was not clinically ascertained. Chi-square tests were performed to analyze if the distribution of comorbidities was equal within the different groups. Besides ADHD as such, we examined inattention and hyperactivity separately, because a different distribution may exist for both parts of ADHD. The distribution of HFA versus the other disorders was comparable for ADHD, χ2 (1) = .58, ns, and hyperactivity, χ2 (1) = .23, ns, but not for inattention, χ2 (1) = 6.53, p = .01, and OCD, χ2 (1) = 5.90, p = .02.
TS
Fifty-three children with TS were recruited for participation from the national parent's association of children with tic disorders and through mental health professionals (e.g., child psychiatrists and physicians). Nineteen children were excluded because of medication that could not be discontinued. One child was excluded because he showed no current tics. Three children refused further participation. Six children met criteria for HFA and were assigned to the HFA + TS group. All of these children had a clinical autism spectrum diagnosis. Twenty-four children were assigned to the TS group. Of these 24 children, 8 met criteria for comorbid OCD, 6 for comorbid ADHD, and 8 for both OCD and ADHD on the basis of the DISC-IV. In the TS group, for one third of the children, comorbidity was also clinically ascertained. The distribution of TS versus the other disorders was comparable for ADHD, χ2 (1) = .63, ns, inattention, χ2 (1) = 3.03, ns, and hyperactivity, χ2 (1) = .07, ns, but not for OCD, χ2 (1) = 9.29, p = .002.
NC
Parents of 63 children from three regular schools gave permission to participate in the study. Children were excluded from the study if (a) the parent or the teacher stated that the child had ever had a clinical diagnosis or used medication, (b) their FSIQ estimate was below 80, (c) the score on one of the four scales of the DBD exceeded the 80th percentile, (d) the pragmatic composite score on the CCC fell within 2 standard deviations of the mean score of the HFA group, (e) the total score on the TSSL fell within 2 standard deviations of the mean score of the TS group, or (f) the teacher refused to complete the questionnaires. Forty-seven children fulfilled the inclusion criteria for the NC group.
Neuropsychological measures
Both EF and non-EF control tasks were administered in this study. See Table 1 for an overview. The EF tasks were selected to measure the domains of EF as suggested by Pennington and Ozonoff (1996, p. 53). The commonly used dependent variables were selected for each task. Because EF tasks are seldom pure measures of a single EF domain (e.g., Ozonoff, 1997), more than one task was included for some domains (e.g., inhibition, cognitive flexibility, and verbal fluency) to ensure that the domain was adequately covered, and that possible deficits are not due to the task chosen.
Overview of tasks and their dependent variables

EF tasks and dependent measures.
Change task
The change task (De Jong, Coles, & Logan, 1995; Logan & Burkell, 1986; Oosterlaan & Sergeant, 1998) was included to measure (a) inhibition of a prepotent response, (b) response execution, and (c) cognitive flexibility. Several studies have found that performance on the stop signal task (Logan, 1994), a variant of the change task, is associated with right prefrontal cortex functioning (e.g., Rubia, Overmeyer, Taylor, Brammer, Williams, Simmons, & Bullmore, 1999). The task consisted of two types of trials: go trials and stop trials. The trials were presented in blocks of 64 trials. Go trials (75%) required children to locate the position of an aircraft that was displayed to the left or right of a fixation point on a computer screen by pressing a left or right button. Stop trials (25%) were identical to go trials, but in addition an auditory stop signal was presented, which directed children to (a) inhibit their response and (b) immediately perform a different response, the change response (i.e., pressing a third button). Stop signals were presented at four different “stop signal intervals”. The auditory stop signals were presented 50, 200, 350, and 500 ms before the subject's expected response. The expected response time was estimated from the child's mean reaction time (MRT) in the preceding block of trials. Oosterlaan and Sergeant (1998) provided a detailed description of the change task used in this study. The following dependent measures were derived from this task: (a) stop signal reaction time (SSRT), a measure of the latency of the inhibitory process; (b) MRT, a measure of the latency of the response execution process; (c) variability in the latency of the response execution process (response variability); (d) accuracy of responding as measured by the number of errors on the go trials (omission and commission errors); (e) change MRT as a measure of the latency of the set-shifting process; and (f) accuracy of cognitive flexibility (set shifting) as measured by the number of change response errors.
Circle Drawing Task
The Circle Drawing Task (Bachorowski & Newman, 1985, 1990) was used as a measure of inhibition of an ongoing response. The circle was 20 inches (50.80 cm) in diameter, drawn on a cardboard square, and covered with Plexiglas. The circle had a small line indicating the starting and the finishing point of the tracing. The word START (in green ink) was printed on the right side of this line and the word STOP (in red ink) was printed on the left side. The task was administered under two conditions: first with neutral instructions (“trace the circle”) followed by inhibition instructions (“trace the circle again, but this time as slowly as you can”). The dependent variable in this task was the time used to trace the circle in the slow condition minus the tracing time in the neutral condition. The greater the inhibition time, the better a participant was able to inhibit (slow down) the continuous tracing response.
Test of Everyday Attention for Children, Subtest Opposite Worlds (TEA-Ch)
The TEA-Ch (Manly, Anderson, Nimmo–Smith, Turner, Watson, & Robertson, 2001) was used as a measure of inhibition (interference control). In this test, the child was required to inhibit an automatic or prepotent verbal response. This test is comparable to the “day” and “night” test (Gerstadt, Hong, & Diamond, 1994; Passler, Isaac, & Hynd, 1985). In the neutral condition, the child has to name the digits 1 and 2 that are scattered along a path. In the suppression condition, the child was required to say “1” when he saw a “2” and “2” when he saw a “1.” In this second condition, the child has to perform the task in a novel way and suppress the routine manner of performing it. The experimenter pointed to the digits with the index finger and the child was required to respond aloud. If the child committed an error, the experimenter did not move to the next digit until the child had corrected the error. The dependent variable was the difference between the mean time required to complete two neutral conditions and two suppression conditions.
Self-Ordered Pointing Task (abstract designs; SoP)
The SoP (Petrides & Milner, 1982) was included to measure visual working memory. The SoP is one of the rare tests that have been validated as a relative selective frontal cortex measure, especially the middorsolateral frontal cortex (Petrides, Alivisatos, Evans, & Meyer, 1993). In this task, the children were presented with four series of cards containing respectively 6, 8, 10, and 12 abstract designs. The designs were relatively easy to distinguish from one another, but difficult to code verbally. For each series, the children were shown one card at a time (the positions of the designs varied randomly) and were instructed to point to a different design on each of the cards. Each series was presented three times in succession according to Petrides and Milner's administration (1982). The demand on working memory increased as the number of designs on each card increased during the task. The dependent variable in this task was the number of errors (i.e., the number of times a design was responded to more than once). Furthermore, the difficulty level (6, 8, 10, or 12 items) was taken into account. It was expected that there would be a linear relationship between the difficulty level and the number of errors. Therefore, the number of errors was measured for each difficulty level. It was expected that, if children have a deficit in visual working memory, the number of errors would increase more with an increasing difficulty level compared to children without a visual working memory problem.
Tower of London (ToL)
The ToL (Krikorian, Bartok, & Gay, 1994) was selected to tap planning (Shallice, 1982). Several studies suggest that ToL performance relies heavily on frontal cortex functioning, especially the left frontal cortex (e.g., Baker, Rogers, Owen, Frith, Dolan, Frackowiak, & Robbins, 1996; Dagher, Owen, Boecker, & Brooks, 1999; Levin, Mendelsohn, Lilly, & Fletcher, 1994; Rowe et al., 2001). Materials and procedures for administration and scoring were derived from Krikorian et al. (1994). Starting from a fixed arrangement of three colored balls (red, blue, and yellow) on two of three pegs, the child is required to copy a series of depicted end states by rearranging the balls. Twelve problems of graded difficulty were presented with allowance of a maximum of three trials to solve each problem. Three measures were derived. The main dependent variable was the ToL score, which was calculated by assigning points based on the number of trials required to solve a problem. There were three difficulty levels, with a maximum score of 12 points for each level. Total item scores were calculated for the whole test as well as for each of the three difficulty levels. Furthermore, two temporal measures were derived for the whole test as well as for each level of difficulty: (a) decision time, which is the time between the presentation of a problem and the initiation of the first move on a trial (ball leaves peg); and (b) execution time, which is the time between the initiation of the first move to the completion of the final move of a trial. These measures were derived for the first attempt on each problem. It was expected that there would be a linear relationship between the difficulty level and the dependent variables.
Wisconsin Card Sorting Test (WCST)
The WCST (Grant & Berg, 1948; Heaton, 1981; Heaton, Chelune, Talley, Kay, & Curtiss, 1993) is a widely used measure to tap cognitive flexibility or set shifting. Several studies have found that WCST performance relies on the right dorsolateral frontal cortex (e.g., Berman, Ostrem, Randolph, Gold, Goldberg, Coppola, Carson, Herscovitch, & Weinberger, 1995; Lombardi, Andreason, Sirocco, Rio, Gross, Umhau, & Hommer, 1999; Riehemann et al., 2001). In this study, the paper and pencil card version of Grant and Berg (1948) was used (see Heaton, 1981; Heaton et al., 1993). The dependent variable of interest was the percentage of perseverative responses. This percentage was calculated from the number of trials in which the child continued sorting by a previously correct category despite negative feedback, and the total number of cards the child needed to complete the task. A computer based scoring program was used to calculate the dependent variables (Harris, 1990).
Verbal fluency
An adaptation of the Controlled Word Association Task (Benton & Hamsher, 1978) was used to measure the capacity to generate novel responses. Several studies have shown that verbal fluency tends to be associated with left prefrontal functioning (e.g., Frith, Friston, Liddle, & Frackowiak, 1991; Gaillard et al., 2000; Phelps, Hyder, Blamire, & Shulman, 1997; Schlosser, Aoyagi, Fulbright, Gore, & McCarthy, 1998). The children were required to name as many examples of a particular category within 1 min. The dependent measures in this task were the total number of admissible words across the semantic categories “animals” and “food,” as well as across the letter categories K and M.
Non-EF control tasks and dependent measures.
Benton Visual Retention Test (BVRT)
The BVRT (Sivan, 1992) measures visual–spatial abilities and visual short-term memory. The BVRT consists of 10 designs, each containing one or more figures. The child was required to reproduce the designs immediately after they were presented for 10 s. The number of correct designs was the dependent measure (Lezak, 1995; Sivan, 1992).
Corsi Block Tapping Test (Corsi)
The Corsi (Corsi, 1972; Lezak, 1995; Milner 1971; Schellig, 1997) measures visual–spatial memory span (Berch, Krikorian, & Huha, 1998; Della Sala, Gray, Baddeley, Allamano, & Wilson, 1999; Lezak, 1995). The Corsi requires maintenance of spatial information but does not involve much explicit concurrent processing requirements, although the visual–spatial sketchpad seems to be closely related to the central executive (Miyake, Friedman, Rettinger, Shah, & Hegarty, 2001). In this task, the child has to begin to copy a three-block item. The number of items was increased by 1 after a particular difficulty level was successfully completed. There were three trials for each difficulty level. The test was terminated, after three consecutive errors within a particular difficulty level or after the eight-block items were administered. Schellig (1997) provided a detailed description of this task. The dependent variable was the visual memory span of the child, which is defined as the difficulty level for which the child was able to finish at least two trials successfully.
Categories of the Snijders–Oomen Non-Verbal Intelligence Test—Revised (SON-R)
Categories is one of the subtests of the SON-R (Snijders, Tellegen, & Laros, 1989; Tellegen & Laros, 1993) and measures semantic memory and the ability to categorize. In Categories, the child was first shown three pictures and has to decide what they have in common. Next, five pictures were presented to the child and the child was required to choose those two pictures that depict the same concept. After practicing, a maximum of 27 items was administered. Items were divided in three different series. Each series was terminated when the child made two consecutive errors. The dependent variable was the number of correct items.
Beery Visual Motor Integration (Beery-VMI)
The Beery-VMI (Beery, 1997) was designed to assess visual–motor integration or the degree to which visual perception and finger–hand movements are coordinated. The task consists of 27 geometric forms of increasing complexity presented on paper. The child was required to copy these forms. The test was terminated after three consecutive items for which the child earned no points. The dependent variable was the Beery standard score.
Procedure
When written consents were obtained from the parents, they were contacted by phone and appointments for the diagnostic interviews and neuropsychological testing of the children were made. The screening questionnaires for the parents and teachers were sent by mail. All the children were tested individually on three different occasions. During the first session, the WISC-R was administered. During the second and third session, the neuropsychological measures were administered. The tests were administered in a fixed order.
For the clinical groups, testing took place at the university or in the setting where the children were treated. For the NC group, testing took place at school during class hours. Twelve children from the HFA group were on methylphenidate, but discontinued medication at least 20 hr before testing (Barkley, DuPaul, & Connor, 1999) allowing for a complete washout (Greenhill, 1998). The children discontinued the use of methylphenidate after their morning dose on the day before testing. Each session ended with a small reward for the child. For practical reasons, for some children the WISC-R was administered during the third instead of the first session or testing took place before the diagnostic interviews.
Statistical analyses
Five group contrasts were performed for each EF and non-EF domain: (a) HFA versus NC, (b) TS versus NC, (c) HFA versus TS, (d) HFA versus HFA + TS, and (e) TS versus HFA + TS. For each contrast, the alpha level was set at .01 to compensate for the number of comparisons.
First, the EF and non-EF measures were analyzed using analyses of variance (ANOVAs) with group (four levels) as the between-subject factor. Multivariate ANOVAs (MANOVAs) were conducted instead of ANOVAs when a task had more than one dependent variable (i.e., the cognitive flexibility and response execution measures of the change task, and the verbal fluency measures). Repeated measures were performed for the SoP and the ToL with one between-group factor (four levels). The within-subject factor for the SoP consisted of the four levels of difficulty (6, 8, 10, or 12 items) for the number of errors. The within-factors for the ToL consisted of the three levels of difficulty (2/3, 4, or 5 moves) for three dependent measures: total score, decision time at the first attempt, and execution time at the first attempt.
Second, groups were compared on the EF measures, while controlling for FSIQ and age. FSIQ was controlled for because there were significant group differences for FSIQ. Age was controlled for because EFs are still developing in the age range in this study, and this might influence the outcome despite the fact that there were no group differences for age.
Third, ADHD and OCD characteristics were controlled for because these characteristics are frequently associated with HFA and TS. Furthermore, in this study both characteristics were not always equally divided within the groups (i.e., inattentivity and OCD). Therefore, multiple regression analyses with two unordered sets of predictors were conducted to predict the five EFs (i.e., inhibition, visual working memory, cognitive flexibility, planning, and verbal fluency) and non-EF (Green, Salkind, & Akey, 2000; Tabachnick & Fidell, 1996). These six domains were obtained by averaging the z scores of the dependent variables of each domain. This means that one aggregated measure for each domain was entered in the analyses. In a first regression equation, HFA or TS characteristics were entered first, and thereafter ADHD and OCD characteristics. In a second regression equation, the pattern was reversed. An overall alpha level of .05 was used. A composite score of the parent CCC pragmatic score, with the subscales Social Relations and Interests was made to measure HFA characteristics. Hence, the triad of characteristic symptoms of autism spectrum disorders was covered. We are aware that the ADI-R total algorithm score would be a more appropriate measure. However, we did not have ADI-R scores for the NC group; hence, we could not use this measure for the regression analyses. The correlations between the three domains of the ADI-R and the respective subscales of the CCC were as follows: (a) r = |.44| between ADI-R social and CCC social relationships, (b) r = |.51| between ADI-R communication and CCC pragmatic composite score, and (c) r = |.34| between ADI-R interests and CCC interests. The parent TSSL total score assessed TS characteristics. The mean score of the parent DBD (combination of the attention and the hyperactivity/impulsivity subscales) measured ADHD characteristics. The LOI-PV composite score assessed OCD characteristics.
Missing data and outliers
Data was missing for some children because of technical reasons. For each group and for each dependent measure, children with extreme scores were identified and removed from the analyses. Extreme scores were values more than three boxplot lengths from the upper or lower edge of the box. For the MANOVAs and multivariate analyses of covariance only those children who had extreme scores for more than one of the dependent measures were excluded. The distribution of missing data over the groups was as follows: (a) one missing case, and zero to two extreme cases for each dependent variable for the NC group; (b) one missing case, and zero to three extreme cases for each dependent variable for the HFA group; (c) no missing cases, and zero to three extreme cases for each dependent variable for the TS group; and (d) no missing cases, and zero to three extreme cases for each dependent variable for the HFA + TS group.
Results
Group contrasts
Table 2 provides the ages, gender composition, estimated FSIQs, rating scale scores, and interview scores for each group. A chi-square test was performed for gender. Group differences for the other measures were studied with ANOVAs, using an overall alpha level of .05.
Group means and standard deviations for gender, age, FSIQ, and rating scale scores

The groups did not differ with respect to gender, χ2 (3) = 5.10, ns, or age, F (3, 145) = 2.70, ns, η2 = .04. The groups differed with respect to FSIQ, F (3, 145) = 6.97, p < .001, η2 = .14; the HFA group had lower IQs than the NC group.
In general, the NC group showed significantly less problems on all rating scale scores in comparison to the three clinical groups. The only exception was for the CD scale of the DBD. Parent and teacher ratings on this scale could not distinguish between the NC and TS groups. Overall, we may conclude that the clinical groups were clearly distinguishable from the NC group on the basis of the questionnaires.
Parent ratings indicated that the HFA and comorbid HFA + TS groups scored significantly lower, indicating more impairment, on the pragmatic composite score of the CCC than the TS group. The HFA group had significantly lower scores than the TS group, as rated by teachers. The other contrasts were not significant. In line with expectations, the HFA and HFA + TS groups showed significantly more symptoms of autism than the TS group on the ADI-R. The HFA and HFA + TS groups did not differ.
As expected, the TS group showed more tic symptoms on the TSSL than the HFA group, according to both parents and teachers. Contrary to expectations, the HFA group could not be differentiated from the HFA + TS group on the basis of the TSSL. However, the TS and comorbid HFA + TS groups showed significantly more tic symptoms than the HFA group on the TS scale of the DISC-IV.
The clinical groups could not be differentiated on any of the parent or teacher DBD subscales, with one exception: according to parents, the TS group exhibited less CD symptoms than the HFA group. The clinical groups did not differ on the behavior disorders section (ADHD, ODD, and CD) of the DISC-IV. We conclude that disruptive behavior problems were approximately the same for all clinical groups.
The clinical groups could not be differentiated on the LOI-PV. The TS group was rated to have more obsessions and compulsions than the HFA group on the OCD Scale of the DISC-IV.
Correlations between dependent measures
For the correlations between the dependent measures, the interpretation of Cohen (1988) was used: a correlation of r = .10 is low, a correlation of r = .30 is moderate, and a correlation of r = .50 is high. The correlation between the dependent variables of the EF tasks was moderate (r = .33, range r = |.01|–|.62|). This implies that tasks within an EF domain shared some variance. The mean correlation between the dependent variables of the non-EF tasks was moderate (r = .43, range r = |.25|–|.75|). This indicates common variance between the non-EF variables. The mean correlation between the EF variables and non-EF variables was low (r = .26, range r = |.06|–|.66|), indicating that it was possible to distinguish to some degree between the EF and the non-EF tasks. However, the pattern of correlations did not unambiguously reveal that the EF and non-EF domains are independent, because the mean correlation between the EF and non-EF measures was not significantly different from the mean correlation among the EF measures themselves. This analysis was performed with the formula given by Hays (1981).
The mean correlation between FSIQ and the EF variables was low (r = .26, range r = |.10|–|.43|). This was also the case between FSIQ and the non-EF variables (r = .27, range r = |.12|–|.45|). When within-group correlations of FSIQ and the EF variables were analyzed, the following was found: mean r = .16 (range r = |.06|–|.42|) for the HFA group; mean r = .26 (range r = |.02|–|.61|) for the TS group; mean r = .26 (range r = |.03|–|.54|) for the HFA + TS group; and mean r = .32 (range r = |.05|–|.68|) for the NC group. Only three correlations were significant for the HFA group, two correlations were significant for the TS and HFA + TS groups, while six correlations were significant for the NC group. When within group correlations of FSIQ and the non-EF variables were analyzed, the following was found: mean r = .12 (range r = |.01|–|.23|) for the HFA group; mean r = .25 (range r = |.04|–|.73|) for the TS group; mean r = .25 (range r = |.10|–|.49|) for the HFA + TS group; and mean r = .30 (range r = |.16|–|.51|) for the NC group. No correlations were significant for the HFA group, one correlation was significant for the TS and HFA + TS groups, while five correlations were significant for the NC group.
HFA, TS, HFA + TS, and NC group comparisons
Table 3 presents the results of the EF measures. Table 4 provides the results of the non-EF control measures. Table 5 gives the results of the repeated measures for both the SoP and the ToL.
Group means and standard deviations for EF tasks

Group means and standard deviations for non-EF control tasks

Group means and standard deviations for visual working memory and planning (repeated measures)

EF domains.
Inhibition
There was a main effect of group for SSRT, F (3, 139) = 9.37, p < .001, η2 = .17. Contrary to expectations, the HFA group had the greatest difficulty in inhibiting a prepotent response. Children with HFA had slower SSRTs than the NC (p < .001, contrast 1), the TS (p = .001, contrast 3), and the comorbid HFA + TS groups (p = .005, contrast 4). Contrary to predictions, the TS group did not exhibit problems in inhibition compared to NC (contrast 2). Furthermore, the TS and HFA + TS groups could not be differentiated from one another (contrast 5). After covarying for both age and FSIQ, only contrasts 1 and 3 were still statistically significant. The HFA group remained significantly slower than the NC and TS groups.
There was a significant effect of group in the time used on the circle drawing task, F (3, 141) = 4.56, p = .004, η2 = .09. Contrary to predictions, the HFA group used less time than the NC group (p =.001), and thus had more problems in inhibiting an ongoing response. The other contrasts were not significant. After controlling for age and FSIQ, this contrast was no longer significant.
There was a significant group effect for the time difference on the TEA-Ch, F (3, 144) = 3.46, p = .01, η2 = .07. The HFA group had a greater time difference than the NC group (p = .003), and thus had more problems with interference control. None of the four other contrasts were statistically significant. This contrast remained significant after controlling for age and FSIQ.
Visual working memory
There was a significant group effect for the SoP number of errors, F (3, 144) = 7.94, p < .001, η2 = .14. The HFA group had significantly more errors than the NC (p < .001), and the HFA + TS groups (p = .002). Only the first contrast, comparing the HFA and NC groups, survived after controlling for age and FSIQ.
Furthermore, a significant interaction between group and increasing difficulty was found, F (9, 346) = 3.00, p = .002, η2 = .06. The contrast analyses indicated that the increase in the number of errors with the four levels of difficulty was greater for the HFA than for the NC group (p = .001). This contrast remained significant after controlling for age and FSIQ.
Planning
The groups differed significantly on a combination of the three planning measures (ToL score, decision time, and execution time), Wilks' Λ = .76, F (9, 336) = 4.57, p < .001, η2 = .09. A significant group effect was found for the ToL score, F (3, 140) = 7.07, p < .001, η2 = .13. The HFA group scored lower than the NC (p < .001) and HFA + TS groups (p = .003). Significant group differences were obtained for the two temporal measures: F (3, 140) = 4.17, p = .007, η2 = .08 for decision time and F (3, 140) = 5.75, p = .001, η2 = .11 for execution time. The HFA group had faster decision times than the NC (p = .002) and HFA + TS groups (p = .01). Furthermore, the HFA group required more time to complete the task than the other two groups (p < .001 and p = .01, respectively). After controlling for age and FSIQ, only the distinction between the HFA and NC groups remained for the three dependent variables.
When the difficulty level was taken into account, a significant interaction effect emerged between group and ToL decision time, F (6, 276) = 3.97, p = .001, η2 = .08, but not ToL score, F (6, 286) = 2.12, ns, η2 = .04, and ToL execution time, F (6, 278) = 1.53, ns, η2 = .03. As difficulty increased, differences in decision time became larger between the HFA group in comparison to the NC (p = .003) and HFA + TS (p < .001) groups. On each comparison, the increase in decision time was least for the HFA group, indicating deficits in planning. The same effects remained robust after covariance for age and FSIQ.
Cognitive flexibility
The groups differed significantly on a combination of the two cognitive flexibility measures of the change task (MRT and errors), Wilks' Λ = .83, F (6, 272) = 4.43, p < .001, η2 = .09. There was a significant effect for change MRT, F (3, 137) = 7.69, p < .001, η2 = .14, as well as for the number of errors in the change task, F (3, 137) = 4.33, p = .006, η2 = .09. The HFA group was significantly slower than the NC (p < .001), TS (p = .001), and HFA + TS groups (p = .002). The HFA group also made more errors than the other three groups (p = .01 for contrast 1, p = .01 for contrast 3, and p = .006 for contrast 4). After controlling for age and FSIQ, only contrast 1, comparing the HFA and NC groups, remained significant for both variables.
On the second measure of cognitive flexibility, the WCST, there was a significant effect of group for the percentage of perseverative responses, F (3, 141) = 9.06, p < .001, η2 = .16. The HFA group was more perseverative than both the NC (p < .001) and TS groups (p = .002). The same contrasts survived after controlling for age and FSIQ.
Verbal fluency
There was a significant group effect for a combination of the two verbal fluency measures (semantic and letter categories), Wilks' Λ = .86, F (6, 284) = 3.76, p = .001, η2 = .07. The groups differed significantly for the semantic category, F (3, 143) = 6.96, p < .001, η2 = .13, as well as the letter category, F (3, 143) = 4.54, p = .004, η2 = .09. The HFA group had fewer correct responses for both categories than the NC group (p < .001 for both categories). The results did not alter after controlling for age and FSIQ.
Non-EF domains.
Response execution
There was a significant group effect for a combination of the three response execution measures (MRT, response variability, and errors), Wilks' Λ = .86, F (9, 331) = 2.37, p = .01, η2 = .05. There was a significant effect for the standard deviation of reaction times (response variability), F (3, 138) = 5.11, p = .002, η2 = .10, and for the number of errors, F (3, 138) = 5.38, p = .001, η2 = .11. Groups did not differ on response execution MRT, F (3, 138) = 1.24, ns, η2 = .03. The HFA group demonstrated greater variability in speed of responding (p < .001) and committed more errors (p < .001) than the NC group. After controlling for age and FSIQ, the same contrasts remained robust.
Short-term memory
There were significant group differences on both measures of visual short-term memory: the Corsi, F (3, 143) = 13.05, p < .001, η2 = .22, and the BVRT, F (3, 145) = 12.29, p < .001, η2 = .20. The HFA group had lower scores than the NC (Corsi, p < .001; BVRT, p < .001), TS (Corsi, p < .001; BVRT, p = .007), and HFA + TS groups (Corsi, p < .001; BVRT, p < .001). The HFA and TS groups could not be differentiated from each other on the BVRT when age and FSIQ were taken into account. The other contrasts survived.
Categorization
A significant effect of group was found for the number of correct responses on the categorization task of the SON-R, F (3, 148) = 5.70, p = .001, η2 = .11. The HFA group gave fewer correct responses than the NC (p < .001) and TS groups (p = .01). None of the contrasts were still significant after controlling for age and FSIQ.
Visual–motor integration
No significant effect of group was found for the Beery standard score, F (3, 144) = 2.20, ns, η2 = .04.
Impact of comorbid ADHD and OCD characteristics for HFA
Multiple regression analyses were conducted to predict the five EFs (i.e., inhibition, visual working memory, cognitive flexibility, planning, and verbal fluency) and non-EF with three predictors: HFA, ADHD, and OCD. In a first regression equation, HFA characteristics were entered first, and thereafter comorbid ADHD and OCD characteristics. In a second regression equation, the pattern was reversed. The results reported in this section are presented in Table 6.
Hierarchical regression analyses with aggregated EF and non-EF measures, and HFA, ADHD, and OCD characteristics as predictors (N = 149)

The regression equation with HFA for inhibition was not significant, while the regression equation with the comorbidities ADHD and OCD was significant. Comorbidity appears to be a better predictor of inhibition than HFA. Next, a multiple regression was conducted with all three predictors. This analysis was significant. Hence, the three predictors provide a contribution to inhibition. Comorbidity predicted significantly over and above HFA, but HFA did not predict significantly over and above comorbidity. HFA appears to offer little additional predictive power beyond that contributed by comorbidity. When the contribution of comorbidity was specified, ADHD, but not OCD, was related to inhibition.
The regression equation with HFA for visual working memory was significant. The regression equation with comorbidity was also significant. HFA as well as comorbidity are good predictors of visual working memory. The multiple regression with the three predictors was significant. Comorbidity did not predict significantly over and above HFA, but HFA did predict significantly over and above comorbidity. The results suggest that HFA had the most predictive power for visual working memory.
The regression equation with HFA for cognitive flexibility was significant. The regression equation with comorbidity was also significant. HFA as well as comorbidity are good predictors of cognitive flexibility. The multiple regression with the three predictors was significant. Comorbidity did not predict significantly over and above HFA, but HFA did predict significantly over and above comorbidity. The results suggest that cognitive flexibility is most strongly related to HFA.
The regression equation with HFA for planning was not significant, while the regression equation with comorbidity was significant. Hence, comorbidity appears to be a better predictor of planning than HFA. The multiple regression with the three predictors was significant. Comorbidity predicted significantly over and above HFA, but HFA did not predict significantly over and above comorbidity. When the contribution of comorbidity was specified, only ADHD was related to planning.
The regression equation with HFA for verbal fluency was significant. The regression equation with comorbidity was also significant. HFA as well as comorbidity are good predictors of verbal fluency. The multiple regression with the three predictors was significant. Comorbidity did not predict significantly over and above HFA, but HFA did predict significantly over and above comorbidity. These results suggest that verbal fluency is most strongly related to HFA.
The regression equation with HFA for non-EF was significant. The regression equation with comorbidity was also significant. HFA as well as comorbidity are good predictors of non-EF. The multiple regression with the three predictors was significant. Comorbidity did not predict significantly over and above HFA, and HFA did not predict significantly over and above comorbidity.
Impact of comorbid ADHD and OCD characteristics for TS
Multiple regression analyses were also conducted to predict the five EFs (i.e., inhibition, visual working memory, cognitive flexibility, planning, and verbal fluency) and non-EF with the three predictors TS, ADHD, and OCD. In a first regression equation, TS characteristics were entered first, and thereafter comorbid ADHD and OCD characteristics. In a second regression equation, the pattern was reversed. The results reported in this section are presented in Table 7.
Hierarchical regression analyses with aggregated EF and Non-EF measures, and TS, ADHD, and OCD characteristics as predictors (N = 149)

The regression equation with TS for inhibition was not significant, while the regression equation with the comorbidities ADHD and OCD was significant. Comorbidity appears to be a better predictor of inhibition than TS. The multiple regression with the three predictors was significant. Comorbidity predicted significantly over and above TS, and TS predicted significantly over and above comorbidity. TS had additional predictive power beyond that contributed by comorbidity, and vice versa. When the contribution of comorbidity was specified, ADHD, but not OCD was related to inhibition.
The regression equation with TS for visual working memory was significant. The regression equation with the comorbidities ADHD and OCD was also significant. TS as well as comorbidity are good predictors of visual working memory. The multiple regression with the three predictors was significant. Comorbidity predicted significantly over and above TS, but TS did not predict significantly over and above comorbidity. TS appears to have little additional predictive power beyond that contributed by comorbidity. When the contribution of comorbidity was specified, only ADHD was related to visual working memory.
The regression equation with TS for cognitive flexibility was not significant. The regression equation with the comorbidities ADHD and OCD was also not significant. TS as well as comorbidity are poor predictors of cognitive flexibility. The multiple regression with the three predictors was not significant. Comorbidity predicted significantly over and above TS, but TS did not predict significantly over and above comorbidity. When the contribution of comorbidity was specified, only ADHD was related to cognitive flexibility.
The regression equation with TS with respect to planning was not significant, while the regression equation with the comorbidities ADHD and OCD was significant. Comorbidity appears to be a better predictor of planning than TS. The multiple regression with the three predictors was not significant. Comorbidity did not predict significantly over and above TS, and TS did not predict significantly over and above comorbidity. However, although the regression analysis with three predictors was not significant, the beta weight for ADHD did reach significance.
The regression equation with TS for verbal fluency was significant. The regression equation with the comorbidities ADHD and OCD was also significant. TS as well as comorbidity are good predictors of verbal fluency. The multiple regression with the three predictors was significant. Comorbidity predicted significantly over and above TS, but TS did not predict significantly over and above comorbidity. When the contribution of comorbidity was specified, only ADHD was related to verbal fluency.
The regression equation with TS for non-EF tasks was not significant, while in contrast the regression equation with the comorbidities ADHD and OCD was significant. Comorbidity appears to be a better predictor of non-EF than TS. The multiple regression with the three predictors was significant. Comorbidity did predict significantly over and above TS, but TS did not predict significantly over and above comorbidity. When the contribution of comorbidity was specified, only ADHD was related to non-EF.
Discussion
The main aim of this study was to investigate whether children with HFA and children with TS can be distinguished from each other in terms of their EF profile. The groups were compared on five major domains of EF (Pennington & Ozonoff, 1996): inhibition, visual working memory, planning, cognitive flexibility, and verbal fluency.
The findings for the HFA group were in line with the first explanation of the specificity problem (i.e., a more disturbed EF profile in autism than in TS). In contrast to the TS group, children with HFA encountered problems across all EF domains. This was, for the most part, as predicted. The HFA group scored lower than the NC group on visual working memory, cognitive flexibility, planning, and verbal fluency. Contrary to predictions, the HFA group had difficulties in inhibiting a prepotent and ongoing response, as well as with interference control. Deficits in visual working memory and planning (ToL decision time) for the HFA group were also reflected in the repeated-measure analyses. Other researchers often interpret significant group differences as sufficient to prove the point that there is a deficit in the poorer performing group on the process, which they assume the task measures. Sergeant and van der Meere (1990) argued that simply to show a group difference is insufficient. To implicate that a process explains the difference between groups, there must be: a main effect for group, a main effect for the process variable (here visual working memory and planning) and an interaction between group with the process variable. For this reason, it was interesting to analyze the specific working memory and planning component of the tasks in more detail with repeated-measure analyses, taking difficulty level into account. It should be noted that, in the present study, problems with planning in the HFA group are mainly reflected in the ToL decision time (while most other researchers used only the ToL total score). When children with HFA and TS were compared with each other, they differed on inhibition of a prepotent response and cognitive flexibility. For each comparison, the HFA group performed significantly poorer than the TS group. Correcting for additive effects of IQ and age did not change the majority of these significant differences. This suggests that EF deficits in the HFA group are not simply due to components of IQ or age. Only three significant within group correlations of IQ and EF measures, and only two significant interactions between diagnostic group and IQ on the EF measures were found (i.e., for ToL score and for Fluency semantic; results of these analyses can be obtained from the first author). Hence, there is little indication that the children in the HFA group who had lower IQs have driven the EF deficits.
These results add further support to the view that executive dysfunctioning plays an important role in autism (Pennington & Ozonoff, 1996; Russell, 1997). According to Ciesielski and Harris (1997), new tasks with poorly defined rules that require a high degree of inhibitory processes, parallel computational strategies, and simultaneous considerations of many possible solutions (e.g., WCST, change task, ToL, SoP) may be particularly difficult for children with autism. Deficits in children with autism may result from an inability to disengage from the primary focus (Russell, Saltmarsh, & Hill, 1999). EF deficits provide an explanation of many behavioral characteristics found in children with autism, such as rigid and inflexible behavior, problems with minor changes in the environment, a focus on details, and a deficiency in the ability to inhibit familiar or overlearned responses (Hughes, Plumet, & Leboyer, 1999; Ozonoff, Pennington, & Rogers, 1991; Ozonoff et al., 1994). To conclude more explicitly that EF deficits are primary core deficits of autism, it must be demonstrated that the level of EF deficits is related to the level of social/communication disability that characterize autism (e.g., Liss et al., 2001). Therefore, the 12 EF measures were correlated with the CCC pragmatic score. The mean correlation for the parents was r = .30 (range r = |.12|–|.39|), and for the teachers the mean correlation was r = .32 (range r = |.19|–|.38|). All the correlations were significant, with the exception of the correlations between the parent pragmatic score with ToL decision and execution times, and Change task errors. We conclude that, overall, EF is moderately related to social/communication disability. Considering this moderate correlation together with the finding that EF deficits become more prominent with age, we cannot completely rule out the possibility that EF problems in children with autism are a secondary outcome of another central process, rather than a primary cause (e.g., Zelazo & Müller, 2002). For instance, Rogers (1999) claimed that deficits in early imitation may cause EF deficits later in life. Liss, Fein, Allen, Dunn, Feinstein, Morris, Waterhouse, and Rapin (2001) argued that impaired EF is not universal in autism and is unlikely to cause the syndrome. This remark may also apply to theory of mind research. Usually, little association is found between ToM problems and symptoms of autism (e.g., Frith, 2003; Turner, 1999b).
The HFA group also encountered difficulties in the non-EF domain. Hence, the HFA group seemed to be more generally impaired. These children showed more response variability and committed more errors than the NC group in the response execution domain. Further, they exhibited difficulties in short-term memory (i.e., Corsi and BVRT), and categorization. Research with these tasks in autism and TS is scanty. Rutter and Bailey (1999) argued that a difficulty with temporal processing, which is reflected in more response variability in the current study, is one of the key features of the social abnormalities seen in autism. We conclude that some of the EF problems in the HFA group may be partly due to these non-EF problems.
The findings for the TS group were in line with the third explanation of the specificity problem (i.e., EF deficits found in earlier studies with children with TS are due to the comorbidity of that diagnosis with another diagnosis). The TS group showed the same EF profile as the NC group. Both groups could not be differentiated from each other on any of the EF domains. Because the children with TS in this study did not show any EF difficulties, the hypothesis of a double dissociation between autism and TS could not be established. The present findings replicate previous studies that also failed to find evidence of dysfunction in TS (Channon, Flynn, & Robertson, 1992; Ozonoff & Jensen, 1999; Silverstein, Como, Palumbo, West, & Osborn, 1995). Overall, it should be noted that the “off medication” selection criterion might have biased the sample somewhat toward less affected children with TS. However, this remark is also applicable to the other clinical groups.
The second aim of this study was to investigate whether children with HFA or children with TS and a comorbid group of children with both disorders are distinct conditions in terms of EF. Children with HFA scored lower than children comorbid for HFA and TS on all functions, with the exception of inhibition of an ongoing response, interference control, and verbal fluency. Children with TS and children with comorbid HFA + TS could not be differentiated at all in terms of EF. These children seem to resemble more a TS group, than a HFA group. The present study did not indicate a deviant EF profile in the HFA + TS group. We tentatively conclude that there seems to be a positive influence of comorbid TS in autism (see also Burd, Fisher, Kerbeshian, & Arnold, 1987). These authors concluded that the development of TS subsequent to the onset of autism may serve as a marker for improved developmental outcome (with respect to IQ and receptive or expressive language). A possible explanation for this surprising finding is that perhaps another aetiology lies at the basis of the HFA + TS group in comparison to the HFA group. However, Burd et al. (1987) did not observe significant differences for any aetiological categories. A second explanation is that the absence of group differences do not ensure that the underlying processes and mechanisms used to complete the specific tasks necessarily function in the same way and with the same level of efficiency as in typically developing children (Burack, Iarocci, Bowler, & Mottron, 2002). Complex interactions in the development of different aspects of psychological functioning may not only help to explain deficits, but also, occasionally, may explain strengths in functioning (Zelazo, Burack, Boseovski, Jacques, & Frye, 2001). Hence, it is possible that EF problems in the HFA + TS group exist at other developmental levels or can be established with other tasks than used here. This is clearly an issue for further study. A final explanation for the current results is that they are due to a smaller number of subjects in the comorbid group. Hence, low power might have affected the results for this group here (ranging = .05–.53). Despite the fact that the clinical groups did not differ with respect to age and IQ, it was striking that most of the significant differences between the HFA and HFA + TS groups disappeared, while controlling for age and IQ, which was not the case for the differences between the HFA and NC groups or between the HFA and TS groups. The HFA + TS group had a slightly, but not significantly, higher IQ than the HFA group. However, when we looked at the effects of covarying for age and IQ separately, the loss of significant differences was due more to age than to IQ (results of these analyses can be obtained from the first author). Clearly, these are striking findings and conclusions. Replication of the findings is required before conclusions can be drawn with confidence.
Hierarchical regression analyses were used to analyze the third aim of this study, namely the impact of comorbid ADHD and comorbid OCD characteristics for HFA. These analyses suggest that HFA had greater predictive power for cognitive flexibility, visual working memory, and verbal fluency, while ADHD had the most predictive power for inhibition and planning. There was no unique contribution of OCD. Future research needs to take into account how ADHD characteristics in children with autism may influence performance on EF tasks, especially in the domains of inhibition and planning. In a recent report from our research group (Geurts et al., 2004), a high proportion of children who received a clinical diagnosis of ADHD also met criteria for an autism spectrum disorder. In the current study, 34% of the children with an autism spectrum disorder also met the criteria for ADHD. This comorbidity may be a cause of inconsistency between EF studies in autism. When the impact of ADHD and OCD characteristics was analyzed for TS, we reached the conclusion that TS had some predictive power for inhibition. Ozonoff et al. (1998) argued that TS might involve dysfunction of only one EF domain, namely inhibition, and that impairment may not be widespread across the range of other EFs as was found here in the case of children with autism. However, there was a unique contribution of ADHD for all the EF domains, inclusive inhibition, as well as the non-EF domain. Although we could not confirm the importance of comorbidity in the variance analyses, the regression analyses clearly showed the importance of comorbid ADHD. This implies that future studies of children with TS need to take into account that possible EF deficiencies in these children may be due to comorbid ADHD characteristics (Brand, Geenen, Oudenhoven, Lindenborn, Van der Ree, Cohen–Kettenis, & Buitelaar, 2002; Harris et al., 1995; Schuerholz, Baumgardner, Singer, Reiss, & Denckla, 1996; Silverstein et al., 1995). In contrast to Ozonoff et al. (1998), the present study found no unique contribution of OCD characteristics in individuals with TS. Clearly, more research is needed investigating the relationship between EF and OCD. Overall, it should be noted that only for some of the children comorbidity was also clinically ascertained. Hence, we cannot exclude that this may have affected the current results.
Some limitations of this study should be noted. First, a compelling model or framework of EF is lacking (Denckla, 1996; Eslinger, 1996). What has emerged in the field is a broad and poorly defined construct of EF (Rabbitt, 1997). Hence, various theoretical perspectives claim different relationships between the five EF domains (e.g., Barkley, 1997a, 1997b; Fuster, 1997; Miyake, Friedman, Emerson, Witzki, Howerter, & Wager, 2000; Roberts & Pennington, 1996). If one can start from a general EF framework, one can analyze more clearly whether specific disorders are associated with different profiles of EF strengths and EF weaknesses.
Second, although the tasks included in this study are assigned to a specific domain, we are aware that EF tasks cannot be considered pure measures of a single EF domain (e.g., Denckla, 1996; Ozonoff, 1997). To deal with this measurement problem for some domains, tasks that overlap in their EF demands were included to ensure that the domain was adequately covered, and that possible deficits are not due to the task chosen. The current study improved previous studies by the inclusion of non-EF measures to control for generalized cognitive impairment. However, it may be argued that some of these tasks reflect EF processes as well (i.e., the Benton and the Corsi; Baddeley, Della Sala, Gray, Papagno, & Spinnler, 1997). Finally, besides classical neuropsychological measures, information-processing tasks were also applied (i.e., the change task, the SoP, and the ToL). Contrary to classical tasks, these kinds of tasks measure specific component processes and make experimental manipulations possible. They collect precise latency and accuracy data, they control a greater variety of extraneous variables (e.g., examiner administration), and they are less prone to subjectivity (Ozonoff, 1997; Rapport, Chung, Shore, Denney, & Isaacs, 2000). Future research needs to consider the development of valid information-processing EF measures for children (e.g., Archibald & Kerns, 1999; Beveridge, Jarrold, & Pettit, 2002; Ozonoff et al., 1994). However, Anderson (2002) argued that cognitive functions develop rapidly in childhood. Hence, it is difficult to validate tasks within a developmental framework. Furthermore, Anderson reasoned that the diagnostic utility of EF tasks would be enhanced, if test performance was analyzed using a microanalytic approach that incorporates quantitative (e.g., success/failure latency), qualitative (e.g., motivation and attention), and cognitive-process (e.g., strategies) methodologies.
To further enhance our understanding of brain–behavior relationships, studies incorporating structural and functional neuroimaging are required (Anderson, 2002; Baron–Cohen, 1995; Eslinger & Grattan, 1993). According to Bradshaw (2001), both autism and TS are frontostriatal neurodevelopmental disorders. The frontostriatal network consists of the lateral orbitofrontal cortex, the dorsolateral prefrontal cortex, the mesial anterior cingulate, the supplementary motor and lateral premotor area, the cerebellum, and the basal ganglia. Other parts of the network may be disrupted in autism than in TS (Bradshaw, 2001). Autism seems to be associated with the dorsolateral prefrontal and lateral orbitofrontal cortex as well as with cerebellar dysfunction (Bailey, Phillips, & Rutter, 1996; Bradshaw & Sheppard, 2000; Chugani, 2000; Eliez & Reiss, 2000). TS seems to be associated with the dorsolateral prefrontal and lateral orbitofrontal cortex as well as the anterior cingulate and basal ganglia (Bradshaw & Sheppard, 2000; Brown & Ivers, 1999; Casey, Tottenham, & Fossella, 2002; Denckla & Reiss, 1997; Eliez & Reiss, 2000; Fredericksen, Cutting, Kates, Mostofsky, Singer, Cooper, Lanham, Denckla, & Kaufmann, 2002; Kates et al., 2002; Leckman & Cohen, 1999; Peterson, Staib, Scahill, Zhang, Anderson, Leckman, Cohen, Gore, Albert, & Webster, 2001; Peterson & Klein, 1997; Singer, 1997; Stern, Silbersweig, Chee, Holmes, Robertson, Trimble, Frith, Frackowiak, & Dolan, 2000). Overall, findings of these studies are inconclusive and more research is needed about the frontostriatal network in combination with EF. Anderson (2002) argued that we are in the position to track concurrently the development of anatomical or neural systems and cognitive and behavioral aspects of EF.
The present study has implications for models of the development of HFA and TS, and for informing normal developmental theory. We focused on the school-age period that is marked by major change in the EF domain. It can be found in the literature that the greatest increments in EF are between the ages of 7 and 9 and again between 11 and 12 years, consistent with theoretical perspectives from developmental psychology and neurophysiological evidence showing maturation within frontostriatal regions around these ages (Anderson, Anderson, & Lajoie, 1996; Bradshaw, 2001). In the present study, it was evident that performance on the EF tasks improved with age, and that age played an important role in the disappearance of significant group differences. However, only two interaction effects between diagnostic group and age on the EF measures were found (i.e., for Circle time difference, and for ToL decision time; results of these analyses can be obtained from the first author). This means that although children with HFA have EF deficits in comparison to the other groups, they also make progression in EF with increasing age, but they do not reach normal functioning levels. A coherent description of EF at different ages is the first step toward an explanation of developmental changes in EF (Zelazo, Carter, Reznick, & Frye, 1997). There is a need for longitudinal research from a developmental psychopathological perspective that explores the developmental relations between the EFs in typical and atypical development (e.g., Ozonoff & McEvoy, 1994) or cross-sectional studies in which EF is considered at various developmental levels (Burack et al., 2002). An important question that has to be addressed is if EF problems can be explained by a developmental delay rather than by a deviance hypothesis. Furthermore, the longitudinal association of early emerging skills (e.g., imitation) with later EF strengths and deficits needs to be explored (Dawson et al., 2002).
In conclusion, this study adds further support to the view that autism, but not TS, is associated with impaired EF. Because EF deficits are not a central part of the cognitive phenotype of TS as they are for autism, a reevaluation of the EF hypothesis in TS is warranted. The results also suggest that for the comparison between HFA and TS groups, it is important to take into account comorbidity, especially comorbidity with ADHD characteristics.
References
REFERENCES
American Psychiatric Association.
(2000).
Diagnostic and statistical manual of mental disorders
(4th ed., text revision).
Washington, DC:
Author.
Anderson, P.
(2002).
Assessment and development of executive function (EF) during
childhood.
Child Neuropsychology
8,
71–82.Google Scholar
Anderson, P.,
Anderson, V., &
Lajoie, G.
(1996).
The Tower of London test: Validation and standardization for
pediatric populations.
Clinical Neuropsychologist
10,
54–65.Google Scholar
Archibald, S. J., &
Kerns, K. A.
(1999).
Identification and description of new tests of executive functioning
in children.
Child Neuropsychology
5,
115–129.Google Scholar
Bachorowski, J. A., &
Newman, J. P.
(1985).
Impulsivity in adults: Motor inhibition and time-interval
estimation.
Personality and Individual Differences
6,
133–136.Google Scholar
Bachorowski, J. A., &
Newman, J. P.
(1990).
Impulsive motor behavior: Effects of personality and goal
salience.
Journal of Personality and Social Psychology
58,
512–518.Google Scholar
Baddeley, A.,
Della Sala, S.,
Gray, C.,
Papagno, C., &
Spinnler, H.
(1997).
Testing central executive functioning with a pencil-and-paper
test. In
P. Rabbit (Ed.),
Methodology of frontal and executive function (pp.
61–80).
Hove:
Psychology Press.
Bailey, A.,
Phillips, W., &
Rutter, M.
(1996).
Autism: Towards an integration of clinical, genetic,
neuropsychological, and neurobiological perspectives.
Journal of Child Psychology and Psychiatry and Allied
Disciplines
37,
89–126.Google Scholar
Baker, S. C.,
Rogers, R. D.,
Owen, A. M.,
Frith, C. D.,
Dolan, R. J.,
Frackowiak, R. S., &
Robbins, T. W.
(1996).
Neural systems engaged by planning: A PET study of the Tower of
London task.
Neuropsychologia
34,
515–526.Google Scholar
Barkley, R. A.
(1997a).
Behavioural inhibition, sustained attention, and executive
functions: Constructing a unifying theory of AD/HD.
Psychological Bulletin
121,
65–94.Google Scholar
Barkley, R. A.
(1997b).
ADHD and the nature of self-control.
New York:
Guilford Press.
Barkley, R. A.,
DuPaul, G. J., &
Connor, D. F.
(1999).
Stimulants. In
J. S. Werry &
C. J. Aman (Eds.),
Practitioner's guide to psychoactive drugs for children and
adolescents
(2nd ed., pp.
213–247).
New York:
Plenum Press.
Barnhill, J., &
Horrigan, J. P.
(2002).
Tourette's syndrome and autism: A search for common
ground.
Mental Health Aspects of Developmental Disabilities
5,
7–15.Google Scholar
Baron–Cohen, S.
(1995).
Mindblindness: An essay on autism and theory of mind.
Cambridge, MA:
MIT Press.
Baron–Cohen, S.,
Mortimore, C.,
Moriarty, J.,
Izaguirre, J., &
Robertson, M.
(1999).
The prevalence of Gilles de la Tourette's syndrome in children
and adolescents with autism.
Journal of Child Psychology and Psychiatry
40,
213–218.Google Scholar
Becker, M. G.,
Isaac, W., &
Hynd, G. W.
(1987).
Neuropsychological development of nonverbal behaviors attributed to
frontal lobe functioning.
Developmental Neuropsychology
3,
275–298.Google Scholar
Beery, K. E.
(1997).
The Beery–Buktenica Developmental Test of visual–motor
integration
(4th ed.).
New York:
Modern Curriculum Press.
Benton, A. L., &
Hamsher, K. S.
(1978).
Multilingual aphasia examination
(manual, revised).
Iowa City, IA:
University of Iowa.
Berch, D. B.,
Krikorian, R., &
Huha, E. M.
(1998).
The Corsi block-tapping task: Methodological and theoretical
considerations.
Brain and Cognition
38,
317–338.Google Scholar
Berg, C. Z.,
Whitaker, A.,
Davies, D.,
Flament, M. F., &
Rapoport, J. L.
(1988).
The survey form of the Leyton Obsessional Inventory—child
version: Norms from an epidemiological study.
Journal of the American Academy of Child and Adolescent
Psychiatry
27,
759–763.Google Scholar
Berman, K. F.,
Ostrem, J. L.,
Randolph, C.,
Gold, J.,
Goldberg, T. E.,
Coppola, R.,
Carson, R. E.,
Herscovitch, P., &
Weinberger, D. R.
(1995).
Physiological activation of a cortical network during performance of
the Wisconsin Card Sorting Test: A positron emission tomography
study.
Neuropsychologia
33,
1027–1046.Google Scholar
Beveridge, M.,
Jarrold, C., &
Pettit, E.
(2002).
An experimental approach to executive fingerprinting in young
children.
Infant and Child Development
11,
107–123.Google Scholar
Bishop, D. V.
(1998).
Development of the Children's Communication Checklist (CCC): A
method for assessing qualitative aspects of communicative impairment in
children.
Journal of Child Psychology and Psychiatry and Allied
Disciplines
39,
879–891.Google Scholar
Bishop, D. V., &
Baird, G.
(2001).
Parent and teacher report of pragmatic aspects of communication: Use
of the Children's Communication Checklist in a clinical
setting.
Developmental Medicine and Child Neurology
43,
809–818.Google Scholar
Bradshaw, J. L.
(2001).
Developmental disorders of the frontostriatal system:
Neuropsychological, neuropsychiatric, and evolutionary
perspectives.
Hove:
Psychology Press Ltd.
Bradshaw, J. L., &
Sheppard, D. M.
(2000).
The neurodevelopmental frontostriatal disorders: Evolutionary
adaptiveness and anomalous lateralization.
Brain and Language
73,
297–320.Google Scholar
Brand, N.,
Geenen, R.,
Oudenhoven, M.,
Lindenborn, B.,
Van der Ree, A.,
Cohen–Kettenis, P., &
Buitelaar, J. K.
(2002).
Brief report: Cognitive functioning in children with Tourette's
syndrome with and without comorbid ADHD.
Journal of Pediatric Psychology
27,
203–208.Google Scholar
Brown, R. T., &
Ivers, C. E.
(1999).
Gilles de la Tourette syndrome. In
S. Goldstein &
C. R. Reynolds (Eds.),
Handbook of neurodevelopmental and genetic disorders in
children (pp.
185–215).
New York:
Guilford Press.
Buitelaar, J. K., &
van de Wetering, B. J. M.
(1996).
Syndroom van Gilles de la Tourette: Een leidraad voor diagnostiek en
behandeling.
Assen, The Netherlands:
Van Gorcum.
Burack, J. A.,
Iarocci, G.,
Bowler, D., &
Mottron, L.
(2002).
Benefits and pitfalls in the merging of disciplines: The example of
developmental psychopathology and the study of persons with autism.
Development and Psychopathology
14,
225–237.Google Scholar
Burd, L.,
Fisher, W. W.,
Kerbeshian, J., &
Arnold, M. E.
(1987).
Is development of Tourette disorder a marker for improvement in
patients with autism and other pervasive developmental disorders?
Journal of the American Academy of Child and Adolescent
Psychiatry
26,
162–165.Google Scholar
Burd, L.,
Kerbeshian, J.,
Wilkenheiser, M., &
Fisher, W.
(1986).
A prevalence study of Gilles de la Tourette syndrome in North Dakota
school-age children.
Journal of the American Academy of Child and Adolescent
Psychiatry
25,
552–553.Google Scholar
Cabeza, R., &
Nyberg, L.
(2000).
Imaging cognition II: An empirical review of 275 PET and fMRI
studies.
Journal of Cognitive Neuroscience
12,
1–47.Google Scholar
Casey, B. J.,
Tottenham, N., &
Fossella, J.
(2002).
Clinical, imaging, lesion, and genetic approaches toward a model of
cognitive control.
Developmental Psychobiology
40,
237–254.Google Scholar
Channon, S.,
Flynn, D., &
Robertson, M. M.
(1992).
Attentional deficits in Gilles de la Tourette syndrome.
Neuropsychiatry, Neuropsychology, and Behavioral Neurology
5,
170–177.Google Scholar
Chugani, D. C.
(2000).
Autism. In
M. Ernst &
J. M. Rumsey (Eds.),
Functional neuroimaging in child psychiatry
(2nd ed., pp.
171–188).
Cambridge:
University Press.
Ciesielski, K. T., &
Harris, R. J.
(1997).
Factors related to performance failure on executive tasks in
autism.
Child Neuropsychology
3,
1–12.Google Scholar
Cirino, P. T.,
Chapieski, M. L., &
Massman, P. J.
(2000).
Card sorting performance and ADHD symptomatology in children and
adolescents with Tourette syndrome.
Journal of Clinical and Experimental Neuropsychology
22,
245–256.Google Scholar
Clark, T.,
Freehan, C.,
Tinline, C., &
Vostanis, P.
(1999).
Autistic symptoms in children with
attention-deficit/hyperactivity disorder.
European Child and Adolescent Psychiatry
8,
50–55.Google Scholar
Cohen, J.
(1988).
Statistical power analysis for the behavioural sciences
(2nd ed.).
Hillsdale, NJ:
Erlbaum.
Cohen, D. J.,
Leckman, J. F., &
Shaywitz, B. A.
(1985).
The Tourette syndrome and other tics. In
D. Shaffer,
A. A. Ehrhardt, &
L. L. Greenhill (Eds.),
The clinical guide to child psychiatry (pp.
3–28).
New York:
Free Press.
Corsi, P. M.
(1972).
Human memory and the medial temporal region of the brain.
Dissertation Abstracts International,
34,
819B.Google Scholar
Dagher, A.,
Owen, A. M.,
Boecker, H., &
Brooks, D. J.
(1999).
Mapping the network for planning: A correlational PET activation
study with the Tower of London task.
Brain
122,
1973–1987.Google Scholar
Dawson, G.,
Munson, J.,
Estes, A.,
Osterling, J.,
McPartland, J.,
Toth, K.,
Carver, L., &
Abbott, R.
(2002).
Neurocognitive function and joint attention ability in young
children with autism spectrum disorder versus developmental delay.
Child Development
73,
345–358.Google Scholar
De Groot, C. M.,
Yeates, K. O.,
Baker, G. B., &
Bornstein, R. A.
(1997).
Impaired neuropsychological functioning in Tourette's syndrome
subjects with co-occurring obsessive–compulsive and attention
deficit symptoms.
Journal of Neuropsychiatry and Clinical Neurosciences
9,
267–272.Google Scholar
De Jong, R.,
Coles, M. G., &
Logan, G. D.
(1995).
Strategies and mechanisms in nonselective and selective inhibitory
motor control.
Journal of Experimental Psychology: Human Perception and
Performance
21,
498–511.Google Scholar
Della Sala, S.,
Gray, C.,
Baddeley, A.,
Allamano, N., &
Wilson, L.
(1999).
Pattern span: A tool for unwelding visuo-spatial memory.
Neuropsychologia
37,
1189–1199.Google Scholar
Denckla, M. B.
(1996).
A theory and model of executive function: A neuropsychological
perspective. In
G. R. Lyon &
N. A. Krasnegor (Eds.),
Attention, memory, and executive function (pp.
263–277).
Baltimore, MD:
Paul H. Brookes.
Denckla, M. B., &
Reiss, A. L.
(1997).
Prefrontal-subcortical circuits in developmental disorders.
In
N. A. Krasnegor &
G. R. Lyon (Eds.),
Development of the prefrontal cortex: Evolution, neurobiology, and
behavior (pp.
283–293).
Baltimore, MD:
Paul H. Brookes.
Eliez, S., &
Reiss, A. L.
(2000).
Annotation: MRI neuroimaging of childhood psychiatric disorders: A
selective review.
Journal of Child Psychology and Psychiatry
41,
679–694.Google Scholar
Eslinger, P. J.
(1996).
Conceptualizing, describing, and measuring components of executive
function. In
G. R. Lyon &
N. A. Krasnegor (Eds.),
Attention, memory, and executive function (pp.
263–277).
Baltimore, MD:
Paul H. Brookes.
Eslinger, P. J., &
Grattan, L. M.
(1993).
Frontal lobe and frontal-striatal substrates for different forms of
human cognitive flexibility.
Neuropsychologia
31,
17–28.Google Scholar
Ferdinand, R. F.,
Van der Ende, J., &
Mesman, J.
(1998).
Diagnostic Interview Schedule for Children, DISC-IV. Nederlandse
vertaling
[Dutch translation].
Unpublished manuscript.
Sophia Kinderziekenhuis,
Rotterdam.
Filipek, P. A.,
Accardo, P. J.,
Baranek, G. T.,
Cook, E. H.,
Dawson, G.,
Gordon, B.,
Gravel, J. S.,
Johnson, C. P.,
Kallen, R. J.,
Levy, S. E.,
Minshew, N. J.,
Prizant, B. M.,
Rapin, I.,
Rogers, S. J.,
Stone, W. L.,
Teplin, S.,
Tuchman, R. F., &
Volkmar, F. R.
(1999).
The screening and diagnosis of autistic spectrum disorders.
Journal of Autism and Developmental Disorders
29,
439–484.Google Scholar
Flament, M. F.,
Whitaker, A.,
Rapoport, J. L.,
Davies, M.,
Berg, C. J.,
Kalikow, K.,
Sceery, W., &
Shaffer, D.
(1988).
Obsessive compulsive disorder in adolescence: An epidemiological
study.
Journal of the American Academy of Child and Adolescent
Psychiatry
27,
764–771.Google Scholar
Fombonne, E.
(1998).
Epidemiology of autism and related conditions. In
F. R. Volkmar (Ed.),
Autism and pervasive developmental disorders (pp.
32–63).
Cambridge:
Cambridge University Press.
Fredericksen, K. A.,
Cutting, L. E.,
Kates, W. R.,
Mostofsky, S. H.,
Singer, H. S.,
Cooper, K. L.,
Lanham, D. C.,
Denckla, M. B., &
Kaufmann, W. E.
(2002).
Disproportionate increases of white matter in right frontal lobe in
Tourette syndrome.
Neurology
58,
85–89.Google Scholar
Frith, U.
(2003).
Autism: Explaining the enigma
(2nd ed.).
London:
Blackwell.
Frith, C. D.,
Friston, K. J.,
Liddle, P. F., &
Frackowiak, R. S.
(1991).
A PET study of word finding.
Neuropsychologia
29,
1137–1148.Google Scholar
Fuster, J. M.
(1997).
The prefrontal cortex: Anatomy, physiology, and neuropsychology of
the frontal lobe
(3rd ed.).
Philadelphia, PA:
Lippincott–Raven.
Gaillard, W. D.,
Hertz–Pannier, L.,
Mott, S. H.,
Barnett, A. S.,
LeBihan, D., &
Theodore, W. H.
(2000).
Functional anatomy of cognitive development: fMRI of verbal fluency
in children and adults.
Neurology
54,
180–185.Google Scholar
Gerstadt, C. L.,
Hong, Y. J., &
Diamond, A.
(1994).
The relationship between cognition and action: Performance of
children 2–7 years old on a Stroop-like day–night test.
Cognition
53,
129–153.Google Scholar
Geurts, H. M.,
Verté, S.,
Oosterlaan, J.,
Roeyers, H., &
Sergeant, J. A.
(2004).
How specific are executive functioning deficits in attention deficit
hyperactivity disorder and autism?
Journal of Child Psychology and Psychiatry
45,
836–854.Google Scholar
Ghaziuddin, M.,
Weidmer–Mikhail, E., &
Ghaziuddin, N.
(1998).
Comorbidity of Asperger Syndrome: A preliminary report.
Journal of Intellectual Disability Research
4,
279–283.Google Scholar
Golden, G. S.
(1990).
Tourette syndrome: Recent advances.
Neurologic Clinics
8,
705–714.Google Scholar
Grant, D. A., &
Berg, E. A.
(1948).
A behavioral analysis of degree of reinforcement and ease of
shifting to new responses in a Weigel-type card-sorting problem.
Journal of Experimental Psychology
38,
404–411.Google Scholar
Green, S. B.,
Salkind, N. J., &
Akey, T. M.
(2000).
Using SPSS for windows: Analyzing and understanding data.
Upper Saddle River, NJ:
Prentice—Hall.
Greenhill, L. L.
(1998).
Childhood attention deficit hyperactivity disorder: Pharmacological
treatments. In
P. E. Nathan &
J. M. Gorman (Eds.),
A guide to treatments that work (pp.
42–64).
London:
Oxford University Press.
Griffith, E. M.,
Pennington, B. F.,
Wehner, E. A., &
Rogers, S. J.
(1999).
Executive functions in young children with autism.
Child Development
70,
817–832.Google Scholar
Groth–Marnat, G.
(1997).
Handbook of psychological assessment
(3rd ed.).
New York:
Wiley.
Harris, E. L.,
Schuerholz, L. J.,
Singer, H. S., &
Reader, M. J.
(1995).
Executive function in children with Tourette syndrome and/or
attention deficit hyperactivity disorder.
Journal of the International Neuropsychological Society
1,
511–516.Google Scholar
Harris, M. E.
(1990).
Wisconsin Card Sorting Test: Scoring program.
Odessa, FL:
Psychological Assessment Resources, Inc.
Hartman, C. A.,
Geurts, H. M,
Bennink, A. C.,
Verté, S.,
Roeyers, H.,
Sergeant, J. A., &
Bishop, D. V. M.
(1998).
De Drie C's: Children's Communication Checklist [The
three C's: Children's Communication Checklist. Dutch
translation].
Unpublished manuscript,
Vrije Universiteit, Amsterdam.
Hays, W. L.
(1981).
Statistics
(3rd ed.).
New York:
Dryden Press.
Heaton, R. K.
(1981).
Wisconsin Card Sorting Test manual.
Odessa, FL:
Psychological Assessment Resources, Inc.
Heaton, R. K.,
Chelune, G. J.,
Talley, J. L.,
Kay, G. G., &
Curtiss, G.
(1993).
Wisconsin Card Sorting Test manual.
Odessa, FL:
Psychological Assessment Resources, Inc.
Hughes, C.,
Plumet, M. H., &
Leboyer, M.
(1999).
Towards a cognitive phenotype for autism: Increased prevalence of
executive dysfunction and superior spatial span amongst siblings of
children with autism.
Journal of Child Psychology and Psychiatry
40,
705–718.Google Scholar
Jankovic, J.
(2001).
Tourette's syndrome.
New England Journal of Medicine
345,
1184–1192.Google Scholar
Kadesjoe, B., &
Gillberg, C.
(2000).
Tourette's Disorder: Epidemiology and comorbidity in primary
school children.
Journal of the American Academy of Child and Adolescent
Psychiatry
39,
548–555.Google Scholar
Kates, W. R.,
Frederikse, M.,
Mostofsky, S. H.,
Folley, B. S.,
Cooper, K.,
Mazur–Hopkins, P.,
Kofman, O.,
Singer, H. S.,
Denckla, M. B.,
Pearlson, G. D., &
Kaufmann, W. E.
(2002).
MRI parcellation of the frontal lobe in boys with attention deficit
hyperactivity disorder or Tourette syndrome.
Psychiatry Research: Neuroimaging
116,
63–81.Google Scholar
King, N.,
Inglis, S.,
Jenkins, M.,
Myerson, N., &
Ollendick, T.
(1995).
Test–retest reliability of the survey form of the Leyton
Obsessional Inventory—Child version.
Perceptual and Motor Skills
80,
1200–1202.Google Scholar
Krikorian, R.,
Bartok, J., &
Gay, N.
(1994).
Tower of London procedure: A standard method and developmental
data.
Journal of Clinical and Experimental Neuropsychology
16,
840–850.Google Scholar
Leckman, J. F., &
Cohen, D. J.
(1999).
Tourette's syndrome: Tics, obsessions, compulsions:
Developmental psychopathology and clinical care.
New York:
Wiley.
Le Couteur, A.,
Rutter, M.,
Lord, C.,
Rios, P.,
Robertson, S.,
Holdgrafer, M., &
McLennan, J.
(1989).
Autism Diagnostic Interview: A standardized investigator-based
instrument.
Journal of Autism and Developmental Disorders
19,
363–387.Google Scholar
Levin, H. S.,
Mendelsohn, D. B.,
Lilly, M. A., &
Fletcher, J. M.
(1994).
Tower of London performance in relation to magnetic resonance
imaging following closed head injury in children.
Neuropsychology
8,
171–179.Google Scholar
Lezak, M. D.
(1995).
Neuropsychological assessment
(3rd ed.).
New York:
Oxford University Press.
Liss, M.,
Fein, D.,
Allen, D.,
Dunn, M.,
Feinstein, C.,
Morris, R.,
Waterhouse, L., &
Rapin, I.
(2001).
Executive functioning in high-functioning children with
autism.
Journal of Child Psychology and Psychiatry
42,
261–270.Google Scholar
Logan, G. D.
(1994).
On the ability to inhibit thought and action: A users' guide
to the stop signal paradigm. In
D. Dagenbach &
T. H. Carr (Eds.),
Inhibitory processes in attention, memory and language (pp.
189–239).
San Diego, CA:
Academic Press.
Logan, G. D., &
Burkell, J.
(1986).
Dependence and independence in responding to double stimulation: A
comparison of stop, change, and dual-task paradigms.
Journal of Experimental Psychology
12,
549–563.Google Scholar
Lombardi, W. J.,
Andreason, P. J.,
Sirocco, K. Y.,
Rio, D. E.,
Gross, R. E.,
Umhau, J. C., &
Hommer, D. W.
(1999).
Wisconsin Card Sorting Test performance following head injury:
Dorsolateral fronto-striatal circuit activity predicts
perseveration.
Journal of Clinical and Experimental Neuropsychology
21,
2–16.Google Scholar
Lord, C.
(1997).
Diagnostic instruments in autism spectrum disorders. In
D. J. Cohen &
F. R. Volkmar (Eds.),
Handbook of autism and pervasive developmental disorders
(2nd ed., pp.
460–483).
New York:
Wiley.
Lord, C.,
Rutter, M., &
Le Couteur, A.
(1994).
Autism Diagnostic Interview—Revised: A revised version of a
diagnostic interview for caregivers of individuals with possible pervasive
developmental disorders.
Journal of Autism and Developmental Disorders
24,
659–685.Google Scholar
Lord, C.,
Storoschuk, S.,
Rutter, M., &
Pickles, A.
(1993).
Using the ADI-R to diagnose autism in preschool children.
Mental Health Journal
14,
234–252.Google Scholar
Mahone, E. M.,
Koth, C. W.,
Cutting, L.,
Singer, H. S., &
Denckla, M. B.
(2001).
Executive function in fluency and recall measures among children
with Tourette syndrome or ADHD.
Journal of the International Neuropsychological Society
7,
102–111.Google Scholar
Manly, T.,
Anderson, V.,
Nimmo–Smith, I.,
Turner, A.,
Watson, P., &
Robertson, I. H.
(2001).
The differential assessment of children's attention: The Test
of Everyday Attention for Children (TEA-Ch), normative sample and ADHD
performance.
Journal of Child Psychology and Psychiatry
42,
1065–1081.Google Scholar
McDougle, C. J.,
Kresch, L. E.,
Goodman, W. K.,
Naylor, S. T.,
Volkmar, F. R.,
Cohen, D. J., &
Price, L. H.
(1995).
A case-controlled study of repetitive thoughts and behavior in
adults with autistic disorder and obsessive–compulsive
disorder.
American Journal of Psychiatry
152,
772–777.Google Scholar
Milner, B.
(1971).
Interhemispheric differences in the localization of psychological
processes in man.
British Medical Bulletin
27,
272–277.Google Scholar
Miyake, A.,
Friedman, N. P.,
Emerson, M. J.,
Witzki, A. H.,
Howerter, A., &
Wager, T. D.
(2000).
The unity and diversity of executive functions and their
contributions to complex “frontal lobe” tasks: A latent
variable analysis.
Cognitive Psychology
41,
49–100.Google Scholar
Miyake, A.,
Friedman, N. P.,
Rettinger, D. A.,
Shah, P., &
Hegarty, M.
(2001).
How are visuospatial working memory, executive functioning, and
spatial abilities related? A latent variable analysis.
Journal of Experimental Psychology: General
130,
621–640.Google Scholar
Muris, P.,
Steerneman, P.,
Merckelbach, H.,
Holdrinet, I., &
Meesters, C.
(1998).
Comorbid anxiety symptoms in children with pervasive developmental
disorders.
Journal of Anxiety Disorders
12,
387–393.Google Scholar
Oosterlaan, J., &
Sergeant, J. A.
(1998).
Response inhibition and response re-engagement in
attention-deficit/hyperactivity disorder, disruptive, anxious and
normal children.
Behavioral Brain Research
94,
33–43.Google Scholar
Oosterlaan, J.,
Scheres, A.,
Antrop, I.,
Roeyers, H., &
Sergeant, J. A.
(2000).
Vragenlijst voor Gedragsproblemen bij Kinderen (VvGK). Nederlandse
bewerking van de Disruptive Behavior Disorders Rating Scale [Dutch
translation of the Disruptive Behavior Disorders Rating
Scale].
Lisse, The Netherlands:
Swets & Zeitlinger.
Ozonoff, S.
(1997).
Components of executive function in autism and other
disorders. In
J. Russell (Ed.),
Autism as an executive disorder (pp.
179–211).
Oxford:
Oxford University Press.
Ozonoff, S., &
Jensen, J.
(1999).
Brief report: Specific executive function profiles in three
neurodevelopmental disorders.
Journal of Autism and Developmental Disorders
29,
171–177.Google Scholar
Ozonoff, S., &
McEvoy, R. E.
(1994).
A longitudinal study of executive function and theory of mind
development in autism.
Development and Psychopathology
6,
415–431.Google Scholar
Ozonoff, S.,
Pennington, B. F., &
Rogers, S. J.
(1991).
Executive function deficits in high-functioning autistic
individuals: Relationship to theory of mind.
Journal of Child Psychology and Psychiatry
32,
1081–1105.Google Scholar
Ozonoff, S., &
Strayer, D. L.
(1997).
Inhibitory function in nonretarded children with autism.
Journal of Autism and Developmental Disorders
27,
59–77.Google Scholar
Ozonoff, S.,
Strayer, D. L.,
McMahon, W. M., &
Filloux, F.
(1994).
Executive function abilities in autism and Tourette syndrome: An
information processing approach.
Journal of Child Psychology and Psychiatry
35,
1015–1032.Google Scholar
Ozonoff, S.,
Strayer, D. L.,
McMahon, W. M., &
Filloux, F.
(1998).
Inhibitory deficits in Tourette syndrome: A function of comorbidity
and symptom severity.
Journal of Child Psychology and Psychiatry
39,
1109–1118.Google Scholar
Pascualvaca, D. M.,
Fantie, B. D.,
Papageorgiou, M., &
Mirsky, A. F.
(1998).
Attentional capacities in children with autism: Is there a general
deficit in shifting focus?
Journal of Autism and Developmental Disorders
28,
467–478.Google Scholar
Passler, M. A.,
Isaac, W.,
Hynd, G. W.
(1985).
Neuropsychological development of behavior attributed to frontal
lobe functioning in children.
Developmental Neuropsychology
1,
349–370.Google Scholar
Pelham, W.,
Gnagy, E. M.,
Greenslade, K. E., &
Milich, R.
(1992).
Teacher ratings of DSM-III-R symptoms for the disruptive
behavior disorders.
Journal of the American Academy of Child and Adolescent
Psychiatry
31,
210–218.Google Scholar
Pennington, B. F.,
Bennetto, L.,
McAleer, O., &
Roberts, R. J.
(1996).
Executive functions and working memory. In
G. R. Lyon &
N. A. Krasnegor (Eds.),
Attention, memory and executive function (pp.
327–348).
Baltimore, MD:
Paul H. Brookes.
Pennington, B. F., &
Ozonoff, S.
(1996).
Executive functions and developmental psychopathology.
Journal of Child Psychology and Psychiatry
37,
51–87.Google Scholar
Peterson, B. S., &
Klein, J. E.
(1997).
Neuroimaging of Tourette's syndrome neurobiologic
substrate.
Child and Adolescent Psychiatric Clinics of North America
6,
343–364.Google Scholar
Peterson, B. S.,
Staib, L.,
Scahill, L.,
Zhang, H.,
Anderson, C.,
Leckman, J. F.,
Cohen, D. J.,
Gore, J. C.,
Albert, J., &
Webster, R.
(2001).
Regional brain and ventricular volumes in Tourette syndrome.
Archives of General Psychiatry
58,
427–440.Google Scholar
Petrides, M.,
Alivisatos, B.,
Evans, A. C., &
Meyer, E.
(1993).
Dissociation of human mid-dorsolateral from posterior dorsolateral
frontal cortex in memory processing.
Proceedings of the National Academy of Sciences
90,
873–877.Google Scholar
Petrides, M., &
Milner, B.
(1982).
Deficits on subject-ordered tasks after frontal- and temporal-lobe
lesions in man.
Neuropsychologia
20,
249–262.Google Scholar
Phelps, E. A.,
Hyder, F.,
Blamire, A. M., &
Shulman, R. G.
(1997).
fMRI of the prefrontal cortex during overt verbal fluency.
Neuroreport: An International Journal for the Rapid Communication of
Research in Neuroscience
8,
561–565.Google Scholar
Rabbitt, P.
(1997).
Introduction: Methodologies and models in the study of executive
function. In
P. Rabbitt (Ed.),
Methodology of frontal and executive function.
Hove:
Psychology Press.
Rapport, M. D.,
Chung, K. M.,
Shore, G.,
Denney, C. B., &
Isaacs, P.
(2000).
Upgrading the science and technology of assessment and diagnosis:
Laboratory and clinic-based assessment of children with ADHD.
Journal of Clinical Child Psychology
29,
555–568.Google Scholar
Reader, M. J.,
Harris, E. L.,
Schuerholz, L. J., &
Denckla, M. B.
(1994).
Attention deficit hyperactivity disorder and executive
dysfunction.
Developmental Neuropsychology
10,
493–512.Google Scholar
Reitan, R. M., &
Wolfson, D.
(1994).
A selective and critical review of neuropsychological deficits and
the frontal lobes.
Neuropsychology Review
4,
161–198.Google Scholar
Rezai, K.,
Andreasen, N. C.,
Alliger, R.,
Cohen, G.,
Swayze, V., &
O'Leary, D. S.
(1993).
The neuropsychology of the prefrontal cortex.
Archives of Neurology
50,
636–642.Google Scholar
Riehemann, S.,
Volz, H. P.,
Stuetzer, P.,
Smesny, S.,
Gaser, C., &
Sauer, H.
(2001).
Hypofrontality in neuroleptic-naive schizophrenic patients during
the Wisconsin Card Sorting Test: An fMRI study.
European Archives of Psychiatry and Clinical Neuroscience
251,
66–71.Google Scholar
Ringman, J. M., &
Jankovic, J.
(2000).
Occurrence of tics in Asperger's syndrome and autistic
disorder.
Journal of Child Neurology
15,
394–400.Google Scholar
Roberts, R. J., &
Pennington, B. F.
(1996).
An interactive framework for examining prefrontal cognitive
processes.
Developmental Neuropsychology
12,
105–126.Google Scholar
Rogers, S.
(1999).
An examination of the imitation deficits in autism. In
J. Nadel &
G. Butterworth (Eds.),
Imitation in infancy: Cambridge studies in cognitive perceptual
development (pp.
254–283).
New York:
Cambridge University Press.
Rogers, S., &
Bennetto, L.
(2000).
Intersubjectivity in autism: The roles of imitation and executive
function. In
A. M. Wetherby &
B. M. Prizant (Eds.),
Autism spectrum disorders: A transactional developmental
perspective (pp.
79–107).
Baltimore, MD:
Paul H. Brookes.
Rowe, J. B.,
Owen, A. M.,
Johnsrude, I. S., &
Passingham, R. E.
(2001).
Imaging the mental components of a planning task.
Neuropsychologia
39,
315–327.Google Scholar
Rubia, K.,
Overmeyer, S.,
Taylor, E.,
Brammer, M.,
Williams, S.,
Simmons, A., &
Bullmore, E. T.
(1999).
Hypofrontality in attention deficit hyperactivity disorder during
higher-order motor control: A study with functional MRI.
American Journal of Psychiatry
156,
891–896.Google Scholar
Russell, J.
(1997).
Autism as an executive disorder.
Oxford:
Oxford University Press.
Russell, J.,
Saltmarsh, R., &
Hill, E.
(1999).
What do executive factors contribute to the failure on false belief
tasks by children with autism?
Journal of Child Psychology and Psychiatry
40,
859–868.Google Scholar
Rutter, M., &
Bailey, A.
(1999).
Thinking and relationships: Mind and brain (some reflections on
theory of mind and autism). In
S. Baron–Cohen,
H. Tager–Flusberg, &
D. J. Cohen (Eds.),
Understanding other minds (pp.
481–504).
Oxford:
Oxford University Press.
Schellig, D.
(1997).
Block-Tapping-Test.
Lisse:
Swets & Zeitlinger.
Schlosser, M. J.,
Aoyagi, N.,
Fulbright, R. K.,
Gore, J. C., &
McCarthy, G.
(1998).
Functional MRI studies of auditory comprehension.
Human Brain Mapping
6,
1–13.Google Scholar
Scholing, A., &
Veenstra, I.
(1997).
De ouderversie van de Leyton Obsessional Compulsive Inventory
[The parent version of the Leyton Obsessional Compulsive
Inventory].
Unpublished manuscript,
Rijksuniversiteit Groningen.
Schuerholz, L. J.,
Baumgardner, T. L.,
Singer, H. S.,
Reiss, A. L., &
Denckla, M. B.
(1996).
Neuropsychological status of children with Tourette's syndrome
with and without attention deficit hyperactivity disorder.
Neurology
46,
958–965.Google Scholar
Schwab–Stone, M. E.,
Shaffer, D.,
Dulcan, M. K.,
Jensen, P. S.,
Fisher, P.,
Bird, H. R.,
Goodman, S. H.,
Lahey, B. B.,
Lichtman, J. H.,
Canino, G.,
Rubio–Stipec, M., &
Rae, D. S.
(1996).
Criterion validity of the NIMH Diagnostic Interview Schedule for
Children Version 2.3 (DISC-2.3).
Journal of the American Academy of Child and Adolescent
Psychiatry
35,
878–888.Google Scholar
Sergeant, J. A.,
Geurts, H., &
Oosterlaan, J.
(2002).
How specific is a deficit of executive functioning for
attention-deficit/hyperactivity disorder?
Behavioural Brain Research
130,
3–28.Google Scholar
Sergeant, J. A., &
van der Meere, J. J.
(1990).
Additive factor methodology applied to psychopathology with special
reference to hyperactivity.
Acta Psychologica
74,
277–295.Google Scholar
Shaffer, D.,
Fisher, P.,
Lucas, C. P.,
Dulcan, M. K., &
Schwab–Stone, M. E.
(2000).
NIMH Diagnostic Interview Schedule for Children version IV (NIMH
DISC-IV): Description, differences from previous versions, and reliability
of some common diagnoses.
Journal of the American Academy of Child and Adolescent
Psychiatry
39,
28–38.Google Scholar
Shallice, T.
(1982).
Specific impairments of planning.
Philosophical Transactions of the Royal Society of London
298,
199–209.Google Scholar
Sheppard, D. M.,
Bradshaw, J. L.,
Purcell, R., &
Pantelis, C.
(1999).
Tourette's and comorbid syndromes: Obsessive compulsive and
attention deficit hyperactivity disorder. A common etiology?
Clinical Psychology Review
19,
531–552.Google Scholar
Shu, B. C.,
Lung, F. W.,
Tien, A. Y., &
Chen, B. C.
(2001).
Executive function deficits in non-retarded autistic
children.
Autism
5,
165–174.Google Scholar
Silverstein, S. M.,
Como, P. G.,
Palumbo, D. R.,
West, L. L., &
Osborn, L. M.
(1995).
Multiple sources of attentional dysfunction in adults with
Tourette's syndrome: Comparison with attention deficit hyperactivity
disorder.
Neuropsychology
9,
157–164.Google Scholar
Singer, H. S.
(1997).
Neurobiology of Tourette syndrome.
Neurologic Clinics
15,
357–379.Google Scholar
Sivan, A. B.
(1992).
Benton Visual Retention Test
(5th ed.).
San Antonio, TX:
Psychological Corporation.
Snijders, J. T.,
Tellegen, P. J., &
Laros, J. A.
(1989).
Snijders–Oomen Non-Verbal Intelligence Tests: SON-R 5,5-17.
Manual and research report.
Groningen:
Wolters–Noordhoff.
Spencer, T.,
Biederman, J.,
Harding, M.,
O'Donnell, D.,
Wilens, T.,
Faraone, S.,
Coffey, B., &
Geller, D.
(1998).
Disentangling the overlap between Tourette's disorder and
ADHD.
Journal of Child Psychology and Psychiatry and Allied
Disciplines
39,
1037–1044.Google Scholar
Stern, E.,
Silbersweig, D. A.,
Chee, K. Y.,
Holmes, A.,
Robertson, M. M.,
Trimble, M.,
Frith, C. D.,
Frackowiak, R. S. J., &
Dolan, R. J.
(2000).
A functional neuroanatomy of tics in Tourette syndrome.
Archives of General Psychiatry
57,
741–748.Google Scholar
Sverd, J.
(1991).
Tourette syndrome and autistic disorder: A significant
relationship.
American Journal of Medical Genetics
39,
173–179.Google Scholar
Sverd, J.,
Montero, G., &
Gurevich, N.
(1993).
Cases for an association between Tourette syndrome, autistic
disorder, and schizophrenia-like disorder.
Journal of Autism and Developmental Disorders
23,
407–413.Google Scholar
Tabachnick, B. G., &
Fidell, L. S.
(1996).
Using multivariate statistics
(3rd ed.).
New York:
Harper–Collins College Publishers.
Tellegen, P., &
Laros, J.
(1993).
The construction and validation of a nonverbal test of intelligence:
The revision of the Snijders–Oomen Tests.
European Journal of Psychological Assessment
9,
147–157.Google Scholar
Tranel, D.,
Anderson, S. W., &
Benton, A.
(1994).
Development of the concept of “executive function” and
its relationship to the frontal lobes. In
F. Boller &
J. Grafmann (Eds.),
Handbook of neuropsychology (pp.
125–148).
Amsterdam:
Elsevier Science.
Turner, M. A.
(1999a).
Generating novel ideas: Fluency performance in high-functioning and
learning disabled individuals with autism.
Journal of Child Psychology and Psychiatry
40,
189–201.Google Scholar
Turner, M. A.
(1999b).
Repetitive behaviour in autism: A review of psychological
research.
Journal of Child Psychology and Psychiatry
40,
839–849.Google Scholar
Van Haasen, P. P.,
De Bruyn, E. E. J.,
Pijl, Y. J.,
Poortinga, Y. H.,
Spelberg, L. H. C.,
Vander Steene, G.,
Coetsier, P.,
Spoelders–Claeys, R., &
Stinissen, J.
(1986).
WISC-R: Wechsler Intelligence Scale for Children-Revised.
Nederlandstalige uitgave. Handleiding voor instructies en scoring.
Lisse, The Netherlands:
Swets & Zeitlinger B.V.
Volkmar, F. R.
(1999).
Practice parameters for the assessment and treatment of children,
adolescents, and adults with autism and other pervasive developmental
disorders.
Journal of the American Academy of Child and Adolescent
Psychiatry
38,
32S–54S.Google Scholar
Welsh, M. C., &
Pennington, B. F.
(1988).
Assesing frontal lobe functioning in children: Views from
developmental psychology.
Developmental Neuropsychology
4,
199–230.Google Scholar
Weynandt, L. L., &
Willis, W. G.
(1994).
Executive functions in school-aged children: Potential efficacy of
tasks in discriminating clinical groups.
Developmental Neuropsychology
10,
27–38.Google Scholar
Zelazo, P. D.,
Burack, J. A.,
Boseovski, J. J.,
Jacques, S., &
Frye, D.
(2001).
A cognitive complexity and control framework for the study of
autism. In
J. A. Burack,
T. Charman,
N. Yirmiya, &
P. R. Zelazo (Eds.),
The development of autism: Perspectives from theory and
research (pp.
195–217).
Mahwah, NJ:
Erlbaum.
Zelazo, P. D.,
Carter, A.,
Reznick, J. S., &
Frye, D.
(1997).
Early development of executive function: A problem-solving
framework.
Review of General Psychology
1,
198–226.Google Scholar
Zelazo, P. D., &
Müller, U.
(2002).
Executive function in typical and atypical development. In
U. Goswami (Ed.),
Blackwell handbook of childhood cognitive development (pp.
445–469).
London:
Blackwell.
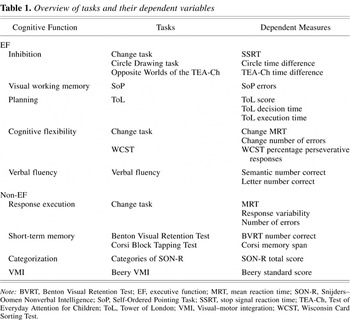
Overview of tasks and their dependent variables
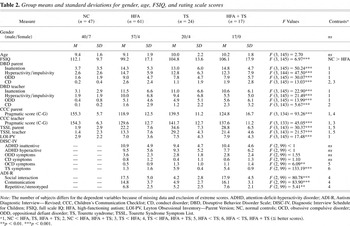
Group means and standard deviations for gender, age, FSIQ, and rating scale scores
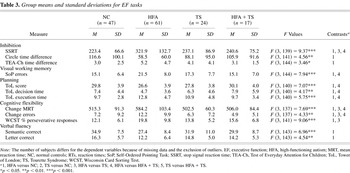
Group means and standard deviations for EF tasks
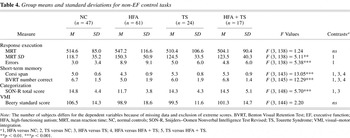
Group means and standard deviations for non-EF control tasks
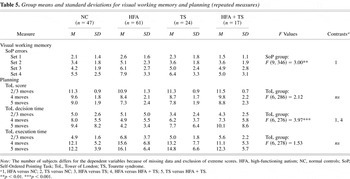
Group means and standard deviations for visual working memory and planning (repeated measures)
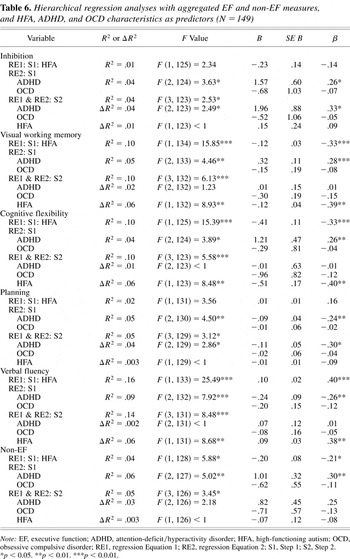
Hierarchical regression analyses with aggregated EF and non-EF measures, and HFA, ADHD, and OCD characteristics as predictors (N = 149)
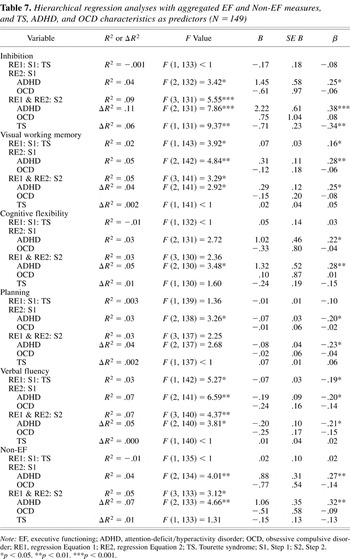
Hierarchical regression analyses with aggregated EF and Non-EF measures, and TS, ADHD, and OCD characteristics as predictors (N = 149)
 You have
Access
- 101
- Cited by