

INTRODUCTION
Some early predictors of later language competencies have been identified. For example, experimental work has shown that infant auditory processing skills are predictive of language outcome (e.g. Benasich & Tallal, Reference Benasich and Tallal2002) and that skills in native language phonetic perception in infancy predict later productive vocabulary (Tsao, Liu & Kuhl, Reference Tsao, Liu and Kuhl2004). In observational and experimental studies, children's use of gestures has been shown to be associated with their vocabulary development (e.g. Iverson & Goldin-Meadow, Reference Iverson and Goldin-Meadow2005; Thal, Tobias & Morrison, Reference Thal, Tobias and Morrison1991).
There is a close relationship between gesture and language use in terms of both evolution and development (Iverson & Goldin-Meadow, Reference Iverson and Goldin-Meadow2005; Volterra, Caselli, Capirci & Pizzuto, Reference Volterra, Caselli, Capirci, Pizzuto, Tomasello and Slobin2005). Bates & Dick (Reference Bates and Dick2002) argued that language emerges from the skills associated with gesture and tool use: attention, perception, imitation and symbolic processing. Deictic gestures, such as showing and pointing, are typically used by infants at age 0 ; 8–0 ; 10. These gestures establish reference to external objects or events. At an age when infants typically start naming objects, about 1 ; 0, they also use ‘recognitory’ gestures (or ‘event schemas’), such as holding a cup to their own lips (Bates & Dick, Reference Bates and Dick2002; Capone & McGregor, Reference Capone and McGregor2004), indicating their awareness of the object's function and the child's emerging symbolic representation. Such gestures are generally contrasted with conventional gestures (e.g. waving ‘bye-bye’) and other routines acquired through imitation in social interaction. A study with children aged 1 ; 0–1 ; 4 (Bates, Thal, Whitesell, Fenson & Oakes, Reference Bates, Thal, Whitesell, Fenson and Oakes1989) found deictic gestures to be correlated with vocabulary comprehension; in contrast, conventional gestures were correlated more with vocabulary production. Recognitory gestures were correlated with both comprehension and production but contributed more variance to a comprehension factor.
A large proportion of the research showing associations between gesture and object use and vocabulary development has been based on parent report using the Macarthur-Bates Communicative Development Inventories (CDI; Fenson et al., Reference Fenson, Dale, Reznick, Thal, Bates, Hartung, Pethick and Reilly1993; Fenson, Marchman, Thal, Dale, Reznik & Bates, Reference Fenson, Marchman, Thal, Dale, Reznick and Bates2007). Parent report of infant and toddler communication has been shown to be reliable and valid (e.g. Dale, Bates, Reznik & Morisset, Reference Dale, Bates, Reznick and Morisset1989; Heilmann, Ellis Weismer, Evans & Hollar, Reference Heilmann, Ellis, Evans and Hollar2005; Wetherby, Allen, Cleary, Kublin & Goldstein, Reference Wetherby, Allen, Cleary, Kublin and Goldstein2002), with high correlations with concurrent behavioural measures. The use of parent report of early communicative development is cost effective (Thal, O'Hanlon, Clemmons & Fralin, Reference Thal, O'Hanlon, Clemmons and Fralin1999) and allows for larger samples to be included than is possible in observation and experimental studies. In using parent reports, however, it is important to establish predictors at the population level, using large representative samples across the socioeconomic spectrum (SES). The CDI norming study reported in Fenson et al. (Reference Fenson, Dale, Reznick, Thal, Bates, Hartung, Pethick and Reilly1993) included a limited representation of families from the lower SES groups, although their representation was increased in the later norming study (Fenson et al., Reference Fenson, Marchman, Thal, Dale, Reznick and Bates2007). Higher scores for vocabulary comprehension and gesture use were reported for ages 0 ; 8–1 ; 0 from families in which mothers had only high school education, the index adopted for SES, but higher scores on several of the toddler inventory scales were reported for children of mothers with higher education. That is, for younger children there seems to be some ‘over-reporting’ of an infant's developing communicative skills from lower SES families. Fenson et al. (Reference Fenson, Marchman, Thal, Dale, Reznick and Bates2007) suggest the higher scores may indicate less objectivity on the part of these mothers ‘either exaggerating the infants’ knowledge or failing to be appropriately cautious in judgments of what their children know' (p. 88).
In the current study we extend previous findings of the variability in early communicative development by providing data from a large representative sample drawn from across the SES spectrum. The CDI (Fenson et al., Reference Fenson, Dale, Reznick, Thal, Bates, Hartung, Pethick and Reilly1993) was used to collect parent reports about their children's early communicative development. The aim of the study was to determine the extent to which communicative behaviours reported at 0 ; 8 and 1 ; 0 predicted vocabulary development at 1 ; 0 and 2 ; 0. In addition, we examined SES differences in reported vocabulary knowledge. Based on previous research using the CDI we hypothesized that gesture and object use would be predictive of our outcome measures at 1 ; 0 and 2 ; 0, vocabulary comprehension and production, although we made no predictions about which components of the CDI gesture scales would be the best predictors. We also hypothesized gender differences in vocabulary use with girls showing a slight advantage, as reported by Fenson et al. (Reference Fenson, Marchman, Thal, Dale, Reznick and Bates2007). Our third hypothesis was that SES differences would be found in the number of words children understood or produced.
METHOD
Participants
The participants were recruited for the Early Language in Victoria Study (ELVS), a prospective, cohort study of language development (Reilly et al., Reference Reilly, Eadie, Bavin, Wake, Prior, Williams, Bretherton, Barrett and Ukoumunne2006, Reference Reilly, Wake, Bavin, Prior, Williams, Bretherton, Eadie, Barrett and Ukoumunne2007). The children are being followed from 0 ; 8 to 7 ; 0. A total of 1,911 infants born between November 2002 and August 2003 were recruited through Maternal and Child Health Clinics in six local government areas (LGAs) across Melbourne, Australia. The clinics provide regular check-ups for babies and preschoolers. The nurses informed parents about the project when they brought their children for their regular 8-month scheduled check-up, attended by nearly 80% of all infants.
All LGAs within the metropolitan Melbourne area were stratified into tertiles according to the Australian census-based SEIFA Index for Relative Socio-Economic Disadvantage (SEIFA),Footnote 1 and two non-adjoining LGAs were randomly selected from each tier. All children aged between seven-and-a-half and ten months living in the six LGAs during the recruitment phase were targeted, unless they had developmental delay (e.g. Down syndrome), cerebral palsy or other serious intellectual or physical disability, or if their parents did not speak and understand English.
Because development is rapid over a six-month period for infants, we restricted the age range for the current study to a two-month period: children aged between seven-and-a-half and nine-and-a-half months for the first data collection and between eleven-and-a-half and thirteen-and-a-half months for the second (N=1,591, with 804 boys, 787 girls). To help maintain the sample, we provided parents with fridge magnets giving our contact details, circulated regular newsletters to parents and mailed out birthday cards to the children. For the second data collection, at 1 ; 0, 92·2% (1,467) of the original sample participated (732 boys, 735 girls); for the third data collection at 2 ; 0, 1,448, 91·0% of the original sample responded (731 boys, 717 girls).Footnote 2
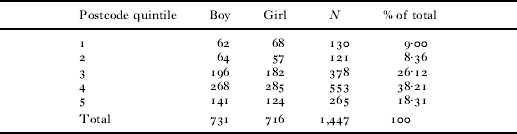
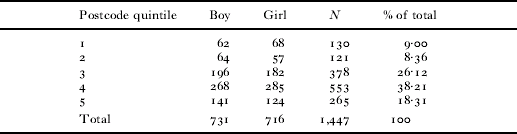
In order to analyse SES differences, the families were divided into five ordered socioeconomic categories on the basis of the SEIFA Index for Relative Socio-Economic Disadvantage score corresponding to their postcode of residence. Quintiles (cut-points) calculated for the distribution of SEIFA scores for Victoria in 1996 were used to define the categories. The number of children in each category is listed in Table 1. Even though we recruited across the SES spectrum, there was underrepresentation in the two lowest SES groups.
Participants at 2 ; 0: Sample size by gender and postcode quintile
Materials and procedure
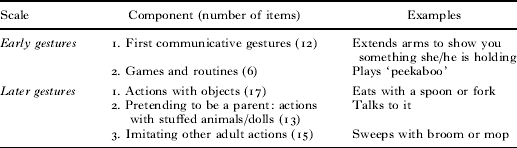
The CDI was included in a questionnaire package mailed out when the children were aged 0 ; 8, 1 ; 0 and 2 ; 0. Parents mailed the completed questionnaires back to the ELVS office. For the 0 ; 8 and 1 ; 0 data collection, parents completed the CDI Words and Gestures (CDI:W&G), which has been used for infants aged 0 ; 8–1 ; 4 (Fenson et al., Reference Fenson, Dale, Reznick, Thal, Bates, Hartung, Pethick and Reilly1993), although its use has recently been extended to 1 ; 6 (Fenson et al., Reference Fenson, Marchman, Thal, Dale, Reznick and Bates2007). In our pilot study some parents were concerned that their child was not producing words at 0 ; 8; for this reason we decided to exclude the vocabulary sections. Because we did not want to burden the families, we only included three gesture components: First Communicative Gestures, Games and Routines and Actions with Objects. Table 2 lists the gesture and object use components from the CDI for which we collected data at age 0 ; 8 and 1 ; 0, together with the number of items in each component and examples.
Components of the CDI: Words and Gestures, with examples
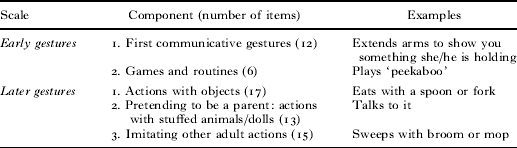
The first two components are listed in the CDI manual as ‘early gestures’. Items in First Communicative Gestures represent the onset of intentional communication; the first three are deictic gestures (giving, showing and pointing), which are viewed as initiations for joint attention. The other items in this component are conventionalized gestures, such as shaking the head for ‘no’. Conventional routines form the Games and Routines component; these routines are learned through social interaction. The third group of behaviours included at 0 ; 8 was Actions with Objects, one of three components which make up what is identified as a ‘later gestures’ scale on the CDI:W&G. This component contains items that are classified as recognitory gestures.
In addition to the vocabulary sections of the CDI:W&G, for the 1 ; 0 data collection two additional ‘gesture’ components were included: Pretending to be a Parent and Imitating Other Adult Actions. While items included in Imitating Other Adult Actions tap a child's developing knowledge of objects and their uses, the items in the Pretending to be a Parent component represent true symbolic gestures (Fenson et al., Reference Fenson, Marchman, Thal, Dale, Reznick and Bates2007) since children are doing more than just using an object (see Table 2 for examples). For First Communicative Gestures parents are asked to check ‘not yet’, ‘sometimes’ or ‘often’. A score of 1 is given for each item checked as ‘sometimes’ or ‘often’; for the other gesture components ‘yes’/‘no’ responses are requested and a score of 1 is given for all ‘yes’ responses.
For the CDI:W&G vocabulary items, parents are asked to check which words their child understands and also which words their child produces from a possible 396 words. For the 2 ; 0 data collection the CDI Words and Sentences (CDI:W&S), designed for ages 1 ; 4–2 ; 6, was used. Parents are asked to check the words their child produces from a possible 680 words; there is no comprehension component. For both inventories, a score of 1 is given for each item checked. Because there are differences between American and Australian usage, we obtained permission from the CDI authors and publishers to change 13 vocabulary items on the CDI:W&G (e.g. crocodile for alligator) and 24 on the CDI:W&S (e.g. footpath for sidewalk and nappy for diaper).
RESULTS
We first report data at 0 ; 8, 1 ; 0 and 2 ; 0 and the results of three analyses of variance (ANOVA) to investigate SES and gender differences in vocabulary at 1 ; 0 and 2 ; 0. We then report the results of regression analyses conducted to determine the amount of variance contributed by the gesture components of the CDI to the children's vocabulary at 1 ; 0 and 2 ; 0.
CDI:W&G at 0 ; 8 and 1 ; 0
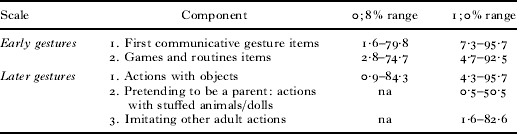
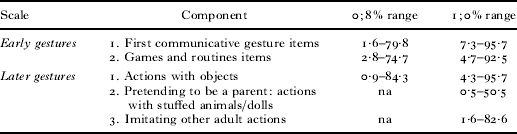
Table 3 shows the range in usage at 0 ; 8 and 1 ; 0 for the items in each of the gesture components. At 0 ; 8 there was high variability in the use of items in each component. For some of the items the percentage of use was low; for other items over 74% of the children were reported to be using them. An overall increase in the percentage of use can be seen at 1 ; 0, but again there was high variability. For the two additional components included in the 1 ; 0 questionnaire, items in Pretending to be a Parent, the true symbolic gestures, were reported to be used less frequently than items in Imitating Other Adult Actions.
Percentage of children reported to be using CDI items at 0 ; 8 and 1 ; 0
The number of words understood at 1 ; 0 months ranged from 0 to 397, with a mean of 72·3 (SD 60·5) and a median of 57. The number of words produced ranged from 0 to 123 with a mean of 5·9 (SD 9·3) and a median of 3. In comparison, Fenson et al. (Reference Fenson, Marchman, Thal, Dale, Reznick and Bates2007) report a mean of 84·9 (SD=52·5) and a median of 74 for words understood at 1 ; 0 for their sample size of 157 at this age level in the norming study, and a mean of 10 (SD=12) and median of 5 for words produced.
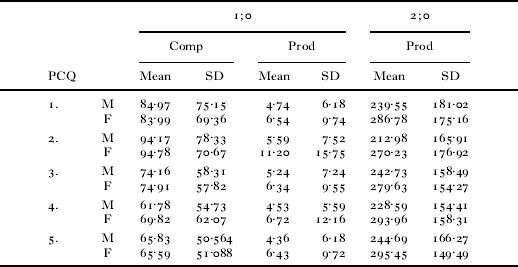
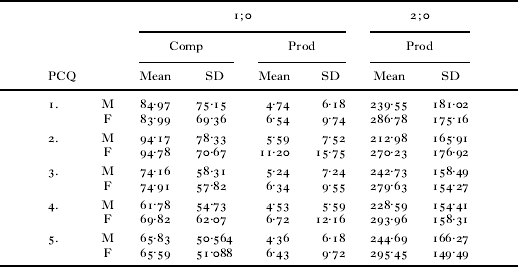
The means and SDs by SEIFA postcode quintile (PCQ) are given in Table 4. We ran two Univariate ANOVAs on these 1 ; 0 data, one for words understood and one for words produced with SES and gender as the between-subjects factors. The analyses on words understood revealed a significant main effect for SES (F(4, 9)=10·47, p<0·001, ŋp2=0·022), but there was no main effect for gender (p=0·712). Nor was there an interaction of gender and SES (p=0·804). Post hoc Bonferroni tests showed that the lowest SES group (group 1) did not differ significantly from groups 2 or 3, but there were significant differences between groups 1, 4 and 5 (1 vs. 4, p=0·011; 1 vs. 5, p=0·027). The parents in the highest two SES quintiles reported that their children understood fewer words than did parents in the lowest SES group.
Summary of vocabulary at 1 ; 0 and 2 ; 0 by postcode quintile (PCQ)Footnote a
a Comp=words understood; Prod=words produced.
In the analysis for words produced at 1 ; 0, there was a main effect for SES (F(4, 9)=2·66, p>0·001, ŋp2=0·03). Post hoc analyses showed significant differences between groups 2, 4 and 5 (2 vs. 4, p=0·024; 2 vs. 5, p=0·026). Children in group 2 were reported to be producing more words than children in the two highest SES groups. There was also a main effect for gender (F(1, 9)=20·11, p=0·03, ŋp2=0·014). Girls were reported to be saying more words than boys, but there was no significant interaction of gender and SES (p=0·22), showing that the gender effect was constant across SES.
W&S at 2 ; 0
Words produced at 2 ; 0 ranged from 0 to 679, with a mean of 261·3 (SD 162 and a median of 246). In comparison, Fenson et al. (Reference Fenson, Marchman, Thal, Dale, Reznick and Bates2007) report a mean of 307·3 (SD=162·4) and a median of 309 for words produced (N=135). Table 4 shows the number of words produced by PCQ and gender. There was a large increase in the number of words produced between 1 ; 0 and 2 ; 0; the words produced at 1 ; 0 and at 2 ; 0 were significantly correlated (r=0·40). An ANOVA on words produced at 2 ; 0 with SES and gender as the between-subjects variables showed only a main effect for gender (F(1, 9)=26·61, p<0·001, ŋp2=0·018), with girls reported to be saying more words than the boys. There was no significant effect of SES (p=0·621) and no interaction of SES and gender (p=0·759).
Correlations amongst measures
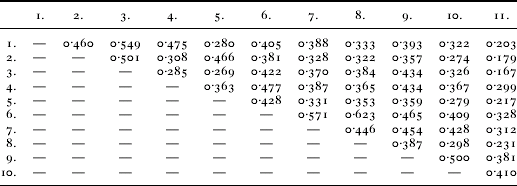
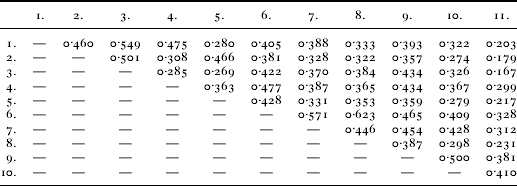
Before reporting a series of regression analyses using the 0 ; 8 and 1 ; 0 gesture scales to predict vocabulary outcome, we present, in Table 5, the correlations amongst the 0 ; 8, 1 ; 0 and 2 ; 0 measures. As can be seen, the correlations were low to medium; all were significant at p<0·001. The correlation between Actions with Objects at 0 ; 8 and words produced at 2 ; 0 was lowest (r=0·167). Actions with Objects and Imitating other Adult Actions, both at 1 ; 0, showed the highest correlation (r=0·623). This is perhaps not surprising given that both involve the use of objects.
Pearson's correlations: Gesture components at 0 ; 8 and 1 ; 0 and vocabulary at 1 ; 0 and 2 ; 0
p<0·001 for all correlations.
Measures: 1=0 ; 8 1st Communicative Gestures, 2=0 ; 8 1st Games and Routines, 3=0 ; 8 Actions With Objects, 4=1 ; 0 1st Communicative Gestures, 5=1 ; 0 1st Games and Routines, 6=1 ; 0 Actions With Objects, 7=1 ; 0 Pretending to be a Parent, 8=1 ; 0 Imitating other Adult Actions, 9=1 ; 0 Words Understood, 10=1 ; 0 Words Produced, 11=2 ; 0 words produced.
Predicting vocabulary at 1 ; 0
In the first linear regression analysis on the words understood at 1 ; 0, we used the three 0 ; 8 CDI gesture subscales as predictors. The total explained variance was 22·4% (p<0·001). All three subscales contributed some unique variance overall. First Communicative Gestures contributed 1·77% (t=5·79, p<0·001), Games and Routines contributed 1·54% (t=5·37, p<0·001) and Actions with Objects contributed 4·16% (t=8·88, p<0·001).
A regression analysis on the words produced at 1 ; 0 showed that the total explained variance was 14·3% (p<0·001). First Communicative Gestures contributed 2·16% unique variance (t=6·1, p<0·001), Games and Routines contributed only 0·81% (t=3·67, p<0·001) and Actions with Objects contributed 1·8% (t=5·52, p<0·001). Thus First Communicative Gestures contributed most unique variance for vocabulary produced. Included in this component are deictic and conventional gestures.
Predicting vocabulary at 2 ; 0
Additional regression analyses were conducted with words produced at 2 ; 0 as the outcome measure. The first analysis used the three 0 ; 8 CDI predictors; the second analysis used the five 1 ; 0 CDI predictors. The total variation explained by the three CDI 0 ; 8 predictors was only 5·1% (p<0·001), with First Communicative Gestures contributing 1·15% unique variance (t=4·19, p<0·001) and Games and Routines 0·55% (t=2·9, p=0·004), while Actions with Objects contributed no unique variance.
In the second analysis, using the 1 ; 0 CDI predictors, the total variance explained was 14·5% (p<0·001), with First Communicative Gestures significantly contributing 1·5% of the variance (t=4·89, p<0·001), Games and Routines contributing 0·25% (t=2·02, p=0·043), Actions with Objects 1·00% (t=4·03, p<0·001) and Pretending to be a Parent 1·39% (t=4·75, p<0·001). Imitating other Adult Actions contributed no unique variance.
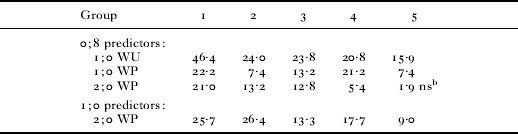
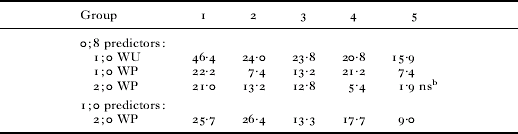
We also investigated the amount of variance contributed overall by the 0 ; 8 and 1 ; 0 predictors to the vocabulary scores for each SES group (see Table 6). More variance was predicted by gestures used at 0 ; 8 for group 1, the lowest SES group, than for the other groups. The lowest amount of variance predicted by gesture use at 0 ; 8 and 1 ; 0 was for group 5, the highest SES group.
Percentage of variance contributed overall to vocabulary scores at 1 ; 0 and 2 ; 0 by 0 ; 8 and 1 ; 0 predictors, by SES groupFootnote a
notes:
a WU=words understood, WP=words produced.
b For the non-significant result for group 5, p=0·178. For all other results p<0·001 except for 0 ; 8 predictors of 1 ; 0 WU for group 2, p=0·037, and for the same group for 0 ; 8 predictors of 2 ; 0 WP, p=0·001.
DISCUSSION
Gestures as predictors of vocabulary at 1 ; 0
We hypothesized that the communicative behaviours characterized as ‘gestures’ on the CDI would predict later vocabulary use. This hypothesis was supported in that a significant amount of variation in vocabulary comprehension and vocabulary production at 1 ; 0 was predicted by the CDI gesture measures. However, the CDI gesture measures were found to be better predictors of vocabulary comprehension than of vocabulary production at 1 ; 0 and 2 ; 0.
In our analyses by SES, groups were not determined on family-specific measures; rather they were determined on the basis of postcode, which equates to a number of geographic/suburban areas. Group differences in how much variance was predicted were found for words produced and words understood. Predictions were stronger from the lowest SES group. That is, more variance was predicted by gestures used at 0 ; 8 for the lowest SES group (group 1) than for the other four groups. The lowest amount of variance for vocabulary predicted by gesture use at 0 ; 8 and 1 ; 0 was for group 5, the highest SES group. We comment further on SES differences below when discussing vocabulary across socioeconomic levels.
For the sample overall we found differences in which of the early communicative behaviours predicted variance in vocabulary, but the amount of unique variance contributed by any of the individual components of the CDI gestures to words produced at 1 ; 0 and 2 ; 0 was low. Actions with Objects was the component which predicted most unique variance for vocabulary comprehension at 1 ; 0. In contrast, First Communicative Gestures predicted most variance for vocabulary production. Overall, the variance was shared across the components, suggesting variation in when children start using the different gestures and actions with objects listed in the components of the CDI.
Comprehension precedes production in young children's vocabulary development, and this is evident from the number of words understood and words produced at 1 ; 0. Thus the finding that Actions with Objects was more predictive of word comprehension than of word production indicates that understanding about objects is an essential step in the development of a child's vocabulary. As argued by Liskowski, Carpenter, Striano & Tomasello (Reference Liszkowski, Carpenter, Striano and Tomasello2006), infants draw on their communicative abilities to inform others; they first use vocal and gestural signals for intentional communication, but as they develop an understanding of the functions of objects they start to use words as symbols for these objects.
The CDI 1 ; 0 gesture scores were found to be better predictors of words produced at 2 ; 0 than were the 0 ; 8 scores. In fact, the lowest correlation was between Actions with Objects at 0 ; 8 and words produced at 2 ; 0. This instability in the development of early communicative behaviours was reported previously by Fenson, Bates, Dale, Goodman, Reznick & Thal (Reference Fenson, Bates, Dale, Goodman, Reznick and Thal2000) and Reilly et al. (Reference Reilly, Wake, Bavin, Prior, Williams, Bretherton, Eadie, Barrett and Ukoumunne2007). The predictive power of the CDI at 1 ; 0 is independent of its predictive power at 2 ; 0 (Fenson et al., Reference Fenson, Bates, Dale, Goodman, Reznick and Thal2000). Some children are delayed at the onset of communicative behaviour, and in the early years children develop at different rates (Fenson et al., Reference Fenson, Dale, Reznick, Thal, Bates, Hartung, Pethick and Reilly1993; Thal, Bates, Goodman & Jahn-Samilo, Reference Thal, Bates, Goodman and Jahn-Samilo1997).
A study using a Swedish modification of the CDI for the purpose of identifying children at 1 ; 6 who have severe language disorders at 3 ; 0, found that the number of words produced was the best predictor, rather than number of words understood or gestures used (Westerlund, Berglund & Eriksson, Reference Westerlund, Berglund and Eriksson2006). However, the sensitivity was not good, leading the researchers to conclude that 1 ; 6 is too early to identify children who will have a severe language impairment. ELVS is designed to assess the children's language outcome at 4 ; 0, and determine how well the early communicative measures are predictive of language impairment.
Gender differences
Our second hypothesis was that there would be gender differences. The girls were reported to produce more words than boys at both 1 ; 0 and 2 ; 0. This finding is consistent with other findings, and is represented in the CDI manual by different standard scores for girls and boys. However, Fenson et al. (Reference Fenson, Marchman, Thal, Dale, Reznick and Bates2007) also report that girls had slightly higher scores for words understood across the age range 0 ; 8–1 ; 6, but we found no gender differences for words understood. Although we changed a small number of words to be more representative of words familiar in the Australian context, the means at 1 ; 0 and 2 ; 0 were found to be lower than reported for the norming study (Fenson et al., Reference Fenson, Marchman, Thal, Dale, Reznick and Bates2007). Our means are based on a larger sample (1,447 compared to 157 at 1 ; 0 and 135 at 2 ; 0 for the CDI norms reported), an important consideration given the variability in vocabulary at these ages. It is also less middle class than the norming study. In a study using the CDI modified for British English in Oxford, Hamilton, Plunkett & Schafer (Reference Hamilton, Plunkett and Schafer2000) also found lower vocabulary scores for British children than those reported in the CDI norming study, suggesting cultural differences may affect the rate of vocabulary development.
Differences in vocabulary across socioeconomic levels
Our third hypothesis was that we would find differences across SES groups in the number of words reported to be known by the children. We used as our index of SES quintiles of socioeconomic disadvantage, determined by a combination of factors (education, income and employment), not just maternal education alone, as typically used in other studies. However, since the analyses were based on postcode averages, not family-specific measures, the within-postcode variance has been lost and so their explanatory power may be reduced.
The children in the highest two SES levels were reported to comprehend fewer words than children in the lower groups, but this finding did not carry over to words produced. Children in group 2, the second lowest SES group, had a higher score for vocabulary produced than the other groups. While there was large variation in the number of words reported to be produced by girls in this groups, no significant interaction of gender and SES was found.
In the CDI norming study, Fenson et al. (Reference Fenson, Marchman, Thal, Dale, Reznick and Bates2007) reported slightly higher scores for words understood at 1 ; 0 for children whose mothers had a low education level, and in a large study by Feldman, Dollaghan, Campbell, Kurs-Lasky, Janosky & Paradis (Reference Feldman, Dollaghan, Campbell, Kurs-Lasky, Janosky and Paradis2000), higher scores for words understood and words produced were reported for children from lower SES levels (determined by mothers' education level). In a New Zealand study with 61 children, Reese & Read (Reference Reese and Read2000) also found that mothers with more education estimated their 1 ; 7 children's vocabulary to be lower than did less educated mothers. Our findings indicate that parents from the lower SES areas might assume their children understand more, whereas parents in the higher SES areas are more cautious or, as Fenson et al. (Reference Fenson, Marchman, Thal, Dale, Reznick and Bates2007) suggest, parents in the lower SES areas are less objective. However, it is also possible that the children in the lower SES groups did understand more words, but as we used no other measure of comprehension we can make no conclusions about this.
CONCLUSION
The study is significant in that it involved a very large sample with broad (although not equal) representation from across the SES spectrum, defined by a number of factors, not just maternal education. The results add support to previous findings showing significant associations between early communicative behaviours and vocabulary development. Although the amount of unique variance predicted by the separate components of the CDI gesture scales was found to be small, gesture use overall explained a substantial amount of variation for word comprehension at 1 ; 0 (22·4%), but less for word production at 1 ; 0 (14·3%) and 2 ; 0 (14·5% using the 1 ; 0 scores as predictors).
The results of our analyses by SES group showed differences in how parents in the different groups estimated their children's vocabulary knowledge. Our results support earlier findings that suggest parents from higher SES areas might underestimate their children's comprehension at 1 ; 0 or, alternatively, parents from the lower end of the SES spectrum may overestimate. For vocabulary production, there was one unexplained finding for SES group 2 for whom the number of words produced at 1 ; 0 was high, but no differences across the SES groups were found at 2 ; 0, indicating that the main difference across SES groups is estimating what a child understands. Of interest is the finding that early ‘gesture’ use was more predictive of later vocabulary for the lowest SES group. Although this may result from using postcode averages, not family-specific measures, it warrants further investigation.
There is a close association between vocabulary and grammatical development (Bates & Goodman, Reference Bates, Goodman and MacWhinney1999), and Marchman & Bates (Reference Marchman and Bates1994) proposed that a ‘critical mass’ of vocabulary is required for the advancement of grammar. Thus the identification of precursors of vocabulary development should be of value in identifying children who may be at risk for later language problems. However, whether this is so or not will depend on the stability of communicative development over the years. The current study focused on the children in the ELVS sample who were in a two-month age range at 0 ; 8 and 1 ; 0. With the larger ELVS sample we are continuing to document the development of language. In ELVS we will be able to identify the extent to which children's gesture and object use, as well as their vocabulary, in their first two years are predictive of language outcomes at age four.