



1 Introduction
Semiconductor cleaning is an important process because contaminant particles adhering to a wafer surface reduce the quality of the semiconductor device. As the size of semiconductor devices decreases, the size of contaminant particles that can cause fatal defects also decreases. Furthermore, unconventional materials have been introduced to reduce power consumption and improve the speed of semiconductor devices. The conventional RCA clean, which is a batch immersion chemical cleaning method, can dissolve these new materials and cause pattern damage. Therefore, better cleaning techniques are required for removing contaminant particles without pattern damage. Physical cleaning techniques include a cryogenic high-speed spray of micro-solid nitrogen (Ishimoto et al.
Reference Ishimoto, Oh, Koike and Ochiai2014), an Ar aerosol method (Okada, Kawata & Sonoda Reference Okada, Kawata and Sonoda2002), a CO
 $_{2}$
gas cluster method (Choi et al.
Reference Choi, Kim, Yoon, Lee, Kang, Kim, Park, Kwon and Kim2013) and wet laser shockwave cleaning (Kim et al.
Reference Kim, Busnaina, Park and Kim2012). Megasonic cleaning is an acoustic cleaning technique that uses high frequencies of 1 MHz and above. It is a gentler, more even cleaning method than acoustic cleaning with lower-frequency waves. However, the physical forces of megasonic cleaning can cause pattern damage. Thus, clarifying the mechanism of particle removal by megasonic cleaning and control of cavitation bubbles in the megasonic field are essential for removing contaminant particles without pattern damage. We have previously developed a numerical analysis method of single-bubble behaviour in a megasonic field (Ochiai & Ishimoto Reference Ochiai and Ishimoto2014). In an actual megasonic cleaning field, multiple bubbles interact with each other and show complicated behaviour. We performed numerical analysis of two bubbles in a megasonic field focusing on the translational motion as a first step in clarifying the multiple-bubble dynamics in megasonic cleaning (Ochiai & Ishimoto Reference Ochiai and Ishimoto2015). To understand the removal of particles during megasonic cleaning, the effect of the interaction of multiple bubbles on bubble collapse and the resulting impulsive pressure should also be discussed.
Multiple-bubble behaviour is also important for clarifying cavitation erosion (Kim et al. Reference Kim, Chahine, Franc and Karimi2014), sonoluminescence and sonochemistry (Grieser et al. Reference Grieser, Choi, Enomoto, Harada, Okitsu and Yasui2015), and there are many previous studies about the effect of multiple-bubble interactions on bubble collapse behaviour and impulsive pressure. Lauterborn & Hentschel (Reference Lauterborn and Hentschel1985, Reference Lauterborn and Hentschel1986) performed experiments examining the oscillation behaviour of two same-sized and two different-sized bubbles. The same-sized bubbles approached each other, whereas for the different-sized bubbles, the smaller bubble generated a microjet towards the larger bubble and disintegrated. Chahine & Liu (Reference Chahine and Liu1985) and Chahine & Duraiswami (Reference Chahine and Duraiswami1992) numerically analysed bubble cluster behaviour with the boundary element method and the singular perturbation method, and demonstrated that bubble growth is suppressed and the bubble collapse time is delayed by the interaction with the surrounding bubbles. Foody & Huber (Reference Foody and Huber1981), Nakagawa (Reference Nakagawa1985) and Shima & Jounouchi (Reference Shima and Jounouchi1994) theoretically derived the natural frequencies of two, three and four bubbles, and showed that the natural frequency decreases with increasing bubble number. The natural frequency of bubbles has also been derived for a single bubble (Howkins Reference Howkins1965; Shima & Tomita Reference Shima and Tomita1981) and two bubbles (Fujiwara & Shima Reference Fujiwara and Shima1993) near a wall boundary, and it was shown that the wall boundary decreases the natural frequency. Takahira, Akamatsu & Fujikawa (Reference Takahira, Akamatsu and Fujikawa1994) used a stricter method considering bubble–bubble interactions and demonstrated that the natural frequency of a bubble cluster is smaller than that of a single bubble when the bubbles oscillate in phase. Tomita, Shima & Ohno (Reference Tomita, Shima and Ohno1984) studied the behaviour of multiple bubbles attached to a wall acted on by a shock wave and the induced wall pressure. They showed that, for bubbles distributed in a straight line, maximum wall pressure induced by multiple bubbles is lower than that induced by a single bubble, and that the value approaches an asymptotic value as the bubble number increases. They also performed the experiment for concentrically distributed bubbles, and they observed that the maximum wall pressure decreases as the bubble number increases for two bubbles, whereas it gradually increases towards a value for a single bubble. Dear & Field (Reference Dear and Field1988) examined the collapse of arrays of bubbles by shock waves, and they showed that the bubbles that collapsed later induced high pressure owing to the effect of the previous collapsed bubbles. Blake et al. (Reference Blake, Robinson, Shima and Tomita1993) performed an experiment on two bubbles vertically aligned with a wall boundary and showed that the bubble nearer the wall was elongated perpendicular to the wall and finally separated into two sections. Kodama, Takayama & Nagayasu (Reference Kodama, Takayama and Nagayasu1996) examined the behaviour of two bubbles induced by a shock wave, and showed that the bubble–bubble interaction does not affect the bubble behaviour when the distance between bubbles is more than six times the initial bubble diameter, and that the direction of the microjet induced by the bubble collapse changes with the distance between bubbles. They used a gelatin wall, and the penetration depth into the wall caused by the bubble collapse showed that the collapse of two bubbles of different initial radius was stronger than that of the single bubble. Fong et al. (Reference Fong, Adhikari, Klaseboer and Khoo2009) and Chew et al. (Reference Chew, Klaseboer, Ohl and Khoo2011) examined the interaction behaviour of two or three spark-generated bubbles, and used the distance between bubbles and the phase difference of the bubbles to categorize the bubble behaviour into coalescence of bubbles, microjet formation against another bubble, and repulsion of bubbles (catapult effect) by a high-speed jet. Swantek & Austin (Reference Swantek and Austin2010) investigated the bubble collapse induced by stress wave loading, and showed that the upstream bubble collapsed, similar to the single bubble. In contrast, the collapse of the downstream bubble was delayed because of the shielding by the upstream bubble from the stress wave, and the collapse was induced by the high pressure caused by the upstream bubble. They also examined the behaviour of a four-bubble staggered array, and they observed that the most upstream bubble collapsed first and the next two bubbles that collapsed generated microjets towards the most downstream bubble. Han et al. (Reference Han, Köhler, Jungnickel, Mettin, Lauterborn and Vogel2015a ) reported the behaviour of two laser-generated bubbles and evaluated the bubble behaviour by using three non-dimensional parameters: the non-dimensional distance between bubbles, ratio of bubble radii and phase difference of the two bubble oscillations. Cui et al. (Reference Cui, Wang, Wang and Zhang2016) examined the behaviour of two, three and four bubbles generated by electric discharge, and showed that, in the case of three bubbles, the middle bubble was elongated by the attraction force from the other two bubbles and finally separated. Recently, multiple-bubble behaviour has also been studied numerically. Lauer et al. (Reference Lauer, Hu, Hickel and Adams2012) numerically investigated the collapse behaviour of cavity arrays induced by a shock wave, and for three bubbles, the pressure induced by the collapse of the most upstream bubble is lower than that induced by the single bubble, and the pressure induced by the second and third bubbles becomes high when the distance between the bubbles is small. Betney et al. (Reference Betney, Tully, Hawker and Ventikos2015) numerically studied the interaction between a shock wave and multiple bubbles. They showed that, for two bubbles, the pressure induced by the collapse of the downstream bubbles acts on the upstream bubble, and the upstream bubble collapse induces high pressure again, in addition to results similar to the results of Swantek & Austin (Reference Swantek and Austin2010). They also calculated the behaviour of two different-sized bubbles, and showed that the bubbles induce higher pressure than two bubbles of the same size. Han, Zhang & Liu (Reference Han, Zhang and Liu2015b ) performed numerical analyses of two oscillating bubbles using the boundary integral method. They classified the behaviours of bubbles using the distance between the bubbles and the ratio of the minimum radius to the maximum radius. Furthermore, numerical studies of far more bubbles have been published (Ma, Hsiao & Chahine Reference Ma, Hsiao and Chahine2015; Tiwari, Pantano & Freund Reference Tiwari, Pantano and Freund2015). Omta (Reference Omta1987) and D’Agostino & Brennen (Reference D’Agostino and Brennen1989) studied the nonlinear multiple bubble oscillations in an acoustic field using averaged equations not considering the motion of individual bubbles. In a study of cleaning by cavitation bubbles, a coupling model of the fluid analysis of cavitation bubbles and the surrounding fluid, and material analysis of adhered particles, was proposed (Chahine et al. Reference Chahine, Kapahi, Choi and Hsiao2015).
Multiple bubble dynamics in an acoustic wave are crucial for clarifying the mechanism of particle removal in megasonic cleaning and for controlling multiple bubble behaviour in a megasonic field. Many previous studies used laser or electric spark discharge for bubble generation to observe accurately controlled bubbles, whereas there are few studies of multiple-bubble behaviour in an acoustic field (Ochiai & Ishimoto Reference Ochiai and Ishimoto2015; Xi, Xiongliang & Rui Reference Xi, Xiongliang and Rui2015). In the present study, multiple bubble behaviour in a megasonic field near a sidewall is numerically analysed by our numerical analysis method (Ochiai & Ishimoto Reference Ochiai and Ishimoto2014, Reference Ochiai and Ishimoto2015), and the effects of bubble–bubble interactions on the bubble behaviour in a megasonic field and the wall pressures induced by the collapses are discussed. Multiple-bubble behaviour depends on several parameters (Chew et al. Reference Chew, Klaseboer, Ohl and Khoo2011). In this study, the effects of the bubble equilibrium radius, bubble configurations and distance between bubbles are analysed.
2 Numerical method
A compressible locally homogeneous model of a gas–liquid two-phase medium is used to analyse the bubble behaviour in a megasonic field and the pressure wave induced by the bubble collapse (Okuda & Ikohagi Reference Okuda and Ikohagi1996; Ochiai et al.
Reference Ochiai, Iga, Nohmi and Ikohagi2010). In this model, it is assumed that an unlimited number of infinitely small bubbles are distributed homogeneously in the control volume of the gas–liquid two-phase medium. The liquid and gas phases are assumed to follow the Tammann equation of state and the equation of state for an ideal gas. The density of the locally homogeneous medium is expressed by linearly combining the gas-phase and liquid-phase densities with the void fraction,
 $\unicode[STIX]{x1D6FC}$
, and by using the relationship between the mass fraction of the gas,
 $Y$
, and
 $\unicode[STIX]{x1D6FC}$
(
 $\unicode[STIX]{x1D70C}(1-Y)=\unicode[STIX]{x1D70C}_{l}(1-\unicode[STIX]{x1D6FC})$
, where
 $\unicode[STIX]{x1D70C}Y=\unicode[STIX]{x1D70C}_{g}\unicode[STIX]{x1D6FC}$
). The equation of state of a two-phase medium is expressed as
 $$\begin{eqnarray}\displaystyle \unicode[STIX]{x1D70C}=\frac{p(p+p_{c})}{K_{l}(1-Y)p(T+T_{0})+R_{g}Y(p+p_{c})T}, & & \displaystyle\end{eqnarray}$$
where
 $\unicode[STIX]{x1D70C}$
,
 $p$
and
 $T$
are the density, pressure and temperature of a two-phase medium, respectively,
 $Y$
is the mass fraction of a gas,
 $p_{c}$
is the liquid pressure constant,
 $K_{l}$
is the liquid constant,
 $T_{0}$
is the liquid temperature constant, and
 $R_{g}$
is the gas constant. The gas phase is treated as an air–vapour mixture such that
 $R_{g}=D_{a}R_{ga}+(1-D_{a})R_{gv}$
, where
 $D_{a}$
is the density ratio of air in the gas phase, and
 $R_{ga}$
and
 $R_{gv}$
are the air and vapour gas constants with values of 287.0 and
 $461.6~\text{J}~\text{kg}^{-1}~\text{K}^{-1}$
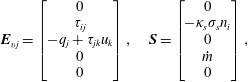
, respectively. The governing equations are the continuity equation, the momentum equation, the total energy equation of a compressible two-phase medium and the continuity equations of the mixture gas and non-condensable gas. They are expressed as
 $$\begin{eqnarray}\displaystyle \frac{\unicode[STIX]{x2202}\boldsymbol{Q}}{\unicode[STIX]{x2202}t}+\frac{\unicode[STIX]{x2202}(\boldsymbol{E}_{j}-\boldsymbol{E}_{vj})}{\unicode[STIX]{x2202}x_{j}}=\boldsymbol{S}, & & \displaystyle\end{eqnarray}$$
 $$\begin{eqnarray}\displaystyle \boldsymbol{Q}=\left[\begin{array}{@{}c@{}}\unicode[STIX]{x1D70C}\\ \unicode[STIX]{x1D70C}u_{i}\\ e\\ \unicode[STIX]{x1D70C}Y\\ \unicode[STIX]{x1D70C}YD_{a}\end{array}\right],\quad \boldsymbol{E}_{j}=\left[\begin{array}{@{}c@{}}\unicode[STIX]{x1D70C}u_{j}\\ \unicode[STIX]{x1D70C}u_{i}u_{j}+\unicode[STIX]{x1D6FF}_{ij}p\\ \unicode[STIX]{x1D70C}u_{j}H\\ \unicode[STIX]{x1D70C}u_{j}Y\\ \unicode[STIX]{x1D70C}u_{j}YD_{a}\end{array}\right], & & \displaystyle\end{eqnarray}$$
 $$\begin{eqnarray}\displaystyle & \displaystyle \boldsymbol{E}_{vj}=\left[\begin{array}{@{}c@{}}0\\ \unicode[STIX]{x1D70F}_{ij}\\ -q_{j}+\unicode[STIX]{x1D70F}_{jk}u_{k}\\ 0\\ 0\end{array}\right],\quad \boldsymbol{S}=\left[\begin{array}{@{}c@{}}0\\ -\unicode[STIX]{x1D705}_{s}\unicode[STIX]{x1D70E}_{s}n_{i}\\ 0\\ {\dot{m}}\\ 0\end{array}\right], & \displaystyle\end{eqnarray}$$
 $$\begin{eqnarray}\displaystyle & \displaystyle \unicode[STIX]{x1D70F}_{ij}=\unicode[STIX]{x1D707}\left(\frac{\unicode[STIX]{x2202}u_{i}}{\unicode[STIX]{x2202}x_{j}}+\frac{\unicode[STIX]{x2202}u_{j}}{\unicode[STIX]{x2202}x_{i}}-\frac{2}{3}\unicode[STIX]{x1D6FF}_{ij}\frac{\unicode[STIX]{x2202}u_{k}}{\unicode[STIX]{x2202}x_{k}}\right), & \displaystyle\end{eqnarray}$$
 $$\begin{eqnarray}\displaystyle & \displaystyle q_{j}=-\unicode[STIX]{x1D705}\frac{\unicode[STIX]{x2202}T}{\unicode[STIX]{x2202}x_{j}}, & \displaystyle\end{eqnarray}$$
 $$\begin{eqnarray}\displaystyle & \displaystyle \unicode[STIX]{x1D707}=(1-\unicode[STIX]{x1D6FC})(1+2.5\unicode[STIX]{x1D6FC})\unicode[STIX]{x1D707}_{l}+\unicode[STIX]{x1D6FC}\unicode[STIX]{x1D707}_{g}, & \displaystyle\end{eqnarray}$$
 $$\begin{eqnarray}\displaystyle & \displaystyle \unicode[STIX]{x1D705}=(1-\unicode[STIX]{x1D6FC})\unicode[STIX]{x1D705}_{l}+\unicode[STIX]{x1D6FC}\unicode[STIX]{x1D705}_{g}, & \displaystyle\end{eqnarray}$$
where
 $H=(e+p)/\unicode[STIX]{x1D70C}$
is the total enthalpy per unit mass,
 $\unicode[STIX]{x1D70F}_{ij}$
is the stress tensor,
 $q_{j}$
is the heat flux,
 $\unicode[STIX]{x1D707}$
is the viscosity,
 $\unicode[STIX]{x1D705}$
is the heat conductivity, and
 ${\dot{m}}$
is the phase change term. In addition, assuming that the enthalpy per unit mass,
 $h$
, is a linear function with respect to
 $T$
(
 $h=C_{pm}T+h_{0m}$
, where
 $C_{pm}$
and
 $h_{0m}$
are the specific heat at constant pressure and the enthalpy constant of the two-phase medium, respectively),
 $e$
is expressed as
 $$\begin{eqnarray}e=\unicode[STIX]{x1D70C}\left(h-\frac{p}{\unicode[STIX]{x1D70C}}+\frac{1}{2}u_{i}^{2}\right).\end{eqnarray}$$
The source term of the momentum equation is the surface tension term (Brackbill, Kothe & Zemach Reference Brackbill, Kothe and Zemach1992). The phase change
 ${\dot{m}}$
(Ochiai et al.
Reference Ochiai, Iga, Nohmi and Ikohagi2010) is expressed as
 $$\begin{eqnarray}{\dot{m}}=\left\{\begin{array}{@{}l@{}}\displaystyle \unicode[STIX]{x1D6FC}(1-\unicode[STIX]{x1D6FC})AC_{e}\frac{p_{v}^{\ast }-p_{v}}{\sqrt{2\unicode[STIX]{x03C0}R_{gv}T}}\quad (p_{v}<p_{v}^{\ast }),\quad \\ \displaystyle \unicode[STIX]{x1D6FC}(1-\unicode[STIX]{x1D6FC})AC_{c}\frac{p_{v}^{\ast }-p_{v}}{\sqrt{2\unicode[STIX]{x03C0}R_{gv}T}}\quad (p_{v}\geqslant p_{v}^{\ast }),\quad \end{array}\right.\end{eqnarray}$$
where
 $p_{v}$
and
 $p_{v}^{\ast }$
are the partial pressure of the vapour and the saturated vapour pressure, respectively,
 $A=C_{a}\unicode[STIX]{x1D6FC}^{-1/3}(1-\unicode[STIX]{x1D6FC})^{-1/3}$
is the interfacial area concentration in the gas–liquid mixture, and
 $C_{e}$
,
 $C_{c}$
and
 $C_{a}$
are model constants. In this study,
 $C_{e}C_{a}=C_{c}C_{a}=1000~\text{m}^{-1}$
(Ochiai et al.
Reference Ochiai, Iga, Nohmi and Ikohagi2011). Partial pressure
 $p_{v}^{\ast }$
is given by the empirical formula (Sugawara Reference Sugawara1932)
 $$\begin{eqnarray}p_{v}^{\ast }=p_{k}\exp \left[\left(1-\frac{T_{k}}{T}\right)\{a+(b+cT)(T-d)^{2}\}\right],\end{eqnarray}$$
where
 $p_{k}=22.130~\text{MPa}$
,
 $T_{k}=647.31~\text{K}$
,
 $a=7.21379$
,
 $b=1.1520\times 10^{-5}~\text{K}^{-2}$
,
 $c=-4.787\times 10^{-9}~\text{K}^{-3}$
and
 $d=483.16~\text{K}$
. Finally,
 $C_{pm}$
and
 $h_{0m}$
are expressed as a linear combination of the specific heats at constant liquid and gas pressures
 $C_{pl}$
and
 $C_{pg}$
, and the enthalpy constants of liquid and gas
 $h_{0l}$
and
 $h_{0g}$
with
 $Y$
; and
 $C_{pg}$
and
 $h_{0g}$
are expressed as a linear combination of the specific heats of air and vapour
 $C_{pa}$
and
 $C_{pv}$
, and the enthalpy constants of air and vapour
 $h_{0a}$
and
 $h_{0v}$
with
 $D_{a}$
. We use the finite volume method, the fourth-order Runge–Kutta method for time integration (Jameson & Baker Reference Jameson and Baker1983) and an AUSM upwind scheme (Shima & Jounouchi Reference Shima and Jounouchi1994) with third-order MUSCL-TVD (Anderson, Thomas & Van Leer Reference Anderson, Thomas and Van Leer1986) to evaluate the numerical flux.
Calculation area.
Schematic diagram of initial bubble positions.
3 Calculation conditions
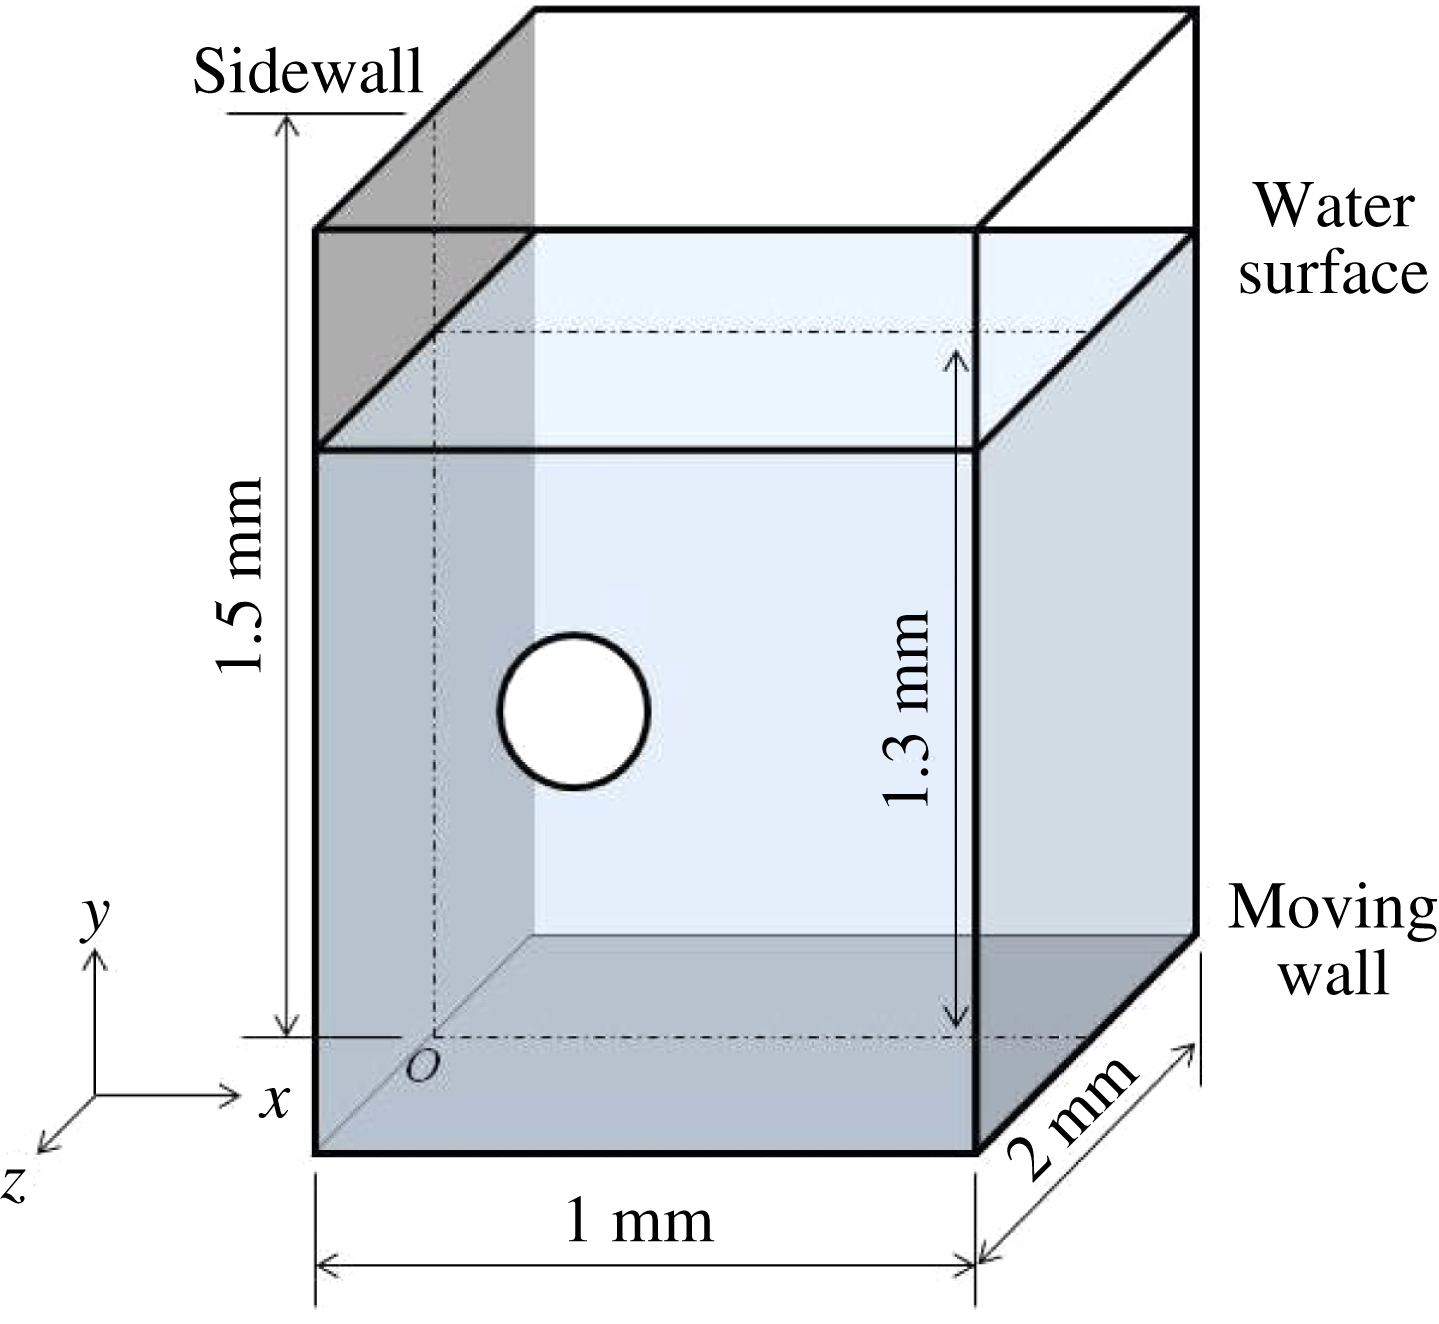
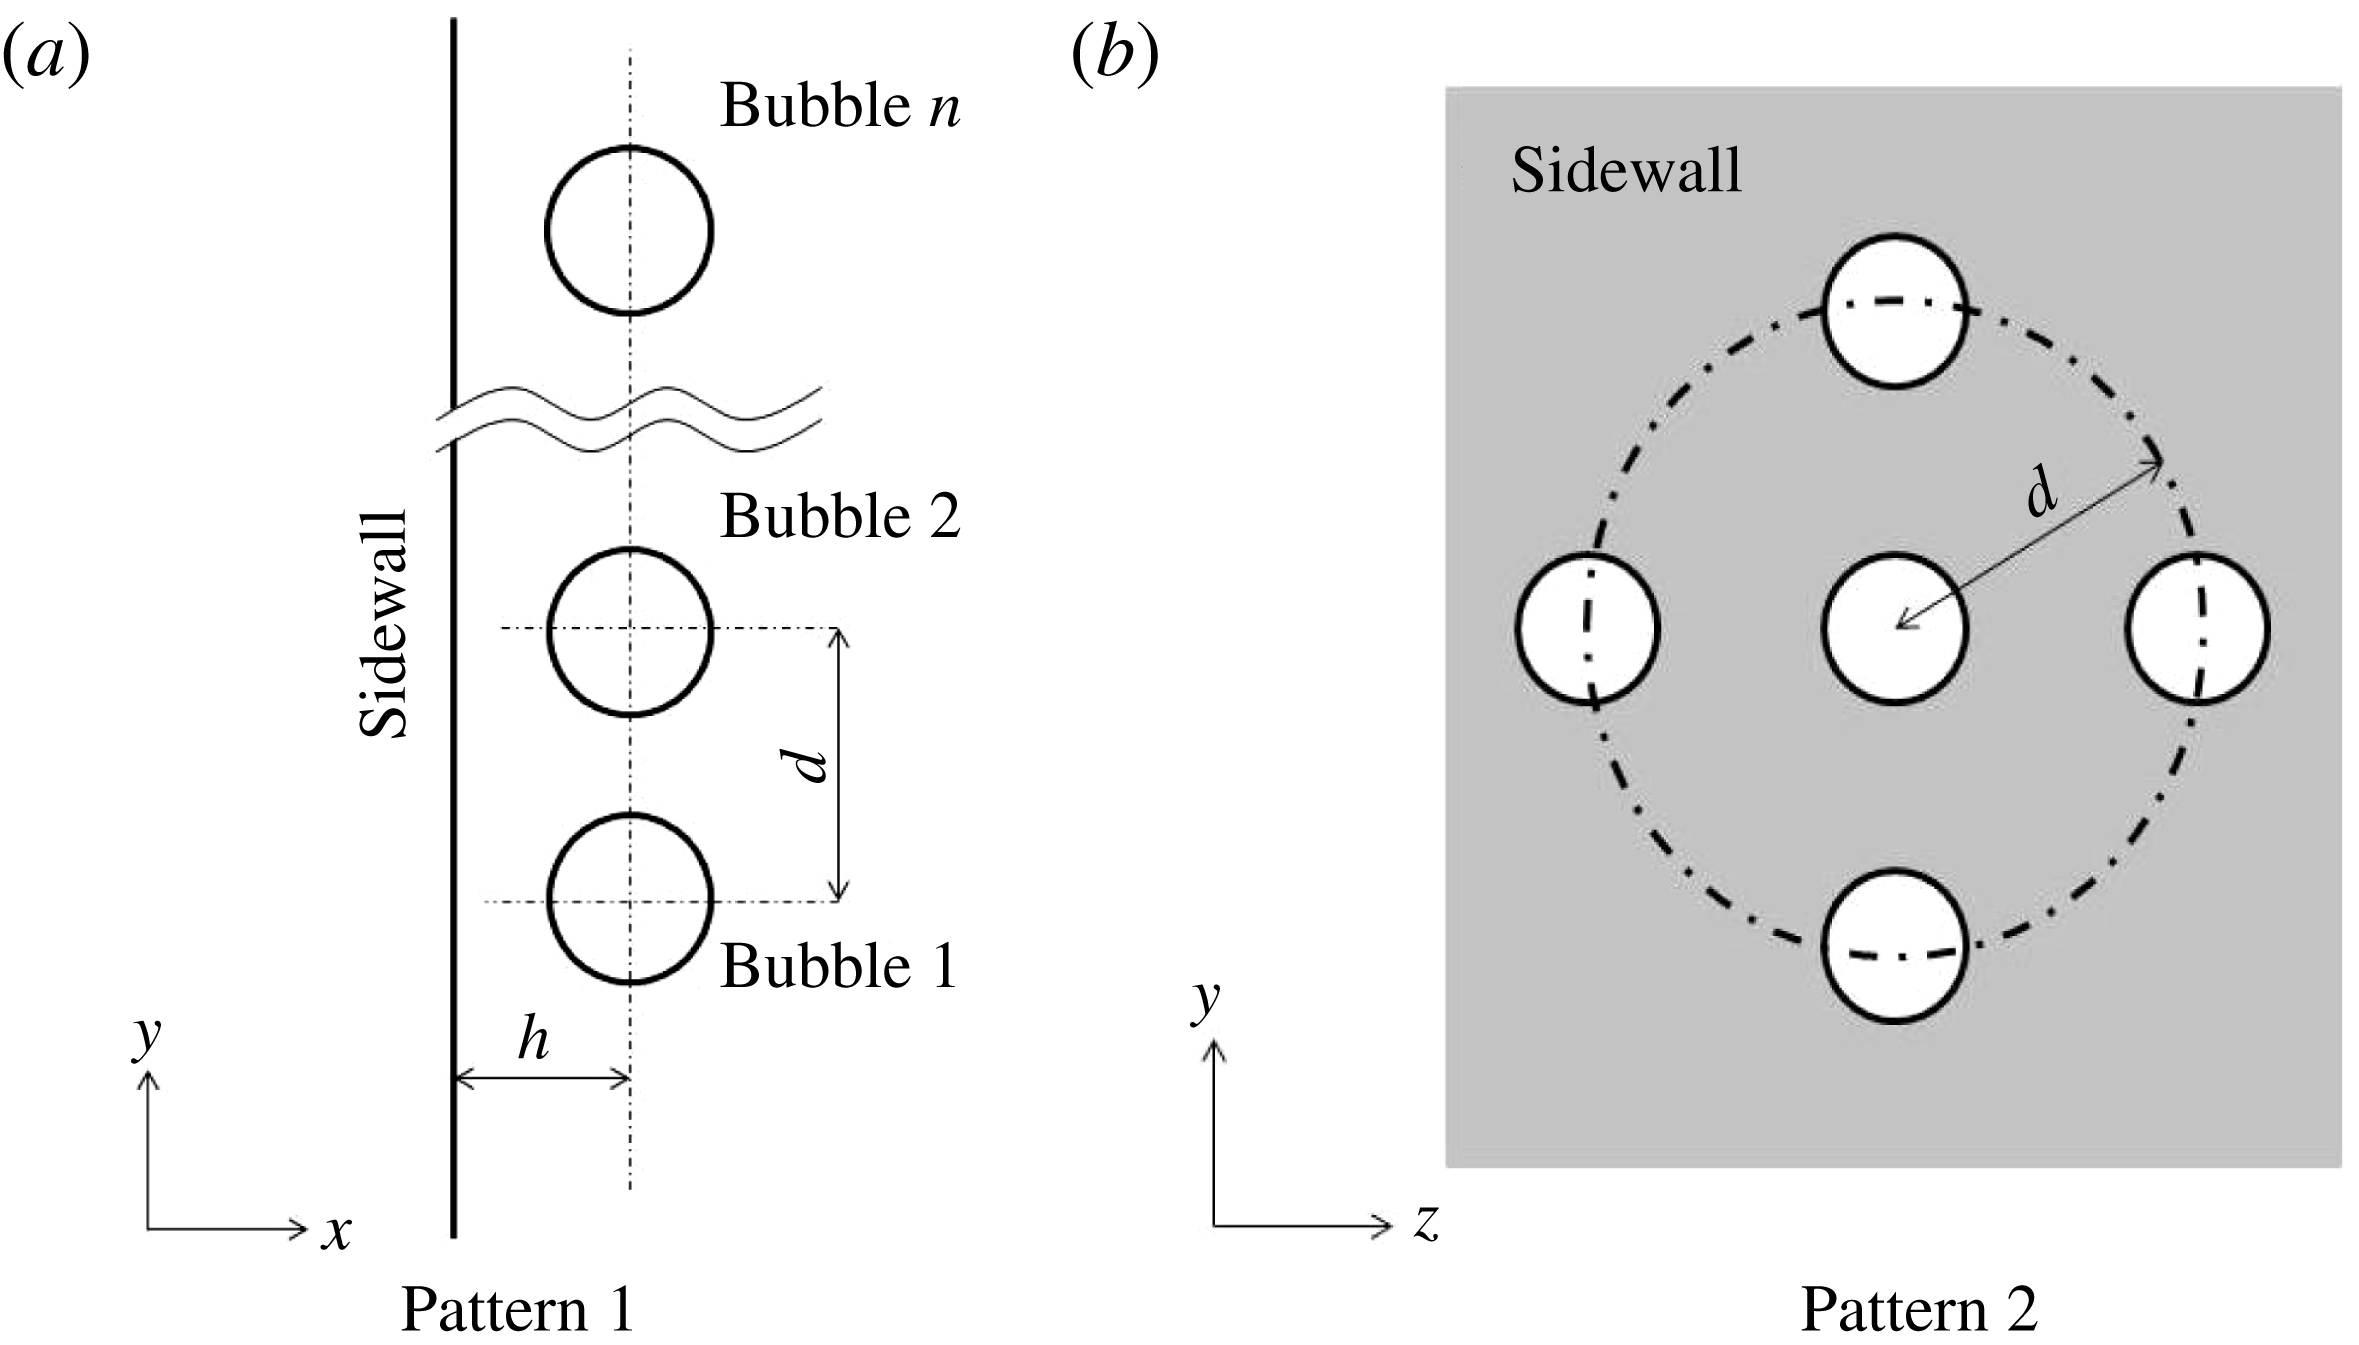
A typical megasonic cleaning device consists of a water vessel and oscillator at the bottom of the vessel. Objects are submerged in the water and cleaned by the acoustic waves from the oscillator. In the present study, the behaviour of multiple bubbles oscillating near the sidewall, which is perpendicular to the moving wall that induces the megasonic wave, is analysed (figure 1). The bottom moving wall and the sidewall simulate the oscillator and the object being cleaned, respectively. Two initial bubble position configurations are considered. In one configuration, the bubbles are distributed in a straight line along the sidewall (figure 2
a). In the other configuration, the bubbles are concentrically distributed around one bubble (figure 2
b). These are the configurations used by Tomita et al. (Reference Tomita, Shima and Ohno1984). In figure 2(a),
 $d$
indicates the initial distance between two adjacent bubbles. In figure 2(b),
 $d$
is the distance between the central bubble and the concentrically distributed bubble. In both cases
 $h$
is the initial distance between the bubble and the sidewall. Figure 1 shows a schematic of the calculation. The megasonic wave induced by the moving wall propagates in the direction of the
 $y$
axis and is reflected at the water surface. The incident wave from the moving wall and the reflected wave form a standing wave between the moving wall and the water surface. The megasonic wave is induced by the boundary condition of the velocity perpendicular to the moving wall of
 $$\begin{eqnarray}v=\left\{\begin{array}{@{}l@{}}\displaystyle A_{am}\sin (2\unicode[STIX]{x03C0}f_{w}t)\quad (t<2h_{w}/C),\quad \\ \displaystyle A_{am}\sin (2\unicode[STIX]{x03C0}f_{w}t)+A_{am}\sin (2\unicode[STIX]{x03C0}f_{w}(t-2h_{w}/C))\quad (t\geqslant 2h_{w}/C).\quad \end{array}\right.\end{eqnarray}$$
Here,
 $A_{am}$
and
 $f_{w}$
are the velocity amplitude and frequency, respectively, and
 $A_{am}=0.02~\text{m}~\text{s}^{-1}$
and
 $f=1~\text{MHz}$
;
 $h_{w}$
is the height of the water surface from the moving wall; and
 $C$
is the speed of sound. The velocity induced by the moving wall is
 $A_{am}\sin (2\unicode[STIX]{x03C0}ft)$
. A megasonic wave induced by the moving wall is reflected at the water surface, and the reflected wave propagates to the moving wall. Therefore, the boundary condition of the velocity at the moving wall after the reflected wave reaches it is determined by considering the velocity of the reflected wave,
 $A_{am}\sin (2\unicode[STIX]{x03C0}f(t-2h_{w}/C))$
. A constant pressure and temperature are applied at the upper boundary. The water surface is 1.3 mm above the moving wall. The bubble behaviour is assumed to be symmetric with respect to the
 $z=0$
plane; only the calculation in the area of
 $z\geqslant 0$
is performed. We performed the calculation without bubbles to form the standing wave. The initial liquid pressure and temperature are 0.1 MPa and 293.15 K, respectively. A standing wave is formed after a certain period (figure 3) (Ochiai & Ishimoto Reference Ochiai and Ishimoto2014). Figure 3 shows that the pressure amplitude is approximately 60 kPa at the antinode of the pressure standing wave. The
 $y$
components of the initial bubble positions in the present study are
 $0.76~\text{mm}\leqslant y\leqslant 0.84~\text{mm}$
. The pressure antinode and node of the standing wave are above and below all bubbles, respectively. The bubble calculations are started after the standing wave is formed. The initial void fractions inside and outside the bubbles are 1 and 0, respectively. The initial velocity, pressure and temperature are determined from the calculation without bubbles. The initial partial vapour pressure inside bubbles is assumed to be the saturated vapour pressure. The other partial pressure is the initial pressure of non-condensable gas. The grid numbers for pattern 1 (figure 2
a) depend on the bubble number, but the grid resolution is the same. For example, for nine bubbles, which is the maximum number of bubbles in this study, the grid numbers are (
 $x$
direction)
 $\times$
(
 $y$
direction)
 $\times$
(
 $z$
direction) = 191
 $\times$
511
 $\times$
101; and 181 grids in
 $0\leqslant x\leqslant 20~\unicode[STIX]{x03BC}\text{m}$
, 361 grids in
 $755\leqslant y\leqslant 845~\unicode[STIX]{x03BC}\text{m}$
and 91 grids in
 $0\leqslant z\leqslant 10~\unicode[STIX]{x03BC}\text{m}$
are concentrated upon. The grid numbers for pattern 2 (figure 2
b) are (
 $x$
direction)
 $\times$
(
 $y$
direction)
 $\times$
(
 $z$
direction)
 $=191\times 351\times 146$
; and 181 grids in
 $0\leqslant x\leqslant 20~\unicode[STIX]{x03BC}\text{m}$
, 201 grids in
 $775\leqslant y\leqslant 825~\unicode[STIX]{x03BC}\text{m}$
and 136 grids in
 $0\leqslant z\leqslant 15~\unicode[STIX]{x03BC}\text{m}$
are concentrated upon.
Pressure distribution without bubbles. The numbers in the figure are time (
 $\unicode[STIX]{x03BC}\text{s}$
). (Reprinted from Ochiai & Ishimoto (Reference Ochiai and Ishimoto2014), ECS J. Solid State Sci. Technol., vol. 3(1), pp. N3112–N3117.)

Time evolution of the bubble shape during bubble collapse. The solid and broken lines indicate the present calculation result and the result calculated by Plesset & Chapman (Reference Plesset and Chapman1971), respectively.

Time evolution of pressure distribution and isoline of the void fraction
 $\unicode[STIX]{x1D6FC}=0.5$
after bubble collapse (
 $R_{0}=1.5~\text{mm}$
and
 $t_{c}=R_{0}/\sqrt{p_{out}/\unicode[STIX]{x1D70C}_{0}}$
, where
 $p_{out}$
and
 $\unicode[STIX]{x1D70C}_{0}$
are the initial liquid pressure and density, respectively).

4 Validation of the calculation method
Numerical simulation of the bubble collapse near a wall is performed to validate the numerical method. The bubble collapse due to the pressure difference between the inside and outside of the bubble is simulated. The internal and external pressures are 3 and 100 kPa, respectively; and
 $C_{e}C_{a}=C_{c}C_{a}$
are
 $1000~\text{m}^{-1}$
. The initial bubble radius is 1.5 mm. The initial non-dimensional standoff distance,
 $\unicode[STIX]{x1D6FE}=l_{0}/R_{0}$
, is 1.5, where
 $l_{0}$
is the initial distance between the bubble centre and the wall. The calculation area has a main area of
 $2.3R_{0}\times 3.4R_{0}\times 2.3R_{0}$
((
 $x$
direction)
 $\times$
(
 $y$
direction)
 $\times$
(
 $z$
direction)) and a buffer region. The
 $y$
axis is perpendicular to the wall. The calculation is a plane-symmetric calculation. The symmetric planes are the two orthogonal planes perpendicular to the wall. Figure 4 compares the bubble shape calculated by the present method with the previous numerical result by Plesset & Chapman (Reference Plesset and Chapman1971). In the present calculation, the bubble is an air–vapour mixture. However, the bubble calculated by Plesset & Chapman (Reference Plesset and Chapman1971) is a vapour bubble. The solid lines indicate the isolines of void fraction
 $\unicode[STIX]{x1D6FC}=0.5$
in the present calculation. The broken lines indicate the result reported by Plesset & Chapman (Reference Plesset and Chapman1971). The bubble shapes of the present calculation are similar to the shapes of Plesset & Chapman (Reference Plesset and Chapman1971), and the present method can simulate microjet formation during bubble collapse. Figure 5 shows the time evolution of the pressure distribution after the bubble collapse. After the bubble collapses, the pressure near the bubble becomes high (figure 5(i)). Because the present numerical method considers the compressibility of the liquid and gas phases, the propagation of the pressure wave due to the bubble collapse into the ambient liquid is simulated (figure 5(ii),(iii)).
Time evolution of pressure distribution and isoline of the void fraction
 $\unicode[STIX]{x1D6FC}=0.5$
on the
 $z=0$
plane (effect of grid resolution).

Next, the effect of the grid resolution on the numerical simulation of multiple bubble behaviour in a megasonic field is examined. Grid resolutions of
 $101\times 251\times 56$
(low grid resolution),
 $191\times 351\times 101$
(medium grid resolution) and
 $281\times 451\times 146$
(high grid resolution) are used. The grid numbers near bubbles are different. The cases of the low and high grid resolutions have 0.5 and 1.5 times the grid number of the medium grid resolution, respectively. We focus on the case of two bubbles. Figure 6 shows the time evolution of pressure distribution and isoline of the void fraction
 $\unicode[STIX]{x1D6FC}=0.5$
on the
 $z=0$
plane. In the time in figure 6, the two bubbles approach and coalesce, and the coalesced bubble collapses. Figure 6(i),(ii) show the bubble behaviour before the two bubbles come into contact, and the bubble shapes in each case when the radii are close to maximum are similar (figure 6
a (i)–c (i)). However, the shapes are different when the bubbles collapse (figure 6
a (ii)–c (ii)). Although the bubble is largely deformed on the opposite side of the other bubble and the water jet is formed for the medium and high grid resolutions (figure 6
b (ii),c (ii)), such a large shape deformation is not found for the low grid resolution (figure 6
a (ii)). After that, the two bubbles come into contact and coalesce (figure 6(iii)–(v)). The process and timing of the coalescence are similar for all grid resolutions. The collapsing bubble shape after the coalescence is long along the sidewall when the grid resolution is high (figure 6
a (vi)–c (vi)). The grid resolution strongly affects the bubble shape in the final collapse stage. However, the characteristic behaviour, such as contact and coalescence of bubbles, is simulated with the low grid resolution. Figure 7 shows the maximum pressure on the sidewall,
 $p_{w\,max}$
, versus bubble equilibrium radius for two bubbles. The oscillation characteristic of bubbles in the present study depends on the equilibrium radius. A bubble with the resonant radius exhibits resonant behaviour and induces high impulsive pressure on the sidewall. According to figure 7,
 $p_{w\,max}$
reaches a maximum at
 $R_{0}=2.0~\unicode[STIX]{x03BC}\text{m}$
and the resonant radius is
 $2.0~\unicode[STIX]{x03BC}\text{m}$
for all grid resolutions. Therefore, all cases calculated in this section have sufficient grid resolution to predict the resonant radius, which is important for the present study. However, the grid resolution affects the value of the impulsive pressure slightly (figure 7). In the present study, as a compromise between computational cost and accuracy, we chose to use the medium grid resolution for the calculations in the following sections.
Maximum wall pressure versus equilibrium bubble radius for two bubbles (effect of grid resolution).

5 Results and discussion
5.1 Behaviour of multiple bubbles with the same equilibrium radius distributed in a straight line
In this section, the behaviour of multiple bubbles with the same equilibrium radius distributed in a straight line near the wall boundary (figure 2
a) is analysed, and the effect of bubble–bubble interaction on multiple-bubble behaviour is discussed. The initial distances between adjacent bubbles,
 $d$
, are
 $d=10~\unicode[STIX]{x03BC}\text{m}$
, and the distances between the bubble and sidewall,
 $h$
, are
 $4R_{0}$
, where
 $R_{0}$
is the initial (equilibrium) bubble radius. The
 $z$
coordinate of the initial positions of each bubble is 0. The
 $y$
coordinate of the centre of the multiple bubbles is
 $800~\unicode[STIX]{x03BC}\text{m}$
. For three bubbles, the
 $y$
coordinate of the centre of the second bubble from the moving wall, bubble 2, is
 $800~\unicode[STIX]{x03BC}\text{m}$
. For four bubbles, the
 $y$
coordinate of the centre between the second and third bubbles from the moving wall, bubbles 2 and 3, is
 $800~\unicode[STIX]{x03BC}\text{m}$
. The effects of initial bubble radius
 $R_{0}$
and bubble number
 $n$
in the above conditions on multiple bubble behaviour are analysed. Bubble calculations start at
 $t=2.12~\unicode[STIX]{x03BC}\text{s}$
when the pressure at
 $y=800~\unicode[STIX]{x03BC}\text{m}$
is the equilibrium pressure of 0.1 MPa after a standing wave forms. The initial partial pressure of vapour is the saturated vapour pressure, and the partial non-condensable gas pressure is far higher than the vapour pressure. Therefore, the effect of vapour and the phase change on bubble behaviour is small in the present calculations.
Bubble behaviour and temperature distribution:
 $R_{0}=2.2~\unicode[STIX]{x03BC}\text{m}$
, single bubble,
 $y=800~\unicode[STIX]{x03BC}\text{m}$
and
 $z=0$
. Panels: (i) Time history of bubble equivalent radius. (ii),(iii) Time evolution of temperature distribution for (ii) contraction stage and (iii) expansion stage;
 $x_{centre}$
is the
 $x$
component of bubble centre position. Curves: (a)
 $t=2.66~\unicode[STIX]{x03BC}\text{s}$
, (b)
 $t=2.80~\unicode[STIX]{x03BC}\text{s}$
, (c)
 $t=2.90~\unicode[STIX]{x03BC}\text{s}$
, (d)
 $t=2.98~\unicode[STIX]{x03BC}\text{s}$
, (e)
 $t=3.02~\unicode[STIX]{x03BC}\text{s}$
, (f)
 $t=3.06~\unicode[STIX]{x03BC}\text{s}$
, (g)
 $t=3.10~\unicode[STIX]{x03BC}\text{s}$
, (h)
 $t=3.20~\unicode[STIX]{x03BC}\text{s}$
and (i)
 $t=3.60~\unicode[STIX]{x03BC}\text{s}$
.

The total energy equation is used in the present study, and the temperature field inside and outside the bubbles changes and heat transfer occurs with the bubble oscillations. The thermodynamic behaviour is analysed and we focus on the single-bubble case of
 $R_{0}=2.2~\unicode[STIX]{x03BC}\text{m}$
. Figure 8 shows the time history of the bubble radius and the temperature distributions. The radius is the equivalent radius calculated from the volume. Figure 8(ii),(iii) shows the temperature distribution at
 $y=800~\unicode[STIX]{x03BC}\text{m}$
and
 $z=0$
. The horizontal axis indicates the
 $x$
position from the bubble centre
 $x_{centre}$
. When the bubble radius reaches a maximum, the bubble internal temperature is almost constant (figure 8(ii)(a)). The bubble starts contracting owing to the megasonic wave, and the temperature inside the bubble increases (figure 8(ii)(b)–(d)). The bubble radii at (b)
 $t=2.80~\unicode[STIX]{x03BC}\text{s}$
, (c)
 $t=2.90~\unicode[STIX]{x03BC}\text{s}$
and (d)
 $t=2.98~\unicode[STIX]{x03BC}\text{s}$
are
 $2.6~\unicode[STIX]{x03BC}\text{m}$
,
 $2.0~\unicode[STIX]{x03BC}\text{m}$
and
 $1.4~\unicode[STIX]{x03BC}\text{m}$
, respectively (figure 8(i)), and the temperature gradient near the gas–liquid interface is large (figure 8(ii)). Therefore, heat transfer from the liquid phase to the bubble occurs. The temperature outside the bubble hardly changes. In the expansion stage, the temperature inside the bubble decreases (figure 8(iii)(e)–(g)). At (g)
 $t=3.10~\unicode[STIX]{x03BC}\text{s}$
, the bubble radius is approximately
 $1.8~\unicode[STIX]{x03BC}\text{m}$
, which is smaller than the initial radius. However, the temperature inside the bubble is lower than the initial temperature because of the heat transfer during the contraction stage. The temperature distribution induces the heat transfer from the liquid phase to the bubble. Therefore, the temperature inside the bubble recovers (figure 8(iii)(h)–(i)) although the bubble grows. The bubble behaviours simulated in the present study are subject to this heat transfer process.
Time evolution of pressure distribution on the sidewall and isosurface of the void fraction
 $\unicode[STIX]{x1D6FC}=0.5$
:
 $R_{0}=2.0~\unicode[STIX]{x03BC}\text{m}$
, the rectangular region indicated by white lines is
 $20~\unicode[STIX]{x03BC}\text{m}\times 50~\unicode[STIX]{x03BC}\text{m}\times 20~\unicode[STIX]{x03BC}\text{m}$
, and the first frame is the start time of the bubble calculation.

Time history of wall pressure.

First, the multiple-bubble behaviour for
 $R_{0}=2.0~\unicode[STIX]{x03BC}\text{m}$
is analysed to discuss the effect of bubble number on the multiple-bubble behaviour and the pressure induced on the sidewall. Figure 9 and supplementary movies 1–3 (available at https://doi.org/10.1017/jfm.2017.154) show the time evolution of the bubble behaviour and pressure distribution on the sidewall for one, two, or three bubbles with
 $R_{0}=2.0~\unicode[STIX]{x03BC}\text{m}$
. The isosurface of
 $\unicode[STIX]{x1D6FC}=0.5$
indicates the bubble behaviour. Figure 10 shows the time histories of the pressure on the sidewall
 $(x,y,z)=(0,~800~\unicode[STIX]{x03BC}\text{m},~0)$
in each calculation (figure 9). The position corresponds to the initial position of the centre of the multiple bubbles. For
 $R_{0}=2.0~\unicode[STIX]{x03BC}\text{m}$
, in a single bubble, the induced pressure on the sidewall of 0.348 MPa is low. The amplitude of the oscillation in the single bubble is smaller than those in two and three bubbles (figure 9), and the pressure distributions on the sidewall for the single bubble (figure 9
a (iv),(vi)) indicate that high pressure does not occur. For two bubbles, the bubble oscillations gradually become large, and the size of the bubbles at the contraction stage are small (figure 9
b (ii)). The two bubbles approach gradually owing to the attraction between the bubbles via volume oscillation (figure 9
b (iii)) and they coalesce (figure 9
b (v)). The pressure on the sidewall grows gradually (figure 10) and the maximum pressure on the sidewall occurs at collapse immediately after the coalescence (figure 9
b (vi)). The maximum pressure exceeds 10 MPa and is far higher than the maximum pressure for the single bubble of 0.348 MPa. The coalesced bubble oscillation is damped by the sidewall and the induced pressure on the sidewall also becomes low after
 $8~\unicode[STIX]{x03BC}\text{s}$
(figure 10). For three bubbles, the oscillation amplitude of the bubbles gradually grows and the bubbles approach each other (figures 9
c (i)–(iii) and 10), in a similar manner to the two bubbles. The central bubbles in figure 9
c (ii),(iv) are too small to be captured by the isosurface of
 $\unicode[STIX]{x1D6FC}=0.5$
. The highest pressure for two bubbles occurs immediately after the bubbles coalesce (figure 9
b (vi)). For three bubbles, the highest pressure occurs immediately before the three bubbles coalesce (figure 9
c (iv)). The maximum pressure on the sidewall for two bubbles is highest for the scenarios examined (figure 10).
Maximum wall pressure versus equilibrium bubble radius.
Frequency of volume oscillation versus equilibrium bubble radius.

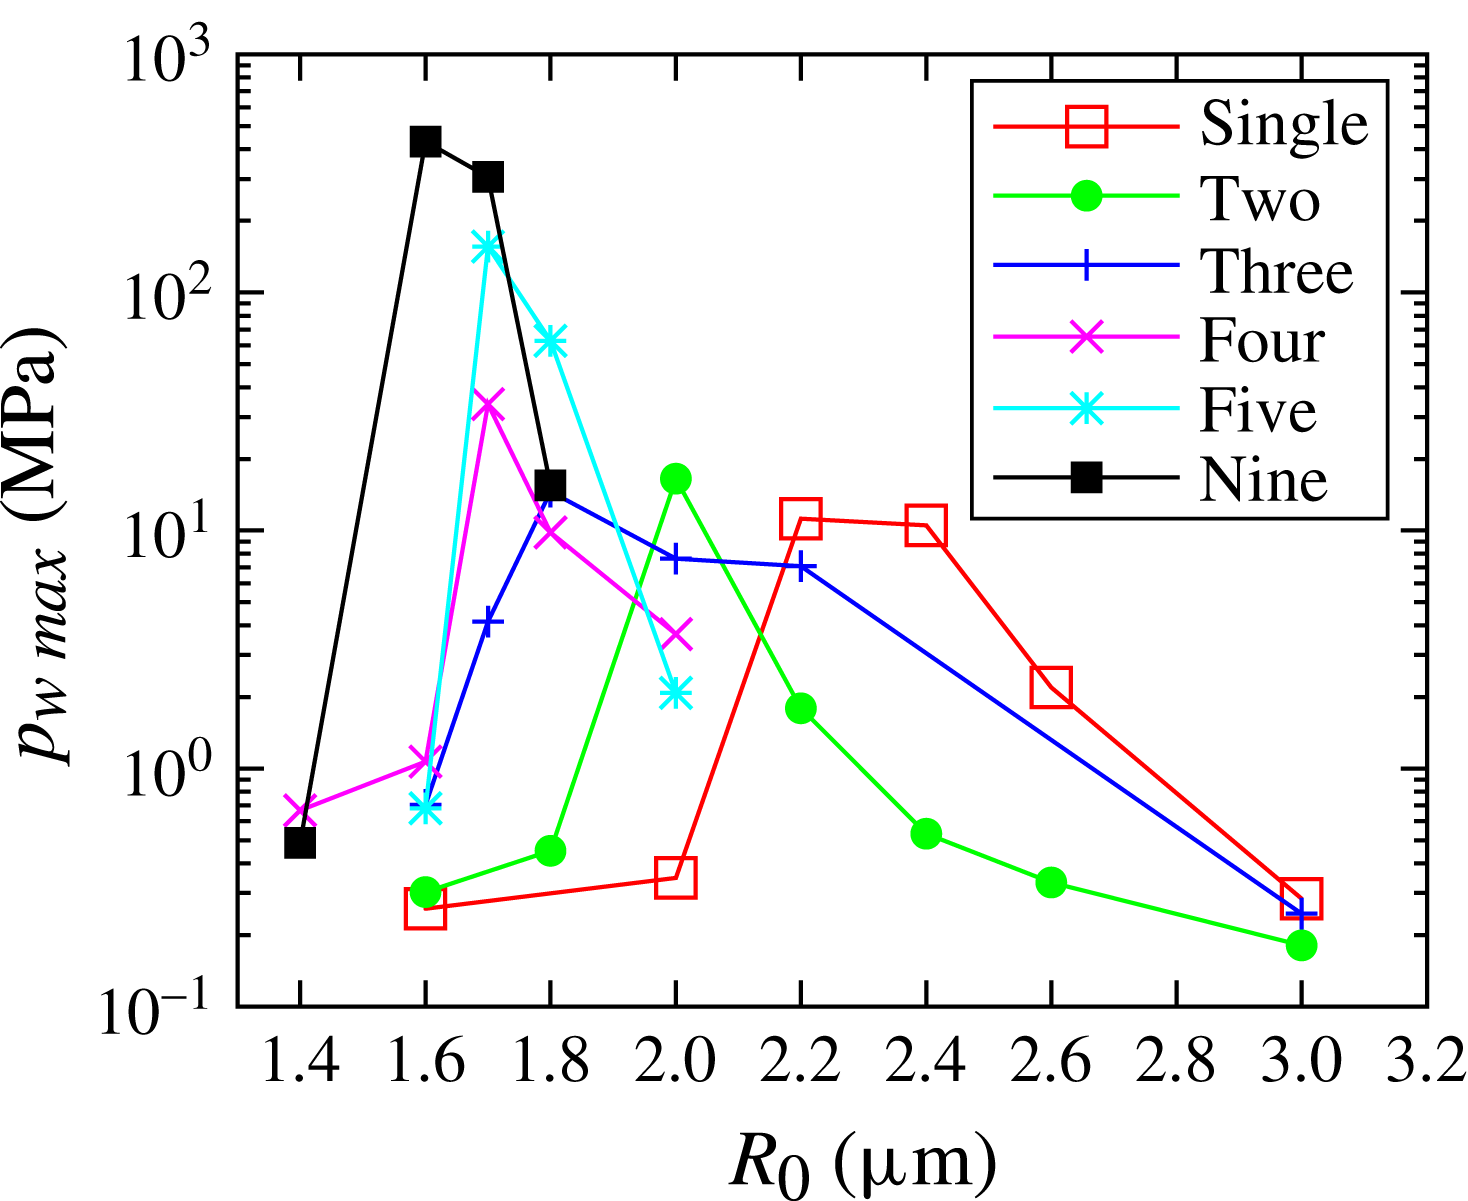
Figure 11 shows the maximum pressure on the sidewall,
 $p_{w\,max}$
, versus bubble equilibrium radius
 $R_{0}$
. The
 $R_{0}$
value where
 $p_{w\,max}$
is the maximum,
 $R_{p\,max}$
, is
 $2.2~\unicode[STIX]{x03BC}\text{m}$
for one bubble,
 $2.0~\unicode[STIX]{x03BC}\text{m}$
for two bubbles,
 $1.8~\unicode[STIX]{x03BC}\text{m}$
for three bubbles and
 $1.7~\unicode[STIX]{x03BC}\text{m}$
for four bubbles. The results show that
 $R_{p\,max}$
decreases as the bubble number increases. Tomita et al. (Reference Tomita, Shima and Ohno1984) investigated the relationship between the maximum impulsive pressure and bubble number for bubbles distributed in a straight line, and they showed that the maximum pressure decreases as the bubble number increases. They kept the same initial bubble radius. When the equilibrium radius is the same, the same relationship between the maximum pressure and bubble number is also observed. For example, for
 $R_{0}=2.2~\unicode[STIX]{x03BC}\text{m}$
,
 $p_{w\,max}$
is the maximum for a single bubble, and
 $p_{w\,max}$
decreases with increase in the bubble number (figure 11). However, the present numerical results indicate that
 $p_{w\,max}$
reaches a maximum for multiple bubbles, depending on the equilibrium radius. For example, for
 $R_{0}=2.0~\unicode[STIX]{x03BC}\text{m}$
,
 $p_{w\,max}$
is the maximum for two bubbles. Figure 11 also shows that the decrease in
 $R_{p\,max}$
as the bubble number increases becomes slower for more than five bubbles. The equilibrium radius for five bubbles of
 $1.7~\unicode[STIX]{x03BC}\text{m}$
is the same as for four bubbles. Furthermore, the equilibrium radius for nine bubbles is
 $1.6~\unicode[STIX]{x03BC}\text{m}$
, and
 $R_{p\,max}$
approaches a certain value. The observation that
 $R_{p\,max}$
decreases as the bubble number increases can be explained by the decrease in the natural frequency with increase in bubble number. Nakagawa (Reference Nakagawa1985) and Shima (Reference Shima1971) derived the natural frequency of two bubbles, and Foody & Huber (Reference Foody and Huber1981) derived the natural frequencies of two, three and four bubbles using linear analysis. The results indicate that, when bubbles with the same equilibrium radius oscillate in phase, the natural frequency decreases with increase of bubble number. According to the present result, the decrease in the natural frequency occurs even in highly nonlinear conditions. The oscillation frequencies of the total volume of the bubbles,
 $f_{b}$
, in each calculation divided by the frequency of the megasonic wave of 1 MHz are shown in figure 12 to confirm the decrease of the natural frequency. Frequency
 $f_{b}$
is calculated by averaging the period between the times when the maximum total volume is reached. There are no analytical solutions of the natural frequency for the nonlinear condition. Therefore, we use the average period to evaluate the natural frequency. From figure 12, the frequency decreases with increase in bubble number when
 $R_{0}$
is the same. Figures 11 and 12 also show that when
 $f_{b}$
is close to the frequency of the moving wall,
 $f_{w}$
(
 $f_{b}/f_{w}$
is close to 1), the maximum pressure on the sidewall,
 $p_{w\,max}$
, is high. When the
 $R_{0}$
value with
 $f_{b}$
close to
 $f_{w}$
is assumed to be the resonant radius in this study, the resonant radii in one, two and three bubbles are 2.4, 2.0 and
 $1.8~\unicode[STIX]{x03BC}\text{m}$
, respectively. The following equations are the natural frequencies of multiple bubbles oscillating in phase derived by Foody & Huber (Reference Foody and Huber1981):
 $$\begin{eqnarray}\displaystyle & \displaystyle f_{1}=\frac{1}{2\unicode[STIX]{x03C0}R_{0}}\sqrt{\frac{3p_{0}\unicode[STIX]{x1D6FE}}{\unicode[STIX]{x1D70C}}}, & \displaystyle\end{eqnarray}$$
 $$\begin{eqnarray}\displaystyle & \displaystyle f_{2}=\frac{1}{2\unicode[STIX]{x03C0}R_{0}}\sqrt{\frac{3p_{0}\unicode[STIX]{x1D6FE}}{\unicode[STIX]{x1D70C}\displaystyle \left(1+\frac{R_{0}}{d}\right)}}, & \displaystyle\end{eqnarray}$$
 $$\begin{eqnarray}\displaystyle & \displaystyle f_{3}=\frac{1}{2\unicode[STIX]{x03C0}R_{0}}\sqrt{\frac{3p_{0}\unicode[STIX]{x1D6FE}}{\unicode[STIX]{x1D70C}\displaystyle \left(1+1.6861\frac{R_{0}}{d}\right)}}. & \displaystyle\end{eqnarray}$$
Here
 $f_{n}$
is the natural frequency of
 $n$
bubbles,
 $p_{0}$
is the equilibrium pressure and
 $\unicode[STIX]{x1D6FE}$
is the polytropic index. Prosperetti, Crum & Commander (Reference Prosperetti, Crum and Commander1988) predicted the effective polytropic index for the internal gas in a spherical bubble as
 $$\begin{eqnarray}\displaystyle & \displaystyle \unicode[STIX]{x1D6FE}_{eff}={\textstyle \frac{1}{3}}\,\text{Re}\,\unicode[STIX]{x1D6F7}, & \displaystyle\end{eqnarray}$$
 $$\begin{eqnarray}\displaystyle & \displaystyle \unicode[STIX]{x1D6F7}=\frac{3\unicode[STIX]{x1D705}}{1-3(\unicode[STIX]{x1D705}-1)\text{i}\unicode[STIX]{x1D712}[(\text{i}/\unicode[STIX]{x1D712})^{1/2}\,\text{coth}(\text{i}/\unicode[STIX]{x1D712})^{1/2}-1]}, & \displaystyle\end{eqnarray}$$
 $$\begin{eqnarray}\displaystyle & \displaystyle \unicode[STIX]{x1D712}=\frac{\unicode[STIX]{x1D706}}{\unicode[STIX]{x1D70C}_{g}C_{pg}fR_{0}^{2}}, & \displaystyle\end{eqnarray}$$
where
 $\unicode[STIX]{x1D705}$
is the specific heat ratio,
 $\unicode[STIX]{x1D706}$
is the thermal conductivity,
 $f$
is the frequency of the pressure fluctuation and
 $R_{0}$
is the initial radius. To evaluate
 $\unicode[STIX]{x1D6FE}_{eff}$
for air bubbles in the range of the present calculation conditions using
 $\unicode[STIX]{x1D705}=1.4$
,
 $\unicode[STIX]{x1D706}=0.257~\text{W}~\text{m}^{-1}~\text{K}^{-1}$
,
 $\unicode[STIX]{x1D70C}_{g}=1.188~\text{kg}~\text{m}^{3}$
,
 $C_{pg}=1005~\text{J}~\text{kg}^{-1}~\text{K}^{-1}$
and
 $f=1~\text{MHz}$
,
 $\unicode[STIX]{x1D6FE}_{eff}$
is 1–1.03 for
 $R_{0}$
of several micrometres. The value is close to
 $\unicode[STIX]{x1D6FE}$
of an isothermal bubble. Therefore,
 $\unicode[STIX]{x1D6FE}=1$
is used for calculations with (5.1)–(5.3). When the initial distance between adjacent bubbles is
 $d=10~\unicode[STIX]{x03BC}\text{m}$
and
 $f_{n}=1~\text{MHz}$
, the resonant radii of one, two and three bubbles are 2.76, 2.47 and
 $2.33~\unicode[STIX]{x03BC}\text{m}$
, respectively. The resonant radii are larger than these in the present calculations. The natural frequency of a bubble is decreased by a solid wall (Howkins Reference Howkins1965; Shima & Tomita Reference Shima and Tomita1981; Fujiwara & Shima Reference Fujiwara and Shima1993) and an increase in acoustic pressure (Lauterborn Reference Lauterborn1976). The bubbles in the present calculations are oscillated near a solid wall by large acoustic pressure beyond the linear analysis. However, the analysis of Foody & Huber (Reference Foody and Huber1981) is limited to linear oscillation far from a solid wall. Therefore, the resonant radii of present calculations and (5.1)–(5.3) are different. However, the decrease of the resonant radius of Foody & Huber’s formula with the increase in bubble number becomes slow, similar to the present calculations. Therefore, the decrease in the natural frequency with the increase of bubble number results in the resonance oscillation of the smaller equilibrium radius (the natural frequency becomes close to the frequency of the moving wall). In addition,
 $R_{p\,max}$
decreases with the increase in bubble number. The maximum value of
 $p_{w\,max}$
for bubble numbers of more than four is high (figure 11). The bubble behaviour and the pressure distribution on the sidewall for three, four and nine bubbles are shown in figures 13–15 to explain the generation of the high impulsive pressure. The time for figures 13–15 is the last phase of the bubble collapse. Supplementary movie 4 also shows the bubble behaviour for nine bubbles. The
 $R_{0}$
value in each calculation is
 $R_{p\,max}$
. For three bubbles with
 $R_{0}=1.8~\unicode[STIX]{x03BC}\text{m}$
, the bubbles approach with
Time evolution of pressure distribution on sidewall and isosurface of the void fraction
 $\unicode[STIX]{x1D6FC}=0.5$
during the final stage of collapse:
 $R_{0}=1.8~\unicode[STIX]{x03BC}\text{m}$
, three bubbles, the rectangular region indicated by white lines is
 $20~\unicode[STIX]{x03BC}\text{m}\times 50~\unicode[STIX]{x03BC}\text{m}\times 20~\unicode[STIX]{x03BC}\text{m}$
, and the first frame is the start time of the bubble calculation.

Time evolution of pressure distribution on sidewall and isosurface of the void fraction
 $\unicode[STIX]{x1D6FC}=0.5$
during the final stage of collapse:
 $R_{0}=1.7~\unicode[STIX]{x03BC}\text{m}$
, four bubbles and the rectangular region indicated by white lines is
 $20~\unicode[STIX]{x03BC}\text{m}\times 50~\unicode[STIX]{x03BC}\text{m}\times 20~\unicode[STIX]{x03BC}\text{m}$
, and the first frame is the start time of the bubble calculation.

Time evolution of pressure distribution on the sidewall and isosurface of the void fraction
 $\unicode[STIX]{x1D6FC}=0.5$
during the final stage of collapse:
 $R_{0}=1.6~\unicode[STIX]{x03BC}\text{m}$
, nine bubbles and the rectangular region indicated by white lines is
 $20~\unicode[STIX]{x03BC}\text{m}\times 90~\unicode[STIX]{x03BC}\text{m}\times 20~\unicode[STIX]{x03BC}\text{m}$
.

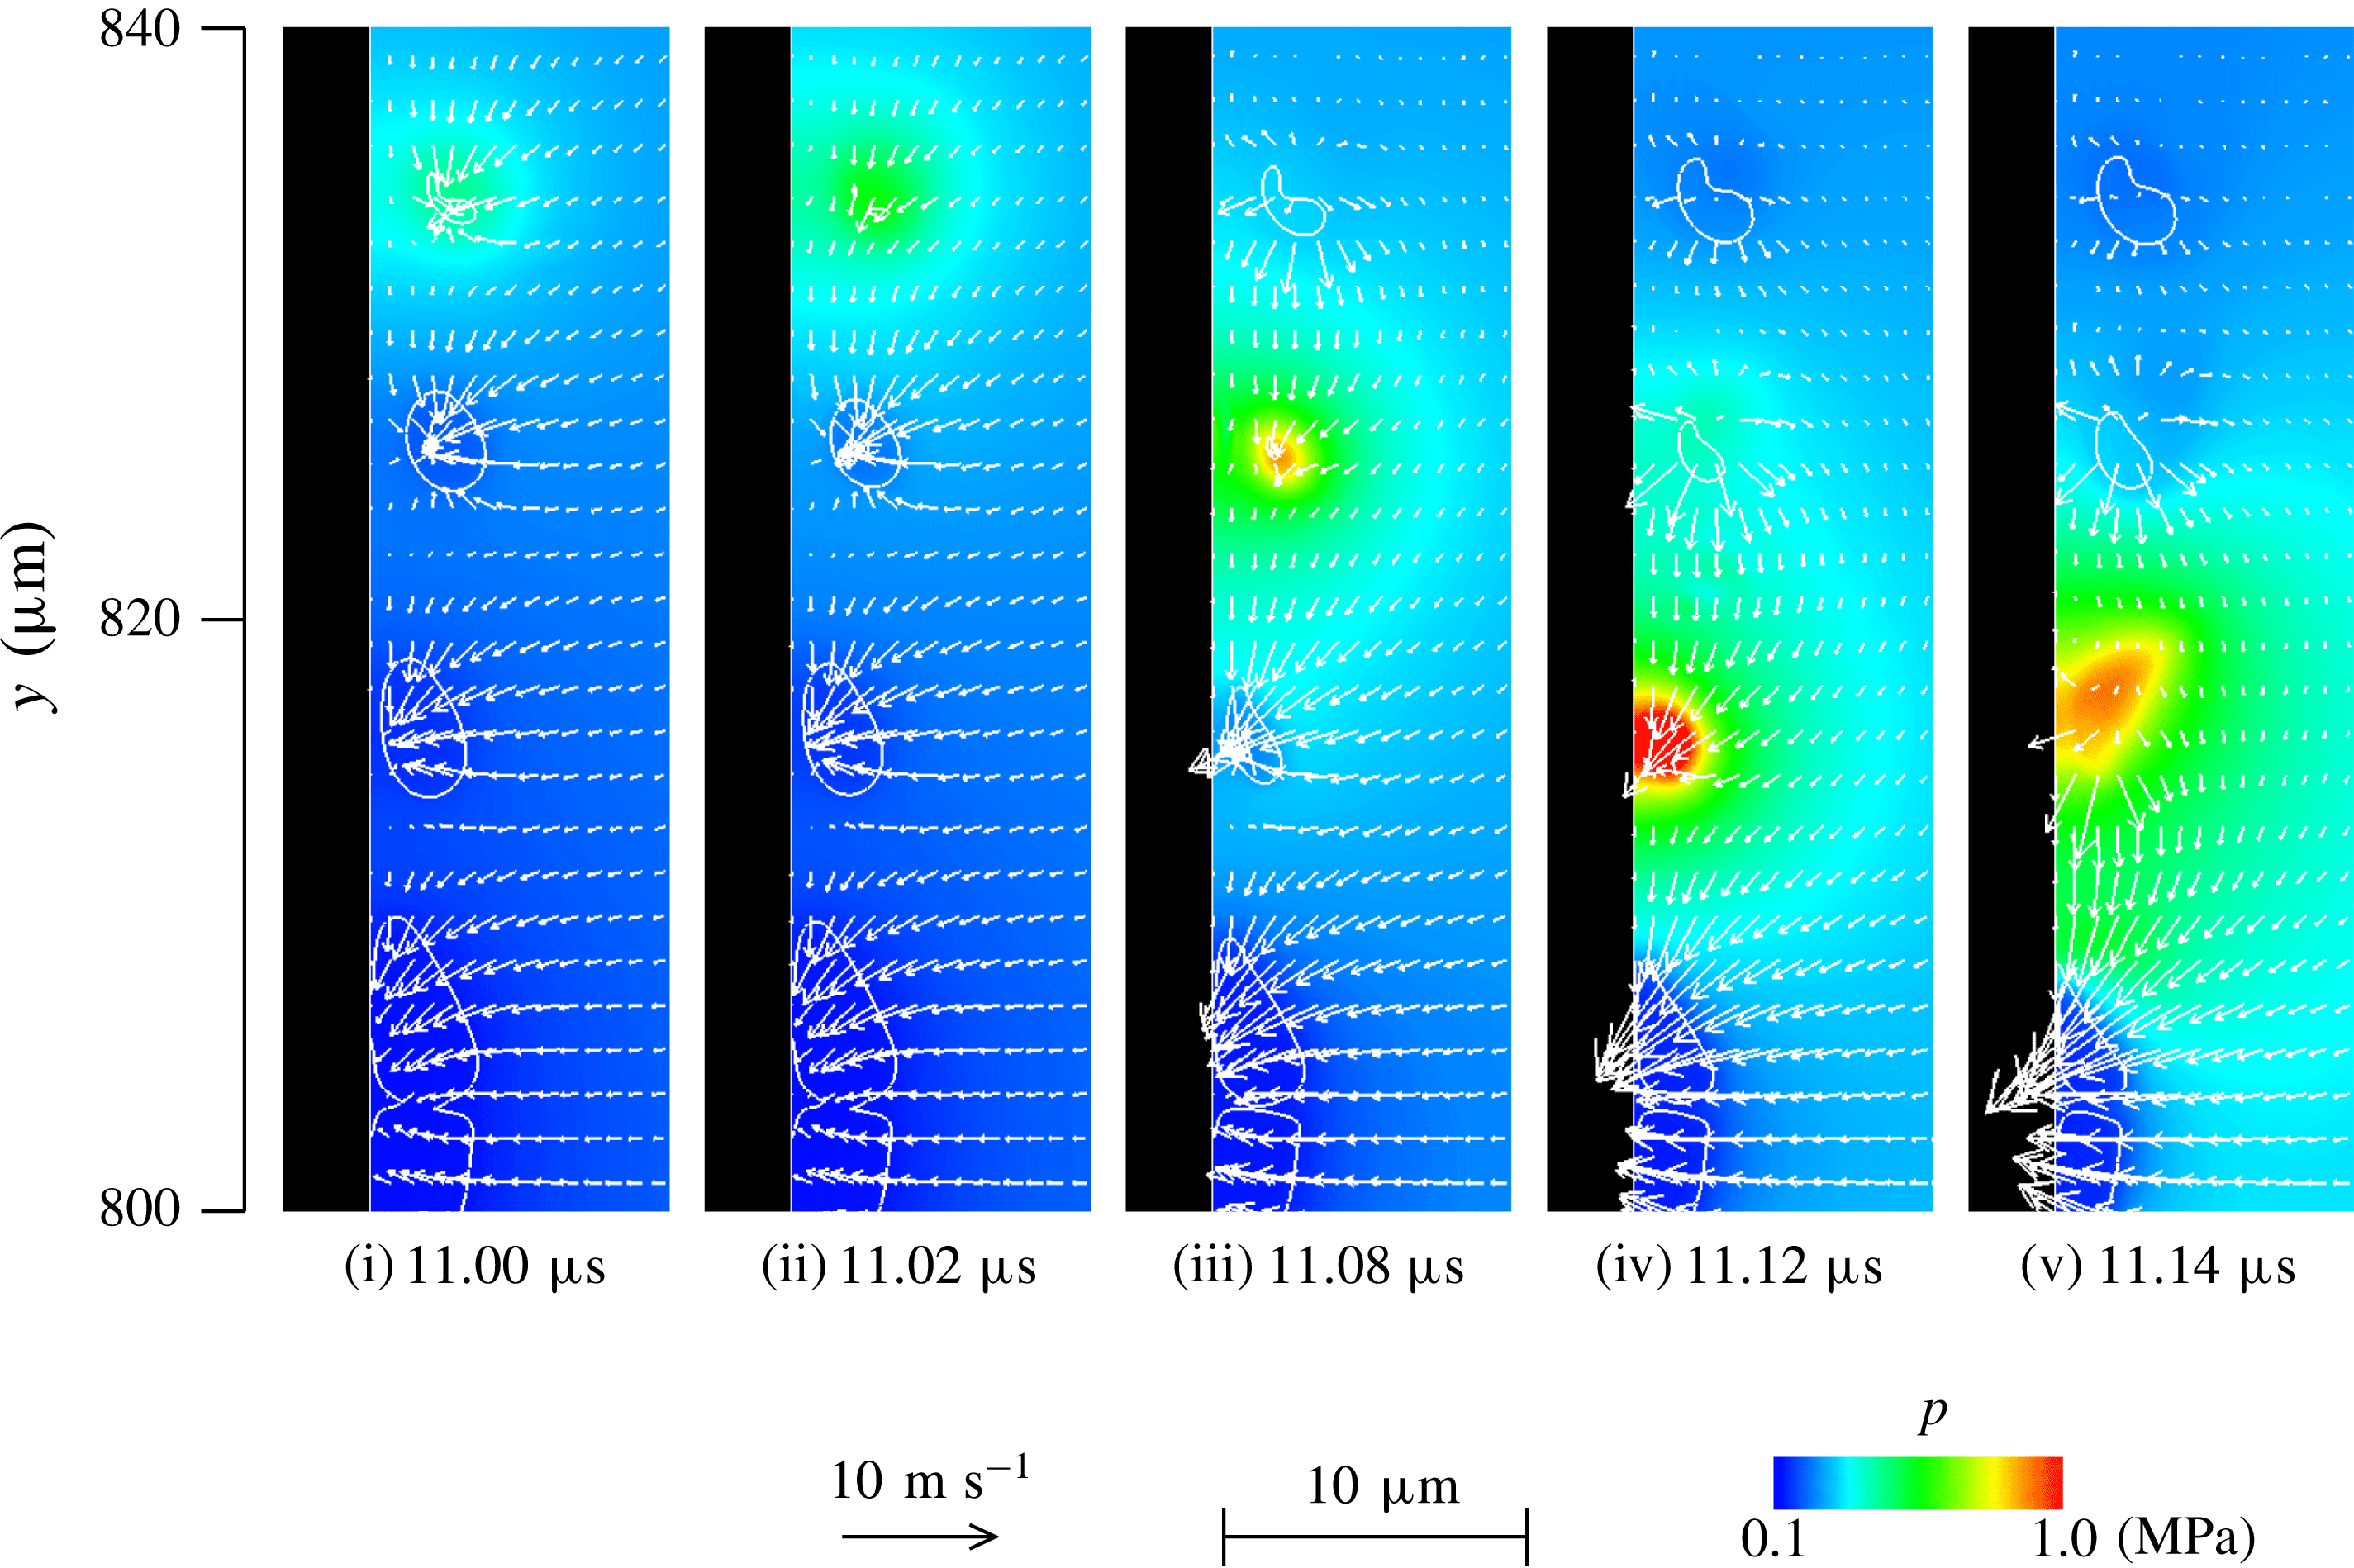
Time evolution of velocity vector, pressure distribution and isoline of the void fraction
 $\unicode[STIX]{x1D6FC}=0.5$
on the
 $z=0$
plane during outer bubble collapse:
 $R_{0}=1.6~\unicode[STIX]{x03BC}\text{m}$
and nine bubbles.
repeated expansion and contraction (figure 13(i),(ii)), and the three bubbles collapse almost simultaneously, inducing the maximum wall pressure (figure 13(iii),(v)). For four bubbles with
 $R_{0}=1.7~\unicode[STIX]{x03BC}\text{m}$
(figure 14), the bubbles approach (figure 14(i),(ii)) similar to three bubbles, and the centre two bubbles make contact faster than the other bubbles (figure 14(ii)) and coalesce (figure 14(iii)). Subsequently, the outer two bubbles collapse (figure 14(iv)), and the central bubble collapses because of the effect of the pressure waves induced by the collapse and rebound of the outer bubbles (figure 14(v),(vi)). Chain collapse is also observed for nine bubbles with
 $R_{0}=1.6~\unicode[STIX]{x03BC}\text{m}$
(figure 15). The centre two bubbles make contact before the outer two bubbles (figure 15(i)), the outer two bubbles collapse earlier than the other bubbles (figure 15(ii)), and the inner bubbles collapse sequentially after the collapse of the outer bubbles (figure 15(iii)–(vi)). The detailed behaviour of the chain collapse is shown in figures 16 and 17. Figure 16 shows the time evolution of the velocity vector, the pressure distribution and the isoline of the void fraction
 $\unicode[STIX]{x1D6FC}=0.5$
on the
 $z=0$
plane for nine bubbles. The area of figure 16 is
 $800~\unicode[STIX]{x03BC}\text{m}\leqslant y\leqslant 840~\unicode[STIX]{x03BC}\text{m}$
, and the lowest bubble in figure 16 is the centre bubble in figure 15. The outermost bubble collapse induces a jet towards the inner bubble (figure 16(i),(ii)). The jet contributes to the collapse of the inner bubble. The inner bubble collapse induces a jet towards the next inner bubble (figure 16(iii),(iv)). The third bubble from the outside collapses near the sidewall and induces a wall pressure of approximately 1 MPa (figure 16(iii)–(v)). Figure 17 and supplementary movie 5 show the time evolution of the pressure distribution and the isoline of void fraction
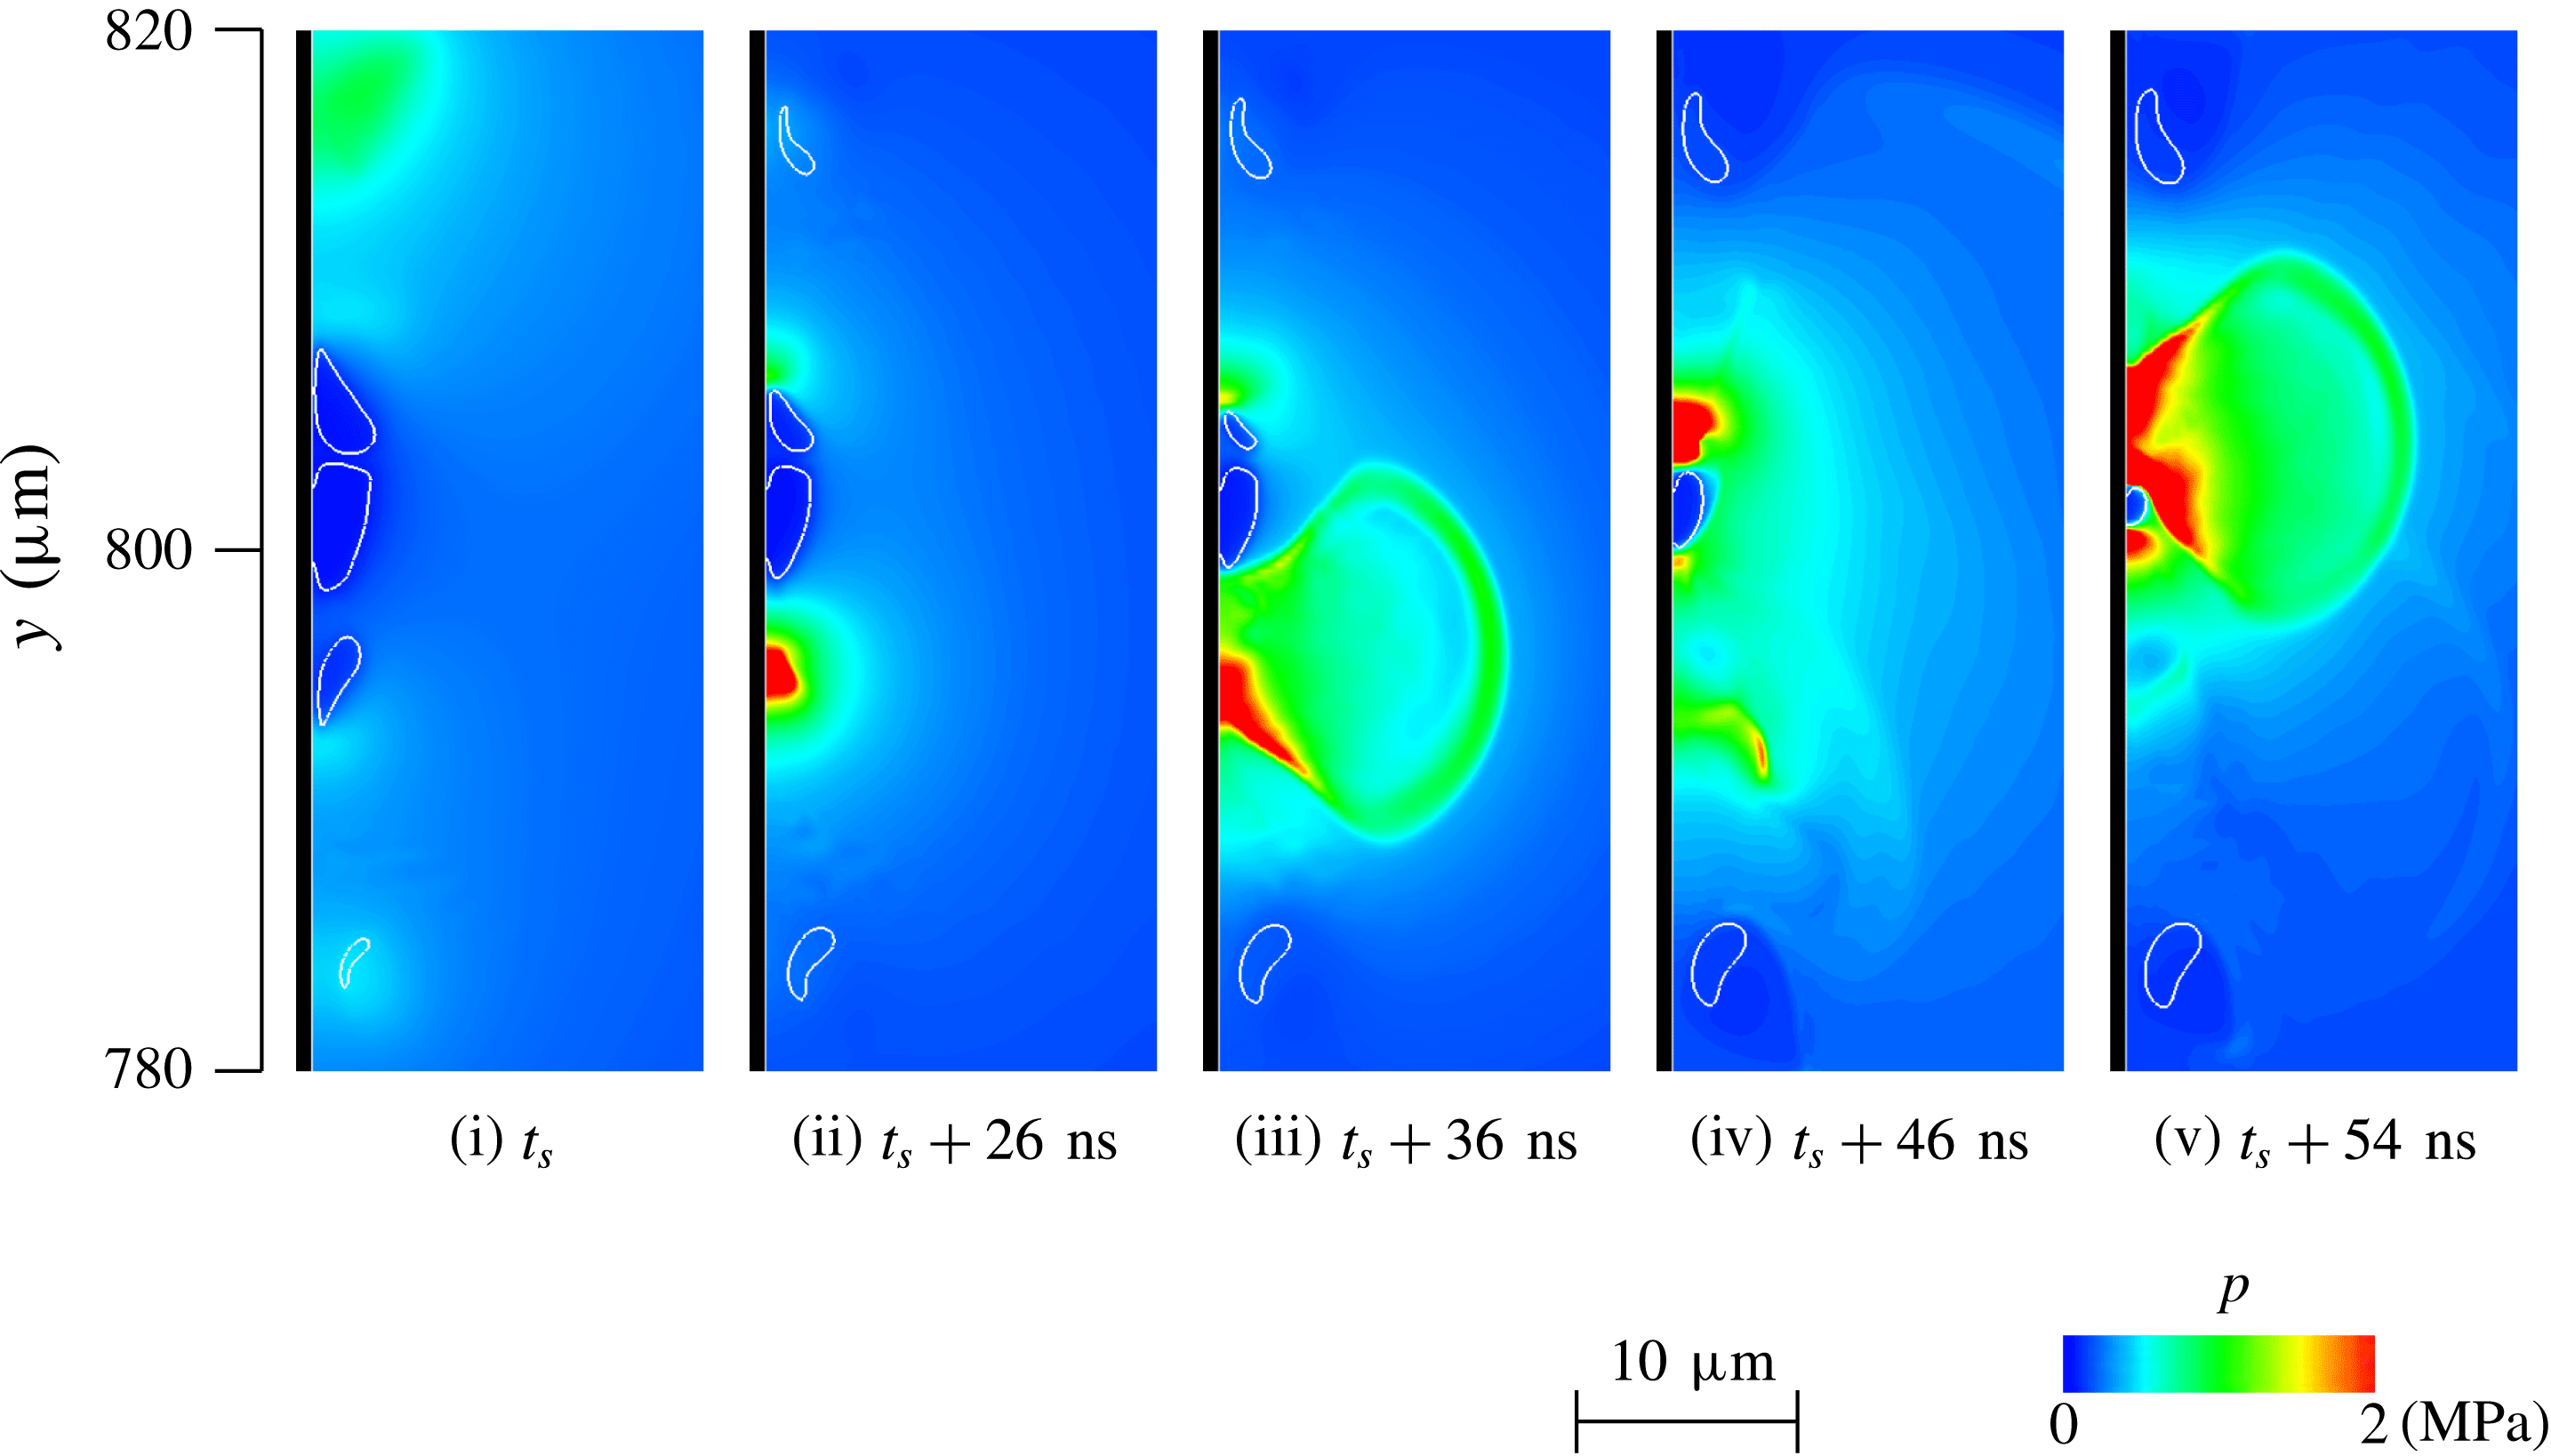
 $\unicode[STIX]{x1D6FC}=0.5$
on the
 $z=0$
plane after the time in figure 16. Time
 $t_{s}$
in figure 17 is
 $11.14~\unicode[STIX]{x03BC}\text{s}$
. The area of figure 17 is
 $780~\unicode[STIX]{x03BC}\text{m}\leqslant y\leqslant 820~\unicode[STIX]{x03BC}\text{m}$
. The bubbles close to the centre bubble collapse (figure 17(ii),(iv)) more violently than the outer bubbles (figure 16). Therefore, the propagation of the pressure wave induced by the bubble collapse and rebound is observed (figure 17(iii),(v)). Propagation of the pressure wave is not observed during the collapse of the outer bubbles (figure 16). The centre bubble collapses with the effects of the pressure waves and induces high pressure (figure 15(vi)). As explained above, the collapse behaviour of three bubbles (figure 13) is different from those for four and nine bubbles (figures 14 and 15). In previous experiments (Dear & Field Reference Dear and Field1988; Swantek & Austin Reference Swantek and Austin2010) and calculations (Lauer et al.
Reference Lauer, Hu, Hickel and Adams2012; Betney et al.
Reference Betney, Tully, Hawker and Ventikos2015), in which the collapse by a shock wave of multiple bubbles distributed in a straight line was studied, the pressure wave from the bubble collapse acted on the neighbouring bubble, which then collapsed more violently than the previous collapsed bubble. Wang & Brennen (Reference Wang and Brennen1999) calculated the collapse of a spherical bubble cloud by using a coupled model of macroscopic conservation equations and a microscopic bubble dynamics equation, and they showed that the inward-propagating bubble collapse results in the high pressure at the cloud centre. In the present study, for four and nine bubbles (figures 14 and 15), when the inner bubbles collapse after the outer bubbles, the pressure waves induced by the outer bubbles act on the inner bubbles, and the bubbles that collapse later induce a higher impulsive pressure (figure 11) as well as in the case of the multiple bubbles affected by the shock wave.
Time evolution of pressure distribution and isoline of void fraction
 $\unicode[STIX]{x1D6FC}=0.5$
on the
 $z=0$
plane during the inner bubble collapse:
 $R_{0}=1.6~\unicode[STIX]{x03BC}\text{m}$
, nine bubbles, and
 $t_{s}=11.14~\unicode[STIX]{x03BC}\text{s}$
.
5.2 Behaviour of two bubbles with different equilibrium radii
In this section, the behaviour of two bubbles with different equilibrium radii is discussed. The initial distance between the bubbles,
 $d$
, is
 $10~\unicode[STIX]{x03BC}\text{m}$
, and the distance between the bubble and the sidewall,
 $h$
, is
 $4R_{0}$
. The
 $y$
coordinate of the centre of the two bubbles is
 $800~\unicode[STIX]{x03BC}\text{m}$
.
Time evolution of pressure distribution on the sidewall and isosurface of the void fraction
 $\unicode[STIX]{x1D6FC}=0.5$
:
 $R_{10}=2.0~\unicode[STIX]{x03BC}\text{m}$
,
 $R_{20}=1.6~\unicode[STIX]{x03BC}\text{m}$
, the rectangular region indicated by white lines is
 $20~\unicode[STIX]{x03BC}\text{m}\times 50~\unicode[STIX]{x03BC}\text{m}\times 20~\unicode[STIX]{x03BC}\text{m}$
, and the first frame is the start time of the bubble calculation.

Time history of bubble radius (
 $R_{10}=2.0~\unicode[STIX]{x03BC}\text{m}$
and
 $R_{20}=1.6~\unicode[STIX]{x03BC}\text{m}$
).

First, the initial bubble radius of the lower
 $y$
component of the initial position,
 $R_{10}$
, is constant at
 $R_{10}=2.0~\unicode[STIX]{x03BC}\text{m}$
, and the initial radius of the upper
 $y$
component of the initial position,
 $R_{20}$
, is
 $1.4~\unicode[STIX]{x03BC}\text{m}\leqslant R_{20}\leqslant 3.0~\unicode[STIX]{x03BC}\text{m}$
. The initial bubble radius is
 $2.0~\unicode[STIX]{x03BC}\text{m}$
where the highest wall pressure occurs for two bubbles of the same equilibrium radius. Figure 18 and supplementary movie 6 show typical bubble behaviour and pressure distribution on the sidewall for different equilibrium radii (
 $R_{10}=2.0~\unicode[STIX]{x03BC}\text{m}$
and
 $R_{20}=1.6~\unicode[STIX]{x03BC}\text{m}$
). The histories of the bubble radii are shown in figure 19. The radius is the equivalent radius calculated by the volume. The oscillation periods of one cycle of the two bubbles are different in the initial stage, as shown in figure 18(i)–(iii) and 19, until
 $t=3~\unicode[STIX]{x03BC}\text{s}$
. The oscillation period of bubble 2 is shorter than that of bubble 1. Bubble 2 reaches a minimum earlier than bubble 1 at the first collapse (figure 18(ii)) and bubble 1 reaches a minimum slightly later (figure 18(iii)). Next, the times when the two bubbles are at a minimum become close, and the difference in the periods becomes small (figure 19) as the two bubbles repeatedly expand and contract. The two bubbles approach and coalesce (figure 18(iv),(v)), similar to the two bubbles with the same equilibrium radius (figure 9). The collapse occurs immediately after the coalescence induces the maximum pressure on the sidewall (figure 18(vi)). The two bubbles make contact at
 $t=8.1~\unicode[STIX]{x03BC}\text{s}$
and coalesce at
 $t=9.2~\unicode[STIX]{x03BC}\text{s}$
. For the same equilibrium radius (
 $R_{10}=R_{20}=2.0~\unicode[STIX]{x03BC}\text{m}$
), the contact and the coalescence of the two bubbles occur at
 $t=5.4$
and
 $6.4~\unicode[STIX]{x03BC}\text{s}$
, respectively, and two bubbles with different equilibrium radii take a longer time to coalesce than those with the same equilibrium radius. This is because the attraction between the bubbles (secondary Bjerknes force) is weak because of the difference in the oscillation period of the two bubbles during the initial stage. The approach and coalescence of the two bubbles is also observed for other bubbles with different equilibrium radii. Figure 20 shows the maximum wall pressure versus the equilibrium radius of bubble 2,
 $R_{20}$
. The results for
 $R_{20}=2.0~\unicode[STIX]{x03BC}\text{m}$
in figure 20 correspond to the results for
 $R_{0}=2.0~\unicode[STIX]{x03BC}\text{m}$
with the same equilibrium radius shown in figure 11. The results for two bubbles with the same equilibrium radius are also shown in figure 20. For a single bubble,
 $p_{w\,max}$
for
 $R_{0}=2.2$
and
 $2.4~\unicode[STIX]{x03BC}\text{m}$
is high, although
 $R_{0}$
with a high
 $p_{w\,max}$
is small for two bubbles of the same equilibrium radius. For two bubbles with different equilibrium radii,
 $p_{w\,max}$
for
 $R_{20}=1.6$
and
 $1.8~\unicode[STIX]{x03BC}\text{m}$
are also higher than
 $p_{w\,max}$
for a single bubble. In particular, for
 $R_{10}=2.0~\unicode[STIX]{x03BC}\text{m}$
and
 $R_{20}=1.8~\unicode[STIX]{x03BC}\text{m}$
,
 $p_{w\,max}$
is 22.7 MPa and higher than the maximum
 $p_{w\,max}$
for two bubbles of the same equilibrium radius, 16.5 MPa (
 $R_{10}=R_{20}=2.0~\unicode[STIX]{x03BC}\text{m}$
). For
 $R_{10}=2.0~\unicode[STIX]{x03BC}\text{m}$
and
 $R_{20}\leqslant 2.0~\unicode[STIX]{x03BC}\text{m}$
, the bubble collapse induces
 $p_{w\,max}$
immediately after the coalescence. Therefore, the two bubbles with different equilibrium radii can induce higher pressure than a single bubble if the two bubbles coalesce.
Maximum wall pressure versus equilibrium bubble radius for bubble 2
 $(R_{10}=2.0~\unicode[STIX]{x03BC}\text{m})$
.

Time history of bubble equivalent radius (bubble 1,
 $R_{10}=2.0~\unicode[STIX]{x03BC}\text{m}$
).

Time history of bubble equivalent radius (bubble 2).

Next, the effect of equilibrium radius on the volume oscillation is discussed. The volume oscillation of bubble 1, which has a constant equilibrium radius of
 $R_{10}=2.0~\unicode[STIX]{x03BC}\text{m}$
, is analysed first. Figure 21 shows the time history of equivalent radius of bubble 1 for
 $R_{10}=2.0~\unicode[STIX]{x03BC}\text{m}$
and various
 $R_{20}$
until the two bubbles make contact. The time history of the radius for a single bubble of
 $R_{0}=2.0~\unicode[STIX]{x03BC}\text{m}$
is also shown in figure 21. The oscillation periods for two bubbles are longer than for a single bubble according to figure 21. Figure 21 also indicates that the oscillation period and maximum radius of bubble 1 increase when
 $R_{20}$
is large for constant
 $R_{10}$
. Figure 22 shows the time histories of the equivalent radii of bubble 2 for two bubbles with
 $R_{10}=2.0~\unicode[STIX]{x03BC}\text{m}$
and
 $R_{20}=1.6~\unicode[STIX]{x03BC}\text{m}$
, and two bubbles with
 $R_{10}=2.0~\unicode[STIX]{x03BC}\text{m}$
and
 $R_{20}=2.6~\unicode[STIX]{x03BC}\text{m}$
. The time history of the radius of a single bubble with an equilibrium radius the same as
 $R_{20}$
is also shown in figure 22. In both cases, the oscillation periods of bubble 2 for two bubbles is longer than those for the single bubble according to figure 22. Consequently, the oscillation period for two bubbles is longer than that for a single bubble regardless of the equilibrium radius. The measurements of Testud-Giovanneschi, Alloncle & Dufresne (Reference Testud-Giovanneschi, Alloncle and Dufresne1990) showed similar characteristics, although they experimented with two laser-generated bubbles. For
 $R_{10}=2.0~\unicode[STIX]{x03BC}\text{m}$
and
 $R_{20}=1.6~\unicode[STIX]{x03BC}\text{m}$
, bubble 2, which has an equilibrium radius smaller than bubble 1, is strongly affected by the other bubble, and the oscillation behaviour is different from that of a single bubble (figure 22(i)). However, bubble 2 does not strongly affect the oscillation behaviour of bubble 1, and the difference between the oscillation behaviour of bubble 1 for two bubbles and that for a single bubble is small (figure 21). This behaviour is also observed for
 $R_{10}=2.0~\unicode[STIX]{x03BC}\text{m}$
and
 $R_{20}=2.6~\unicode[STIX]{x03BC}\text{m}$
(figures 21 and 22(ii)). Therefore, a bubble with an equilibrium radius smaller than that of the other bubble is strongly affected by the other bubble. The calculation result is consistent with previous analytical results (Shima & Fujiwara Reference Shima and Fujiwara1992) for the bubble behaviour of two bubbles caused by a stepwise pressure increase.
Maximum wall pressure versus equilibrium bubble radius for two bubbles (effect of initial distance between bubbles).

5.3 Effect of initial distance between bubbles on multiple-bubble behaviour
Bubble–bubble interactions depend strongly on the initial distance between bubbles (Kodama et al.
Reference Kodama, Takayama and Nagayasu1996; Fong et al.
Reference Fong, Adhikari, Klaseboer and Khoo2009; Chew et al.
Reference Chew, Klaseboer, Ohl and Khoo2011; Lauer et al.
Reference Lauer, Hu, Hickel and Adams2012; Betney et al.
Reference Betney, Tully, Hawker and Ventikos2015; Han et al.
Reference Han, Köhler, Jungnickel, Mettin, Lauterborn and Vogel2015a
). In § 5.1, the initial distance between bubbles is constant (
 $d=10~\unicode[STIX]{x03BC}\text{m}$
). The multiple-bubble behaviour for
 $d=20~\unicode[STIX]{x03BC}\text{m}$
, which is longer than
 $d$
in the previous sections, is analysed to clarify the effect of the initial distance on bubble–bubble interactions and the multiple-bubble dynamics. The calculation conditions except
 $d$
are the same as in § 5.1.
First, the case of two bubbles is discussed. Figure 23 shows the maximum wall pressure versus the equilibrium radius to examine the effect of
 $d$
. For two bubbles with
 $R_{0}=2.0~\unicode[STIX]{x03BC}\text{m}$
, the maximum wall pressure is obtained regardless of
 $d$
(figure 23). For
 $d=10~\unicode[STIX]{x03BC}\text{m}$
,
 $2.0~\unicode[STIX]{x03BC}\text{m}$
is the resonant radius, as stated in § 5.1. For
 $d=20~\unicode[STIX]{x03BC}\text{m}$
, the resonant radius is also
 $2.0~\unicode[STIX]{x03BC}\text{m}$
, and bubbles with
 $R_{0}=2.0~\unicode[STIX]{x03BC}\text{m}$
have a large oscillation amplitude and induce high impulsive pressure. However, for
 $R_{0}=2.0~\unicode[STIX]{x03BC}\text{m}$
, the maximum wall pressure,
 $p_{w\,max}$
, is strongly dependent on
 $d$
. For
 $d=20~\unicode[STIX]{x03BC}\text{m}$
,
 $p_{w\,max}$
of 58.7 MPa, is more than three times higher than that for
 $d=10~\unicode[STIX]{x03BC}\text{m}$
of 16.5 MPa. The result can be explained as follows. Two bubbles of
 $R_{0}=2.0~\unicode[STIX]{x03BC}\text{m}$
resonate with the 1 MHz megasonic wave because the natural frequency of the bubble decreases owing to the bubble–bubble interaction when the two bubbles oscillate separately. Therefore, the bubble collapse induces high impulsive pressure until the two bubbles coalesce or collapse immediately after the coalescence, and the oscillation amplitude and the impulsive pressure are small because the oscillation behaviour of the coalesced bubble is close to that of a single large bubble, as demonstrated by the results for
 $d=10~\unicode[STIX]{x03BC}\text{m}$
(figures 9(b) and 10). Wall pressure also depends on the distance between the collapse position of the bubble and the wall. The pressure wave induced by the collapse and the rebound of a bubble is attenuated inversely proportionally to the propagation distance, and the wall pressure becomes large when a bubble collapses near the wall. Figure 24 and supplementary movie 7 show the time evolution of the bubble behaviour and pressure distribution on the sidewall in the case of two bubbles of
 $d=20~\unicode[STIX]{x03BC}\text{m}$
and
 $R_{0}=2.0~\unicode[STIX]{x03BC}\text{m}$
. Figure 24(vi) shows the time at which the maximum wall pressure occurs. Comparing figures 9(b) and 24, the two bubbles for
 $d=10~\unicode[STIX]{x03BC}\text{m}$
make contact by
 $t=5.70~\unicode[STIX]{x03BC}\text{s}$
(figure 9
b (iii)), whereas those for
 $d=20~\unicode[STIX]{x03BC}\text{m}$
do not make contact, even at
 $t=13.00~\unicode[STIX]{x03BC}\text{s}$
(figure 24(v)) because of the large initial distance between bubbles. The two bubbles gradually approach because of the secondary Bjerknes force between the bubbles (figures 9
b and 24). Furthermore, the bubbles move towards the wall owing to the interaction force between the bubble and the wall when a bubble is close to a wall. For
 $d=10~\unicode[STIX]{x03BC}\text{m}$
, the bubbles are away from the sidewall when the bubbles make contact (figure 9
b (iii)). However, for
 $d=20~\unicode[STIX]{x03BC}\text{m}$
, the bubbles touch the sidewall before they make contact because the time until they make contact with each other for
 $d=20~\unicode[STIX]{x03BC}\text{m}$
is longer than for
 $d=10~\unicode[STIX]{x03BC}\text{m}$
. Consequently, for
 $d=20~\unicode[STIX]{x03BC}\text{m}$
, the bubbles exhibit resonant behaviour nearer the sidewall than for
 $d=10~\unicode[STIX]{x03BC}\text{m}$
and induce a higher wall pressure.
Time evolution of the pressure distribution on the sidewall and isosurface of the void fraction
 $\unicode[STIX]{x1D6FC}=0.5$
:
 $R_{0}=2.0~\unicode[STIX]{x03BC}\text{m}$
,
 $d=20~\unicode[STIX]{x03BC}\text{m}$
, two bubbles, the rectangular region indicated by white lines is
 $20~\unicode[STIX]{x03BC}\text{m}\times 50~\unicode[STIX]{x03BC}\text{m}\times 20~\unicode[STIX]{x03BC}\text{m}$
, and the first frame is the start time of the bubble calculation.

Maximum wall pressure versus equilibrium bubble radius for three bubbles (effect of initial distance between bubbles).

Next, the effect of the initial distance between bubbles for three bubbles is discussed. Figure 25 shows the maximum wall pressure versus equilibrium radius for three bubbles. The equilibrium radius of
 $R_{0}=1.8~\unicode[STIX]{x03BC}\text{m}$
at which the maximum wall pressure reached is independent of the initial distance between the bubbles,
 $d$
, as it is for two bubbles. The effect of
 $d$
on
 $p_{w\,max}$
for three bubbles is also similar to that for two bubbles. For example, for
 $R_{0}=1.8~\unicode[STIX]{x03BC}\text{m}$
,
 $p_{w\,max}$
of 191 MPa for a large initial distance between bubbles of
 $d=20~\unicode[STIX]{x03BC}\text{m}$
is higher than 14.6 MPa for a short initial distance of
 $d=10~\unicode[STIX]{x03BC}\text{m}$
. Figure 26 and supplementary movie 8 show the time evolution of the bubble behaviour and pressure distribution on the sidewall for three bubbles with
 $R_{0}=1.8~\unicode[STIX]{x03BC}\text{m}$
and
 $d=20~\unicode[STIX]{x03BC}\text{m}$
. Even for three bubbles, the bubbles with
 $d=20~\unicode[STIX]{x03BC}\text{m}$
do not coalesce during the calculation time as well as for two bubbles (figure 24), although three bubbles with
 $d=10~\unicode[STIX]{x03BC}\text{m}$
make contact with each other at
 $t=7.6~\unicode[STIX]{x03BC}\text{s}$
(figure 13). At
 $t=26~\unicode[STIX]{x03BC}\text{s}$
the distances between bubbles 1 and 2, and between bubbles 2 and 3 are 15.4 and
 $13.3~\unicode[STIX]{x03BC}\text{m}$
, respectively. The movement due to the secondary Bjerknes force is small, and the bubbles at
 $t=26~\unicode[STIX]{x03BC}\text{s}$
are still seven times the equilibrium radius apart, although the distance is shorter than the initial distance between bubbles of
 $20~\unicode[STIX]{x03BC}\text{m}$
. Figure 27 shows the time history of the maximum wall pressure for three bubbles at
 $d=20~\unicode[STIX]{x03BC}\text{m}$
and
 $R_{0}=1.8~\unicode[STIX]{x03BC}\text{m}$
. Figure 27 shows that the peak of the maximum wall pressure increases as the volume oscillation continues. The time during which the peak pressure increases for
 $d=20~\unicode[STIX]{x03BC}\text{m}$
(figure 27) is longer than that for
 $d=10~\unicode[STIX]{x03BC}\text{m}$
(figure 10). This is because, for
 $d=20~\unicode[STIX]{x03BC}\text{m}$
, the resonant bubbles of
 $R_{0}=1.8~\unicode[STIX]{x03BC}\text{m}$
in the 1 MHz megasonic wave oscillate without coalescing. The collapse when the peak wall pressure increases is shown in figure 26. Bubbles 1 and 3 collapse before bubble 2, and bubble 2 collapses after it is affected by the pressure wave induced by the collapse of bubbles 1 and 3 during the last stage of the collapse (figure 26(iv)–(vi)). This chain collapse is similar to the collapse behaviour in figures 14 and 15.
Time evolution of the pressure distribution on the sidewall and isosurface of the void fraction
 $\unicode[STIX]{x1D6FC}=0.5$
:
 $R_{0}=1.8~\unicode[STIX]{x03BC}\text{m}$
,
 $d=20~\unicode[STIX]{x03BC}\text{m}$
, three bubbles, the rectangular region indicated by white lines is
 $20~\unicode[STIX]{x03BC}\text{m}\times 50~\unicode[STIX]{x03BC}\text{m}\times 20~\unicode[STIX]{x03BC}\text{m}$
, and the first frame is the start time of the bubble calculation.

Time history of wall pressure (
 $d=20~\unicode[STIX]{x03BC}\text{m}$
,
 $R_{0}=1.8~\unicode[STIX]{x03BC}\text{m}$
, three bubbles).

Tomita et al. (Reference Tomita, Shima and Ohno1984) concluded that bubble–bubble interaction is negligible when the initial distance between bubbles is more than four times the initial bubble radius, and Kodama et al. (Reference Kodama, Takayama and Nagayasu1996) reported that the interaction is negligible at 12 times the radius. In the previous simulations of the multiple-bubble collapse induced by a shock wave (Lauer et al. Reference Lauer, Hu, Hickel and Adams2012; Betney et al. Reference Betney, Tully, Hawker and Ventikos2015), the shorter initial distance between bubbles results in a larger collapse pressure. Therefore, when a bubble collapses only once, the longer initial distance between bubbles results in a weak interaction force. However, for oscillating bubbles showing repeated collapses and rebounds in a standing wave, as in the present study, the bubble–bubble interaction remains. Multiple bubbles can induce higher wall pressure than a single bubble, depending on the interaction between the bubble and wall, translational motion due to the secondary Bjerknes force, and resonance condition, even if the initial distance between bubbles is large.
5.4 Effect of configuration of bubbles on multiple-bubble behaviour
Calculations for concentrically distributed bubbles (figure 2
b) are performed. The effect of the configuration of bubbles on multiple-bubble behaviour is discussed by comparing the results for bubbles in a straight line (figure 2
a) and those arranged concentrically. In the concentric arrangement, one bubble is placed in the centre, and the other bubbles are concentrically distributed, separated by
 $d=10~\unicode[STIX]{x03BC}\text{m}$
from the central bubble. The distances between the bubbles and sidewall is
 $h=4R_{0}$
. The initial position of the central bubble (
 $y,z$
) is (
 $800~\unicode[STIX]{x03BC}\text{m},~0$
). Bubble calculations start at
 $t=2.12~\unicode[STIX]{x03BC}\text{s}$
, as in the previous calculations. The configuration for three bubbles is the same as the straight configuration.
Maximum wall pressure versus equilibrium bubble radius (circular distribution).

Time evolution of the pressure distribution on the sidewall and isosurface of the void fraction
 $\unicode[STIX]{x1D6FC}=0.5$
: circular distribution, the rectangular region indicated by white lines is
 $20~\unicode[STIX]{x03BC}\text{m}\times 50~\unicode[STIX]{x03BC}\text{m}\times 30~\unicode[STIX]{x03BC}\text{m}$
, and the first frame is the start time of the bubble calculation.

Figure 28 shows the maximum wall pressure,
 $p_{w\,max}$
, versus the equilibrium radius,
 $R_{0}$
, for the concentric distribution. The
 $R_{0}$
value for the maximum
 $p_{w\,max}$
,
 $R_{p\,max}$
, decreases as the bubble number increases as well as the straight distribution (figure 11). The
 $R_{p\,max}$
value for nine bubbles is the same as for seven bubbles,
 $1.4~\unicode[STIX]{x03BC}\text{m}$
, and
 $R_{p\,max}$
approaches a certain value as the bubble number increases. Comparing the concentric and straight distributions for the same bubble number of five,
 $R_{p\,max}$
is
 $1.5~\unicode[STIX]{x03BC}\text{m}$
in the concentric distribution (figure 28), which is slightly smaller than that in the straight distribution,
 $R_{p\,max}$
 $=1.7~\unicode[STIX]{x03BC}\text{m}$
(figure 11). Figure 29 and supplementary movies 9 and 10 show the time evolution of the bubble behaviour and pressure distribution on the sidewall for concentric distributions of five bubbles with
 $R_{0}=1.6~\unicode[STIX]{x03BC}\text{m}$
and seven bubbles with
 $R_{0}=1.4~\unicode[STIX]{x03BC}\text{m}$
. For five bubbles of
 $R_{0}=1.6~\unicode[STIX]{x03BC}\text{m}$
, the five bubbles gather around the central bubble due to the secondary Bjerknes force (figure 29
a (i),(ii)). In the last stage of the collapses, the upper and lower two bubbles, which are parallel to the
 $y$
axis with the central bubble, collapse first (figure 29
a (iv)), and then the central bubble collapses inducing maximum wall pressure (figure 29
a (v)). Subsequently, the two bubbles that are parallel to the
 $z$
axis collapse under the pressure wave induced by the central bubble (figure 29
a (vi)). The collapse of the central bubble induces a maximum wall pressure of 52 MPa. However, the two bubbles that collapse after the central bubble also induce high impulsive pressure (figure 29
a (vi)) of approximately 4.5 MPa. Next, the results for seven bubbles with
 $R_{0}=1.4~\unicode[STIX]{x03BC}\text{m}$
(figure 29
b (i)–(xii)) are discussed. For seven bubbles, the oscillating bubbles also gather around the central bubble (figure 29
b (i)–(vii)). In the time between figure 29(b)(ii) and (v), the bubbles are some distance apart, and the seven bubbles collapse almost simultaneously, inducing high pressure on the sidewall (figure 29
b (iv),(v)). In the time between figure 29(b)(vii) and (xii), the surrounding bubbles get much closer to the central bubble (figure 29
b (vi),(vii)) and the collapse of multiple bubbles starts. The upper three bubbles in figure 29(b (i)–(xii)) at a higher
 $y$
coordinate than the central bubble collapse nearer to the central bubble than the lower three bubbles (figure 29
b (vii)). The lower three bubbles collapse first (figure 29
b (ix)), the upper three bubbles collapse (figure 29
b (x)) and finally the central bubble collapses (figure 29
b (xii)). The chain collapse induces the violent collapse of the central bubble with a high wall pressure of 275 MPa.
Time history of wall pressure (circular distribution,
 $R_{0}=1.6~\unicode[STIX]{x03BC}\text{m}$
and nine bubbles).

Time evolution of pressure distribution and isoline of the void fraction
 $\unicode[STIX]{x1D6FC}=0.5$
on the
 $z=0$
plane (circular distribution,
 $R_{0}=1.6~\unicode[STIX]{x03BC}\text{m}$
, nine bubbles and
 $t_{s}=6.32~\unicode[STIX]{x03BC}\text{s}$
).

Comparing the results of the five bubbles in figures 11 and 28,
 $R_{p\,max}$
of
 $1.5~\unicode[STIX]{x03BC}\text{m}$
for a concentric distribution is smaller than that for the straight distribution of
 $1.7~\unicode[STIX]{x03BC}\text{m}$
for the same bubble numbers. For the straight distribution,
 $R_{p\,max}$
is
 $1.6~\unicode[STIX]{x03BC}\text{m}$
, even for a bubble number of nine. As the bubble number increases, the natural frequency of the bubbles decreases, and bubbles with a smaller equilibrium radius resonate with the megasonic wave (§ 5.1). These results indicate that the effect of the bubble–bubble interaction on the bubble behaviour depends on the configuration of bubbles, and the bubble–bubble interaction in the concentric distribution contributes to the larger decrease in the natural frequency of the bubbles compared with the straight distribution. The collapse behaviours of the bubbles are also dependent on the configuration of bubbles. The time history of the maximum wall pressure for nine bubbles at
 $R_{0}=1.6~\unicode[STIX]{x03BC}\text{m}$
of the concentric distribution in figure 30 shows that two comparable wall pressures occur during one collapse. Figure 31 and supplementary
Evaporation rate distribution and isoline of the void fraction
 $\unicode[STIX]{x1D6FC}=0.001$
on the
 $z=0$
plane in the low-pressure region (circular distribution,
 $R_{0}=1.6~\unicode[STIX]{x03BC}\text{m}$
and nine bubbles).

movie 11 show the time evolution of the pressure distribution and the isoline of the void fraction
 $\unicode[STIX]{x1D6FC}=0.5$
. The collapse and rebound of the central bubble induces a pressure wave (figure 31(i)), and the pressure wave propagates to the surrounding region (figure 31(ii)). The reflection of the wave at the sidewall and the propagation of the reflected wave are also observed (figure 31(ii),(iii)). After that, the pressures of the regions near the sidewall and the opposite side decrease (figure 31(iv),(v)). Expansion waves are produced at the interfaces of bubbles when the pressure waves reach the interfaces owing to the difference between the acoustic impedances of the gas and liquid phases. The expansion waves reduce the pressure in these regions (figure 31(v)). In the concentric distribution, expansion waves are generated at the interfaces of each bubble around the centre bubble, and the superposition of the waves results in the very low-pressure region. Figure 32 shows the distribution of evaporation rate and the isoline of void fraction
 $\unicode[STIX]{x1D6FC}=0.001$
on the
 $z=0$
plane at the time in figure 31(v). The evaporation rate becomes high in the low-pressure region induced by the expansion waves, and a small amount of gas (small bubbles) is generated. The collapses of the small bubbles induce the other peak pressure in figure 30. The generation of small bubbles by the expansion waves has also been shown in previous studies (Brunton & Camus Reference Brunton and Camus1970; Li et al.
Reference Li, Xiong, Chin, Ando, Zhang and Liu2015). Small bubbles are produced by expansion waves generated by many surrounding bubbles (figure 32). Therefore, small bubbles are not generated in the straight distribution. The time histories of the bubble equivalent radii of each bubbles for a straight distribution of nine bubbles with
 $R_{0}=1.6~\unicode[STIX]{x03BC}\text{m}$
and for a concentric distribution of nine bubbles with
 $R_{0}=1.4~\unicode[STIX]{x03BC}\text{m}$
are shown in figures 33 and 34, respectively. The times are the collapse stage inducing the maximum wall pressure for each of the conditions. Figure 33 shows the radii of the bubbles that have
 $y$
components of their positions that are lower than the centre bubble, bubble 6. In the straight distribution, the bubbles collapse from the outside bubble to the inside bubble (figure 33). The inside bubble has the larger maximum radius and the smaller minimum radius. In the concentric distribution, the bubbles except for the centre bubble have similar radius time histories (figure 34). The surrounding bubbles shrink before the centre bubble (
 $t=8.16~\unicode[STIX]{x03BC}\text{s}$
and
 $t=9.22~\unicode[STIX]{x03BC}\text{s}$
), and the centre bubble violently collapses under the influence of the surrounding bubbles (
 $t=8.19~\unicode[STIX]{x03BC}\text{s}$
and
 $t=9.25~\unicode[STIX]{x03BC}\text{s}$
). The surrounding bubbles shrink again due to the pressure wave induced by the centre bubble collapse (
 $t=8.21~\unicode[STIX]{x03BC}\text{s}$
and
 $t=9.28~\unicode[STIX]{x03BC}\text{s}$
). The rebound of the centre bubble is rapid but the growth is suppressed immediately (
 $t=8.4~\unicode[STIX]{x03BC}\text{s}$
). The suppression is caused by the pressure wave induced by the collapse of small bubbles generated by expansion waves, as stated above. However, the small bubbles are generated not near the sidewall (figure 32) but in the low-pressure region of the opposite side of the sidewall (figure 31(v)). The maximum wall pressure is induced by the collapse of the centre bubble in both configurations. In the straight distribution, all bubbles indirectly affect the collapse of the centre bubble through the chain collapse (figure 33). In the concentric distribution, the bubbles around the centre bubble collapse almost at the same time (figure 34), and all bubbles affect the centre bubble more directly than in the straight distribution. The direct effect on the centre bubble results in the larger decrease in the natural frequency of the bubbles with the increase in the bubble number in the concentric distribution.
Time history of bubble equivalent radius (straight distribution,
 $R_{0}=1.6~\unicode[STIX]{x03BC}\text{m}$
and nine bubbles).

Time history of bubble equivalent radius (circular distribution,
 $R_{0}=1.4~\unicode[STIX]{x03BC}\text{m}$
and nine bubbles).

6 Conclusion
Multiple-bubble behaviour in a megasonic field was numerically analysed to clarify the effect of bubble–bubble interactions on the bubble behaviour and the wall pressures induced by bubble collapse. We used a compressible, locally homogeneous model of a gas–liquid two-phase medium. The effect of the bubble equilibrium radius, bubble configuration and distance between bubbles were discussed.
For bubbles with the same equilibrium radius distributed in a straight line, the natural frequency of the bubbles decreases and bubbles with a smaller equilibrium radius can resonate with the megasonic wave as the number of bubbles increases. Therefore, the equilibrium radius of the bubbles showing maximum wall pressure decreases with the increase in the number of bubbles. The chain collapse of multiple bubbles can induce high wall pressure when the number of bubble exceeds four.
The behaviour of two bubbles with different equilibrium radii is numerically analysed. The oscillation period of two bubbles is longer than that of a single bubble. For bubbles with different equilibrium radii, the smaller bubble of the pair is more strongly affected by the larger bubble. Two bubbles with different equilibrium radii can induce higher pressure than a single bubble if the two bubbles coalesce because of the attraction between the bubbles.
The effect of the initial distance between bubbles for two and three bubbles is analysed to clarify the effect of the initial distance on bubble–bubble interactions and multiple-bubble behaviour. A large initial distance between bubbles results in a large movement towards the sidewall until the bubbles coalesce, when they resonate with the megasonic wave. Therefore, if the initial distance between bubbles is large, the bubbles resonate nearer the sidewall, inducing the high wall pressure.
Calculations for concentrically distributed bubbles are performed, and the effect of the configuration of the bubbles on multiple-bubble behaviour is discussed. For the concentric distribution, the natural frequency of the bubbles decreases as the number of bubbles increases, similar to the straight distribution. The bubble–bubble interactions in the concentric distributions contribute to the larger decrease in the natural frequency of the bubble compared with the straight distribution. The collapse behaviour of bubbles is also dependent on the bubble configuration. The bubbles in the straight distribution undergo chain collapse from the outside bubble to the inside bubble. In the concentric distribution, the bubbles except for the centre bubble collapse almost simultaneously, and the centre bubble collapses after the surrounding bubbles. Furthermore, the pressure wave induced by the collapse and the rebound of the centre bubble reflects at the interfaces of the surrounding bubbles, and expansion waves are produced. The superposition of the expansion waves can induce a low-pressure region and generates small bubbles.
Acknowledgements
Part of this work was supported by JSPS Grant-in-Aid for Young Scientists B (26820038). The numerical simulations were performed by using the SGI Altix UV1000 and UV2000 scalar parallel computers at the Institute of Fluid Science, Tohoku University. Part of the numerical results were obtained using supercomputing resources at the Cyberscience Center, Tohoku University.
Supplementary movies
Supplementary movies are available at https://doi.org/10.1017/jfm.2017.154.



